
 Open Access Article
 This Open Access Article is licensed under a Creative Commons Attribution-Non Commercial 3.0 Unported Licence
Ultrafast demagnetization in a ferrimagnet under electromagnetic field funneling†
Kshiti
Mishra
a,
Agne
Ciuciulkaite
 b,
Mario
Zapata-Herrera‡
c,
Paolo
Vavassori
cd,
Vassilios
Kapaklis
b,
Theo
Rasing
a,
Alexandre
Dmitriev
*e,
Alexey
Kimel
a and
Andrei
Kirilyuk
*af
b,
Mario
Zapata-Herrera‡
c,
Paolo
Vavassori
cd,
Vassilios
Kapaklis
b,
Theo
Rasing
a,
Alexandre
Dmitriev
*e,
Alexey
Kimel
a and
Andrei
Kirilyuk
*af
aRadboud University, Institute for Molecules and Materials, Heyendaalseweg 135, 6525 AJ Nijmegen, The Netherlands
bDepartment of Physics and Astronomy, Uppsala University, Box 516, SE-75120 Uppsala, Sweden
cCIC nanoGUNE BRTA, E-20018 Donostia-San Sebastian, Spain
dIKERBASQUE, Basque Foundation for Science, E-48009, Bilbao, Spain
eDepartment of Physics, University of Gothenburg, SE-412 96 Göteborg, Sweden. E-mail: alexd@physics.gu.se
fFELIX Laboratory, Radboud University, Toernooiveld 7, 6525 ED Nijmegen, The Netherlands. E-mail: andrei.kirilyuk@ru.nl
First published on 1st October 2021
Abstract
The quest to improve the density, speed and energy efficiency of magnetic memory storage has led to the exploration of new ways of optically manipulating magnetism at the ultrafast time scale, in particular in ferrimagnetic alloys. While all-optical magnetization switching is well-established on the femtosecond timescale, lateral nanoscale confinement and thus the potential significant reduction of the size of the magnetic element remains an outstanding challenge. Here we employ resonant electromagnetic energy funneling through plasmon nanoantennas to influence the demagnetization dynamics of a ferrimagnetic TbCo alloy thin film. We demonstrate how Ag nanoring-shaped antennas under resonant optical femtosecond pumping reduce the overall demagnetization in the underlying films up to three times compared to non-resonant illumination. We attribute such a substantial reduction to the nanoscale confinement of the demagnetization process. This is qualitatively supported by the electromagnetic simulations that strongly evidence the resonant optical energy-funneling to the nanoscale from the nanoantennas into the ferrimagnetic film. This observation is an important step for reaching deterministic ultrafast all-optical magnetization switching at the nanoscale in such systems, opening a route to develop nanoscale ultrafast magneto-optics.
Introduction
One of the most demanding current technological challenges is the storage and processing of the exponentially increasing amount of information. The quest to improve the density, speed and energy efficiency of magnetic memory storage has led to the exploration of new ways of manipulating magnetism at the ultrafast timescale. A particularly promising possibility was opened up by the discovery of All-Optical Switching (AOS) of magnetization1 wherein the magnetization of the ferrimagnetic Rare Earth – Transition Metal (RE-TM) alloy GdFeCo was reversed using ultrashort laser pulses in the absence of an external magnetic field. Following this first observation, AOS has also been found to occur in a variety of ferri- and ferromagnetic materials.2–5 While the performance of AOS in terms of writing speed6 and energy efficiency7 compares favorably to other techniques, in terms of the smallest attainable bit size, AOS is limited to the micrometer scale owing to the diffraction limit of light. Attempts to downscale the bit size reached down to a few hundred nanometres by tighter focusing of the laser beam using a microscope objective8 and by nanopatterning.9–11 An important move towards the nanoscale bit size was achieved by employing gold dimer-nanobar nanoantennas on a TbFeCo alloy thin film, yielding an AOS-switched spot size of 50 nm by exploiting localized plasmons.12 This suggests that the use of nanoplasmon optics could make AOS technologically viable by making the attainable bit size comparable to that, for example, of heat-assisted magnetic recording.13 The so far revealed mechanism behind AOS implies that it proceeds via fast and efficient demagnetization.6,14–16 Therefore, a crucial step towards achieving nanoplasmonic AOS is to follow the temporal evolution of the magnetization in response to plasmon nanoantenna-assisted resonant laser excitation. While recent studies on time-resolved dynamics of TMOKE in Ni magnetoplasmonic crystals17 and coherent spin dynamics in TmFeO3![[thin space (1/6-em)]](https://www.rsc.org/images/entities/char_2009.gif) 18 have revealed significant plasmon-induced enhancement of the ultrafast response in these systems, similar time-resolved studies are still lacking for magnetoplasmonic systems pertinent to AOS materials and are necessary in order to better gauge the potential and feasibility of plasmon-assisted AOS.
18 have revealed significant plasmon-induced enhancement of the ultrafast response in these systems, similar time-resolved studies are still lacking for magnetoplasmonic systems pertinent to AOS materials and are necessary in order to better gauge the potential and feasibility of plasmon-assisted AOS.
Here we uncover the demagnetization dynamics in a ferrimagnetic TbCo alloy nanofilm assisted by nanoring-shaped Ag plasmon antennas. Plasmon nanorings are a widely studied system, displaying two so-called bonding and anti-bonding optical resonances: the anti-bonding (low wavelength) dipolar mode concentrates the electromagnetic near-field at the rims of the nanoring structure,19 whereas the bonding (high wavelength) mode does so mostly in the center of the nanoring19,20 (as seen in the calculated intensity maps in Fig. S1(a) and (d)†), an effect that we hereafter refer to as ‘electric field funneling’. Such funneling inside the nanoring cavity and the resultant electric field enhancement is much higher for the case of the bonding mode as compared to the anti-bonding mode (see the cross-sectional maps of the electric near-field in the Tb18Co82 film in ESI Fig. S1†). The bonding mode thus has a decisive advantage for the present study compared to the anti-bonding one, in addition to combining a lower required energy with a smaller mode volume (see the discussion in section S1, ESI†). We compare the magnetization and transmission dynamics under resonant vs. off-resonant ultrafast laser pumping. In general, we find qualitatively similar sub-picosecond demagnetization for both resonant and off-resonant pumping. However, the degree of demagnetization is observed to be substantially smaller for resonant pumping compared to off-resonant pumping. We attribute this difference to the strong electromagnetic near-field confinement and scattered-field funneling by the nanoring antenna bonding mode. Upon excitation of this mode, the illuminating laser fluence is predominantly channeled to, and enhanced within, extremely small nanoscopic areas lying in the nanorings’ near-field. However, our μm-sized probe detects an averaged response which is dominated by signal from the much larger sample areas lying outside the nanorings, that receive reduced fluence and consequently experience smaller demagnetization, leading to the observed reduction of the net response. Thus, while an all-optical pump–probe scheme cannot directly yield a complete picture of the nanoscale magnetization dynamics in the near-field, the effects of resonant excitation are clearly detectable. Importantly, through electromagnetic simulations we get further evidence of the funneling of the incident laser fluence into the free space inside the ring and the substrate underneath the rings’ cavity, supporting the experimental observations.
Experimental details
We investigated a Tb26Co74 amorphous alloy thin film grown on a glass substrate, covered with an alumina capping layer with nanofabricated plasmon Ag nanoring antennas on top. The 20 nm thin TbCo film was prepared by DC magnetron sputtering from elemental Tb and Co targets. To ensure uniform film deposition at room temperature, a rotating sample holder was used. The deposition was performed under ultrahigh vacuum, with a base pressure of 10−10 Torr and an Ar+ sputtering gas pressure of 2–3 mTorr. The TbCo film was in situ coated with a 4 nm Al2O3 capping layer to avoid oxidation. More details of the sputter deposition process can be found in ref. 21 and 22. Ag nanorings of inner diameter 20 nm, outer diameter 70 nm and height 10 nm were fabricated on the capped TbCo film by hole-mask colloidal lithography (HCL).23Fig. 1(b) shows the structural details of the sample. The fabricated sample was imaged using scanning electron microscopy (SEM). To characterize the resonance modes for the sample, the optical transmission spectrum was measured in the wavelength range 350–1050 nm using a commercial Agilent Cary 60 UV-vis spectrophotometer. Static magneto-optical characterization was done using polar Faraday geometry at 800 nm.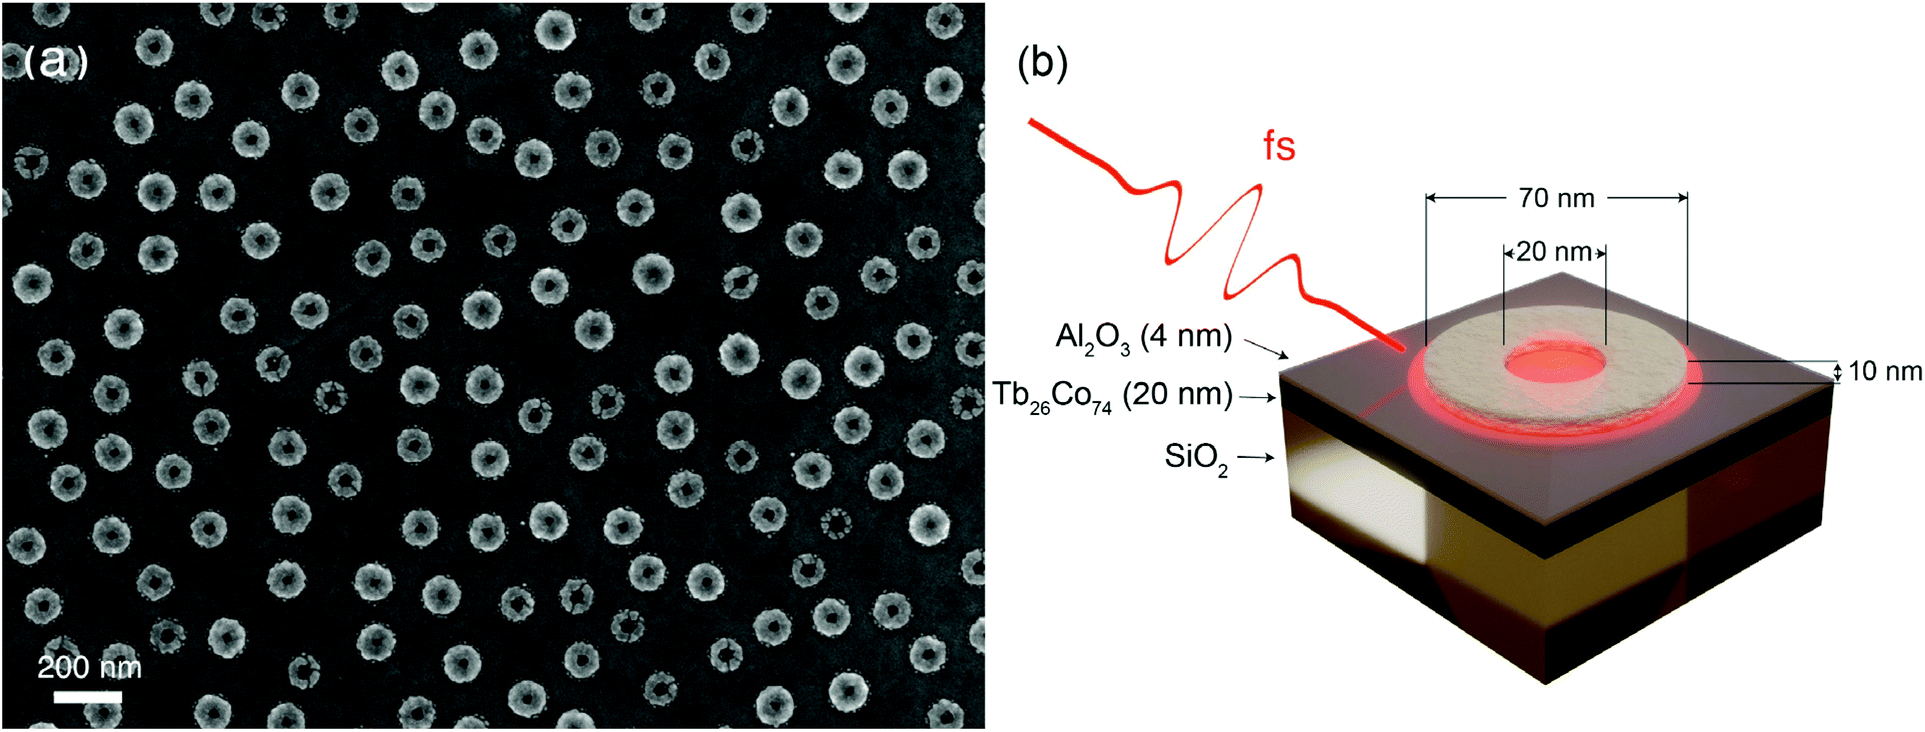 | ||
| Fig. 1 (a) SEM overview of the Ag nanoring antenna macroscopic assembly on a Tb26Co74 film; (b) a schematic of the nanoring + ferrimagnetic film system (indicating the thicknesses/dimensions of the elements) and the experimental scheme of exciting the system using an ultrashort laser pulse (antenna near-fields are shown schematically in red). | ||
Magnetization dynamics was measured using an all-optical two-colour pump–probe setup. The 800 nm probe was derived from a Ti:sapphire amplified laser system with a 1 kHz repetition rate, was focused to a spot size of 460 μm and had a pulse width of 100 fs at the sample position. The pump pulse was derived from the same laser by tuning the wavelength through optical parametric amplification. The off-resonance pump wavelength was chosen to be 650 nm, and the spot size at the sample was 510 μm. The resonant pump wavelength was chosen as 950 nm, and the spot size at the sample was 590 μm. The setup was built to have near normal incidence of the pump (∼5° to the sample normal). Both pump and probe beams were horizontally polarized i.e. in the plane of incidence. The probe beam was separated from the pump using the appropriate colour filters and was detected as a function of the pump–probe time delay using a pair of balanced Si photodiodes. Through the course of each measurement, a static magnetic field higher than the sample coercive field was applied normal to the sample using an electromagnet connected to an external programmable current supply. This was done in order to re-initialize the saturated magnetic state of the sample before each subsequent pump pulse. To remove non-magnetic contributions, traces were recorded for opposite polarities of the applied field and subtracted.
Three-dimensional electrodynamic calculations of the optical response and the surface charge density maps were performed by solving Maxwell's equations in the frequency domain, using the Radio Frequency Module, based on the Finite Element Method (FEM) implemented in the commercial software COMSOL Multiphysics.24 In order to reproduce the experimental structures, we modeled an Ag nanoring antenna on a three-layered structure using an analytical background field resulting from solving Fresnel equations for an incoming light source on a multilayer system. After the interaction with light, the scattered field due to the Ag nanoring antenna was calculated. We simulated the interaction of an incoming linearly polarized light with normal incidence (with the electric field oriented parallel to the plane where the ring is lying). We used air, nair = 1.0, for the incoming light environment, a substrate with a refractive index n = 1.5 (mimicking SiO2) and silver dielectric optical functions from Johnson and Christy.25 We also fixed the refractive index of the alumina-capping layer as 1.7. The optical functions for TbxCo100−x were obtained from the results of amorphous alloy films provided by earlier studies.22 According to the wavelength used in the simulations, we present the results for the bonding mode at 800 nm and the off-resonance at 600 nm (presented as on resonance and off-resonance in Fig. 5). For the antibonding wavelengths, we present the results for 400 nm and 440 nm in Fig. S1a and b.† All domains in the simulation box were meshed by using tetrahedral elements with a maximum mesh element size maintained below λ/10, where λ is the wavelength of the incident light for the air and substrate environments. For the elements corresponding to the ring, the spacer and the TbxCo100−x film domains, the size was ten times finer than the largest element size (verified to properly resolve the considered structures).
Results and discussion
Plasmon nanoring antennas on the ferrimagnetic film
Fig. 1a shows the SEM image of the TbCo nanothin film with Ag nanoring antennas directly on top of the few-nm alumina (Al2O3) capping layer, taking up about 17% of the surface. The nanoantennas’ arrangement lacks any long-range ordering, with the average spacing between the nanorings ensuring the absence of near-field electromagnetic coupling.26 That is, the spectral response of the entire surface is representative of a single nanoantenna, with the correction of spectral inhomogeneous broadening due to sizes variations of the nanoantennas. This is typical of disordered arrays produced with hole-mask colloidal lithography employed here.23 Laser illumination is done at near-normal incidence (5° off normal), and the film structure underneath the nanoantennas is schematically detailed in Fig. 1b.The optical transmission of the nanoantennas-on-nanofilm shows two pronounced resonances (Fig. 2a), corresponding to the anti-bonding (close to 480 nm) and the bonding (close to 920 nm) localized plasmon modes. These are well-studied dipolar modes of the nanoring antennas.19,20Fig. 2b shows the calculated charge distribution in the nanoring antennas when each mode is excited. For the bonding (symmetric) mode, the charge distribution has the same sign on the inner and the outer edges of the nanoring, whereas for the anti-bonding (antisymmetric) mode the charge distribution is the opposite for the inner and the outer edges. Static magnetic characterization (Fig. 2c) reveals a square hysteresis loop indicating perpendicular magnetic anisotropy, similar to the hysteresis loops obtained for bare TbCo films.21 The coercive field increases from 0.2 T measured on the bare film to 0.26 T for areas covered with nanoantennas on the same film. This could be attributed to perturbations of the continuous film caused by the antennas’ nanofabrication, introducing domain wall pinning sites. The small difference in the magneto-optical signal in saturation could result from the fact that the hysteresis loops are derived not from the magnetization of the films but from the magneto-optical rotation, which could be influenced by the presence of the nanoantennas as in many previously reported studies in magnetoplasmonics.27
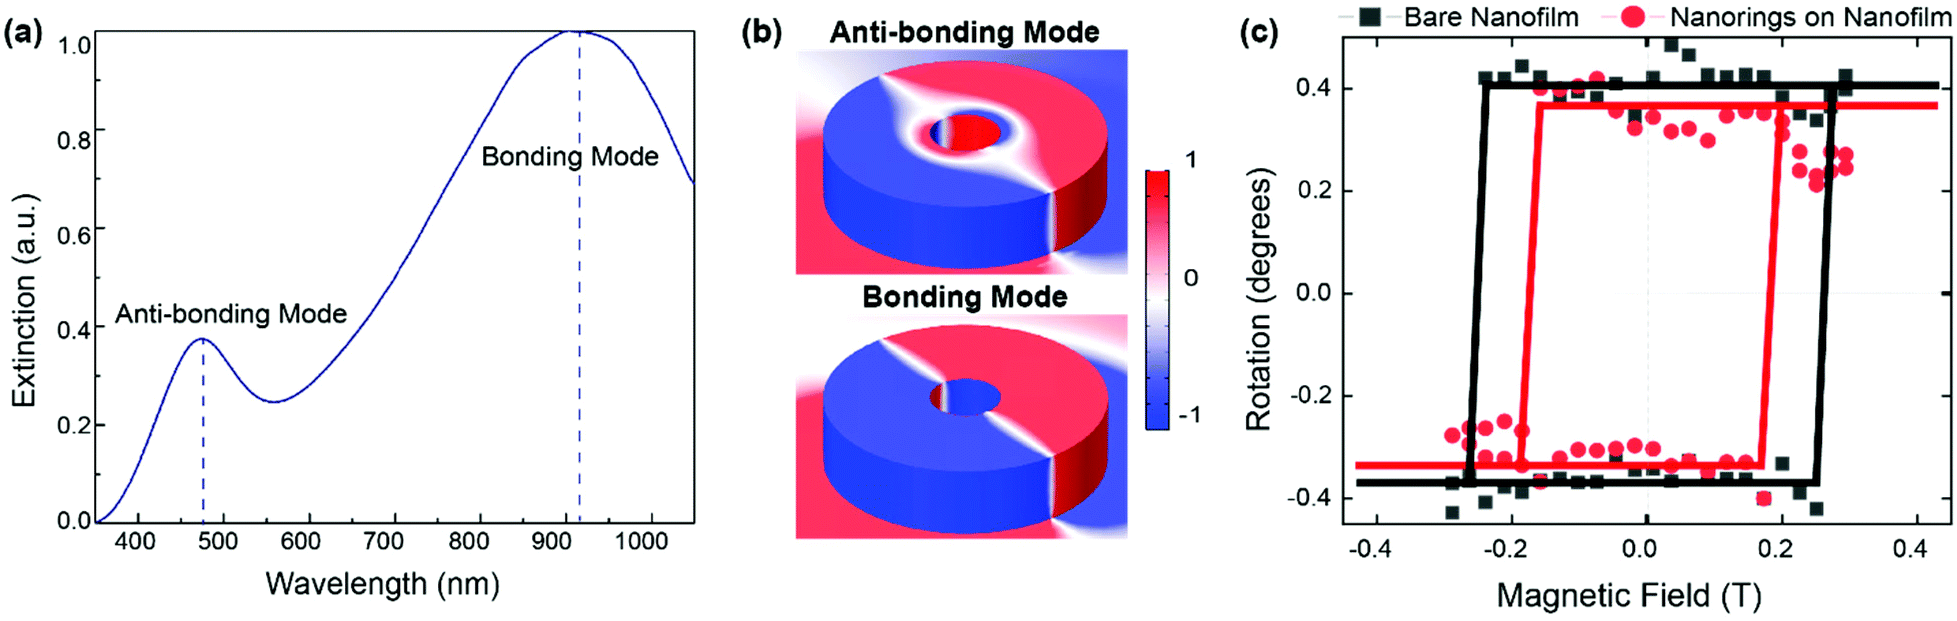 | ||
| Fig. 2 (a) Experimentally measured normalized optical extinction spectrum showing peaks corresponding to the bonding and anti-bonding modes as indicated by the dashed lines and corresponding labels; (b) simulated normalized surface charge distributions corresponding to the two main dipolar plasmon modes of nanoring antennas; (c) magnetic hysteresis loops for the Tb26Co74 film with nanoring antennas (black) and pristine Tb26Co74 film (red), showing square hystereses (the solid lines are guides to the eye). | ||
Experimental pump–probe dynamics
The Tb26Co74 nanofilm has previously been reported to show multi-shot helicity-dependent AOS.22 Linearly polarized pump pulse trains or single shots of any polarization induce demagnetization in the film. That is, using a linearly polarized pump beam, we expect to only see the effects of pump-induced heating. The symmetric shape of the nanoring antennas rules out any dependence on the direction of linear polarization of the pump. Thus, we compare the time resolved dynamics of the system for resonant excitation of the dipolar bonding mode (using a pump wavelength of 950 nm), and off-resonant pumping (for a wavelength of 650 nm) with a linearly polarized pump.The nanoantennas-on-nanofilm show sub-picosecond demagnetization followed by a recovery, similar to the demagnetization behaviour previously reported for TbxCo100−x alloys.28 The nanoantennas do not seem to qualitatively affect the demagnetization process, as evidenced from the similar behaviour for on- and off-resonance excitation (Fig. 3). However, the main striking difference between the two cases is the degree of demagnetization. Counterintuitively, larger demagnetization is observed for off-resonance excitation compared to resonant excitation. In Fig. 3 the dynamics is plotted for the two cases on the same y-axis to visualize the difference in the degree of demagnetization for selected laser fluences. The same trend is observed for pump-induced changes in transmission.
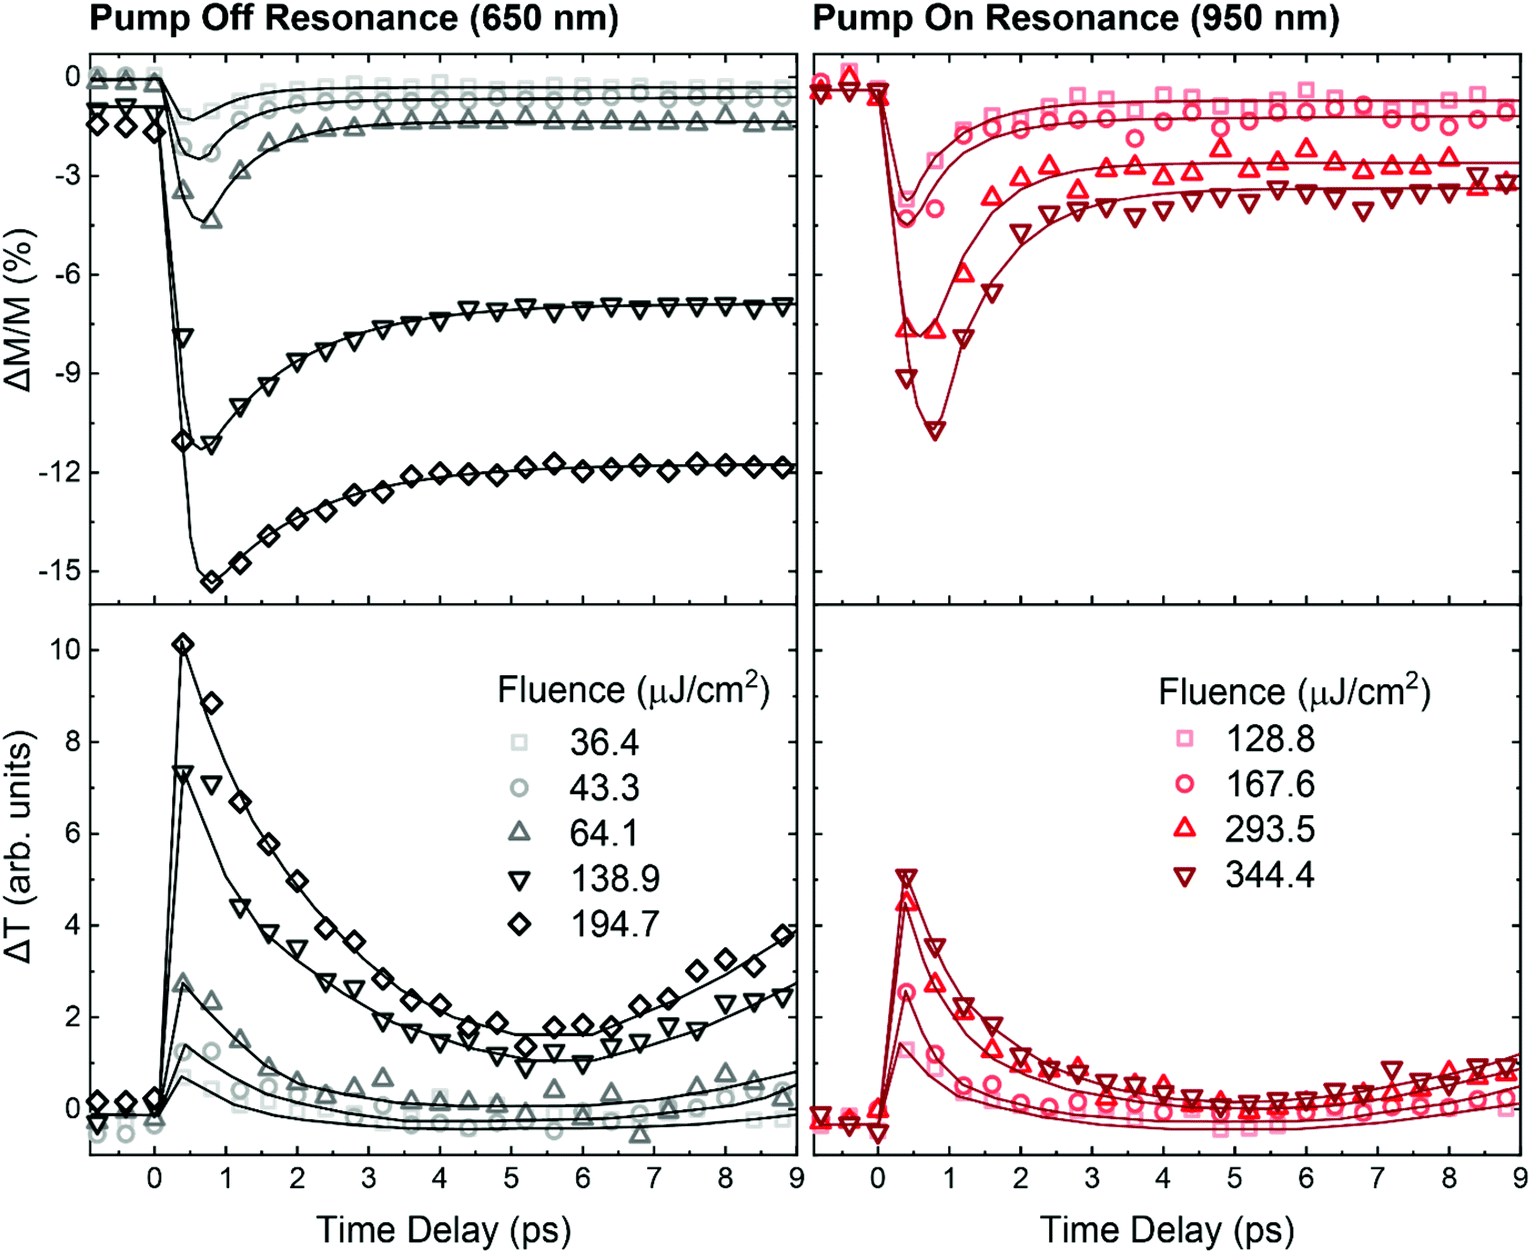 | ||
| Fig. 3 Pump-induced demagnetization (top panel) and change in transmission (bottom panels) measured for a range of incident fluences (color code for different fluences) for an off-resonant pump wavelength of 650 nm (left panels, black/grey data points) and a resonant pump wavelength of 950 nm (right panels, red/dark-red points). The solid lines in the case of the magnetization traces are the bi-exponential fitting curves, whereas the solid lines in the case of the transmission dynamics are a guide to the eye. An upturn is seen after 7 ps for pump-induced changes in transmission. Longer timescale measurements reveal that this upturn is due to the excitation of a standing acoustic wave in the sample film, which manifests itself as an oscillation in the pump–probe trace (see ESI Fig. S2†). | ||
The difference between the responses for the two cases is even more apparent as shown in Fig. 4 where the degree of demagnetization (top panel) and the maximum change in transmission (bottom panel) are plotted as a function of incident pump fluence. A linear relationship is observed for both quantities for both pump wavelengths, as expected for heat-driven dynamics. However, the slope of the degree of demagnetization as a function of fluence for the case of off-resonant pumping (0.077) is nearly thrice the slope for resonant pumping (0.028). Similarly, a threefold decrease at resonance is observed for pump-induced transmission changes, where the slope for off-resonant pumping is 0.05, whereas that for resonant pumping is 0.015.
 | ||
| Fig. 4 Degree of demagnetization (top panel) and maximum change in transmission (bottom panel) plotted as a function of incident fluence for resonant (red squares) and off-resonant pumping (black squares). The dashed lines are the corresponding linear fits to the data points. | ||
At first glance, the nanoantennas-on-nanofilm seem to show faster magnetization recovery for resonant excitation than for off-resonant excitation. For both cases, the magnetization recovery in the first 10 ps proceeds at two timescales: fast and slow. The corresponding relaxation time constants, τ, can be extracted from a bi-exponential fitting of the trace. While the slow relaxation time constant could not be reliably extracted from data measured up to 10 ps, the fast relaxation time constant, τ1, is plotted as a function of incident fluence as shown in Fig. 5. Indeed, the fast relaxation time constant is seen to be smaller for resonant excitation, indicating faster recovery. However, this can be accounted for by considering the smaller degree of demagnetization in this case, since the recovery time of magnetization has been shown to be proportional to the degree of demagnetization.29,30
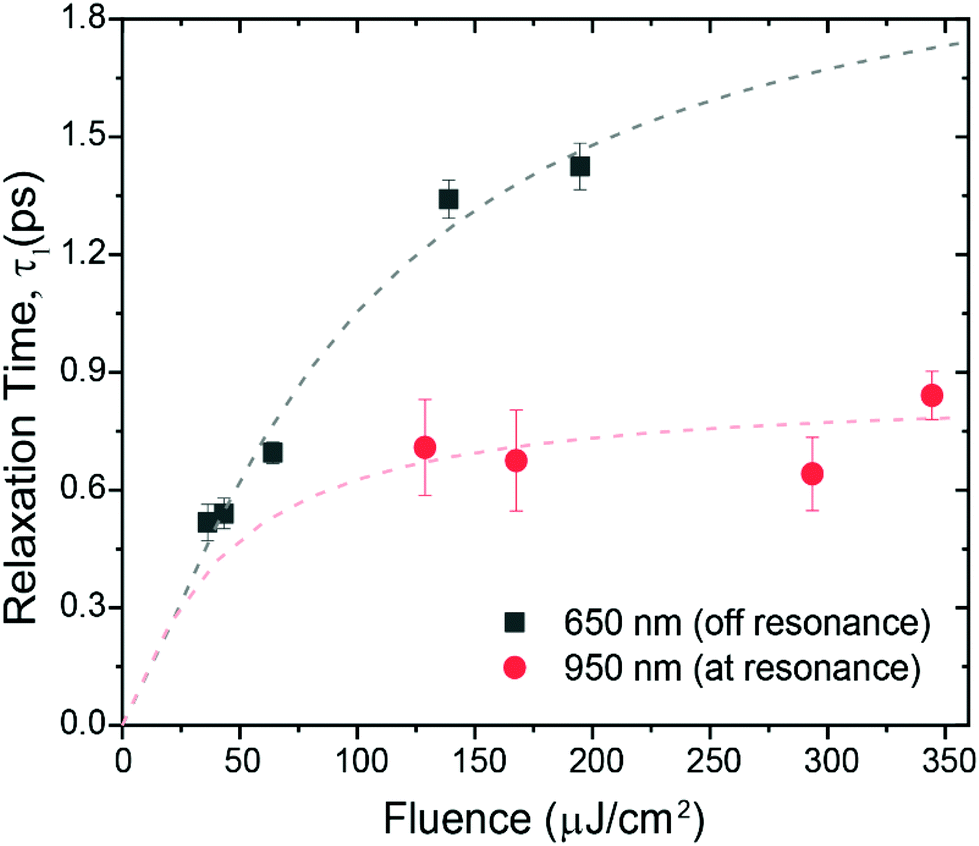 | ||
| Fig. 5 Fast relaxation time constant, τ1, extracted from a bi-exponential fitting of the magnetization dynamics trace, plotted as a function of incident fluence for resonant (red circles) and off-resonant pumping (black squares). The dashed lines are a guide to the eye. | ||
Though at first surprising, the weaker response for resonant than off-resonant excitation of the system is a demonstration of the funneling of the incident pump fluence to the centre of the nanorings upon exciting the dipolar bonding mode. Indeed, the strongly reduced pump-induced changes observed for resonant pumping can be explained by considering the size of the probe/illumination spot relative to the size of the nanoantennas. The signal for the 460 μm-sized probe is obtained from an area covering not just thousands of nanoantennas but also the surrounding ferrimagnetic film which lies outside of the nanorings’ near-field. Crucially, nanoantenna-resonance-enhanced demagnetization is expected to arise only for the TbCo film areas within the nanorings’ focus, where the incoming electromagnetic field of light is funneled and enhanced. The surrounding TbCo regions lying outside the nanorings’ near-field receive a reduced fluence when the bonding resonance is excited due to the efficient in-coupling of the incident laser fluence by the nanoantennas. The demagnetization amplitude, directly proportional to the incident fluence, is larger in the TbCo substrate below the nanoring cavity and smaller in the TbCo substrate outside the nanorings. Knowing the surface coverage of the nanoring antennas on the TbCo film allows the estimation of the ratio of the surface area of the TbCo within the nanoring cavity to the surface area outside of the nanorings, which amounts to 1:44. Thus the predominant contribution to the magnetic signal comes from the TbCo film outside of the nanoantennas’ near-field, leading to an overall reduced net response. Note that the nanoantenna optical cross-section is substantially larger than their geometrical size, as it is common for plasmon nanostructures. Thus, though the demagnetization dynamics of the TbCo film in the interior of the nanorings (inner opening of 20 nm) cannot directly be resolved using a far-field optical probe in our experiments, the signal from the areas outside the nanorings’ near-field gives an indirect but clear evidence of the electromagnetic field funneling by the plasmon nanoantennas at resonance.
We computed the wavelength dependent absorption for the ferrimagnetic film to account for its role in the observed differences for resonant and off-resonant excitation. Our earlier study22 provides the optical constants for various compositions of TbxCo100−x amorphous alloy films in the wavelength range 400–1600 nm. The values of the optical constants as a function of wavelength are very similar for the films with a Tb content between 24–29%. As the composition of the film studied by us is in this range, we use these values (n = 2.9, k = 3.9 at 650 nm; n = 3.7, k = 4.3 at 950 nm) to extract the absorption at 650 nm and 950 nm (not shown) and find that at a given fluence, the absorption at both wavelengths is identical within 1% uncertainty. Hence wavelength-dependent absorption does not contribute to the disparity between the responses.
The plasmon-mediated funneling of the incident fluence as the explanation of our observations is further supported considering that a mere “shading” effect of the TbCo film by the Ag nanorings cannot account for the three-fold reduction in response given that the surface area coverage of the nanorings is ∼17%.
Plasmon nanoring antennas are advanced structures in terms of the resonance modes that result from the coupling of inner and outer walls of the nanoring.20,31 Specifically, the electromagnetic near-field profile of the nanoring antenna features a tightly confined (20 nm in size) and enhanced spot right in the middle of the nanoring, creating the field funneling effect mentioned above. In addition, localized near-fields at the nanoring opening makes this nanoantenna a very prominent candidate for highly sensitive plasmonic bio-/chemo-detectors with an open and easily accessible electromagnetic cavity.32
Electromagnetic simulations of the nanoantennas-on-ferrimagnetic nanofilm
To support the idea of the field funneling into the TbCo film by the nanoring antennas, we performed electromagnetic simulations on the nanoantennas-on-ferrimagnetic film (Fig. 6, off-resonance and on-resonance illumination panels are grouped to the left and right sides, respectively). We visualize the intensity of the scattered field by 3D plots off- and on-resonance (Fig. 6(a and b)), highlighting field funneling by the field flux lines. Cross-sectional intensity maps also show this effect (Fig. 6(c and d)), along with a substantial field enhancement in the nanoring center for the on-resonance illumination. For the off-resonance case, a strong scattering at the corners is observed, arising from the conventional tip-effect, with the scattered field mostly diffused away.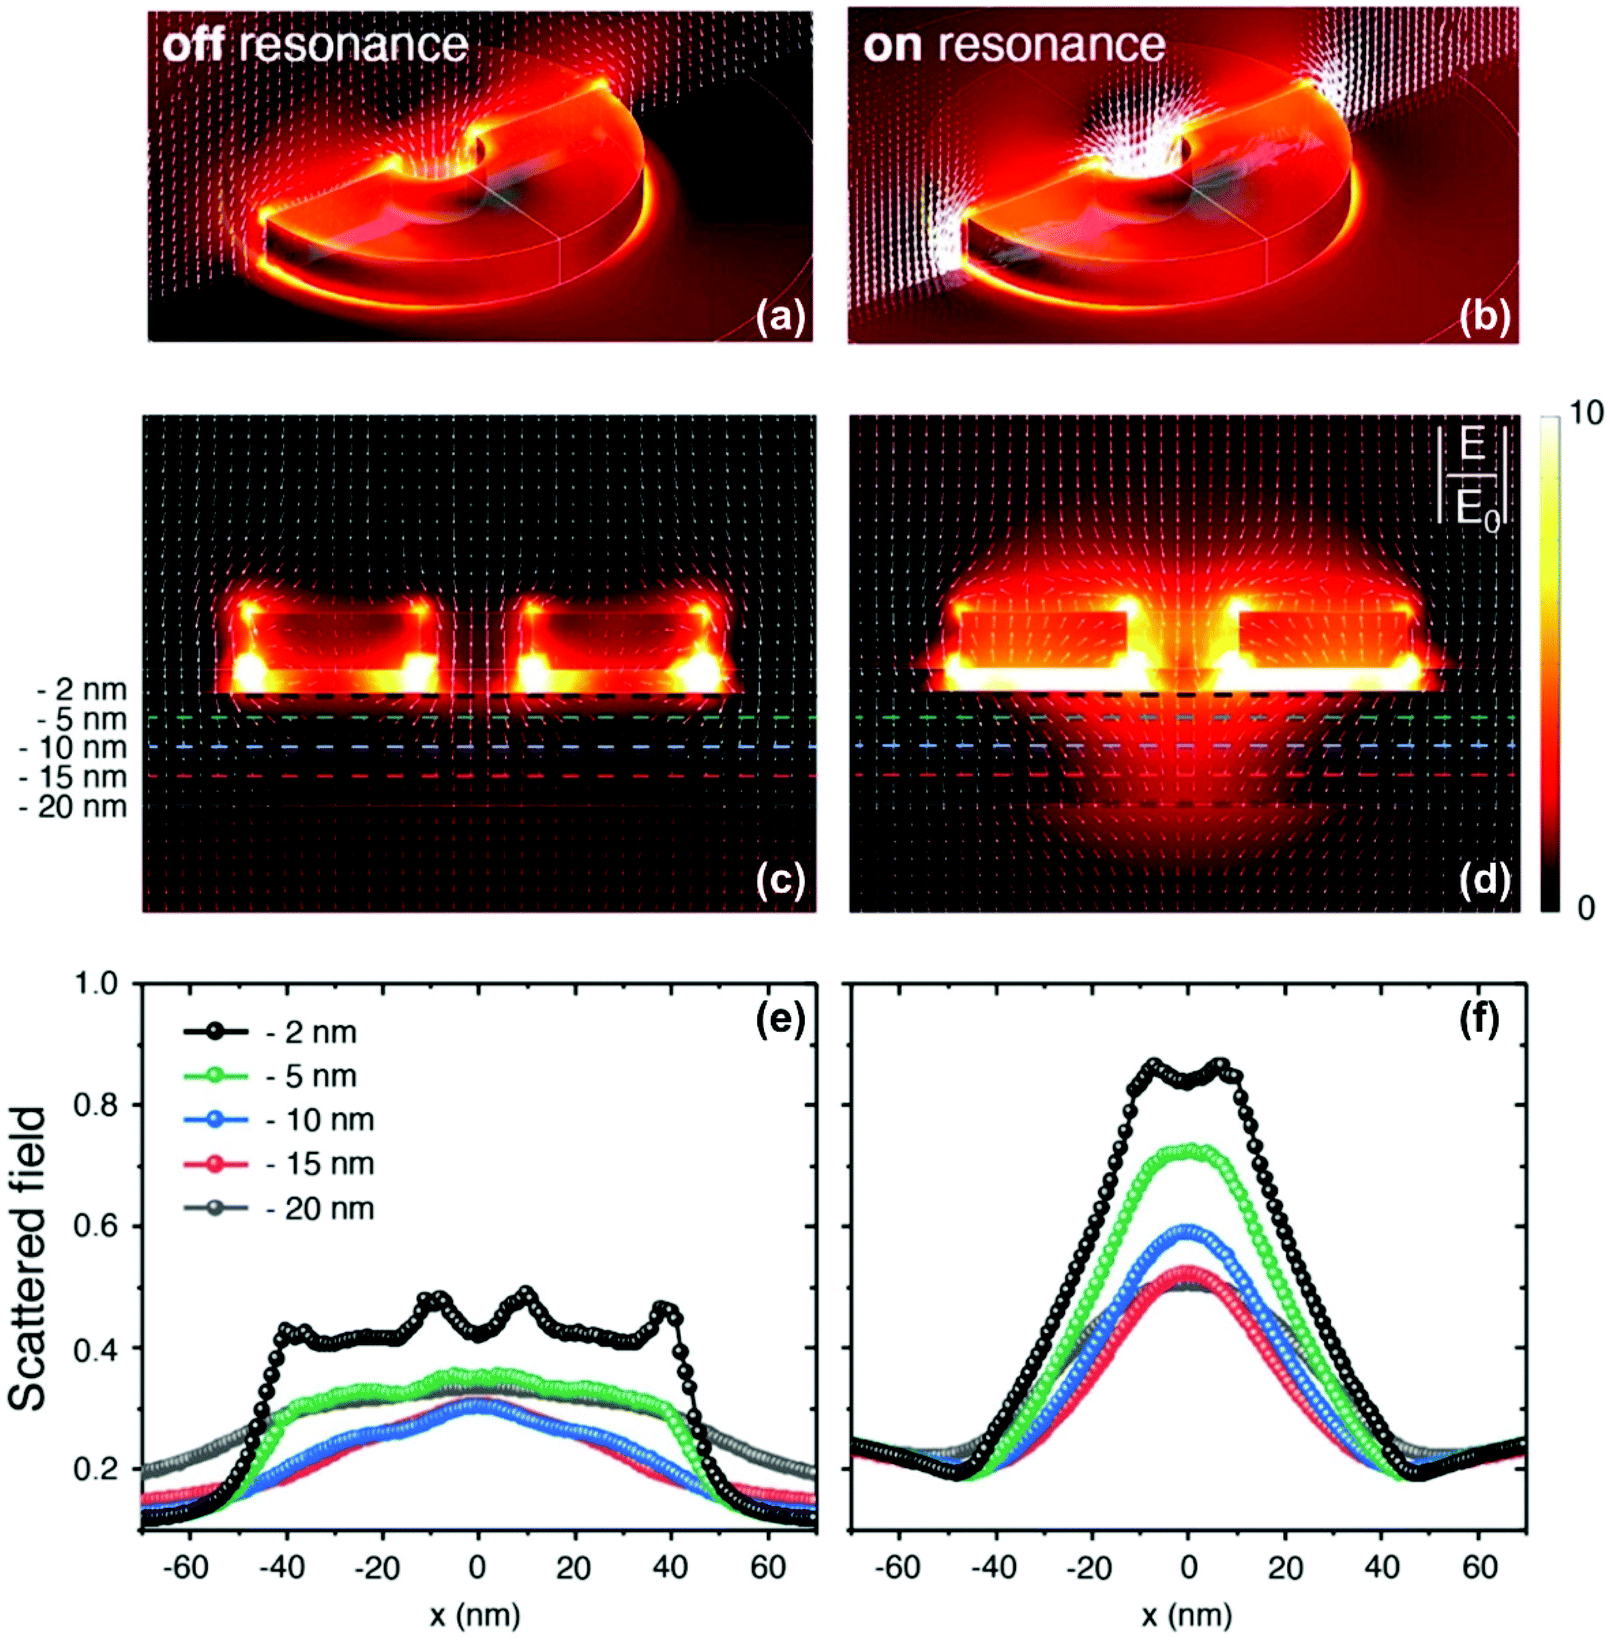 | ||
| Fig. 6 (a and b) 3D intensity maps showing the scattered electromagnetic field in the x−z plane of the nanoring + ferrimagnetic film for (a) off-resonance and (b) on-resonance illumination. The white arrows represent electric field flux lines. (c and d) Cross-sectional plots of the near-field (E/E0) with the dashed differently colored lines marking the distances from the Al2O3 (capping layer)–TbCo interface. (e and f) Linear scans of the scattered field along the colored dashed lines of the middle panel. | ||
The strong contrast between off- and on-resonance cases can be appreciated in the magnitude of the scattered field, plotted as a function of position in the TbxCo100−x film for an alumina–TbCo interface (Fig. 6(e and f)). At resonance the nanoring antenna concentrates the scattered field within the nanoring center and directs it towards the underlying substrate of TbCo just below the central opening of the ring. A more defined deflection of the flux lines near the nanoring rims and a strong concentration (about twice the scattering field intensity compared to the off-resonance illumination) at the center of the nanostructure is detected. The funneling effect propagates through the entire film thickness, although it attenuates with increasing depth.
The average near-field enhancement in the center cavity of the nanoring due to the funnelling effect can be estimated as 1.89, which corresponds to an enhancement factor of 3.57 in terms of the intensity. However, in the experimentally measured response, the fluence received in the nanoring cavity cannot be separately resolved from that received by the surrounding areas due to spatial averaging by the probe. Thus, an exact direct quantitative comparison cannot be made for the simulations and the experimental results despite the good qualitative agreement.
Conclusion
We find that plasmon nanoring antennas can efficiently funnel the illuminating electromagnetic field into nanoscopic portions of an underlying ferrimagnetic thin film and induce marked changes in the demagnetization of this system. Upon resonant excitation, the nanorings are able to couple in a substantial portion of the incident pump-fluence and concentrate it into the 20 nanometer focal spot of the nanoantenna. This results in smaller pump-induced changes in magnetization and transmission in the areas outside the nanoring antennas which constitute the major part of the probed surface in our far-field pump–probe experiments. Electromagnetic simulations of the scattered field show qualitative agreement with this picture.Overall, studying the nanoscale confinement of demagnetization processes under the influence of plasmon nanoantennas fundamentally requires experiments with high real-space resolving power. These are extremely experimentally demanding and often require large-scale experimental facilities (such as the measurements of the results of the fs-pulsed illumination in ferrimagnets with photoelectron emission microscopy, PEEM10 or with X-ray holographic imaging combined with X-ray magnetic circular dichroism12). Even with techniques like PEEM, for instance, we are at the resolution limit to probe within the nanoring cavity, which is 20 nm in diameter. Despite the limitations in the resolution accessible using an all-optical far-field scheme, our results point to a significant step towards utilizing nanoantennas in focusing the pulsed-light illumination to the nanoscale. A further step in this direction would be to reduce the ferrimagnetic film to nanoscopic elements positioned in the foci of plasmon nanoantennas while strictly maintaining their magneto-optical properties and required magnetic anisotropy.33 Such an experiment would provide, conversely, nanoantenna-enhanced demagnetization. Further direction to explore could be the study of all-optical switching behaviour assisted by other plasmonic systems providing tight electromagnetic field nanoconfinement, for instance C-structures34,35 or Archimedean spirals36 that focus incident electric fields tightly enough to create force gradients.
In the present case, the proposed incident fluence funneling in the nanoscopic regions of the ferrimagnet marks a promising path towards ultrafast magnetic bit miniaturization even for nanofilm systems broadly currently employed. We envision such a path in practice leading to fully functional ultrafast nanoscale magnetic memory architectures.
Author contributions
A. C., V. K. and A. D. fabricated the sample film and nanostructures and performed compositional and optical characterization for the samples. K. M. carried out the magnetic characterization and pump–probe dynamics measurements. K. M., A. V. K., T. R., A. K., A. D., M. Z.-H. and P. V. were involved in the analysis and discussion of the results. M. Z.-H. and P. V. did the electromagnetic modelling. K. M., A. K. and A. D. wrote the manuscript with inputs, discussion, and suggestions from all the authors.Abbreviations
| AOS | all-optical switching |
| RE-TM | rare earth-transition metal |
| SEM | scanning electron microscopy |
| PEEM | photoemission electron microscopy |
| HCL | hole-mask colloidal lithography |
| FEM | finite element method |
Conflicts of interest
There are no conflicts to declare.Acknowledgements
The authors thank Dr Oleg Lysenko for his contribution to sample nanofabrication. K. M., A. V. K. and A. K. thank Dr Sergey Semin and Chris Berkhout for technical support. This work was supported by the project FEMTOTERABYTE funded by European Union's Horizon 2020 research and innovation program under grant agreement no. 737093. K. M., A. V. K. and A. K. would like to acknowledge the support from de Nederlandse Organisatie voor Wetenschappelijk Onderzoek (NWO) and collaboration within the COST Action CA17123 MAGNETOFON. P. V. acknowledges support from the Spanish Ministry of Science and Innovation under the Maria de Maeztu Units of Excellence Programme (MDM-2016-0618), and the project RTI2018-094881-B-I00 (MICINN/FEDER). V. K. acknowledges support from the Swedish Research Council (Project No. 2019-03581).References
- C. D. Stanciu, et al., All-optical magnetic recording with circularly polarized light, Phys. Rev. Lett., 2007, 99(4), 047601 CrossRef CAS PubMed.
- S. Mangin, et al., Engineered materials for all-optical helicity-dependent magnetic switching, Nat. Mater., 2014, 13(3), 286–292 CrossRef CAS PubMed.
- C.-H. Lambert, et al., All-optical control of ferromagnetic thin films and nanostructures, Science, 2014, 345(6202), 1337–1340 CrossRef CAS PubMed.
- C. Banerjee, et al., Single pulse all-optical toggle switching of magnetization without gadolinium in the ferrimagnet Mn2RuxGa, Nat. Commun., 2020, 11(1), 1–6 CrossRef PubMed.
- L. Avilés-Félix, et al., Single-shot all-optical switching of magnetization in Tb/Co multilayer-based electrodes, Sci. Rep., 2020, 10(1), 1–8 CrossRef PubMed.
- I. Radu, et al., Transient ferromagnetic-like state mediating ultrafast reversal of antiferromagnetically coupled spins, Nature, 2011, 472(7342), 205–208 CrossRef CAS PubMed.
- A. R. Khorsand, et al., Role of magnetic circular dichroism in all-optical magnetic recording, Phys. Rev. Lett., 2012, 108(12), 127205 CrossRef CAS PubMed.
- M. Finazzi, et al., Laser-induced magnetic nanostructures with tunable topological properties, Phys. Rev. Lett., 2013, 110(17), 177205 CrossRef CAS PubMed.
- L. Le Guyader, et al., Demonstration of laser induced magnetization reversal in GdFeCo nanostructures, Appl. Phys. Lett., 2012, 101(2), 022410 CrossRef.
- L. Le Guyader, et al., Nanoscale sub-100 picosecond all-optical magnetization switching in GdFeCo microstructures, Nat. Commun., 2015, 6(1), 1–6 Search PubMed.
- A. El-Ghazaly, et al., Ultrafast magnetization switching in nanoscale magnetic dots, Appl. Phys. Lett., 2019, 114(23), 232407 CrossRef.
- T.-M. Liu, et al., Nanoscale confinement of all-optical magnetic switching in TbFeCo-competition with nanoscale heterogeneity, Nano Lett., 2015, 15(10), 6862–6868 CrossRef PubMed.
- W. A. Challener, et al., Heat-assisted magnetic recording by a near-field transducer with efficient optical energy transfer, Nat. Photonics, 2009, 3(4), 220–224 CrossRef CAS.
- J. Gorchon, et al., Role of electron and phonon temperatures in the helicity-independent all-optical switching of GdFeCo, Phys. Rev. B, 2016, 94(18), 184406 CrossRef.
- C. S. Davies, et al., Pathways for single-shot all-optical switching of magnetization in ferrimagnets, Phys. Rev. Appl., 2020, 13(2), 024064 CrossRef CAS.
- C. S. Davies, et al., Exchange-driven all-optical magnetic switching in compensated 3d ferrimagnets, Phys. Rev. Res., 2020, 2(3), 032044 CrossRef CAS.
- I. A. Novikov, et al., Ultrafast magneto-optics in nickel magnetoplasmonic crystals, Nano Lett., 2020, 20(12), 8615–8619 CrossRef CAS PubMed.
- S. Schlauderer, et al., Temporal and spectral fingerprints of ultrafast all-coherent spin switching, Nature, 2019, 569(7756), 383–387 CrossRef CAS PubMed.
- J. Ye, et al., Observation of plasmonic dipolar anti-bonding mode in silver nanoring structures, Nanotechnology, 2009, 20(46), 465203 CrossRef PubMed.
- J. Aizpurua, et al., Optical properties of gold nanorings, Phys. Rev. Lett., 2003, 90(5), 057401 CrossRef CAS PubMed.
- A. Ciuciulkaite, The interaction of light and magnetism in the TbxCo100−x system. Diss. Department of Physics and Astronomy, Uppsala University, 2019 Search PubMed.
- A. Ciuciulkaite, et al., Magnetic and all-optical switching properties of amorphous TbxCo100−x alloys, Phys. Rev. Mater., 2020, 4(10), 104418 CrossRef CAS.
- H. Fredriksson, et al., Hole–mask colloidal lithography, Adv. Mater., 2007, 19(23), 4297–4302 CrossRef CAS.
- COMSOL AB, Stockholm, Sweden. COMSOL Multiphysics R. Version 5.2. URL: http://www.comsol.com.
- P. B. Johnson and R. W. Christy, Optical constants of the noble metals, Phys. Rev. B: Solid State, 1972, 6, 4370–4379 CrossRef CAS.
- P. Hanarp, M. Käll and D. S. Sutherland, Optical properties of short range ordered arrays of nanometer gold disks prepared by colloidal lithography, J. Phys. Chem. B, 2003, 107(24), 5768–5772 CrossRef CAS.
- N. Maccaferri, et al., Nanoscale magnetophotonics, J. Appl. Phys., 2020, 127(8), 080903 CrossRef CAS.
- S. Alebrand, et al., Light-induced magnetization reversal of high-anisotropy TbCo alloy films, Appl. Phys. Lett., 2012, 101(16), 162408 CrossRef.
- M. Djordjevic and M. Münzenberg, Connecting the timescales in picosecond remagnetization experiments, Phys. Rev. B: Condens. Matter Mater. Phys., 2007, 75(1), 012404 CrossRef.
- T. Roth, et al., Temperature dependence of laser-induced demagnetization in Ni: A key for identifying the underlying mechanism, Phys. Rev. X, 2012, 2(2), 021006 Search PubMed.
- T. Chung, et al., Plasmonic nanostructures for nano-scale bio-sensing, Sensors, 2011, 11(11), 10907–10929 CrossRef CAS PubMed.
- Nanoplasmonic sensors, ed. A. Dmitriev, Springer Science & Business Media, 2012 Search PubMed.
- R. M. Rowan-Robinson, et al., Direction–Sensitive Magnetophotonic Surface Crystals, Adv. Photon. Res, 2021, 2100119 CrossRef.
- X. Shi, L. Hesselink and R. L. Thornton, Ultrahigh light transmission through a C-shaped nanoaperture, Opt. Lett., 2003, 28(15), 1320–1322 CrossRef PubMed.
- M. A. Zaman, P. Padhy and L. Hesselink, Near-field optical trapping in a non-conservative force field, Sci. Rep., 2019, 9(1), 1–11 Search PubMed.
- W.-Y. Tsai, J.-S. Huang and C.-B. Huang, Selective trapping or rotation of isotropic dielectric microparticles by optical near field in a plasmonic archimedes spiral, Nano Lett., 2014, 14(2), 547–552 CrossRef CAS PubMed.
Footnotes |
| † Electronic supplementary information (ESI) available. See DOI: 10.1039/d1nr04308k |
| ‡ Current affiliation: Materials Physics Center CSIC-UPV/EHU, 20018 Donostia-San Sebastian, Spain |
| This journal is © The Royal Society of Chemistry 2021 |