Regulating the synthesis rate and yield of bio-assembled FeS nanoparticles for efficient cancer therapy†
Zheng
Dang
a,
Yong
Guan
a,
Zhao
Wu
a,
Xia-Yu
Tao
a,
Ying
Xiong
a,
Hao-Bo
Bai
a,
Chang-Sheng
Shao
bc,
Gang
Liu
a,
Qing
Huang
 bc,
Li-Jiao
Tian
 *a and
Yang-Chao
Tian
*a
aNational Synchrotron Radiation Laboratory, University of Science and Technology of China, Hefei, 230026, China. E-mail: ljtian@ustc.edu.cn; ychtian@ustc.edu.cn
bCAS Key Laboratory of High Magnetic Field and Ion Beam Physical Biology, Hefei Institutes of Physical Science, Chinese Academy of Sciences (CAS), Hefei 230031, China
cScience Island Branch of Graduate School, University of Science and Technology of China, Hefei 230026, China
First published on 11th October 2021
Abstract
Biosynthesis has gained growing interest due to its energy efficiency and environmentally benign nature. Recently, biogenic iron sulfide nanoparticles (FeS NPs) have exhibited excellent performance in environmental remediation and energy recovery applications. However, their biosynthesis regulation strategy and application prospects in the biomedical field remain to be explored. Herein, biogenic FeS NPs are controllably synthesized by Shewanella oneidensis MR-1 and applied for cancer therapy. Tuning the synthesis rate and yield of biogenic FeS NPs is realized by altering the initial iron precursor dosage. Notably, increasing the precursor concentration decreases and delays FeS NP biosynthesis. The biogenic FeS NPs (30 nm) are homogeneously anchored on the cell surface of S. oneidensis MR-1. Moreover, the good hydrophilic nature and outstanding Fenton properties of the as-prepared FeS NPs endow them with good cancer therapy performance. The intracellular location of the FeS NPs taken up is visualized with a soft X-ray microscope (SXM). Highly efficient cancer cell killing can be achieved at extremely low concentrations (<12 μg mL−1), lower than those in reported works. Such good performance is attributed to the Fe2+ release, elevated ROS, reduced glutathione (GSH) consumption, and lipid hydroperoxide (LPO) generation. The resulting FeS NPs show excellent in vivo therapeutic performance. This work provides a facile, eco-friendly, and scalable approach to produce nanomedicine, demonstrating the potential of biogenic nanoparticles for use in cancer therapy.
Introduction
Biosynthesis has gained tremendous attention owing to its low cost, energy efficiency, and eco-friendly nature.1 Such a synthesis strategy employs living organisms as bio-factories to assemble multi-functional and multi-morphology materials at ambient temperature and pressure.2 Specifically, the inherent protein capping of biogenic nanoparticles endows them with good biocompatibility and excellent water solubility, which have enabled diverse applications.3 The inherent biocompatibility and fluorescence characteristics of biogenic CdSxSe1−x quantum dots (QDs) enable label-free bio-imaging of cancer cells and tumor tissue of mice.4In situ biosynthesized CdS nanoparticles anchor to microbes and endow the organisms with efficient light-harvesting capacity for solar-to-chemical production.5,6 Additionally, the biogenic nanoparticles have excellent biodegradability. In our previous work, the biosynthesized CdSxSe1−x QDs could be gradually metabolized and removed from the zebrafish body in a safe manner.7 Indeed, biogenic nanoparticles exhibit excellent performance in diverse applications.8To date, prokaryotes and eukaryotes have been proved to be able to assemble with a variety of functional nanomaterials, such as CdSxSe1−x QDs,9 CuSe photothermal agent,10 Au nanoparticles,11 and magnetic nanostructures.12 Among them, biogenic iron sulfide nanoparticles (FeS NPs), with highly reductive and unique electrical properties, have aroused increasing attention recently in various fields. For FeS NP biosynthesis, thiosulfate and ferric citrate were always selected as precursors to produce S2− and Fe2+, respectively. The resulting S2− reacted with Fe2+ to form FeS NPs. According to the reported works,4 thiosulfate reduction is catalyzed by PsrC-PsrB-PsrA and SirD-SirC-SirA in the periplasm. Meanwhile, CymA, a cytoplasmic membrane-associated c-type cytochrome,13 and MtrC, an outer-membrane-anchored c-type cytochrome,14 were involved in reducing ferric citrate. Attracted by their adsorption capacity and reductive properties, biosynthesized FeS NPs have been applied to environmental remediation, such as the reduction of tetrachloride,15 chromium,16 and uranium.17 Besides, biosynthesized FeS NPs have been employed as electron conduits to facilitate the interfacial electron transfer from Shewanella oneidensis MR-1 to the electrode and enhance the current output.18 The electron-conducting property of FeS NPs has also been applied to extract electrons from the electrode to sulfate-reducing bacteria.19 Despite the progress made in biogenic FeS NPs, their synthesis regulation strategies are scarce, and their application prospects in biomedicine remain to be explored.
Ferroptosis therapy has been regarded as a promising targeted therapeutic strategy, which relies on the Fenton properties of the ferroptotic agent to generate potent oxidizing hydroxyl radicals (˙OH) and trigger cancer cell apoptosis.20 A unique feature of ferroptosis therapy is the specific generation of ˙OH in the tumor microenvironment (TME), thus ensuring effective cancer-killing and normal tissue safety.21 Fe-, Mn- and Cu-based ferroptotic agents exhibited good therapeutic effects on a variety of cancers.22–24 Among them, Fe-based nanoparticles have gained considerable attention because of their high biological safety and outstanding biodegradability. To date, the primary synthesis methods are based on traditional chemical synthesis. However, such a synthesis strategy suffered from various drawbacks, including an energy-intensive nature, hazardous toxic reagents, and harsh conditions. Furthermore, to meet the requirements of water solubility and cell biocompatibility in bio-field applications, extra surface modifications are needed, which largely limited their practical applications. Therefore, it is highly urgent to develop green ferroptotic agents with facile and eco-friendly preparation and biocompatibility capacities. Driven by the superiority of biosynthesis, we hypothesized that biogenic FeS NPs might exhibit good performance in cancer therapy through ferroptosis.
In this proof-of-concept study, we employed Shewanella oneidensis MR-1 as a bio-factory to assemble FeS NPs for cancer therapy. S. oneidensis MR-1 is a state-of-the-art organism for studying biosynthesis owing to its unique extracellular electron transfer chain, through which the metabolic electrons can be harvested for nanoparticle biosynthesis.25 Besides, it is the best-understood organism in terms of the genetic information of the electron transfer pathway, which is the basis of nanoparticle biosynthesis.26 Additionally, it shows outstanding performance in multi-functional nanoparticle fabrication, including27 CdSe QDs,26 AsS nanotubes,25 Pd nanoparticles,28 and PdAu alloy.29 Furthermore, the robust growth and versatile metabolic capacities of S. oneidensis under extreme conditions make further large-scale biosynthesis of nanoparticles possible. The synthesis rate and yield of biogenic FeS nanoparticles were tuned by altering the initial iron precursor dosage. The biogenic nanoparticles were characterized by scanning electron microscopy (SEM), transmission electron microscopy (TEM), soft X-ray microscopy (SXM), Raman spectroscopy, X-ray diffraction (XRD), X-ray photoelectron spectroscopy (XPS) and Fourier transform infrared spectroscopy (FTIR). Furthermore, the influence of reaction buffer pH, reduced glutathione (GSH) content, and H2O2 content on FeS NP-based Fenton properties was investigated. The effectiveness of biogenic FeS NPs on cancer treatment was evaluated. The corresponding mechanism was explored by detecting intracellular Fe2+, ROS content, GSH consumption, and lipid peroxidation (LPO). Finally, the in vivo therapeutic performance of biogenic FeS was investigated. This work may lay a foundation for the green synthesis of nanomedicine.
Experimental
Biosynthesis of FeS NPs
Wild-type (WT) S. oneidensis MR-1 strain was kindly provided by Prof. Liang Shi at the China University of Geosciences. The bacteria were aerobically cultured in Luria–Bertani (LB) broth on a rotary shaker (200 rpm, 30 °C). After 15 h incubation, the stationary cells were collected by centrifugation (5000g, 10 min, 4 °C) and washed three times with PIPES (30 mM 1,4-piperazinediethanesulfonic acid, pH 7.0) buffer. The resulting concentrated culture was used for biosynthesis. The FeS biosynthesis experiments were conducted in 125 mL serum bottles with 50 mL defined anaerobic medium (pH 7.0),27 which contained 30 mM PIPES, 20 mM lactate, 1 mM thiosulfate and different concentrations of Fe(III)-citrate (2 mM, 3 mM, 4 mM, and 5 mM). To ensure anaerobic conditions, each bottle was purged with nitrogen for 20 min, and then sealed with butyl rubber stoppers and aluminum caps. After that, the anaerobic serum vials were autoclaved at 121 °C for 20 min. The concentrated biomass was injected into the sterile serum vials to a final cell density of 0.8 at OD600. The serum bottles were incubated on a rotary shaker (200 rpm, 30 °C). After 7 days of cultivation, the treated samples were collected and washed for further characterization and application. The samples at different time points were collected and freeze-dried, and then used for an X-ray photoelectron spectroscopy test (XPS, ESCALAB250, Thermo Fisher Inc., USA).Characterization of S. oneidensis-FeS NPs
The serum bottles under different precursor conditions were shaken evenly. S. oneidensis-FeS NP suspensions were collected for ultraviolet-visible near-infrared spectroscopy (UV-vis-NIR, SolidSpec-3700, Shimadzu Co., Japan) characterization. The S. oneidensis-FeS NP morphology was observed by scanning electron microscopy (SEM) and transmission electron microscopy (TEM), S. oneidensis-FeS NPs were collected and washed twice with phosphate-buffered saline (PBS), and the washed S. oneidensis-FeS NPs were then fixed with 2.5% glutaraldehyde overnight at 4 °C. The fixed cells were washed twice with PBS and then dehydrated in increasing concentrations of ethanol solution (30%, 50%, 75%, 90%, 95%, 97%, and 100%) in sequence, each for 15 min. The dehydrated cells were placed in silicon chips sputtered with platinum and then observed with a field emission scanning electron microscope (SEM, GeminiSEM 500, ZEISS Co., Germany). The dehydrated cells were placed on a copper mesh and viewed with a transmission electron microscope (TEM, JEM-2100Plus). The chemical composition of FeS NPs was determined by energy-dispersive X-ray spectroscopy (EDX). To further observe the three-dimensional (3D) morphology of S. oneidensis-FeS NPs, 3D Nano-CT imaging experiments were performed using a transmission soft X-ray microscope at the beamline BL07W of the National Synchrotron Radiation Laboratory, Hefei, China. The S. oneidensis-FeS NPs were washed twice with PBS, and were fixed with 2.5% glutaraldehyde overnight at 4 °C. The fixed cells were washed twice with PBS and then dehydrated in increasing concentrations of ethanol solution (30%, 50%, 75%, 90%, 95%, 97%, and 100%) in sequence, each for 15 min. The dehydrated cells were placed in a 100-mesh nickel grid. The X-ray beam was focused on the sample through an elliptical capillary condenser. The objective zone plate generates a magnified image of the sample on a 166-bit 1024 × 1024 charge-coupled device camera with a 12-μm field of view and a spatial resolution of 30 nm. To realize the 3D volume construction, a tilt series consisting of 121 images taken at 1° intervals were respectively collected at 711 eV and 702 eV X-ray energy. Each projection was collected with an exposure time of 2 s. The 3D reconstruction volumes were obtained by the filtered back-projection (FBP) method and the 3D rendering video was realized using TXM 3D Viewer software.Purification and characterization of FeS NPs
To purify FeS NPs, washed S. oneidensis-FeS NPs were dissolved in 10 mM Tris-HCl (pH 7.5) followed by cell disruption using a sonicator (100 W, 30 min) (Scientz-IID, Ningbo Scientz Biotechnology Co., China). The disrupted samples were filtered through a 0.22-μm membrane to remove unbroken cells and the purified FeS NPs were obtained. The TEM image was captured using a transmission electron microscope (TEM, JEM-2100Plus). The zeta potential and hydraulic radius of the purified Bio-FeS NPs were detected by dynamic light scattering (DLS, Nanotrac Wave II, Microtrac Inc., USA). The purified samples were used for Fenton and cancer therapy experiments. Furthermore, the purified samples were dried under a nitrogen atmosphere, and then used for other characterization processes, including X-ray powder diffraction (XRD, SmartLab, Rigaku Co., Japan) and Fourier transform infrared spectroscopy (FTIR, LabRamHR, Horiba Co., Japan). The crystallographic structure of FeS NPs was measured using an XRD system equipped with a Cu Ka irradiation source. The 2 theta values were collected from 10 to 70. The chemical bond was studied using a Raman spectrometer (LabRAM HR Evolution). Raman spectra were collected under a 633 nm excitation. The surface information of the FeS NPs was recorded by FTIR.Fe(II) detection
Fe(II) concentration was measured by the 1,10-phenanthroline method. Briefly, 500 μL of sample was taken in an anaerobic workstation and acidified with 500 μL of 1 M HCl solution for 5 min. After that, 2 mL of HAc-NaAc buffer and 4 mL of 1,10-phenanthroline (0.1%) were added to the acidified sample. Then the mixture was diluted to 20 mL. After 15 min reaction, the absorption at 510 nm was measured with a UV-vis spectrometer (Shimadzu UV-1800, Japan).Quantification of the FeS NPs
To quantify the FeS NP concentration, 500 μL of purified FeS NP solution was digested with 4 mL HNO3 and 1 mL HClO4, and then diluted to 10 mL for inductively coupled plasma atomic emission spectroscopy (ICP-AES) (Optima 7300 DV, PerkinElmer Co., USA) detection.Fenton property measurements
To evaluate the Fenton properties of biogenic FeS NPs, the generation of ˙OH under different conditions was evaluated from the degradation of methylene blue (MB). MB degradation would decrease the absorption at 665 nm. Initially, 10 μg mL−1 FeS NPs were added into MB solution (4 mL, 10 μg mL−1) at different pH values (5.5, 6.5, and 7.5 (in dibasic sodium phosphate-citric acid buffer solution)). Then, H2O2 (2 mM) and GSH (5 mM) were added to the mixture, and the mixture was placed in a 37 °C incubator for 4 h. Finally, the mixture was centrifuged and the supernatant absorbance at 665 nm was measured with the UV-vis spectrophotometer. In sequence, the degradation rates of MB in different concentrations of GSH (0, 0.5, 1, 2, 5, and 10 mM) and H2O2 (0, 0.5, 1, 1.5, and 2 mM) were compared.In vitro Fenton therapy evaluation
The in vitro Fenton therapy of FeS NPs was evaluated using the cell counting Kit-8 (CCK-8) assay of mouse breast cancer cell lines (4T1) and human cervical carcinoma cell lines (HeLa). The cells were seeded into a 96-well plate (5 × 10³ cells per well) and cultured at 37 °C with 5% CO2 for 24 h. The culture media of 4T1 and HeLa cells are (90%) RPMI 1640 and (10%) fetal bovine serum. Then, the culture media were removed and replaced with culture media containing FeS NPs at different concentrations, followed by further 24 h incubation. After the incubation, the cells were washed twice with PBS, and then 10 μL of CCK-8 was added to each well of the 96-well plate and reacted at 37 °C under 5% CO2 for 4 h. Finally, the absorbance of each well at 450 nm was measured with a microplate reader (Multiskan FC 357-704433).Annexin V-FITC/PI staining
The HeLa cells were inoculated into six-well plates and incubated with Bio-FeS (10 μg mL−1) for 12 h. The total cells were then once washed and resuspended with annexin V binding buffer. The cells were then subsequently stained with 5 μl annexin V and 5 μl PI (Roche, Germany) for 20 min and analyzed by Beckman CytoFLEX flow cytometry.SXM acquisition and tomographic reconstruction
After 12 h incubation with the 10 μg mL−1 Bio-FeS NPs, the treated 4T1 cells were rapidly frozen for further SXM assay. The SXM data were collected at the beamline BL07W of the National Synchrotron Radiation Laboratory, Hefei, China. The reconstructed three-dimensional image was segmented using Amira software.The functions of proteins capped on the FeS NPs
To extract proteins from bacteria, the bacteria were disrupted by ultrasound treatment (5 s with 5 s intervals, 100 repeats in all) on ice, and then centrifuged to collect the proteins in the precipitate. The protein contents were detected with a BCA protein assay kit (Beyotime). The extracted proteins were further used for the viability assays in HeLa cells. To remove the capping proteins, the isolated FeS NPs were digested with proteinase K (200 μg mL−1) at 55 °C for 4 h and then washed twice. The resulting products were dried under a nitrogen atmosphere and then used for XRD assay.Intracellular Fe(II) detection
To detect the intracellular Fe(II), a Ferro Orange probe (Dojindo, Japan) was used for fluorescence imaging of intracellular Fe(II). The HeLa cells were seeded into a 6-well plate and cultured at 37 °C under 5% CO2 for 24 h. The supernatant was discarded, the cells were washed with serum-free medium three times and then the serum-free medium containing the FeS NPs (10 μg mL−1) was added, followed by further 12 h incubation. Finally, the Ferro Orange probe (1 μmol L−1) was added and cultured at 37 °C under 5% CO2 for 0.5 h. The intracellular Fe(II) was then measured by recording the fluorescence of Ferro Orange probes (λex = 545 nm, λem = 580 nm) with a fluorescence microscope (Olympus Co., Japan).Detection of the intracellular ROS, GSH and LPO
The intracellular ROS levels were measured using a Reactive Oxygen Species Assay Kit (Beyotime Biotechnology, China). 2′,7′-Dichlorofluorescein-diacetate (DCFH-DA), which is easily oxidized to fluorescent dichlorofluorescein (DCF) by intracellular ROS, is its principal component, and therefore, the ROS levels were quantified. To evaluate the efficient generation of intracellular ROS, the HeLa cells were exposed to the FeS NPs (10 μg mL−1) for 12 h. Subsequently, the cells were washed three times with a serum-free medium and then incubated with a fresh serum-free medium containing DCFH-DA (10 μM) for another 0.5 h. The supernatant was discarded, and the cells were washed with a serum-free medium three times. The intracellular ROS was then measured by recording the fluorescence of DCF (λex = 488 nm, λem = 525 nm) with the fluorescence microscope (Olympus Co., Japan). The GSH contents were detected with a total GSH and GSSG Assay Kit (Beyotime) following the kit instructions. The lipid peroxidation levels were examined with a Lipid Peroxidation MDA Assay Kit (Beyotime).In vivo therapeutic effects
The in vivo assay of the Bio-FeS NPs was carried out using 4T1 tumor-bearing nude mice. A tumor model was constructed by subcutaneously injecting 4T1 cells into the backs of the female BALB/c mice. Mice with tumors of almost 100 mm3 were selected for further experiments with random division into two groups: (1) a control group injected with PBS and (2) an experimental group injected with Bio-FeS NPs (0.5 mg kg−1). The intratumoral injection was used for both groups. Injections were carried out three times a week for two weeks, and the dosage of Bio-FeS NPs was maintained equivalent for each injection. The tumor volume and body weight of all groups were determined. The tumor volume was calculated based on the following formula: width2 × length × 0.5. After 18-day treatment, the mice were sacrificed and used for further assays, including obtaining photographs of tumor and hematoxylin and eosin (H&E) staining. All animal experiments complied with the guidelines outlined in the Guide for the Care and Use of Laboratory Animals, and all procedures were approved by the Institutional Animal Care and Use Committee (IACUC) of Precedo Pharmaceuticals Co., Ltd (China, IACUC-20210723).Results and discussion
Regulation of biogenic FeS NPs
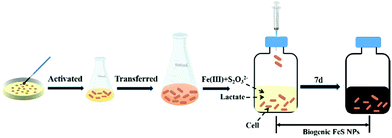
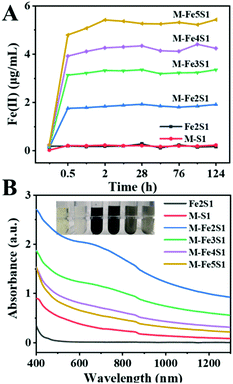
To regulate FeS NP biosynthesis, the stationary-phase cells were incubated with 1 mM thiosulfate and different concentrations of Fe(III)-citrate for 7 days following the procedures shown in Fig. 1 (Table 1). Different from the abundant Fe2+ contents in the experimental groups, it was almost absent in the control group (Fe2S1 group) without S. oneidensis MR-1 (Fig. 2A), suggesting that Fe(III)-citrate was reduced by S. oneidensis MR-1. Consistently, before the addition of cells, the XPS spectrum of the biogenic medium showed the characteristics of Fe(III) with no significant peaks of Fe(II) (ESI, Fig. S1†). After incubation of the cells, the peaks were shifted to low energy, indicating the formation of Fe(II).| Group | MR-1 | Thiosulfate | Fe(III)-citrate | |
|---|---|---|---|---|
| Fe2S1 | Without | 1 | 2 | Control |
| M-S1 | With | 1 | 0 | Control |
| M-Fe2S1 | With | 1 | 2 | Experiment |
| M-Fe3S1 | With | 1 | 3 | Experiment |
| M-Fe4S1 | With | 1 | 4 | Experiment |
| M-Fe5S1 | With | 1 | 5 | Experiment |
Except for the control groups, Fe(II) contents gradually increased within 2 h in all experimental groups (Fig. 2A). After 2 h incubation, Fe(III)-citrate was reduced entirely in all experimental groups. Furthermore, the accumulated Fe(II) contents >positively correlated with the initial precursor Fe(III)-citrate dosage. These fine reduction rate and high reduction content imply the good Fe(III) bio-reduction capacity of S. oneidensis MR-1.
After 7 days incubation, the experimental groups exhibited a color shift, turning to black color (Fig. 2B inset). The black precipitate was not observed in the control groups, without cells or without Fe(III)-citrate, suggesting that it was the bio-transformed Fe-particles. Interestingly, after 48 h incubation, the black precipitate firstly appeared in the M-Fe2S1 group (ESI, Fig. S2†). Different from the above dose-dependent increase in the Fe(II) reduction process, the resulting black precipitate exhibited an opposite order. Increasing the Fe precursor concentration resulted in the delay and decrease of the black precipitation formation. Consistently, the experimental groups exhibited strong and broad optical absorption around 650 nm (Fig. 2B), which is similar to the reported FeS characteristics,28 implying the synthesis of FeS NPs. The absorbance around 650 nm decreased with increasing Fe(III)-citrate concentration, and the maximum was achieved in the M-Fe2S1 group. Thus, the biosynthesis yield and rate of FeS NPs can be regulated by changing the Fe precursor concentration.
Interestingly, increasing the Fe precursor concentration resulted in the delay and decrease of FeS NP formation. Differently, a positive relationship between the precursor concentration (thiosulfate) and biosynthesis yield of FeS NPs was observed previously.16 Such a phenomenon may be attributed to the competition for electrons between thiosulfate and Fe(III)-citrate. According to a reported article, Fe(III)-citrate reduction is a thermodynamically favorable reaction compared with thiosulfate reduction.3 The reaction superiority of Fe(III)-citrate over thiosulfate reduction was supported by the fact that the black precipitate only appeared after the Fe(II) concentration became stable. Thus, Fe(III)-citrate reduction, thiosulfate reduction, and FeS formation appeared sequentially in this biosynthesis process. Considering that the maximum absorption intensity around 650 nm was obtained in the M-Fe2S1 group, the M-Fe2S1 group was selected for subsequent experiments.
Characterization of the biogenic FeS NPs
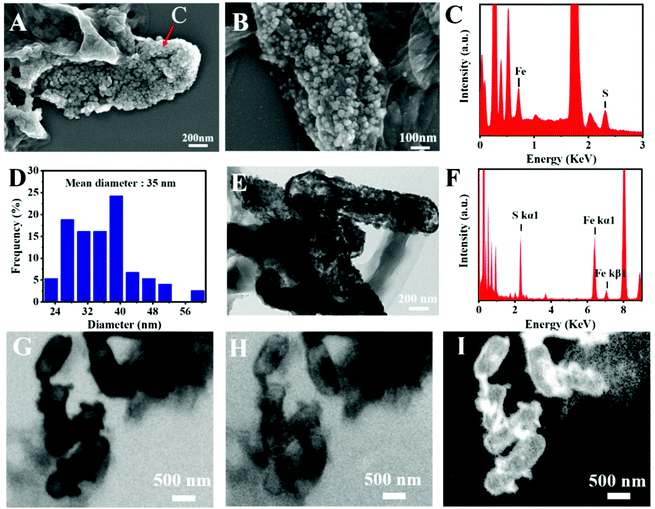
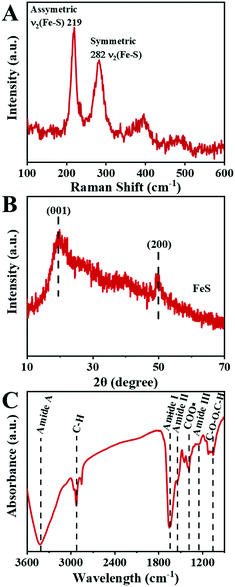
The microstructure information of the biosynthesized FeS NPs was obtained by SEM, TEM and SXM. The SEM image showed that many small particles were evenly anchored on the surface of bacterial cells (Fig. 3A and B). The nanoparticles display Fe- and S-elemental signals, implying the extracellular biosynthesis of FeS NPs (Fig. 3C). The average diameter of the biogenic FeS was found to be about 35 nm by measuring individual nanoparticles by SEM (Fig. 3D). According to the reported works,9 the size of the as-prepared FeS NPs might lead to high cellular uptake efficiency. Many nanoparticles on the surface of bacteria were observed from the TEM image (Fig. 3E), which was consistent with the results of SEM. The nanoparticles were also composed of Fe- and S-elements, suggesting that the FeS NPs were successfully synthesized by S. oneidensis MR-1 (Fig. 3F). Subcellular localization of Fe was further visualized by SXM. The L absorption edge energy of the Fe element was between 702 eV and 711 eV. The Fe element has different absorption contrast under different X-ray energy levels. When imaging cells at 702 eV, the Fe element was virtually transparent (Fig. 3H). While imaging cells at 711 eV, Fe could be clearly observed at both the extracellular region and cell surface (Fig. 3G). Because the Fe element strongly absorbs X-ray energy at 711 eV, we obtained the distribution of iron by subtracting the optical density of two images obtained at 711 eV (pre-edge) from that at 702 eV (on-edge) (Fig. 3I). The 3D S. oneidensis-FeS NPs are shown in the video (ESI Video 1†). The double energy contrast subtracting image further suggested that the biogenic FeS loaded on the cell surface and extracellular region of S. oneidensis MR-1.To verify the biosynthesis of FeS NPs, Raman spectroscopy of the S. oneidensis MR-1-FeS was performed (Fig. 4A). The Raman spectrum shows two prominent peaks at 219 and 282 cm−1 assigned to the characteristic Fe–S vibrations in mackinawite.30 The crystal structure information of the biosynthesized FeS NPs was obtained by XRD. The XRD pattern of the biogenic nanoparticles exhibited two characteristic peaks, which matched well with the typical peaks of the (0 0 1) and (2 0 0) facets of mackinawite FeS (JCPDS No. 15-0037) (Fig. 4B). The weak peak intensity and broad peaks indicated poor crystallinity, consistent with a previous study, and this might be ascribed to the neutral pH and short nanocrystal growth period.13,31 Such poor crystallinity properties of FeS NPs might favor ferrous release under acidic conditions,32 then triggering efficient Fenton reaction for effective cancer cell killing. Collectively, these results confirmed the formation of FeS NPs by S. oneidensis MR-1.
The TEM image, dynamic light scattering (DLS) results and zeta potential of the as-prepared FeS NPs were assayed (ESI, Fig. S3†). Considering that the isolated FeS NPs are naturally capped with proteins, we denote them as Bio-FeS NPs. Similar to that observed from the SEM image, the average size of the Bio-FeS NPs is about 32 nm (ESI, Fig. S3A and S3B†). The hydraulic radius of the Bio-FeS NPs (85.9 nm) is slightly bigger than those from TEM and SEM data (ESI, Fig. S3C†), which might be assigned to the naturally capped protein. Besides, the hydraulic radius of the Bio-FeS NPs within the proper range enables efficient uptake by tumors. The zeta potential of the Bio-FeS NPs was −6.5 mV.
To obtain the capped functional groups of the FeS NPs, FTIR was applied (Fig. 4C). The FTIR spectrum showed the characteristic peak at 1081 cm−1 owing to carbohydrate groups, those at 1403 cm−1 corresponding to carboxyl, and those at 2922 cm−1 assigned to C–H stretching vibrations. The distinct characteristic peaks at 3437 cm−1, 1648 cm−1, 1540 cm−1, and 1260 cm−1 were attributed to the amide group. The above results indicate that the Bio-FeS NPs were naturally capped with proteins, which would improve biocompatibility and water solubility.
Evaluation of extracellular Fenton capacity of biogenic FeS NPs
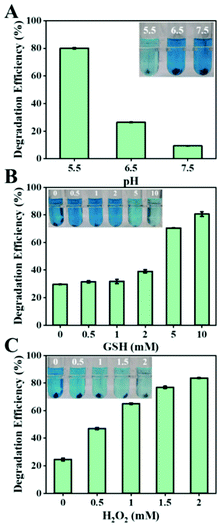
The tumor microenvironment possesses weakly acidic, high hydrogen peroxide, and high GSH properties, significantly different from those of the normal tissues. Therefore, we tested the Fenton capacity of biogenic FeS NPs under various conditions to assess whether they would respond to the TME. The Fenton properties of the biogenic FeS NPs were first evaluated by the degradation process of methylene blue (MB) with various pH values (5.5, 6.5, and 7.5) (Fig. 5A). After 4 h incubation, the characteristic absorption of MB at 665 nm decreased in all the groups, indicated that the biogenic FeS NPs could act as catalysts to induce Fenton reaction for ˙OH generation. Compared to pH 7.5 and pH 6.5 conditions, the MB degradation effect is better under acidic conditions (pH 5.5), revealing that the acidic conditions of TME facilitate FeS-based Fenton reaction. Meanwhile, the impact of GSH content on the Fenton properties of the biogenic FeS NPs was examined (Fig. 5B). After 4 h treatment, MB degradation increased with GSH concentration enhancement. The highest MB degradation efficiency was achieved in 10 mM GSH, implying that the high GSH content in cancer cells favors FeS NP-based Fenton reaction. Similarly, a dose-dependent degradation of MB at a H2O2 concentration of 0–2 mM was observed (Fig. 5C). Overall, the best MB degradation effect was achieved under pH 5.5, 10 mM GSH, and 2 mM H2O2 conditions. Such conditions coincide well with the TME. These results imply that the as-prepared FeS NPs might generate tremendous ROS under the TME conditions, which potentially endow them with the specified therapeutic property.Three-dimensional intracellular location of Bio-FeS NPs
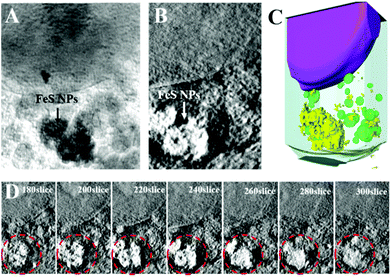
To explore the application prospects of Bio-FeS NPs in cancer treatment, we first tested their cellular uptake and locations. SXM, as a powerful and nondestructive imaging technique, can visualize the interactions between nanomaterials and cells at high resolution.30 Attracted by this superior property, the intracellular distribution of the Bio-FeS NPs in 4T1 cells was captured by SXM. After incubating 4T1 cells with the Bio-FeS NPs (10 μg mL−1) for 12 h, SXM assay was performed. The absorption difference between the cell structure and Bio-FeS NPs can be observed from the SXM image. As shown in Fig. 6, the Bio-FeS NPs were accumulated in the cytoplasm, forming a ring-shaped structure, which indicated that the Bio-FeS NPs could be ingested by 4T1 cells. Such good cell uptake is favorable for cancer treatment. A similar distribution of Gd@C82(OH)22 NPs was reported previously, which proposed that the accumulation location was lysosomes.31 Thus, Bio-FeS NPs can be taken up by cancer cells, which is the basis for cancer therapy.In vitro cancer therapy of Bio-FeS NPs
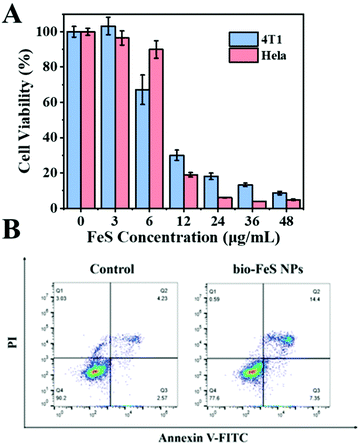
To evaluate the effectiveness of the Bio-FeS NPs in cancer treatment, 4T1 cells and HeLa cells were exposed to the Bio-FeS NPs at different concentrations (0, 3, 6, 12, 24, 36, and 48 μg mL−1) (in equivalent Fe concentration) for 24 h. The CCK-8 assay was used to test the cell viability. As shown in Fig. 7A, dose-dependent cell viability was observed. Higher doses of Bio-FeS NPs resulted in more efficient killing of cancer cells. With the FeS NP concentration increase to 12 μg mL−1, the cell viability decreased to 30%. Notably, this content was significantly lower than those in the reported works (ESI, Table S1†), revealing the good performance of the Bio-FeS NPs. Furthermore, the universality of the Bio-FeS NPs for cancer therapy was explored with HeLa cells. Consistently, high anticancer activity was observed when the concentration was only 12 μg mL−1. Besides, the half-maximal inhibitory concentration (denoted as IC50) of the Bio-FeS NPs was calculated to be about 9 μg mL−1 (ESI, Fig. S4†). The oxidative damage of the Bio-FeS NPs to 4T1 cells was further identified by cell apoptosis assay (Fig. 7B). Cell apoptosis was examined by flow cytometric analysis after Annexin V-FITC/PI staining. Compared with the control group, the experimental group with the Bio-FeS NPs exhibited enhanced HeLa cell apoptosis. These results indicate that the Bio-FeS NPs have extremely high killing effects on cancer cells, implying a promising future for their application in biomedicine.Considering that the BioFeS NPs are naturally capped with proteins, the effect of the proteins adsorbed by FeS NPs on cell viability was explored. To uncover the functions of proteins, we first detected the protein content in a 15 μg mL−1 FeS NP surface (ESI, Fig. S5A†). Then 4T1 cells were treated with an equivalent dose of protein extracted from S. oneidensis MR-1 (ESI, Fig. S5B†). The cell viability was only 8% after being treated with 15 μg mL−1 Bio-FeS NPs, which contain approximately 50 μg mL−1 protein. In contrast, only adding proteins is insufficient to kill cancer cells, indicating the good biocompatibility of capped proteins. Indeed, the biosafety of S. oneidensis MR-1 has been proved in previous works.32 In addition, when the capping protein was disrupted by proteinase K, the form of the as-prepared FeS NPs changed to sulfur (ESI, Fig. S5C and S5D†). Thus, the protein corona act as a stabilizer to ensure Fenton performance.
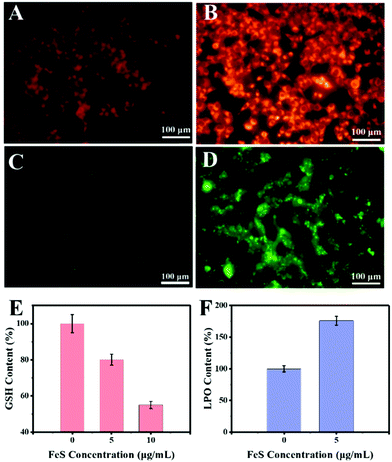
To uncover the mechanism underlying the anticancer action at the cellular level, the Fe2+ distributions were first detected using the Ferro orange probe, the Fe2+ responsive dye (Fig. 8A). The orange fluorescence was almost absent in the control group. In contrast, a markedly increased fluorescence was observed in HeLa cells with 10 μg mL−1 Bio-FeS NPs, indicating the formation of Fe2+ in the experimental group (Fig. 8B). The released Fe2+ might trigger the Fenton reaction, resulting in increased ROS. To verify this, the DCFH-DA probe, which can be oxidized into green fluorescence DCF by ˙OH, was used for staining the intracellular ROS induced by the FeS NPs. A strong green fluorescence signal was emitted in the intracellular region of cells treated with 10 μg mL−1 FeS NPs (Fig. 8D), but absent in the control cancer cells (Fig. 8C). These results reveal the generation of ROS catalyzed by the Bio-FeS NPs as a consequence of the Fenton process.
The GSH depletion and LPO of the cells after different treatments were further assayed. According to the GSH result (Fig. 8E), the Bio-FeS NPs significantly decreased the GSH content. Meanwhile, a positive relationship between GSH depletion and the content of Bio-FeS NPs was observed. Moreover, the effect of the Bio-FeS NPs on LPO generation was determined. Bio-FeS NP addition resulted in progressively enhanced LPO generation (Fig. 8F), which was indicative of ferroptosis. Taken together, the high anticancer ability of the Bio-FeS NPs at low concentration might be ascribed to the released Fe2+, elevated intracellular ROS, GSH consumption, and LPO generation.
In vivo therapeutic effects
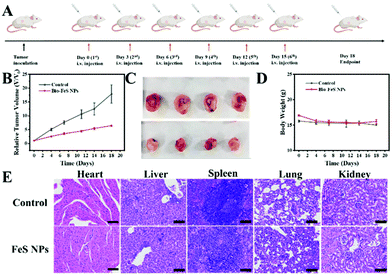
Encouraged by the excellent in vitro therapeutic performance of the Bio-FeS NPs, the in vivo anti-tumor efficacy of the Bio-FeS NPs was further evaluated. 4T1 tumor-bearing nude mice were constructed as a model. When the tumor volume reached approximately 100 m3, the mice were randomly divided into two groups. Following the schematic illustration in Fig. 9A, the two groups were injected with PBS (control group) and 0.5 mg kg−1 Bio-FeS NPs (experimental group), respectively. Compared with the control group, a strong tumor-inhibiting effect was observed in the experimental group supported by the decreased tumor volume (Fig. 9B). The highest tumor inhibition rate reached 58 wt% at an extremely low dose of FeS NPs (0.5 mg kg−1), demonstrating the excellent therapeutic property of Bio-FeS NPs in tumor suppression. A similar trend was visualized from the representative photographs of the tumor after different treatments (Fig. 9C). Hematoxylin and eosin (H&E) staining images of tumor sections further evidence the efficient anti-tumor efficacy of the Bio-FeS NPs (Fig. 9E). Furthermore, no apparent body weight loss was found among the different treatment groups (Fig. 9D), indicating no obvious acute toxic side effects of Bio-FeS. After two weeks of treatment, H&E staining images of the major organs (heart, liver, spleen, lungs, and kidneys) from 4T1 tumor-bearing mice revealed no significant variation (Fig. 9E), further demonstrating the biosafety of the Bio-FeS NPs. In short, the Bio-FeS NPs exhibited excellent anti-tumor efficacy and good biocompatibility.Indeed, many microbes have been employed for FeS NP biosynthesis (ESI, Table S2†), while the corresponding regulation strategy is limited. In our work, the biosynthesis rate and yield of FeS NPs can be tuned simply by altering the precursor concentrations. More importantly, the application of Bio-FeS NPs focused on microbial fuel cells and contaminant degradation. To the best of our knowledge, this is the first example of exploring their application potential in biomedicine. The as-prepared FeS NPs exhibited good anticancer activity.
Conclusions
In summary, we have developed a new strategy to regulate the biosynthesis of FeS nanomedicine. Taking advantage of the biosynthesis process, hydrophilic FeS NPs with distinguished Fenton properties were successfully prepared by S. oneidensis MR-1 in an eco-friendly and facile way. Moreover, tuning the synthesis yield and rate of biogenic FeS NPs was realized simply by altering Fe precursor concentrations. Notably, the as-prepared Bio-FeS NPs exhibited good anticancer activity toward both 4T1 and HeLa cells with extremely low concentrations (∼12 μg mL−1). The excellent cancer therapy performance of the Bio-FeS NPs is attributed to the releasing of Fe2+ and the generation of ROS. This work is the first example to explore the application prospects of Bio-FeS NPs in the biomedical field. Biogenic FeS NPs may have promising applications in biomedicine. The proposed biosynthesis provides a new avenue for nanomedicine fabrication at large scale and under environmentally benign conditions.Conflicts of interest
The authors declare no competing financial interest.Acknowledgements
This work was supported by the National Key Research and Development Program of China (2017YFA0402904), National Natural Science Foundation of China (21907087, 11775224 and U2032148), Natural Science Foundation of Anhui Province (1908085MB31), Fundamental Research Funds for the Central Universities (WK2060000003 and WK2310000100), and The Youth Innovation Promotion Association, CAS (2020457). The authors thank Prof. Liang Shi at the China University of Geosciences for providing Shewanella oneidensis strains.References
- Y. Choi and S. Y. Lee, Nat. Rev. Chem., 2020, 4, 638–656 CrossRef CAS.
- J. Zhou, Y. Yang and C. Y. Zhang, Chem. Rev., 2015, 115, 11669–11717 CrossRef CAS PubMed.
- W. Wang, X. Liu, X. Zheng, H. J. Jin and X. Li, Adv. Healthcare Mater., 2020, 9(22), 1–24 CAS.
- L. J. Tian, Y. Min, W. W. Li, J. J. Chen, N. Q. Zhou, T. T. Zhu, D. B. Li, J. Y. Ma, P. F. An, L. R. Zheng, H. Huang, Y. Z. Liu and H. Q. Yu, ACS Nano, 2019, 13, 5841–5851 CrossRef CAS PubMed.
- K. K. Sakimoto, A. B. Wong and P. Yang, Science, 2016, 351, 74–77 CrossRef CAS PubMed.
- W. Wei, P. Sun, Z. Li, K. Song, W. Su, B. Wang, Y. Liu and J. Zhao, Sci. Adv., 2018, 4, eaap9253 CrossRef PubMed.
- L. J. Tian, W. W. Li, T. T. Zhu, G. H. Zhao, X. W. Liu, J. C. Dong, P. F. An, J. Y. Ma, F. Shen, C. Qian, B. Hu and H. Q. Yu, J. Mater. Chem. A, 2019, 7, 18480–18487 RSC.
- Y. Choi, T. J. Park, D. C. Lee and S. Y. Lee, Proc. Natl. Acad. Sci. U. S. A., 2018, 115, 5944–5949 CrossRef CAS PubMed.
- L. J. Tian, N. Q. Zhou, L. H. Yu, T. T. Zhu, W. W. Li, P. F. An, J. Y. Ma and C. B. Xiang, Green Chem., 2019, 21, 6727–6730 RSC.
- X. M. Wang, L. Huang, Y. J. Wang, L. Xuan, W. W. Li and L. J. Tian, Chem. Eng. J., 2021, 405, 126711 CrossRef CAS.
- W. A. El-Said, H. Y. Cho, C. H. Yea and J. W. Choi, Adv. Mater., 2014, 26, 910–918 CrossRef CAS PubMed.
- I. Kolinko, A. Lohsse, S. Borg, O. Raschdorf, C. Jogler, Q. Tu, M. Posfai, E. Tompa, J. M. Plitzko, A. Brachmann, G. Wanner, R. Mueller, Y. Zhang and D. Schueller, Nat. Nanotechnol., 2014, 9, 193–197 CrossRef CAS PubMed.
- J. S. Gescher, C. D. Cordova and A. M. Spormann, Mol. Microbiol., 2008, 68, 706–719 CrossRef CAS PubMed.
- Y. F. Yang, J. R. Chen, D. R. Qiu and J. Z. Zhou, BMC Microbiol., 2013, 13(267), 1–8 Search PubMed.
- Y. C. Huo, W. W. Li, C. B. Chen, C. X. Li, R. Zeng, T. C. Lau and T. Y. Huang, Enzyme Microb. Technol., 2016, 95, 236–241 CrossRef CAS PubMed.
- Y. Y. Yu, Q. W. Cheng, C. Sha, Y. X. Chen, S. Naraginti and Y. C. Yong, Chem. Eng. J., 2020, 379, 122404 CrossRef CAS.
- H. Veeramani, A. C. Scheinost, N. Monsegue, N. P. Qafoku, R. Kukkadapu, M. Newville, A. Lanzirotti, A. Pruden, M. Murayama and M. F. Hochella Jr., Environ. Sci. Technol., 2013, 47, 2361–2369 CrossRef CAS PubMed.
- X. C. Jiang, J. S. Hu, A. M. Lieber, C. S. Jackan, J. C. Biffinger, L. A. Fitzgerald, B. R. Ringeisen and C. M. Lieber, Nano Lett., 2014, 14, 6737–6742 CrossRef CAS PubMed.
- X. Deng, N. Dohmae, A. H. Kaksonen and A. Okamoto, Angew. Chem., 2020, 59, 5995–5999 CrossRef CAS PubMed.
- Z. Shen, T. Liu, Y. Li, J. Lau, Z. Yang, W. Fan, Z. Zhou, C. Shi, C. Ke, V. I. Bregadze, S. K. Mandal, Y. Liu, Z. Li, T. Xue, G. Zhu, J. Munasinghe, G. Niu, A. Wu and X. Chen, ACS Nano, 2018, 12, 11355–11365 CrossRef CAS PubMed.
- C. Liang, X. L. Zhang, M. S. Yang and X. C. Dong, Adv. Mater., 2019, 31(1904197), 1–25 Search PubMed.
- P. Wang, M. Xiao, H. Pei, H. Xing, S.-H. Luo, C.-K. Tsung and L. Li, Chem. Eng. J., 2021, 415, 129036 CrossRef CAS.
- C. Dong, W. Feng, W. Xu, L. Yu, H. Xiang, Y. Chen and J. Zhou, Adv. Sci., 2020, 7, 2001549 CrossRef CAS PubMed.
- B. B. Ding, P. Zheng, P. A. Ma and J. Lin, Adv. Mater., 2020, 32, 1905823 CrossRef CAS PubMed.
- J. H. Lee, M. G. Kim, B. Yoo, N. V. Myung, J. Maeng, T. Lee, A. C. Dohnalkova, J. K. Fredrickson, M. J. Sadowsky and H. G. Hur, Proc. Natl. Acad. Sci. U. S. A., 2007, 104, 20410–20415 CrossRef CAS PubMed.
- L. J. Tian, W. W. Li, T. T. Zhu, J. J. Chen, W. K. Wang, P. F. An, L. Zhang, J. C. Dong, Y. Guan, D. F. Liu, N. Q. Zhou, G. Liu, Y. C. Tian and H. Q. Yu, J. Am. Chem. Soc., 2017, 139, 12149–12152 CrossRef CAS PubMed.
- B. Cao, Z. Zhao, L. Peng, H.-Y. Shiu, M. Ding, F. Song, X. Guan, C. K. Lee, J. Huang, D. Zhu, X. Fu, G. C. L. Wong, C. Liu, K. Nealson, P. S. Weiss, X. Duan and Y. Huang, Science, 2021, 373, 1336–1340 CrossRef CAS PubMed.
- X. Wu, F. Zhao, N. Rahunen, J. R. Varcoe, C. Avignone-Rossa, A. E. Thumser and R. C. T. Slade, Angew. Chem., Int. Ed., 2011, 50, 427–430 CrossRef CAS PubMed.
- J. Liu, Y. Zheng, Z. Hong, K. Cai, F. Zhao and H. Han, Sci. Adv., 2016, 2, e1600858 CrossRef PubMed.
- J. Ding, Y. Guan, Y. Cong, L. Chen, Y. F. Li, L. Zhang, L. Zhang, J. Wang, R. Bai, Y. Zhao, C. Chen and L. Wang, Anal. Chem., 2020, 92, 975–982 CrossRef CAS PubMed.
- S. Yao, J. Fan, Z. Chen, Y. Zong, J. Zhang, Z. Sun, L. Zhang, R. Tai, Z. Liu, C. Chen and H. Jiang, IUCrJ, 2018, 5, 141–149 CrossRef CAS PubMed.
- Q. W. Chen, J. W. Wang, X. N. Wang, J. X. Fan, X. H. Liu, B. Li, Z. Y. Han, S. X. Cheng and X. Z. Zhang, Angew. Chem., 2020, 59, 21562–21570 CrossRef CAS PubMed.
Footnote |
| † Electronic supplementary information (ESI) available. See DOI: 10.1039/d1nr03591f |
| This journal is © The Royal Society of Chemistry 2021 |

