
 Open Access Article
 This Open Access Article is licensed under a
 Creative Commons Attribution 3.0 Unported Licence
Plasmonic enhancement of molecular hydrogen dissociation on metallic magnesium nanoclusters†
Oscar A.
Douglas-Gallardo
 ,
Connor L.
Box
and
Reinhard J.
Maurer
*
,
Connor L.
Box
and
Reinhard J.
Maurer
*
Department of Chemistry, University of Warwick, Gibbet Hill Road, Coventry, CV4 7AL, UK. E-mail: r.maurer@warwick.ac.uk
First published on 14th June 2021
Abstract
Light-driven plasmonic enhancement of chemical reactions on metal catalysts is a promising strategy to achieve highly selective and efficient chemical transformations. The study of plasmonic catalyst materials has traditionally focused on late transition metals such as Au, Ag, and Cu. In recent years, there has been increasing interest in the plasmonic properties of a set of earth-abundant elements such as Mg, which exhibit interesting hydrogenation chemistry with potential applications in hydrogen storage. This work explores the optical, electronic, and catalytic properties of a set of metallic Mg nanoclusters with up to 2057 atoms using time-dependent density functional tight-binding and density functional theory calculations. Our results show that Mg nanoclusters are able to produce highly energetic hot electrons with energies of up to 4 eV. By electronic structure analysis, we find that these hot electrons energetically align with electronic states of physisorbed molecular hydrogen, occupation of which by hot electrons can promote the hydrogen dissociation reaction. We also find that the reverse reaction, hydrogen evolution on metallic Mg, can potentially be promoted by hot electrons, but following a different mechanism. Thus, from a theoretical perspective, Mg nanoclusters display very promising behaviour for their use in light promoted storage and release of hydrogen.
1 Introduction
Plasmonic properties arise when specific nanostructured materials interact with incident electromagnetic radiation.1–4 This interaction produces a collective and coherent oscillation of conduction band electrons, a phenomenon known as localized surface plasmon resonance (LSPR).1–4 The associated optical absorption signal (LSPR band) is often broad and reaches a maximum when the incident light frequency (ωinc) is in resonance with the natural frequency of plasmonic excitation (ωLSPR) of the irradiated nanomaterial.1–4 This optical phenomenon leads to highly efficient light absorption transferring large amounts of energy into the nanomaterial. The absorption cross-section associated with these plasmonic materials is often several orders of magnitude larger than most organic dye molecules.1–3,5 Plasmonic nanomaterials have rapidly found different applications in several fields such as optical-sensors,6 enhanced spectroscopies,7 and even biomedical application.8Recently, it has been reported that some plasmonic materials are able to effectively produce highly energetic distributions of electron-hole-pair (EHP) excitations upon non-radiative decay associated with dephasing of the plasmonic excitation (Landau damping).5,9–14 EHPs act as hot-carriers and can potentially promote bond formation/dissociation events in molecules adsorbed on or nearby the plasmonic material. This is often discussed in terms of two possible mechanisms.13,14 EHPs created during the plasmon decay can lead to direct charge transfer into molecular states. This direct excitation mechanism depends strongly on the chemical interaction between the adsorbed molecule and the metal surface and is closely related to chemical interface damping (CID).14–18 CID arises from the hybridisation of adsorbate and metal states during molecular chemisorption and leads to a reduction of plasmonic excitation lifetime.14–16 Highly excited non-equilibrium EHPs created upon plasmon decay will subsequently thermalize into an equilibrium distribution associated with an elevated electronic temperature that is higher than the lattice temperature.1,4,13,19,20 These equilibrated hot electrons can exchange energy indirectly with adsorbates. Finally, this electronic subsystem can subsequently transfer its energy to the lattice subsystem by means of electron–phonon scattering.1,13,14 This last stage is often modelled by a two-temperature model (TTM) which connects the electronic and lattice subsystem by means of two non-linear coupled thermal diffusion equations.21 LSPR induced EHPs have shown to increase rates of important surface chemical reactions such as the CO2 reduction,22,23 H2O splitting24–26 and H2 dissociation reaction.27–29
Traditionally, noble metal (Au and Ag) nanostructures have been most widely studied as plasmonic catalyst materials primarily due to their chemical stability and characteristic optical response.1–4,8 Colloidal solutions of these plasmonic materials often exhibit a strong optical absorption band (LSPR band) which is located along the visible range of the electromagnetic spectrum.1–4 The plasmonic excitation frequency can be widely tuned by modifying the nanostructure morphology and its chemical environment,1–4,8 but is typically limited to wavelengths larger than 400 nm for these specific noble plasmonic metals. In recent years, the study of optical and electronic properties of non-standard plasmonic materials such as Al23,28–31 and Mg32–35 has gathered increasing interest as they can provide highly cost effective alternatives. Mg nanoclusters emerge as very attractive systems in the context of plasmonic hot-electron effects.32,33,35 Metallic Mg is an earth-abundant element that behaves as a pure plasmonic metal without sp to d interband transitions (like Au and Cu) due to lack of d-electrons in its electronic ground state band structure. The plasmonic response for this type of material is only due to sp-electrons and its dipole LSPR band can be easily detected even for relatively small particle size.36,37
From the point of view of catalysis, metallic Mg exhibits interesting hydrogenation chemistry with high reactivity towards forming hydride compounds (MgH2).32,35,38–41 Mg nanoparticles can switch from a metallic to an insulating state by simple uptake and release of molecular hydrogen.34,35,39,40 Magnesium can store a large amount of H atoms reaching up to 7.6% by weight as bulk material representing a promising, efficient and cost-effective alternative to store hydrogen molecules (chemical storage as metal hydride; chemisorption).41–47 However, the activation energy associated with the H2 dissociation reaction on metallic Mg surfaces (400 Å thick Mg film) is relatively high (0.75 ± 0.15) eV.38,44,48 Different strategies have been explored to increase the effectiveness of this chemical reaction including doping with transition metals and the use of nanostructured particles.41,45–47,49–51 However, the potential effect of the Mg plasmonic activity on this particular chemical reaction has not been fully explored. A suitable hot-carrier distribution can potentially help to promote dissociative hydrogen adsorption on or release of molecular hydrogen from magnesium.
We present a comprehensive computational study of the electronic and optical properties of a set of metallic Mg nanoclusters and periodic Mg(0001) slabs based on density functional theory (DFT) and time-dependent density functional tight-binding (TD-DFTB)52,53 calculations to simulate the optical absorption spectra and hot-electron distributions generated by incident light. We compare and contrast the optical properties of Mg with a conventional transition metal, namely Ag, before studying how hydrogen adsorption affects the plasmonic response of the nanoparticle. By analysis of the electronic structure and electron-nuclear response via electronic friction theory,54–56 we qualitatively assess the potential for plasmonic enhancement effects of dissociative hydrogen adsorption onto and hydrogen evolution from Mg nanoparticles and surfaces, which we discuss in the context of CID and Landau damping.
2 Results and discussion
2.1 Optical absorption spectra and hot-carrier distribution on Mg nanoclusters
The optical absorption response and ensuing hot-carrier distribution are explored for a selected set of icosahedral Mg nanoclusters. The hot-carrier distribution is produced under two different types of external electric fields, namely constant and pulsed irradiation (cf. section 4). The number of metallic atoms contained in each particle follow the natural progression of icosahedral structures (with magic numbers: 13, 55, 147, 309, 561, 923, 1415, 2057). The largest particle size that we have considered is ∼5 nm in diameter. The most stable crystal structure for Mg bulk is the hexagonal closest packed (hcp) configuration, however, for nanoscale sized particles, the icosahedral shape turns out to be the most stable geometric isomer.57,58Fig. 1 shows the optimized structures and the corresponding optical absorption spectra as calculated with the time-dependent density functional tight-binding (TD-DFTB) method (cf. section 4 for computational details). | ||
| Fig. 1 Schematic representation of the set of icosahedral Mg nanoclusters considered (labelled with the number of atoms) along with their respective optical absorption spectrum. An extra x-axis was included to show the wavelength of the respective dipole LSPR energy in units of nanometers. | ||
As can be seen in Fig. 1, the main spectroscopic features of the nanoclusters are located within a range of 3–5 eV (∼400–250 nm). The larger particles (561, 923, 1415 and 2057 atoms) are characterized by a strong single dipole LSPR band located at ∼4 eV (∼310 nm). The LSPR band shows a strong dependence on particle size for the smaller particles, with the LSPR band peaks shifting from 3.5 to 4.5 eV as a function of nanocluster size. For small particle sizes ranging from 55 to 309 atoms, we find a slight blue shift with increasing size. This may be related to a mixture of localised molecular and collective pseudo-plasmonic response. For larger nanocluster sizes, we observe a red shift, which is the expected behaviour for plasmonic response. This optical behaviour is somewhat different from the case of Ag where only a red-shift is observed when the particle size is increased.15 The excitation spectrum of the smallest Mg nanoparticle shows similarities with very small nanoclusters between 2–5 and ∼10–100 metallic atoms previously studied by correlated wavefunction theory59 and time-dependent DFT,36,37 respectively.
We further conduct an initial assessment of the EHP distribution of Mg produced under external laser irradiation (pulsed and continuous excitation). The underlying electronic dynamics associated with the plasmonic excitation, dephasing, and hot-carrier generation process are explored for a cluster with 1415 metallic atoms. Fig. 2 shows the EHP distribution that arises from the electronic dynamics following plasmonic excitation. A similar analysis has been conducted for noble metals in other recent reports.5,11,15 The population and depopulation dynamics of ground state molecular orbitals (MO) are distinguished with positive and negative population values, indicating hot electron and hot hole generation, respectively. These MO population differences are calculated with respect to the ground-state population at the initial time t = 0 (Δρii = ρii(t) − ρii(0)). This is generated for both a continuous (panel a) and pulsed laser (panel b) source of external electric field at the LSPR frequency (ωLSPR = 4.069 eV). Sources were chosen in order to cover two extreme cases. In both cases, the same electric field intensity (E0 = 0.02 V Å−1) was selected. The pulsed laser source used here is different from a Dirac δ pulse used to compute the optical absorption spectra in Fig. 1 (cf. section 4 for more details). For the pulsed source, the external electric field is modulated using a sin2 function with a laser duration of τ = 5 fs.
 | ||
| Fig. 2 Evolution of molecular orbital (MO) population at different time steps along the electronic dynamics with respect to the population at t = 0. Two different types of external perturbation laser are used: (a) constant and (b) pulsed. An icosahedral Mg nanocluster with 1415 metallic atoms is illuminated with both sinusoidal time-dependent and sin2 electric field tuned to the LSPR frequency (ωLSPR = 4.069 eV). The selected electric field intensity was 0.02 V Å−1. | ||
The electronic response of the Mg nanoparticle can be divided into two main stages. The first stage (highlighted in blue in Fig. 2) corresponds to plasmonic excitation located ∼1 eV above and below the Fermi energy and can be detected immediately after laser excitation has started. This particular time step is highlighted as it is close to the computed lifetime for plasmonic excitation associated with this Mg nanocluster (1.07 fs, vide infra). The second stage involves EHP excitations that expand rapidly to higher energies above and below the Fermi level, producing a transient population and depopulation of a manifold of molecular states that evolves as a function of time. This last stage can be seen more clearly when a pulsed laser source is used. In this case, the finite energy intake leads to a convergence of the distribution as the TD-DFTB simulation does not fully capture thermalisation due to electron–electron scattering effects (vide infra) and neglects equilibration with the lattice due to electron–phonon coupling. On the other hand, the continuous laser source steadily provides energy to the system and a continuous hot-carrier production is detected simultaneously with the plasmonic excitation.
Plasmonic properties can be harnessed for catalysis in a continuous and pulsed illumination regime.60 In both cases, the largest concentration of high-energy electrons builds up at ∼3 eV above the Fermi energy and the largest concentration of holes is produced at ∼1 eV below the Fermi level. This particular distribution of EHPs can be connected to the Mg electronic band structure, which exhibits weakly dispersed valence bands close to the Fermi energy between M and L and at Γ high symmetry points from which many electrons can be transferred into a high density of conduction bands at around 2 to 4 eV above the Fermi level (see ESI Fig. S1†).
The non-equilibrium electronic distribution at different time steps of the dynamics for both external perturbations are shown on a logarithmic y axis scale in ESI Fig. S3.† In this representation, equilibrium Fermi–Dirac distributions should appear as straight lines with the gradient governed by the effective electronic temperature. A quasi-equilibrium distribution can be found that ranges over few hundred meV above and below the Fermi level. Outside of this range, both illumination regimes generate highly non-equilibrium electron distributions that do not satisfy a Fermi–Dirac distribution. We find a characteristic steplike structure in the distribution with a step width of ∼4 eV. The non-equilibrium electronic distributions show the general features of ultrafast electron dynamics in metals reported from Boltzmann equation simulations.1,19,20 It is important to state that electronic thermalisation due to electron–electron scattering is not well described with the TD-DFTB method as it does not sufficiently capture the many-body correlation effects that give rise to such scattering events. For this reason, even long-time propagation for times beyond 200 fs do not show the electron thermalisation towards Fermi–Dirac distributions at elevated temperatures that is generally expected.4,13,14,61 However, it is illustrative to generate a rough estimate of the electronic temperature regime that we expect to reach upon equilibration by computing the slope associated with the external edge of the steplike structure. From ESI Fig. S3,† we estimate electronic temperature ranges of 9000 ± 3000 K and 4400 ± 600 K for constant and pulsed laser perturbation after about 100 and 240 fs, respectively. These values provide an estimate of the range of electronic temperatures that can be expected upon equilibration. We will subsequently use this in the discussion of plasmonic hydrogen evolution on Mg nanoparticles in section 2.3.
We have also explored the effect of particle size on hot-carrier generation. ESI Fig. S4† reports the electronic dynamics after 4.84 and 96.75 fs for Mg nanoclusters with 147, 309, 561, 923, 1415, and 2057 metallic atoms under constant illumination. All cluster sizes exhibit high energy hot electron generation around 4 eV. As we reduce the nanocluster size, the energy regime becomes more selective with a very pronounced peak between 3.5 and 4 eV for clusters with 147 and 309 atoms. The generation of hot electrons within a narrow energy regime could potentially be very useful for the selective activation of chemical reactions and suggests a potentially measurable dependence of this effect with respect to nanocluster size. Only clusters with 561 atoms or more exhibit the typical short-time plasmonic response of the EHP distribution close to the Fermi level. This plasmonic decay behaviour is fully established for larger clusters. Increasing the cluster size from 1415 to 2057 atoms does not further increase the population of hot electrons at 3.5 to 4 eV. This suggests that for Mg nanocluster sizes even larger than those considered here (diameter > 5 nm), the concentration of hot electrons may effectively decrease, which would affect the ability to activate surface chemical reactions by hot electron transfer. This size effect has been previously shown for Ag nanoparticles.62
2.2 Comparison of plasmonic response of Mg and Ag nanoclusters
We now briefly identify the similarities and differences in optical absorption response between metallic Mg nanoclusters and more conventional plasmonic metals such as Ag.5,15,63 The optical and electronic properties of icosahedral Mg and Ag nanoclusters with 1415 atoms are compared in Fig. 3. The optical response in both metals is characterized by a single clearly defined dipole LSPR band located at 2.71 and 4.07 eV for Ag and Mg, respectively. The main spectroscopic features of the Ag nanocluster are largely localised in the visible regime (2–3 eV), whereas for Mg they are in the UV region (3–5 eV). Another key difference is the line width associated with the LSPR band, which is significantly narrower in Ag than in Mg, associated with a longer lifetime of the LSPR in the case of Ag (vide infra). The absorption is much more intense for Mg than for Ag. With a strong plasmonic response in the UV range, Mg nanoclusters could potentially complement conventional plasmonic materials, which typically absorb in the visible or near UV range.1–4,32,35 | ||
| Fig. 3 Optical absorption spectra (top panel) and hot-carriers distribution (bottom panel) for a Ag (black line) and Mg (red line) nanocluster with 1415 metallic atoms. The MO population change for both systems was obtained at 43.6 fs under a constant laser source. Both profiles were normalized for their respective density of states (DOS). Inset: Fitting of the absolute value of the dipole moment signal in x-direction for a Ag (black line) and Mg (red line) nanocluster with 1415 metallic atoms when these are illuminated at their respective plasmonic frequencies under constant laser source. | ||
In order to further characterize the plasmonic behaviour of Mg nanoclusters, we report the homogeneous linewidth (Γ) and lifetime (T2) associated with its plasmonic excitation. The homogeneous linewidth can be calculated by fitting the time-dependent dipole moment response (μ(t)) when the nanostructure is illuminated with a sinusoidal time-dependent electric field as an external perturbation.15,31 The absolute value of the dipole moment and its respective fitting curve are shown in the top part of Fig. 3 as an inset. The raw dipole moment response for both metals is shown in ESI Fig. S5.† The homogeneous linewidth and lifetime for Ag and Mg nanoclusters computed in this way are ΓAg = 144.17 meV (9.13 fs) and ΓMg = 1227.61 meV (1.07 fs), respectively. The homogeneous linewidth computed for the Mg nanoclusters with 1415 metallic atoms is several times larger than that for the Ag nanocluster. This suggests that plasmonic dephasing occurs much more efficiently in nanostructured Mg than in Ag. An important quantity that can be associated with the homogeneous linewidth (Γ) is the quality factor (Q) which is defined as Q = ELSPR/Γ.64,65 This quantity accounts for the extent of the local field enhancement (∼Q4) and can be used as a metric to judge the performance of a material for plasmonic applications such as surface-enhanced Raman spectroscopy (SERS) and near-field fluorescence quenching.64,65 The computed values for Ag and Mg nanoclusters with 1415 atoms are QAg = 18.80 and QMg = 3.32. These values indicate that the Ag nanocluster can potentially produce higher local field enhancement than Mg. On the other hand, the Mg nanoclusters show a LSPR in the UV region that efficiently produces high energy hot electrons where Ag or Au are plasmonically inactive. Therefore, specifically in the context of hot electron chemistry, Mg may represent a suitable alternative to conventional plasmonic materials.
Finally, we compare the ability to generate energetic EHPs for Mg and Ag nanoclusters in Fig. 3b. Ag posseses a highly localised DOS below the Fermi level associated with the d band, whilst its DOS above the Fermi level is close to constant. Mg on the other hand shows a DOS that increases monotonically with the square root of energy as is expected for a metal with almost free electrons (see ESI Fig. S1†). For a fair comparison between both metals, the hot-carrier distribution was normalized by their respective DOS computed at the DFTB level (ΔρNormii). The non-normalized hot-carrier distribution is shown in ESI Fig. S6.† Both metals exhibit a similar distribution of hot holes, but differ in the hot electrons that can be generated. In the case of Mg, the highest concentration of hot electrons is produced in the range of 3–4 eV, whereas Ag produces a high concentration of hot electrons at ∼2.5 eV. In summary, the LSPR band of Mg nanoclusters has a much shorter lifetime than Ag and produces a broader distribution that reaches electron energies of up to 4 eV.
2.3 Plasmonic enhancement of hydrogen dissociation on Mg nanoclusters
Metallic Mg is highly reactive and readily forms a surface hydride when exposed to molecular hydrogen (MgH2).38,40,41,43 This property has been discussed in the literature in the context of hydrogen storage.32,34,35,39 In the following, we will interpret the predicted optical properties of Mg nanoclusters in the context of plasmonic enhancement of hydrogen dissociative adsorption and associative desorption (hydrogen evolution). In the previous sections, we have shown that LSPR excitation of Mg nanoclusters produces hot electrons with energies of up to 4 eV. By analysing the electronic structure and nonadiabatic coupling of adsorbed hydrogen on Mg, we will study if these hot electrons can efficiently couple with adsorbate degrees of freedom.We first turn our attention to the effect of hydrogen adsorption on the optical properties of Mg nanoclusters. Fig. 4 shows how hydrogen adsorption changes the optical absorption spectrum and hot carrier distributions of a 561 atom Mg nanocluster. We compare the absorption spectrum of the bare cluster, with the spectrum obtained for clusters covered by physisorbed molecular hydrogen H2 and chemisorbed hydrogen atoms. We choose 59 H2 molecules and 118 H atoms to decorate the nanoparticle at a random set of positions that would be filled by the metal atom shell of the next largest icosahedral particle (923 Mg atoms). In all cases, stable absorption geometries have been obtained by relaxing the structures of the adsorbate atoms while keeping the previously optimized Mg atoms frozen in their positions. This allows a consistent comparison with the naked Mg nanoclusters by avoiding any surface relaxation effects. The optical and electronic properties associated with a full optimization of hydrogen covered nanocluster are discussed in the ESI in Fig. S11.† We stress that determining the H adsorption positions on Mg is a challenge.46 Our approach represents an initial assessment to evaluate the effect of H adsorption on the plasmonic properties of Mg.
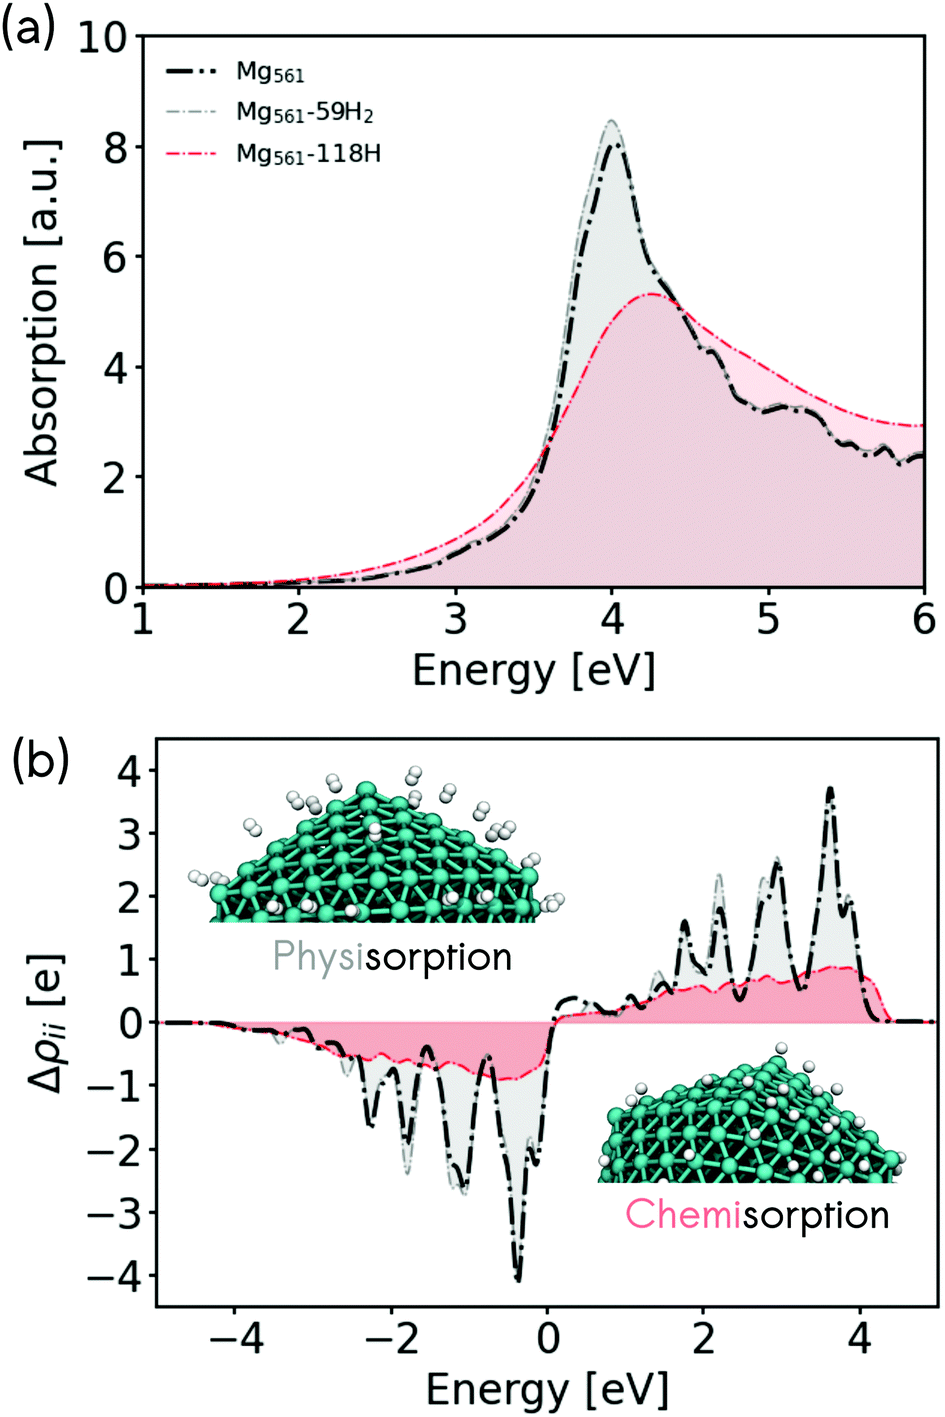 | ||
| Fig. 4 (a) Optical absorption spectrum and (b) hot-carrier distributions for a naked Mg nanocluster (dotted black line) with 561 metallic atoms, a Mg nanocluster with 59 H2 molecules adsorbed (dotted gray line), and with 118 adsorbed H atoms (dotted red line). The hot-carrier distributions were computed after 96.75 fs of electron dynamics with a constant laser source at the respective plasmonic frequency. | ||
In the case of molecular hydrogen physisorption, we find almost no effect on the LSPR band or on the EHP distribution. As can be seen in Fig. 4b, the hot-electron distribution for the physisorbed case still leads to hot-electrons with energies of up to ∼4 eV. On the other hand, a very strong CID effect is found in the case of chemisorbed hydrogen atoms on Mg, which reduces the LSPR lifetime (increase of the linewidth) and induces a blue-shift of the maximum of the LSPR band. This optical behavior is opposite to what was found for Ag nanoclusters, where strongly hybridised adsorbates produced a red-shift of the LSPR band.15 Likewise, the chemisorption of hydrogen atoms reduces the number of hot electrons produced (Fig. 4b), but reaches slightly higher hot electron energies.
Molecular hydrogen dissociation is a highly activated process on Mg. We have calculated a minimum energy path for the dissociative adsorption reaction of a small Mg nanocluster (55 atoms) and a p(3 × 3) Mg(0001) periodic surface slab using DFT (see Fig. 5a and ESI Fig. S7a†). Along this path, we identify three key geometries, the initial physisorbed state (IS), the transition state (TS), and the final chemisorbed state (FS). We find an activation energy of 0.71 eV and 0.89 eV for hydrogen dissociation on the nanocluster and the surface, respectively. This is in good agreement with a measured activation energy of 0.75 ± 0.15 eV (ref. 38) and with other theoretical reports.43,44,48 We further analyse the electronic structure of the 3 key geometries by visualising the projected DOS (pDOS) associated with a single physisorbed H2 molecule on Mg nanoparticle and on a clean Mg(0001) surface in ESI Fig. S8.† In both cases, the IS shows little hybridisation and state coupling. The unoccupied σ* state of H2 shows some level of state splitting in the range of 3 to 6 eV above the Fermi level, which suggests some coupling to metallic states. This is in contrast to the FS, where the projected DOS shows that the electronic states of adsorbed hydrogen atoms strongly couple to the metallic states of Mg leading to a homogeneous distribution of H contribution across a wide range of energies.
 | ||
| Fig. 5 (a) Minimum energy path (MEP) for the molecular hydrogen dissociation reaction on a Mg nanocluster with 55 metallic atoms and the (b) vibrational relaxation rates of molecular adsorbate motion due to hot electrons for geometries along this reactive path. Rates are given along internal coordinates of the molecule defined in ref. 72. Inset: Electronic temperature computed for Mg by means of TTM at three different laser fluences. | ||
For plasmonic enhancement of hydrogen dissociation on Mg nanoclusters, hot electrons need to be able to effectively transfer into the antibonding σ* MO of a physisorbed H2 molecule, which requires sufficient molecule-metal coupling and alignment of the molecular levels with the energetic distribution of hot electrons created by LSPR decay. Both requirements are reached for Mg nanoclusters. Hot electrons are efficiently created with high energies of 3–4 eV for a wide range of nanocluster sizes, which is an energy region that overlaps with unoccupied adsorbate states. Therefore, our calculations point towards effective plasmonic enhancement of hydrogen dissociation on Mg nanoclusters and surfaces, which is yet to be corroborated in experiments.
2.4 Plasmonic enhancement of hydrogen evolution from Mg nanoclusters
To address the question if plasmonic excitation can also enhance hydrogen evolution, we need to study the reverse reaction, namely the recombination of chemisorbed H atoms to molecular hydrogen. Here, the situation is less clear as the electronic states of chemisorbed hydrogen atoms are heavily hybridised and homogeneously embedded into the DOS of the metal (see ESI Fig. 8†). Therefore, there are no clear resonances which promote the reaction. This is a case that is well described by Fermi's golden rule where EHPs will couple with hydrogen atom motion proportional to the magnitude of the DOS and the nonadiabatic coupling strength between molecular motion and electronic states.54,66 In this limit, nonadiabatic energy dissipation effects during dynamics on surfaces can be described by molecular dynamics with electronic friction (MDEF),55,67 where we describe the effect of EHPs on molecular motion as frictional and random force governed by an electronic friction tensor. This approach is well justified and common for the study of hydrogen atom dynamics on metals68,69 and has also been applied to study light driven diffusion and desorption dynamics in combination with TTM.70,71 Using first order time-dependent perturbation theory on Kohn–Sham DFT, we can calculate the relaxation rates and vibrational lifetimes associated with different directions of atomic and molecular motion along the minimum energy path.56In Fig. 5b and ESI Fig. S7b,† we report the nonadiabatic relaxation rates of hydrogen motion due to coupling with EHPs along the minimum energy path of H2 dissociation. Similar to the previously reported case of H2 dissociation on Ag(111), we find the strongest coupling to EHPs for the intramolecular stretch motion of H2 (Γdd) at the TS,56 however the relaxation rate on the Mg nanocluster and the Mg(0001) surface is significantly higher reaching about 8 ps−1, which corresponds to a vibrational lifetime of the internal stretch of about 100 fs. In the FS, nonadiabatic relaxation rates are comparable between Ag(111) and Mg(0001) with the biggest components of the relaxation rate tensor corresponding to about 2 ps−1 (or a lifetime of 0.5 ps).
We can use this number for an approximate calculation of how much energy LSPR excitation can transfer into an adsorbed hydrogen atom. We do this by performing Langevin dynamics within MDEF where we neglect the underlying potential energy surface and take the friction coefficient that describes the coupling between hot electrons and adsorbate as constant. We couple these equations with the simulated TTM temperature profiles shown in the inset of Fig. 5 to mimic how the electronic temperature changes as a function of time. By propagating the relevant equation in time, we can calculate the kinetic energy that will be transferred from the EHPs into the H atoms (for details see ESI section S9†).73 As shown in the inset of Fig. 5b, depending on the laser fluence, electronic temperatures of 2000–8000 K can be generated (see ESI section S8† for details). According to the relaxation rates we find for the FS in Fig. 5, we select a friction coefficient that corresponds to a relaxation rate of 2 ps−1. We find that a laser pulse with a raw laser fluence of 10 J m−2 (100 J m−2) leads to peak electronic temperatures of 2500 K (8000 K) and an increase of hydrogen kinetic energy by 0.17 eV (0.55 eV) over 250 fs. The DFT-PBE predicted energy required to overcome the barrier for desorption is 0.71 eV and 0.89 eV on the 55 atom nanocluster and the Mg(0001) surface slab, respectively. These results suggest that significant H2 desorption should be observed for fluences between 50–100 J m−2 as two H atoms will be able to gain sufficient energy to overcome the barrier for hydrogen evolution. Fluences in this range can be achieved by laser irradiation and have been reported previously in ultrafast laser driven photodesorption studies.74–76 We note that this simple calculation neglects the underlying energy landscape and other effects, such as the dependence of nonadiabatic coupling rates γ on the coordinates and the electronic temperature.54,77
3 Conclusion
Earth-abundant materials are becoming increasingly important as catalysts as they are more cost effective than traditional catalyst materials. In the context of plasmonic catalysis, Mg nanoclusters may provide interesting complementary properties to conventional plasmonic materials such as gold and silver. In this work, we study the plasmonic properties of Mg nanoclusters using electronic structure and TD-DFTB calculations, with a particular focus on how the plasmonic behaviour could be used to catalyze hydrogen absorption and release in the context of hydrogen storage.Electron dynamics simulations show that Mg nanoclusters are able to produce hot-carrier distributions with hot electrons at energies of ∼4 eV. Therefore Mg nanoclusters produce higher concentrations of high energy hot electrons than silver nanoclusters of the same size. We have studied the optical absorption properties and the hot-carrier production on pristine and hydrogen-covered Mg nanoclusters of various size. By analysis of the electronic structure of physisorbed molecular hydrogen and chemisorbed atomic hydrogen on Mg, we conclude that it is highly likely that hydrogen dissociation can be selectively promoted by plasmonic excitation of Mg nanoclusters. On the other hand, hydrogen evolution from Mg nanoclusters is expected to be less sensitive to plasmonic excitation but generally effective in the presence of high temperature thermalised hot electrons at least for an early H adsorption stage where the plasmonic properties and metallic character are still held. This scenario can occur during constant illumination or local surface heating. As the dissociative adsorption and hydrogen evolution reactions couple to hot electrons differently, we speculate that it may be possible to realise experimental strategies where one or the other are more preferentially promoted. Our results confirm that nanostructured metallic Mg is a promising plasmonic material for applications in photocatalysis and hydrogen storage.
4 Computational methods
4.1 Electronic structure of Mg nanoclusters
The ground-state electronic structure of Mg nanoclusters has been computed using a self-consistent-charge density-functional-tight-binding (SCC-DFTB) approach.78–80 This method is based on a second order expansion of the Kohn–Sham DFT total energy around a non-interacting reference density built from a superposition of atomic densities.78–80 The SCC-DFTB method has been successfully employed to describe the electronic structure and quantum properties of large organic, inorganic and biological systems in the past.80–82 This semi-empirical method can overcome inherent computational limitations associated with DFT calculations.80–83 We employ the DFTB+ package52,84 to describe the ground-state and time-dependent electronic properties of Mg nanoclusters. The 3ob-3-1 DFTB85 parameter set is used and the reliability in predicting band structure and DOS for bulk Mg has been verified against DFT calculations using the FHI-Aims86 quantum chemistry package and the Perdew, Burke, and Ernzerhof (PBE) functional87 (see validation section in ESI and Fig. S1†). This validation study was also extended to compute the density of states (DOS) associated with very small Mg nanoclusters containing 13, 55, 147, 309 atoms (see ESI Fig. S2†).4.2 Electron dynamics
The 2020 release version of DFTB+ has been used52,53 to simulate the electron dynamics associated with the plasmonic excitation and thus to obtain the optical absorption spectra and other related dynamics properties such as the hot-carrier distribution and the plasmonic lifetime. This is made possible with a new implementation to describe the electron dynamics based on time-dependent SCC-DFTB (TD-SCC-DFTB).52,53 Within this theoretical framework, the electron dynamics is driven under the influence of an external time-varying potential (Vext(t)) or electric field (E(t))| H(t) = HGS + Vext(t) = HGS − E(t)μ | (1) |
![[thin space (1/6-em)]](https://www.rsc.org/images/entities/char_2009.gif) sin(ωMgLSPRt)) in tune with the plasmonic frequency was selected as external perturbation to drive the electronic dynamics and to calculate different emerging dynamical properties such as the plasmonic excitation lifetime and the hot-carrier distribution. The f(t) function is used to modulate the external electric field for the second type of external perturbation. Two different shapes have been considered, a continuous laser source with f(t) = 1 and a pulsed laser source with f(t) = sin2(π(t − t0)/τ) if t0 < t < t0 + τ and f(t) = 0 otherwise.52 All nuclear positions have been frozen at their respective optimized geometries during the electron dynamics simulations.
sin(ωMgLSPRt)) in tune with the plasmonic frequency was selected as external perturbation to drive the electronic dynamics and to calculate different emerging dynamical properties such as the plasmonic excitation lifetime and the hot-carrier distribution. The f(t) function is used to modulate the external electric field for the second type of external perturbation. Two different shapes have been considered, a continuous laser source with f(t) = 1 and a pulsed laser source with f(t) = sin2(π(t − t0)/τ) if t0 < t < t0 + τ and f(t) = 0 otherwise.52 All nuclear positions have been frozen at their respective optimized geometries during the electron dynamics simulations.
4.3 CI-NEB and electronic friction calculations
The non-adiabatic effects during H2 dissociation on metallic Mg have been characterized by computing the electronic friction tensor elements (Λij) for geometries along the MEP for two different systems, a periodic Mg(0001) slab and a small Mg nanocluster.54,56 To compute the electronic friction tensor, the current implementation within FHI-aims has been used.54,86 This implementation calculates nonadiabatic coupling matrix elements to calculate the relaxation rates on adsorbate motion due to coupling with hot electrons in the metal. The MEP was obtained by using the climbing-image nudged elastic band (CI-NEB) method implemented in ASE88 with FHI-aims. The MEP path contains 7 and 9 images for the Mg nanocluster and periodic Mg(0001) slab, respectively. The set of images was optimized with a maximum force threshold of 0.05 eV Å−1. For the Mg nanocluster case, a small iscohedral Mg particle containing 55 metallic atoms was considered. For the periodic Mg(0001) slab a 3 × 3 surface unit cell with 4 atomic layers (36 atoms) was employed with the bottom two atomic layers frozen in order to retain bulk properties. A Mg lattice constant for PBE previously published (a = 3.19, c = 5.12)89 was employed for the periodic system. The calculated lattice constants are in good agreement with the experimental ones (a = 3.21 Å and c = 5.21 Å).90 To compute the MEP and the electron friction components, a Monkhorst–Pack k-point mesh of 12 × 12 × 1 was chosen for the periodic systems. This particular k-point grid produced converged results for the relaxation rates associated with the electronic friction elements (see ESI Fig. S7c and S7d†). We use a broadening of the electronic states of 0.6 eV when calculating relaxation rates. The details of this procedure are explained in ref. 54. In both studied systems, PBE and “tight” basis set option were chosen as suitable choices to carry out these calculations.Data availability
The input and output files of all electronic structure calculations have been uploaded to the NOMAD repository and are available as a data set at doi: http://dx.doi.org/10.17172/NOMAD/2021.03.29-1. The data shown in all figures has been uploaded to figshare at doi: http://dx.doi.org/10.6084/m9.figshare.14339687.Author contributions
R.J.M. supervised the project. R.J.M. and O.A.D-G. conceived the project. O.A.D-G. carried out TD-DFTB and DFT calculations. C.L.B. and R.J.M. carried out electronic friction calculations. O.A.D-G., C.L.B. and R.J.M. discussed and interpreted the data and wrote the manuscript.Conflicts of interest
The authors declare no competing interests.Acknowledgements
O.A.D-G. and R.J.M. acknowledge funding from the UKRI Future Leaders Fellowship programme (MR/S016023/1). C.L.B. is supported by an EPSRC-funded Ph.D. studentship. High performance computing resources were provided via the Scientific Computing Research Technology Platform of the University of Warwick, the EPSRC-funded Materials Chemistry Consortium for the ARCHER UK National Supercomputing Service (EP/R029431/1), and the EPSRC-funded HPC Midlands+ computing centre (EP/P020232/1). The authors want to thank James Gardner and Franco P. Bonafé for fruitful discussions.References
- S. Link and M. A. El-Sayed, Int. Rev. Phys. Chem., 2000, 19, 409–453 Search PubMed.
- S. Link and M. A. El-Sayed, Annu. Rev. Phys. Chem., 2003, 54, 331–366 CrossRef CAS PubMed.
- S. Eustis and M. A. El-Sayed, Chem. Soc. Rev., 2006, 35, 209–217 RSC.
- G. V. Hartland, Chem. Rev., 2011, 111, 3858–3887 CrossRef CAS PubMed.
- O. A. Douglas-Gallardo, M. Berdakin, T. Frauenheim and C. G. Sánchez, Nanoscale, 2019, 11, 8604–8615 RSC.
- M. Li, S. K. Cushing and N. Wu, Analyst, 2015, 140, 386–406 RSC.
- F. Le, D. W. Brandl, Y. A. Urzhumov, H. Wang, J. Kundu, N. J. Halas, J. Aizpurua and P. Nordlander, ACS Nano, 2008, 2, 707–718 CrossRef CAS PubMed.
- N. G. Khlebtsov and L. A. Dykman, J. Quant. Spectrosc. Radiat. Transfer, 2010, 111, 1–35 CrossRef CAS.
- C. Clavero, Nat. Photonics, 2014, 8, 95–93 CrossRef CAS.
- M. L. Brongersma, N. J. Halas and P. Nordlander, Nat. Nanotechnol., 2015, 10, 25–34 CrossRef CAS PubMed.
- M. Berdakin, O. A. Douglas-Gallardo and C. G. Sánchez, J. Phys. Chem. C, 2020, 124, 1631–1639 CrossRef CAS.
- L. Chang, L. V. Besteiro, J. Sun, E. Y. Santiago, S. K. Gray, Z. Wang and A. O. Govorov, ACS Energy Lett., 2019, 4, 2552–2568 CrossRef CAS.
- L. V. Besteiro, P. Yu, Z. Wang, A. W. Holleitner, G. V. Hartland, G. P. Wiederrecht and A. O. Govorov, Nano Today, 2019, 27, 120–145 CrossRef CAS.
- Y. Zhang, S. He, W. Guo, Y. Hu, J. Huang, J. R. Mulcahy and W. D. Wei, Chem. Rev., 2018, 118, 2927–2954 CrossRef CAS PubMed.
- O. A. Douglas-Gallardo, M. Berdakin and C. G. Sánchez, J. Phys. Chem. C, 2016, 120, 24389–24399 CrossRef CAS.
- C. F. Negre and C. G. Sánchez, Chem. Phys. Lett., 2010, 494, 255–259 CrossRef CAS.
- B. Persson, Surf. Sci., 1993, 281, 153–162 CrossRef CAS.
- B. Foerster, A. Joplin, K. Kaefer, S. Celiksoy, S. Link and C. Sönnichsen, ACS Nano, 2017, 11, 2886–2893 CrossRef CAS PubMed.
- B. Y. Mueller and B. Rethfeld, Phys. Rev. B: Condens. Matter Mater. Phys., 2013, 87, 035139 CrossRef.
- S. Weber and B. Rethfeld, Appl. Surf. Sci., 2017, 417, 64–68 CrossRef CAS.
- S. I. Anisimov, B. L. Kapeliovich and T. L. Perel'man, J. Exp. Theor. Phys., 1974, 66, 776 Search PubMed.
- G. Kumari, X. Zhang, D. Devasia, J. Heo and P. K. Jain, ACS Nano, 2018, 12, 8330–8340 CrossRef CAS PubMed.
- H. Robatjazi, H. Zhao, D. F. Swearer, N. J. Hogan, L. Zhou, A. Alabastri, M. J. McClain, P. Nordlander and N. Halas, Nat. Commun., 2017, 8, 2041–1723 CrossRef.
- S. Mubeen, J. Lee, N. Singh, S. Krämer, G. D. Stucky and M. Moskovits, Nat. Nanotechnol., 2013, 8, 247–251 CrossRef CAS PubMed.
- H. Robatjazi, S. M. Bahauddin, C. Doiron and I. Thomann, Nano Lett., 2015, 15, 6155–6161 CrossRef CAS PubMed.
- J. Lee, S. Mubeen, X. Ji, G. D. Stucky and M. Moskovits, Nano Lett., 2012, 12, 5014–5019 CrossRef CAS PubMed.
- S. Mukherjee, F. Libisch, N. Large, O. Neumann, L. V. Brown, J. Cheng, B. Lassiter, E. A. Carter, P. Nordlander and N. Halas, Nano Lett., 2013, 13, 240–247 CrossRef CAS PubMed.
- S. Mukherjee, L. Zhou, A. M. Goodman, N. Large, C. Ayala-Orozco, Y. Zhang, P. Nordlander and N. J. Halas, J. Am. Chem. Soc., 2014, 136, 64–67 CrossRef CAS.
- L. Zhou, C. Zhang, M. J. McClain, A. Manjavacas, C. M. Krauter, S. Tian, F. Berg, H. O. Everitt, E. A. Carter, P. Nordlander and N. J. Halas, Nano Lett., 2016, 16, 1478–1484 CrossRef CAS PubMed.
- G. H. Chan, J. Zhao, G. C. Schatz and R. P. Van Duyne, J. Phys. Chem. C, 2008, 112, 13958–13963 CrossRef CAS.
- O. A. Douglas-Gallardo, G. J. Soldano, M. M. Mariscal and C. G. Sánchez, Nanoscale, 2017, 9, 17471–17480 RSC.
- J. S. Biggins, S. Yazdi and E. Ringe, Nano Lett., 2018, 18, 3752–3758 CrossRef CAS PubMed.
- F. Sterl, N. Strohfeldt, R. Walter, R. Griessen, A. Tittl and H. Giessen, Nano Lett., 2015, 15, 7949–7955 CrossRef CAS PubMed.
- X. Duan, S. Kamin, F. Sterl, H. Giessen and N. Liu, Nano Lett., 2016, 16, 1462–1466 CrossRef CAS PubMed.
- E. Ringe, J. Phys. Chem. C, 2020, 124, 15665–15679 CrossRef CAS PubMed.
- I. A. Solov'yov, A. V. Solov'yov and W. Greiner, J. Phys. B: At., Mol. Opt. Phys., 2004, 37, L137–L145 CrossRef.
- A. G. Chronis, F. I. Michos, C. S. Garoufalis and M. M. Sigalas, Phys. Chem. Chem. Phys., 2021, 23, 1849–1858 RSC.
- M. Johansson, C. W. Ostenfeld and I. Chorkendorff, Phys. Rev. B: Condens. Matter Mater. Phys., 2006, 74, 193408 CrossRef.
- J. Karst, F. Sterl, H. Linnenbank, T. Weiss, M. Hentschel and H. Giessen, Sci. Adv., 2020, 6, eaaz0566 CrossRef CAS PubMed.
- F. Sterl, H. Linnenbank, T. Steinle, F. Mörz, N. Strohfeldt and H. Giessen, Nano Lett., 2018, 18, 4293–4302 CrossRef CAS PubMed.
- A. C. Buckley, D. J. Carter, D. A. Sheppard and C. E. Buckley, J. Phys. Chem. C, 2012, 116, 17985–17990 CrossRef CAS.
- L. Das, Int. J. Hydrogen Energy, 1996, 21, 789–800 CrossRef CAS.
- M. Pozzo and D. Alfè, Phys. Rev. B: Condens. Matter Mater. Phys., 2008, 78, 245313 CrossRef.
- M. Pozzo and D. Alfè, J. Phys.: Condens. Matter, 2009, 21, 095004 CrossRef CAS PubMed.
- R. W. P. Wagemans, J. H. van Lenthe, P. E. de Jongh, A. J. van Dillen and K. P. de Jong, J. Am. Chem. Soc., 2005, 127, 16675–16680 CrossRef CAS PubMed.
- D. Shen, C.-P. Kong, R. Jia, P. Fu and H.-X. Zhang, J. Phys. Chem. A, 2015, 119, 3636–3643 CrossRef CAS.
- P. Jena, J. Phys. Chem. Lett., 2011, 2, 206–211 CrossRef CAS.
- H. Lei, C. Wang, Y. Yao, Y. Wang, M. Hupalo, D. McDougall, M. Tringides and K. Ho, J. Chem. Phys., 2013, 139, 224702 CrossRef PubMed.
- A. J. Du, S. C. Smith, X. D. Yao and G. Q. Lu, J. Phys. Chem. B, 2006, 110, 21747–21750 CrossRef CAS PubMed.
- K.-J. Jeon, H. R. Moon, A. M. Ruminski, B. Jiang, C. Kisielowski, R. Bardhan and J. J. Urban, Nat. Mater., 2011, 10, 286–290 CrossRef CAS PubMed.
- N. S. Norberg, T. S. Arthur, S. J. Fredrick and A. L. Prieto, J. Am. Chem. Soc., 2011, 133, 10679–10681 CrossRef CAS PubMed.
- B. Hourahine, B. Aradi, V. Blum, F. Bonafé, A. Buccheri, C. Camacho, C. Cevallos, M. Y. Deshaye, T. Dumitrică, A. Dominguez, S. Ehlert, M. Elstner, T. van der Heide, J. Hermann, S. Irle, J. J. Kranz, C. Köhler, T. Kowalczyk, T. Kubař, I. S. Lee, V. Lutsker, R. J. Maurer, S. K. Min, I. Mitchell, C. Negre, T. A. Niehaus, A. M. N. Niklasson, A. J. Page, A. Pecchia, G. Penazzi, M. P. Persson, J. Řezáč, C. G. Sánchez, M. Sternberg, M. Stöhr, F. Stuckenberg, A. Tkatchenko, V. W.-z. Yu and T. Frauenheim, J. Chem. Phys., 2020, 152, 124101 CrossRef CAS PubMed.
- F. P. Bonafé, B. Aradi, B. Hourahine, C. R. Medrano, F. J. Hernández, T. Frauenheim and C. G. Sánchez, J. Chem. Theory Comput., 2020, 16, 4454–4469 CrossRef PubMed.
- R. J. Maurer, M. Askerka, V. S. Batista and J. C. Tully, Phys. Rev. B: Condens. Matter Mater. Phys., 2016, 94, 115432 CrossRef.
- M. Askerka, R. J. Maurer, V. S. Batista and J. C. Tully, Phys. Rev. Lett., 2016, 116, 217601 CrossRef PubMed.
- R. J. Maurer, B. Jiang, H. Guo and J. C. Tully, Phys. Rev. Lett., 2017, 118, 256001 CrossRef PubMed.
- T. Martin, T. Bergmann, H. Göhlich and T. Lange, Chem. Phys. Lett., 1991, 176, 343–347 CrossRef CAS.
- A. Köhn, F. Weigend and R. Ahlrichs, Phys. Chem. Chem. Phys., 2001, 3, 711–719 RSC.
- R. Shinde and A. Shukla, Eur. Phys. J. D, 2017, 71, 301 CrossRef.
- J. Qi, J. Resasco, H. Robatjazi, I. B. Alvarez, O. Abdelrahman, P. Dauenhauer and P. Christopher, ACS Energy Lett., 2020, 5, 3518–3525 CrossRef CAS.
- P. Narang, R. Sundararaman and H. A. Atwater, Nanophotonics, 2016, 5, 96–111 CAS.
- A. Manjavacas, J. G. Liu, V. Kulkarni and P. Nordlander, ACS Nano, 2014, 8, 7630–7638 CrossRef CAS PubMed.
- F. P. Bonafé, B. Aradi, M. Guan, O. A. Douglas-Gallardo, C. Lian, S. Meng, T. Frauenheim and C. G. Sánchez, Nanoscale, 2017, 9, 12391–12397 RSC.
- C. Sönnichsen, T. Franzl, T. Wilk, G. von Plessen, J. Feldmann, O. Wilson and P. Mulvaney, Phys. Rev. Lett., 2002, 88, 077402 CrossRef PubMed.
- M. B. Ross and G. C. Schatz, J. Phys. D: Appl. Phys., 2014, 48, 184004 CrossRef.
- M. Head-Gordon and J. Tully, Phys. Rev. B: Condens. Matter Mater. Phys., 1992, 46, 1853 CrossRef CAS PubMed.
- M. Head-Gordon and J. C. Tully, J. Chem. Phys., 1995, 103, 10137 CrossRef CAS.
- S. P. Rittmeyer, D. J. Ward, P. Gütlein, J. Ellis, W. Allison and K. Reuter, Phys. Rev. Lett., 2016, 117, 196001 CrossRef.
- Y. Dorenkamp, H. Jiang, H. Köckert, N. Hertl, M. Kammler, S. M. Janke, A. Kandratsenka, A. M. Wodtke and O. Bünermann, J. Chem. Phys., 2018, 148, 034706 CrossRef PubMed.
- I. Lončarić, M. Alducin, P. Saalfrank and J. I. Juaristi, Phys. Rev. B: Condens. Matter Mater. Phys., 2016, 93, 014301 CrossRef.
- J. I. Juaristi, M. Alducin and P. Saalfrank, Phys. Rev. B: Condens. Matter Mater. Phys., 2017, 95, 125439 CrossRef.
- C. L. Box, Y. Zhang, R. Yin, B. Jiang and R. J. Maurer, JACS Au, 2021, 1, 164–173 CrossRef CAS.
- B. Leimkuhler and C. Matthews, J. Chem. Phys., 2013, 138, 174102 CrossRef PubMed.
- D. N. Denzler, C. Frischkorn, C. Hess, M. Wolf and G. Ertl, Phys. Rev. Lett., 2003, 91, 226102 CrossRef CAS.
- S. Funk, M. Bonn, D. N. Denzler, C. Hess, M. Wolf and G. Ertl, J. Chem. Phys., 2000, 112, 9888–9897 CrossRef CAS.
- I. Lončarić, M. Alducin, P. Saalfrank and J. I. Juaristi, Phys. Rev. B: Condens. Matter Mater. Phys., 2016, 93, 014301 CrossRef.
- R. J. Maurer, Y. Zhang, H. Guo and B. Jiang, Faraday Discuss., 2019, 214, 105–121 RSC.
- M. Elstner, D. Porezag, G. Jungnickel, J. Elsner, M. Haugk, T. Frauenheim, S. Suhai and G. Seifert, Phys. Rev. B: Condens. Matter Mater. Phys., 1998, 58, 7260–7268 CrossRef CAS.
- M. Elstner and G. Seifert, Philos. Trans. R. Soc., A, 2014, 372, 2011 CrossRef PubMed.
- A. S. Christensen, T. Kubař, Q. Cui and M. Elstner, Chem. Rev., 2016, 116, 5301–5337 CrossRef CAS.
- M. Gaus, Q. Cui and M. Elstner, Wiley Interdiscip. Rev.: Comput. Mol. Sci., 2014, 4, 49–61 CAS.
- F. Spiegelman, N. Tarrat, J. Cuny, L. Dontot, E. Posenitskiy, C. Martí, A. Simon and M. Rapacioli, Adv. Phys.: X, 2020, 5, 1710252 CAS.
- F. Alkan and C. M. Aikens, J. Phys. Chem. C, 2018, 122, 23639–23650 CrossRef CAS PubMed.
- B. Aradi, B. Hourahine and T. Frauenheim, J. Phys. Chem. A, 2007, 111, 5678–5684 CrossRef CAS.
- X. Lu, M. Gaus, M. Elstner and Q. Cui, J. Phys. Chem. B, 2015, 119, 1062–1082 CrossRef CAS PubMed.
- V. Blum, R. Gehrke, F. Hanke, P. Havu, V. Havu, X. Ren, K. Reuter and M. Scheffler, Comput. Phys. Commun., 2009, 180, 2175–2196 CrossRef CAS.
- J. P. Perdew, K. Burke and M. Ernzerhof, Phys. Rev. Lett., 1996, 77, 3865–3868 CrossRef CAS.
- A. H. Larsen, J. J. Mortensen, J. Blomqvist, I. E. Castelli, R. Christensen, M. Dułak, J. Friis, M. N. Groves, B. Hammer, C. Hargus, E. D. Hermes, P. C. Jennings, P. B. Jensen, J. Kermode, J. R. Kitchin, E. L. Kolsbjerg, J. Kubal, K. Kaasbjerg, S. Lysgaard, J. B. Maronsson, T. Maxson, T. Olsen, L. Pastewka, A. Peterson, C. Rostgaard, J. Schiøtz, O. Schütt, M. Strange, K. S. Thygesen, T. Vegge, L. Vilhelmsen, M. Walter, Z. Zeng and K. W. Jacobsen, J. Phys.: Condens. Matter, 2017, 29, 273002 CrossRef PubMed.
- U. Wedig, M. Jansen, B. Paulus, K. Rosciszewski and P. Sony, Phys. Rev. B: Condens. Matter Mater. Phys., 2007, 75, 205123 CrossRef.
- L. J. Slutsky and C. W. Garland, Phys. Rev., 1957, 107, 972–976 CrossRef CAS.
Footnote |
| † Electronic supplementary information (ESI) available. See DOI: 10.1039/D1NR02033A |
| This journal is © The Royal Society of Chemistry 2021 |