
Hemin-lipid assembly as an artemisinin oral delivery system for enhanced cancer chemotherapy and immunotherapy†
Qing
Wang‡
a,
Naijie
Wei‡
b,
Jingru
Guo
a,
Kai
Feng
a,
Yin Kwan
Wong
c,
Jingwei
Zhang
*b,
Jigang
Wang
*c and
Xiaolian
Sun
 *a
*a
aState Key Laboratory of Natural Medicines, Key Laboratory of Drug Quality Control and Pharmacovigilance, Department of Pharmaceutical Analysis, China Pharmaceutical University, Nanjing 210009, China
bState Key Laboratory of Natural Medicines, Key Laboratory of Drug Metabolism and Pharmacokinetics, China Pharmaceutical University, Nanjing 210009, China
cArtemisinin Research Center, and Institute of Chinese Materia Medica, China Academy of Chinese Medical Sciences, Beijing 100700, China
First published on 22nd July 2021
Abstract
Although artemisinin (ART) has shown initial promise in cancer therapy, its therapeutic efficacy is limited by its low tumor inhibitory efficacy and unfavorable distribution. Considering the important role of heme in the specific parasite-killing effect of ART, we designed a liposomal nanostructure self-assembled from hemin-lipid (Hemesome) to co-deliver ART and hemin for cancer therapy. The synergistic chemotherapeutic and immunotherapeutic effects of hemin and ART were demonstrated both in vitro and in vivo. The liposome-like structure was relatively stable in the blood circulation and gastrointestinal tract environment, but dissociated in the tumor cell environment. The folic acid (FA) modification not only increased their efficiency for transport across the epithelium, but also increased their tumor accumulation. In mouse models, following oral administration of FA-Hemesome-ART nanoparticles (5 mg kg−1 ART in total) every other day and intraperitoneal injection with a programmed death-ligand 1 antibody (aPD-L1, 70 μg per mouse in total), MC38 tumors were completely inhibited within 30 days. The cured mice remained tumor-free 30 days after rechallenging them with another inoculation of MC38 cells due to the strong immune memory effect.
Introduction
Cancer is a leading cause of death worldwide,1 and great efforts have been made to treat this disease for the past couple of decades.2 Among various therapeutic strategies, chemotherapy has been widely used in the clinic.3–5 Artemisinin (ART) is a plant-derived sesquiterpene lactone, recommended as the first-line treatment for malaria by the World Health Organization (WHO) with few documented adverse effects.6,7 Recently, ART was also found to be a potential anti-tumor chemotherapy drug for several types of cancer with the capacity to enhance the anti-tumor immune response.8,9 However, its relatively low tumor inhibitory efficacy, poor aqueous solubility and unfavorable distribution have hindered its clinical application.It is generally accepted that the activation and breaking of the endoperoxide bridge (R–O–O–R′) of ART by free iron are crucial for its cancer inhibitory activity.10 Based on this understanding, various nanomaterials have been used to co-deliver Fe2+ or other Fenton catalysts with ART to produce reactive oxygen species (ROS) for an enhanced therapeutic effect.11,12 It has been reported that the presence of heme in malaria parasites from hemoglobin digestion as well as biosynthesis13,14 plays an important role in the specific parasite-killing effect of ART, serving as the principal activator of the artemisinin prodrug and triggering promiscuous protein alkylation and widespread cellular damage. Thus, co-delivery of heme instead of iron ions to the cancer cells to mimic the Plasmodium falciparum microenvironment could be a promising way to take full advantage of artemisinin as an anticancer drug.
Liposome-like assemblies of lipid–porphyrin conjugates, also known as porphysomes, have been developed as intrinsic photothermal/photodynamic agents15,16 or drug delivery systems17,18 with high stability and excellent biocompatibility. Here, we proposed a liposomal nanostructure self-assembled from hemin-lipid (Hemesome) as an oral delivery system of both ART and hemin for cancer therapy. The hemin group refers to the ferrous ion (Fe3+)-containing porphyrin ring, which can be reduced to heme by various reducing agents in the tumor cells.19,20 The synergistic chemotherapeutic effect of hemin and ART was demonstrated both in vitro and in vivo. The nanoparticles (NPs) were relatively stable in the blood circulation and the gastrointestinal tract environment and could be transported across the epithelium of the intestine efficiently, demonstrating suitability for oral administration. In mouse models, oral administration of FA-Hemesome-ART NPs (5 mg kg−1 ART) followed by intraperitoneal injection of aPD-L1 (70 μg per mouse) could completely inhibit the MC38 tumor growth within 15 days. The cured mice remained tumor free 30 days after rechallenging them with another inoculation of MC38 cells. Given the fact that both hemin and ART are clinically approved, we believe that FA-Hemesome-ART NPs provide an efficient way to co-deliver hemin and ART orally for enhanced cancer therapy.
Experimental
Materials
1-Palmitoyl-2-hydroxy-sn-glycero-3-phosphocholine (16:0 Lyso PC) and 1,2-distearoyl-sn-glycero-3-phosphoethanolamine-N-[methoxy(polyethylene glycol)-2000] (DSPE-PEG2000) were purchased from Avanti Polar Lipids. Folic acid modified DSPE-PEG (DSPE-PEG2000-FA) was purchased from Shanghai ToYongBio Technology. Artemisinin (ART, purity ≥98.0%) was purchased from Shanghai Aladdin Bio-Chem Technology. Hemin, 1-(3-dimethylaminopropyl)-3-ethylcarbodiimide (EDC), 4-(dimethylamino)pyridine (DMAP), N,N-diisopropylethylamine (DIPEA), anhydrous dichloromethane (DCM), N,N-dimethylformamide (DMF) and methanol were purchased from J&K Chemicals. Cell culture medium, Dulbecco's modified Eagle's medium (DMEM), trypsin-EDTA, 4′,6-diamidino-2-phenylindole dihydrochloride hydrate (DAPI) and 3-(4,5-dimethylthiazol-2-yl)-2,5-diphenyl-2H-tetrazolium bromide (MTT) were provided by Jiangsu KeyGEN BioTECH Corporation. Fetal bovine serum (FBS) was purchased from Gibco Company. Fixable viability stain 780, Alexa Fluor 488-CRT, CD45-FITC, CD3e PerCP-Cy5.5, CD4-APC, CD8a PE-Cy7, CD25 BV421, Foxp3 PE antibodies and a transcription factor buffer set were purchased from BD Biosciences. Collagenase Type4 was provided by Worthington Biochemical. Experimental animals were purchased from Nanjing Qinglongshan experimental animal center. All chemical reagents were of analytical grade and were used without further purification.Transmission electron microscopy (TEM) images were obtained on a JEOL 1200EX operating at 100 kV after phosphotungstic acid staining. The hydrodynamic size was measured using a Zetasizer Nano ZS-90 (Malvern, UK) at least five times. The UV-vis spectra were recorded using a microplate reader (Multiskan Sky, Thermo Fisher Scientific).
Synthesis of hemin-lipid
In a round-bottomed flask, 100 nmol of 16:0 Lyso PC, 50 nmol hemin, 75 nmol DMAP and 300 nmol EDC were dissolved in 100 mL of anhydrous DCM and 1 mL of DMF. The mixture was stirred in the absence of water, oxygen and light for 48 hours before the solvent was removed by rotary evaporation. The product was washed by DCM three times and purified through column chromatography using DCM and methanol as eluents.Hemin-lipid was assayed by high-performance liquid chromatography-mass spectrometry (HPLC-MS) using water and acetonitrile as eluents. MS (m/z): calcd for [(M + H)+] 1130.57; found 1130.06. Acquisition of 1H-NMR spectra was performed with a Bruker ACF-300 MHz NMR spectrometer using DMSO-d6 as the solvent. A Fourier transform infrared (FT-IR) spectrum (4 cm−1 resolution, 16 scans) was recorded on a Shimadzu IRTracer-100 System in the infrared region from 4000 to 400 cm−1.
Synthesis of hemesome and ART encapsulated hemesome
Hemesomes were prepared by a previously reported thin-film hydration method.21 Briefly, 85% hemin-lipid and 15% DSPE-PEG2000 were dissolved in a chloroform/methanol mixture (2![[thin space (1/6-em)]](https://www.rsc.org/images/entities/char_2009.gif) :1, v/v). The films were then dried in a vacuum overnight before being rehydrated with phosphate buffered saline (PBS, 4–6 mL) for 1 hour and followed by five freeze–thaw cycles. After that, the solution was extruded through a 100 nm polycarbonate membrane at 60 °C at least five times. The solution was then purified through a 0.22 μm polycarbonate membrane and ultrafiltration centrifugation before storage at 4 °C. For FA conjugated hemesomes, DSPE-PEG2000-FA was used. For imaging purposes, protoporphyrin IX (PpIX)-lipid was used instead. For ART encapsulated hemesomes, 10% ART was mixed with hemin-lipid and DSPE-PEG2000.
:1, v/v). The films were then dried in a vacuum overnight before being rehydrated with phosphate buffered saline (PBS, 4–6 mL) for 1 hour and followed by five freeze–thaw cycles. After that, the solution was extruded through a 100 nm polycarbonate membrane at 60 °C at least five times. The solution was then purified through a 0.22 μm polycarbonate membrane and ultrafiltration centrifugation before storage at 4 °C. For FA conjugated hemesomes, DSPE-PEG2000-FA was used. For imaging purposes, protoporphyrin IX (PpIX)-lipid was used instead. For ART encapsulated hemesomes, 10% ART was mixed with hemin-lipid and DSPE-PEG2000.
Encapsulation efficiency, stability and in vitro drug release study
ART was quantified by a previously reported UV method.22 Briefly, ART can hydrolyze into a compound with an absorption peak at 290 nm in a sodium hydroxide solution at 50 °C for 30 minutes. The encapsulation efficiency (EE) and loading efficiency (LE) of the NPs were calculated with the following formula, respectively:| Encapsulation ratio% = M2/M1 × 100% |
| Loading efficiency% = M2/Mtotal × 100% |
For the stability test, FA-Hemesome-ART NPs were immersed in PBS (pH 7.4), simulated intestinal fluid (SIF), simulated gastric fluid (SGF) or DMEM with 10% FBS at 37 °C, respectively. The hydrodynamic size was recorded over time.
For the in vitro release study, FA-Hemesome-ART NPs (1 mL) were placed in a dialysis bag (MWCO: 3500 Da) and immersed in the release medium (30 mL): PBS (pH 7.4), SIF, SGF and PBS (pH 5.5) with phospholipase A2 (PLA2). 1 mL of sample was collected from the release medium periodically, and the same volume of fresh medium was added. The concentration of ART in each sample was quantified via UV-vis spectra three times in parallel.
Cellular experiments
Murine mammary carcinoma cells (4T1), human normal liver cells (L02), human colon carcinoma cells (Caco-2), and murine colon adenocarcinoma cells (MC38) were cultured in a DMEM culture medium (Jiangsu KeyGEN BioTECH Corporation, 1% penicillin and streptomycin) supplemented with 10% FBS under a humidified atmosphere containing 5% CO2 at 37 °C. Additional 0.5% nonessential amino acids (NAAs) were needed as nutrients for Caco-2 cells.Cell internalization
The cells were seeded in 6-well plates until they reached about 70% confluence and then treated with a fresh DMEM containing free hemin, Hemesome-ART, and FA-Hemesome-ART for 12–24 h, respectively. Then the cells were washed, collected and digested. The hemin concentration in the cell lysate of each group was calculated via the UV-vis absorbance at 400 nm. The ART concentration was measured using a high-performance liquid chromatography (HPLC) system with a reverse-phase Hypersil Gold C18 column (GL science, 4.6 × 250 nm, 5 μm) and a UV-Vis detector (L-2489), using an acetonitrile:water mixture (60:40, v/v) as the mobile phase. The column temperature was 35 °C, and the flow rate was 0.5 mL min−1.
In vitro cytotoxicity studies and intracellular ROS detection
A standard MTT assay was performed by treating 4T1 cells, MC38 cells and Caco-2 cells with free ART, Hemesome, Hemesome-ART, FA-Hemesome-ART, and FA-Hemesome-ART + FA for 24 h at 37 °C with 5% CO2. The ART final concentration (CART) was 36 μM for all the groups. The relative cell viability (%) was calculated as follows: cell viability (%) = (ODsample/ODcontrol) × 100%.The intracellular ROS level was measured by adding 10 μM 2′,7′-dichlorodihydrofluorescein diacetate (DCFH-DA) to the cells treated with different groups (CART = 36 μM), incubated for 6 hours before being washed with PBS, and finally imaged by fluorescence microscopy with the excitation laser at 488 nm.
Transport studies of hemesome-ART across Caco-2 cells
Caco-2 cells were seeded on inserts (Millicell cell culture inserts, Millipore, USA) containing a permeable polycarbonate membrane (0.4 μm) in a 24-well plate. The medium was replaced with fresh medium every other day during the first week and every day afterward. Transepithelial electrical resistance (TEER) was applied to measure the integrity of the cell monolayers.23 Transport studies were carried out when the resistance value exceeded 500 Ω cm2. The cell monolayers were washed with Hank's Balanced Salt Solution (HBSS) on both the apical (AP) and basolateral (BL) sides and incubated with HBSS at 37 °C for 30 min before it was removed. Then 200 μL of samples (ART, Hemesome-ART, and FA-Hemesome-ART, with CART = 18 μM, respectively) were added on the AP side while 1 mL of HBSS was added on the BL side. 100 μL of the solution on the BL side was collected after incubation for 4 h at 37 °C. The ART concentration was detected and calculated by HPLC using the UV-vis detector. The apparent permeability coefficient (Papp) of ART was calculated by the formula:| Papp (cm s−1) = dQ/(A × C × dt) |
Detection of calreticulin (CRT) expression in vitro
4T1 cells or MC38 cells were incubated with ART, hemin, Hemesome-ART and FA-Hemesome-ART for 10 h, respectively. The cells were washed 3 times and then treated with an Alexa Fluor 488-CRT antibody for 2 h at 37 °C. The cells were then fixed by 4% paraformaldehyde, and nuclei were stained with DAPI for fluorescence microscopy observation.Animal experiments
All animal care and experimental procedures were conducted according to the Guidelines for Care and Use of Laboratory Animals of China Pharmaceutical University and were approved by the Animal Ethics Committee of School of Pharmacy, China Pharmaceutical University. BALB/c mice (5 weeks old, female) and C57BL/6 mice (5 weeks old, female) were purchased from Qinglongshan. The tumor-bearing mice models were generated by subcutaneous injection of 1 × 10⁶ corresponding 4T1 or MC38 cells into the right hind leg region of BALB/c or C57BL/6 mice.In vivo biodistribution and pharmacokinetic studies
4T1 tumor-bearing mice were administered with 200 μL of FA-PpIXsome-ART and PpIX by gavage, respectively. In vivo fluorescence imaging was carried out with an excitation wavelength at 400 nm at 3, 12, 24, and 36 h post-injection, respectively. Mice were sacrificed at each time point. The tumor, stomach and intestines were dissected out for ex vivo imaging. Then the heme concentration was measured using a HPLC system with a reverse-phase ZORBAX SB-C18 column (Agilent, 2.1 × 50 nm, 3.5 μm) and a UV-Vis detector, using an acetonitrile:methanol:water mixture (35:35:30, v/v) as the mobile phase. The column temperature was 35 °C, and the flow rate was 0.3 mL min−1.
For pharmacokinetic studies, mice were randomly assigned into two groups and treated with ART and FA-Hemesome-ART per os (po.) at equivalent ART doses (5 mg kg−1). At 0, 0.25, 0.5, 1, 4, 9, 12, 24 and 48 h after treatment, 200 μL of blood samples were collected from the retro-orbital plexus of the mouse into anticoagulant tubes. The plasma was collected after the blood was centrifuged at 4 °C (12000 rpm, 10 min). The content of ART in plasma was measured with HPLC-MS.
In vivo antitumor study
After the tumor volume reached approximately 60 mm3, mice bearing 4T1 xenograft (n = 4) were randomly allocated into different groups: PBS (control group), ART (iv. and po.), heme (po.), Hemesome-ART (po.) and FA-Hemesome-ART (iv. and po.) (the equivalent dose of ART was 5 mg kg−1, and iv. and po. represent intravenously and per os, respectively). The drug was given orally every other day or intravenously injected once. The tumor size and body weight were recorded. The tumor volume was calculated through the formula: V = W2L/2, in which W and L represent the shortest and longest diameter of the tumor.The immune response in vivo
When the volume of the MC38 tumor reached 60 mm3, mice were divided into five groups at random (n = 4 per group) (1) PBS; (2) ART; (3) aPD-L1; (4) FA-Hemesome-ART; and (5) FA-Hemesome-ART + aPD-L1. Each group of mice was orally administered the same dose of ART (5 mg kg−1). aPD-L1 was intraperitoneally injected at the 1st, 4th, and 7th day at a total dose of 75 μg per mouse. Tumor growth and body weight were monitored. Tumors were dissected out for ex vivo immunohistochemistry to assess CD8+ CTLs and the release of high mobility group protein 1 (HMGB-1).To examine the secretion of tumor necrosis factor-α (TNF-α) and interleukin-6 (IL-6) in the tumor, we used an enzyme-linked immunosorbent assay (ELISA) kit according to the manufacturer's instructions after the tumors were homogenized and centrifuged.
In vivo T lymphocyte analysis
The solid tumor tissues of sacrificed mice were collected for immunological evaluations on the 14th day. The tumors were homogenized and digested into a single cell suspension and were stained with Fixable Viability Stain 780 and antibodies including CD45-FITC, CD3e PerCP-Cy5.5, CD4-APC, CD8a PE-Cy7, CD25 BV421 and Foxp3 PE (1 μg per tube) for both cytotoxic T lymphocytes (CTLs) and regulatory T cells (Tregs) evolution. The samples were analyzed using a fluorescence activating cell sorter (FACS). Flowjo software was utilized for data analysis.Tumor re-challenge experiment
When the tumor size reached 60 mm3, MC38 tumor bearing mice received FA-Hemesome-ART orally at a dose of 5 mg kg−1 ART every other day. aPD-L1 was intraperitoneally injected at the 1st, 4th, and 7th day at a total dose of 75 μg per mouse. After oral treatment of FA-Hemesome-ART and intraperitoneal injection of aPD-L1, these mice were injected subcutaneously into the contralateral flank with 1 × 10⁶ MC38 cells. The growth of the secondary tumors was then monitored for 30 days.Biosafety test
Blood biochemical indexes and blood routine indexes were tested 1 day and 7 days post-treatment. The heart, liver, spleen, lungs and kidneys were dissected out after an in vivo antitumor study for hematoxylin/eosin (H&E) staining. The blood biochemical indexes, blood routine indexes and H&E staining were analyzed by Servicebio Company.Results and discussion
Synthesis and characterization of FA-Hemesome-ART NPs
We synthesized the FA-Hemesome-ART as the co-delivery system of ART and its activator heme by modifying a reported thin-film hydration method (Fig. 1A).21 Briefly, the lipid was conjugated to the hemin by the acylation reaction between the hydroxyl group of 1-palmitoyl-2-hydroxy-sn-glycero-3-phosphocholine and the carboxylic group of hemin (Fig. S1†). The successful conjugation was confirmed by the 1H-NMR (Fig. S2†), HPLC-MS (Fig. S3†) and FT-IR (Fig. S4†) spectra. Hemin-lipid was then combined with DSPE-PEG2000 and DSPE-PEG2000-FA to prepare liposome-like nanovesicles following the reported freeze–thaw extrusion procedure.24 PEGylation could improve the circulation of NPs25 and folic acid was an active target molecule for the tumor expressed folate receptor.26 ART was loaded into the phospholipid bilayer with an EE and an LE of around 99.05% and 5.32%, respectively. As a result of the small amount of ART added, the EE is relatively high. The resulting FA-Hemesome-ART NPs were approximately 100 nm as indicated by TEM (Fig. 1B). Dynamic light scattering (DLS) showed a hydrodynamic diameter of FA-Hemesome-ART at around 120 nm in PBS, with a slight increase to 140 nm in simulated gastric and intestinal fluids due to the protease present (Fig. 1C).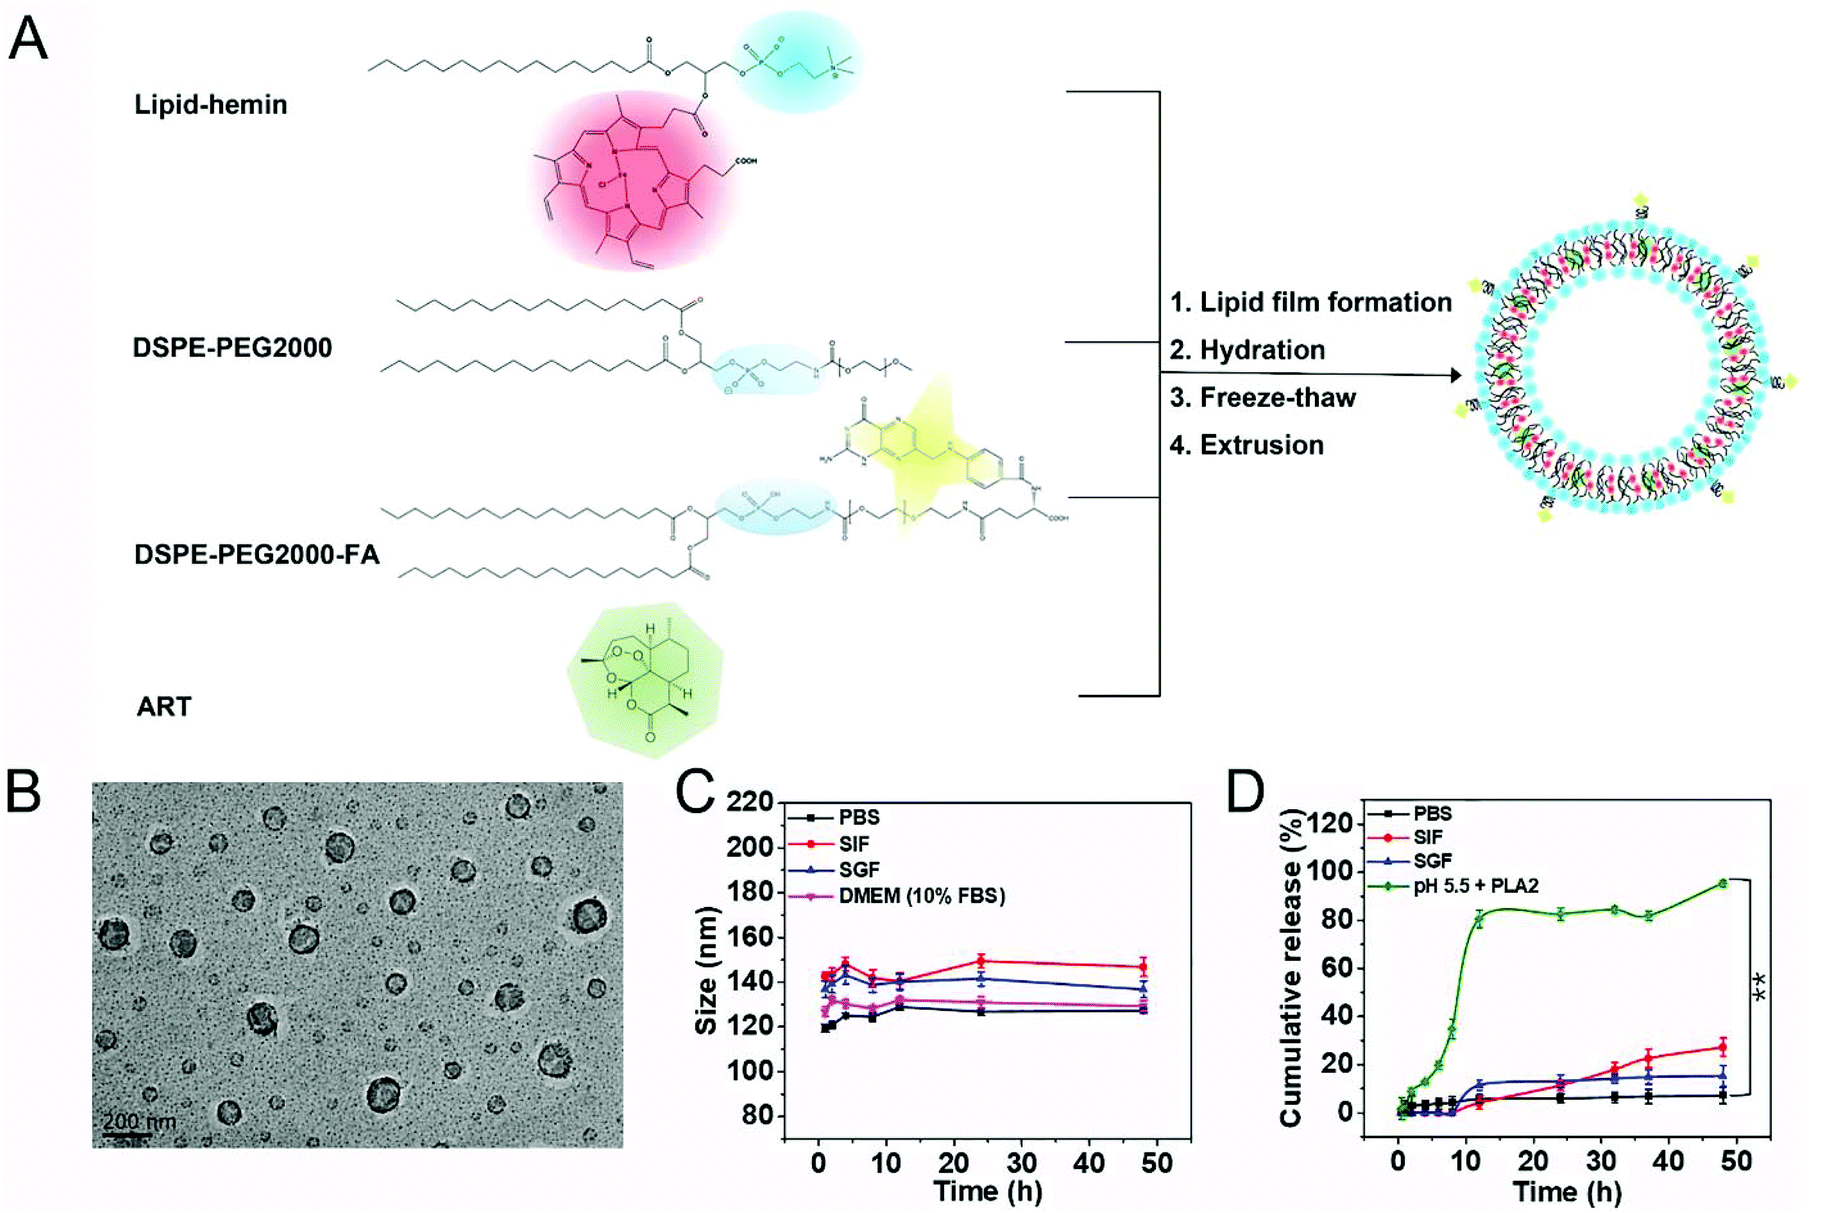 | ||
| Fig. 1 Characterization of FA-Hemesome-ART NPs. (A) Schematic formulation of FA-Hemesome-ART NPs. FA-Hemesome-ART NPs consisted of lipid-hemin, DSPE-PEG2000, DSPE-PEG2000-FA and ART. (B) TEM image of FA-Hemesome-ART NPs. Scale bar: 200 nm. (C) Hydrodynamic size and (D) ART release of FA-Hemesome-ART NPs in different media. Data represent mean ± SD, n = 3. **P value <0.01 obtained by Student's two-tailed t test. | ||
Furthermore, we studied the release behavior of ART from FA-Hemesome-ART NPs. The hydrodynamic size of FA-Hemesome-ART remained stable within 48 h in a pH 7.4 PBS and gastrointestinal (GI) tract mimicking environment (Fig. 1C), with little ART released (Fig. 1D). These results indicated that the FA-Hemesome-ART NPs were relatively stable in the blood circulation and gastrointestinal tract, with negligible drug leakage after oral administration. Phospholipase A2 (PLA2) is an intracellular protein that can disrupt the liposome bilayer by hydrolyzing phospholipids.27 Exposed to the PBS with pH 5.5 and PLA2 (200U), FA-Hemesome-ART NPs were quickly degraded with over 80% ART released within 10 h. It is generally acknowledged that PLA2 is expressed in inflammation-related tissues, such as tumors.28 Thus, we believe that tumor microenvironments could trigger the release of ART for therapy.
Cellular uptake and cytotoxicity of FA-Hemesome-ART
We then tested the ability of FA-Hemesome-ART NPs to co-deliver hemin and ART into 4T1 cells. The intracellular heme level is regulated by heme synthesis, incorporation into hemoprotein and trafficking across membranes.29 Hemin could be reduced to heme by various reducing agents in the tumor cells.14 Once heme is unbound from a chaperone, it is immediately oxidized to hemin. Since hemin and heme are interconvertible, the intracellular hemin we measured was actually a total of endogenous heme and exogenous hemin. As shown in Fig. 2A, the intracellular hemin level was increased only 1.55 times after free hemin treatment. In comparison, the cellular uptake of Hemesome-ART NPs led to a 4.06 times elevated hemin level, and the active targeting of FA further increased the intracellular heme level to 4.78 times. ART was also successfully delivered by the NPs. Compared with free ART, FA-Hemesome-ART showed 2.19 times higher delivery efficiency.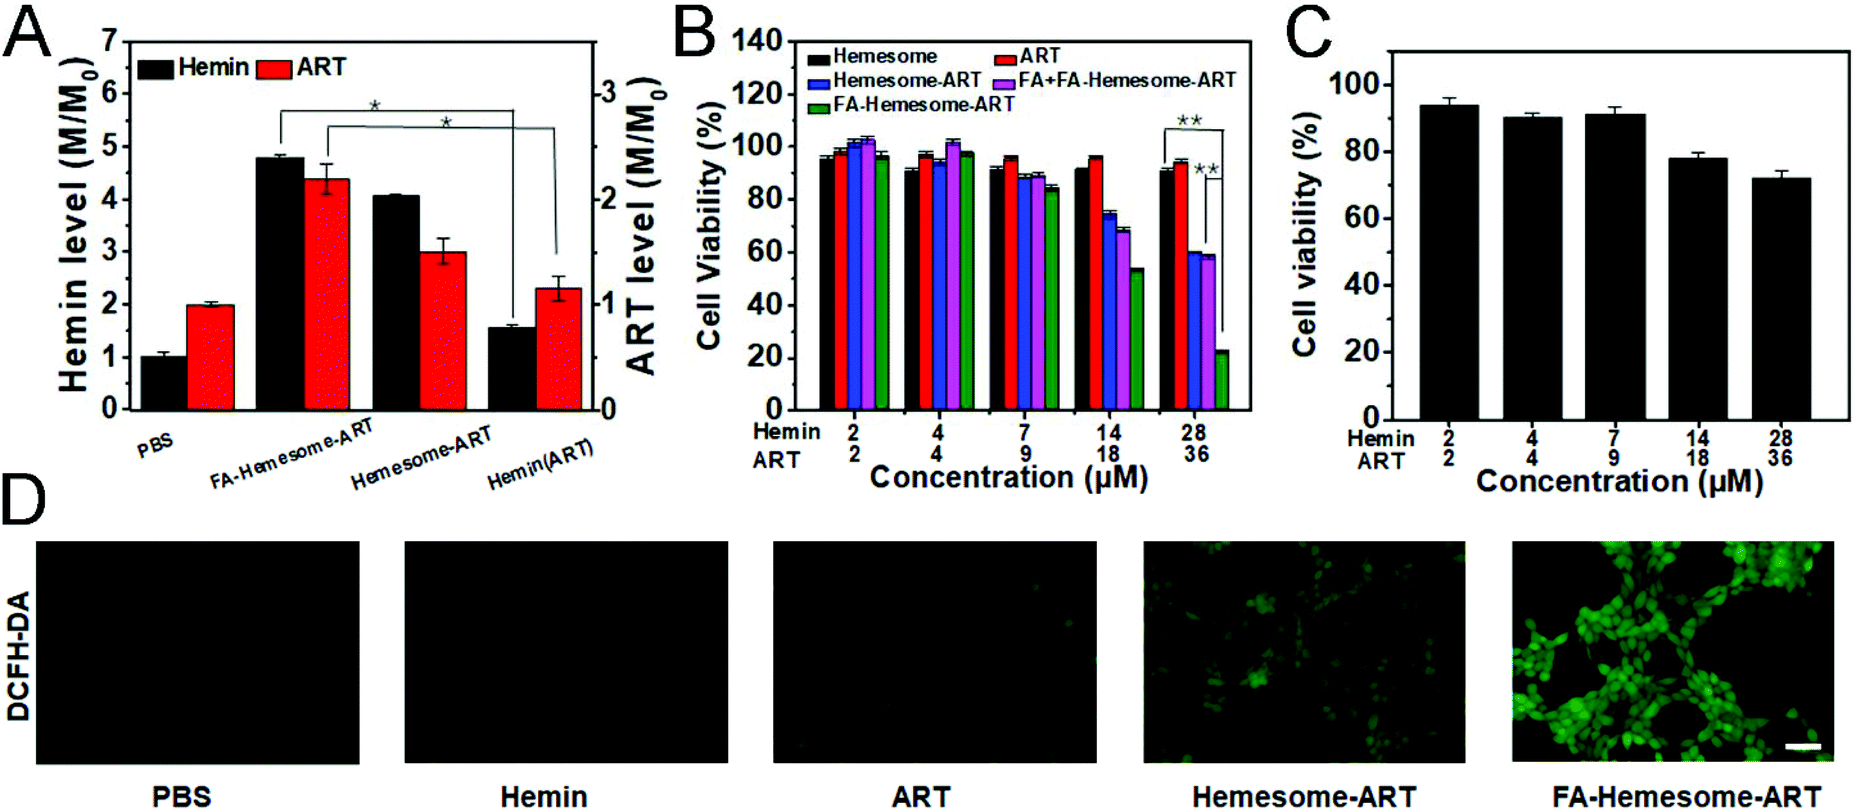 | ||
| Fig. 2 Cellular uptake and cytotoxicity. (A) The hemin and ART levels in 4T1 cells incubated with PBS, FA-Hemesome-ART NPs, Hemesome-ART NPs, hemin or ART (mean ± SD, n = 4) for 24 hours with a hemin concentration of 14 μM and an ART concentration of 18 μM. (B) Cytotoxicity for 4T1 cells incubated with Hemesome NPs, ART, Hemesome-ART NPs, FA + FA-Hemesome-ART NPs and FA-Hemesome-ART NPs (mean ± SD, n = 4) at different hemin and ART concentrations. (C) Cytotoxicity of FA-Hemesome-ART NPs on L02 cells at different ART and hemin concentrations (mean ± SD, n = 4). (D) DCFH-DA staining of 4T1 cells after treatment with ART, hemin, Hemesome-ART NPs and FA-Hemesome-ART NPs. Intracellular ROS was detected using a fluorescent microscope. Scale bar: 100 μm. *P value <0.05, **P value <0.01 obtained by Student's two-tailed t test. | ||
The synergistic therapeutic effect of hemin and ART was then explored. ART itself demonstrated a low tumor inhibitory ability with no obvious cytotoxicity observed at a concentration of up to 36 μM. Although hemin could be considered safe at low concentrations, co-delivered hemin and ART could effectively kill cancer cells as shown in Fig. 2B. The FA-Hemesome-ART NPs demonstrated a half-maximal inhibitory concentration (IC50) of around 18 μM ART and 14 μM hemin. Also, the results were consistent on MC38 cells (Fig. S5†). The intracellular ROS level was then measured by using the DCFH-DA probe.30 After incubation with FA-Hemesome-ART NPs (28 μM hemin, 36 μM ART) for 6 h, a strong green fluorescence could be observed due to the production of ROS (Fig. 2D). In contrast, ART and hemin alone minimally induced ROS. The result indicated that the endogenous heme is not enough for ART activation. The co-delivery of hemin and ART greatly improved the ROS generation for anti-tumor therapy. It is worth mentioning that FA-Hemesome-ART NPs demonstrated selectivity on 4T1 tumor cells and normal liver cells (L02 for instance) due to the intrinsically high level of H2O2 in tumor cells and the active targeting of FA towards tumor cells. After treatment with FA-Hemesome-ART NPs at an ART concentration of 36 μM, the cell viability is above 70% for normal liver cells (L02) in contrast to 28% for 4T1 cells (Fig. 2C).
We also investigated the immunogenic cell death (ICD) induced by FA-Hemesome-ART NPs-mediated chemotherapy, which was determined by the calreticulin (CRT) expression on the cell surface. Although ART is known to possess some immunoregulatory properties,31 both free ART and hemin minimally induced CRT in either 4T1 (Fig. 3A) or MC38 cells (Fig. S6†) at a relatively low concentration. In contrast, FA-Hemesome-ART with an equivalent concentration significantly promoted the CRT expression with a 4.4 times enhancement compared to free ART (Fig. 3B). Taken together, FA-Hemesome-ART could not only induce tumor cell apoptosis, but does so through an immunogenic mode of action, which paves the way to potentially combine/synergize checkpoint blockade immunotherapy.
 | ||
| Fig. 3 ICD induced by FA-Hemesome-ART-mediated chemotherapy. (A) Fluorescence microscopy images of CRT expression on the 4T1 cell surface after different treatments. Cell nuclei were stained with DAPI (blue); CRT was stained with an Alexa-488-conjugated anti-CRT antibody (green). Scale bar: 100 μm. (B) The pixel intensity of CRT expression on the 4T1 cell surface after different treatments in images. **P value <0.01, ***P value <0.001 obtained by Student's two-tailed t test. | ||
Uptake and transport studies in Caco-2 cells
Caco-2 cells are widely used to evaluate the oral absorption of drugs.32 As shown in Fig. 4A, the hemin and ART levels in Caco-2 increased 2.7-fold and 2.5-fold after treatment with FA-Hemesome-ART NPs at a concentration of 14 μM hemin and 18 μM ART, respectively. In contrast, free hemin was barely internalized. The relative cell viability treated with FA-Hemesome-ART at a concentration of up to 28 μM hemin and 36 μM ART was more than 90% (Fig. 4B), indicating no significant toxicity towards intestinal cells.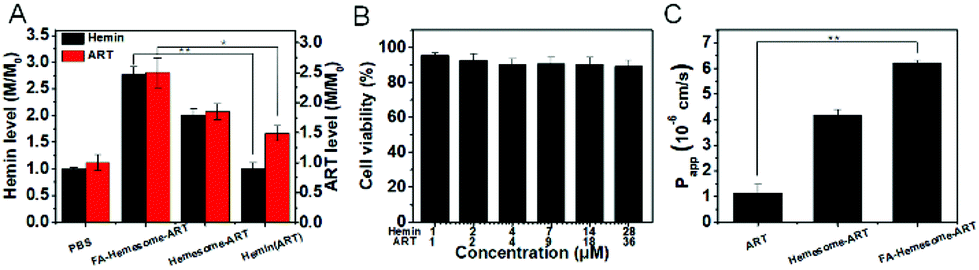 | ||
| Fig. 4 The uptake and transport studies in human colon carcinoma cells (Caco-2 cells). (A) The hemin and ART levels of Caco-2 cells were incubated with various drugs at a concentration of 14 μM hemin and/or 18 μM ART. (B) The cell viability of FA-Hemesome-ART NPs (mean ± SD, n = 4) at different concentrations. (C) Apparent permeability coefficient (Papp) of ART, Hemesome-ART NPs and FA-Hemesome-ART NPs at 18 μM ART at 37 °C (mean ± SD, n = 4). *P value <0.05, **P value <0.01 obtained by Student's two-tailed t test. | ||
The above results confirmed that FA-Hemesome-ART NPs could efficiently accumulate in Caco-2 cells. We then investigated whether the NPs could be transported across intestinal epithelial cells to the blood. The model of Caco-2 cells monolayer with the transepithelial electrical resistance (TEER) exceeding 500 Ω cm2 was established to mimic the intestinal epithelial barrier.33 After the monolayers were treated with different samples on the apical side for 4 h, the ART level was measured on the basolateral side. As shown in Fig. 4C, the apparent permeability coefficient (Papp) of ART was 1.15 ± 0.33 × 10⁻⁶ cm s−1, which was considerably low.34 Encapsulation of ART in Hemesome NPs led to a 4-fold increase in Papp across Caco-2 cells. Folic acid modification further increased the Papp by 6-fold compared to free ART, consistent with the previous report that the transport of NPs could be further improved by targeting the folate receptors expressed on the intestinal epithelial cells.35 All the results indicate that FA-Hemesome-ART NPs could improve the oral bioavailability of ART and hemin.
In vivo biodistribution and antitumor studies
To study the in vivo biodistribution of FA-Hemesome-ART NPs, fluorescent FA-PpIXsome-ART with a similar structure but without Fe chelation is used instead. After administration by gavage, strong fluorescence signals in the intestinal epithelium tissues were observed, displaying the gradual movement down the intestinal tract, and the tumor tissue was illuminated after 36 hours (Fig. 5A). As shown in Fig. S7,† the content of heme increased gradually, and 36 h after oral administration, it reached the peak value. To show a stark contrast with FA-PpIXsome-ART NPs, the fluorescence signal of free PpIX was distributed mainly in the GIT in the first three hours (Fig. S8A†), but there was almost no signal in the tumor site in vivo and ex vivo at the time point of 36 h (Fig. S8B and C†), indicating that these FA-Hemesome-ART NPs could enter the systemic blood circulation from the gut and accumulate in the tumor (Fig. 5B).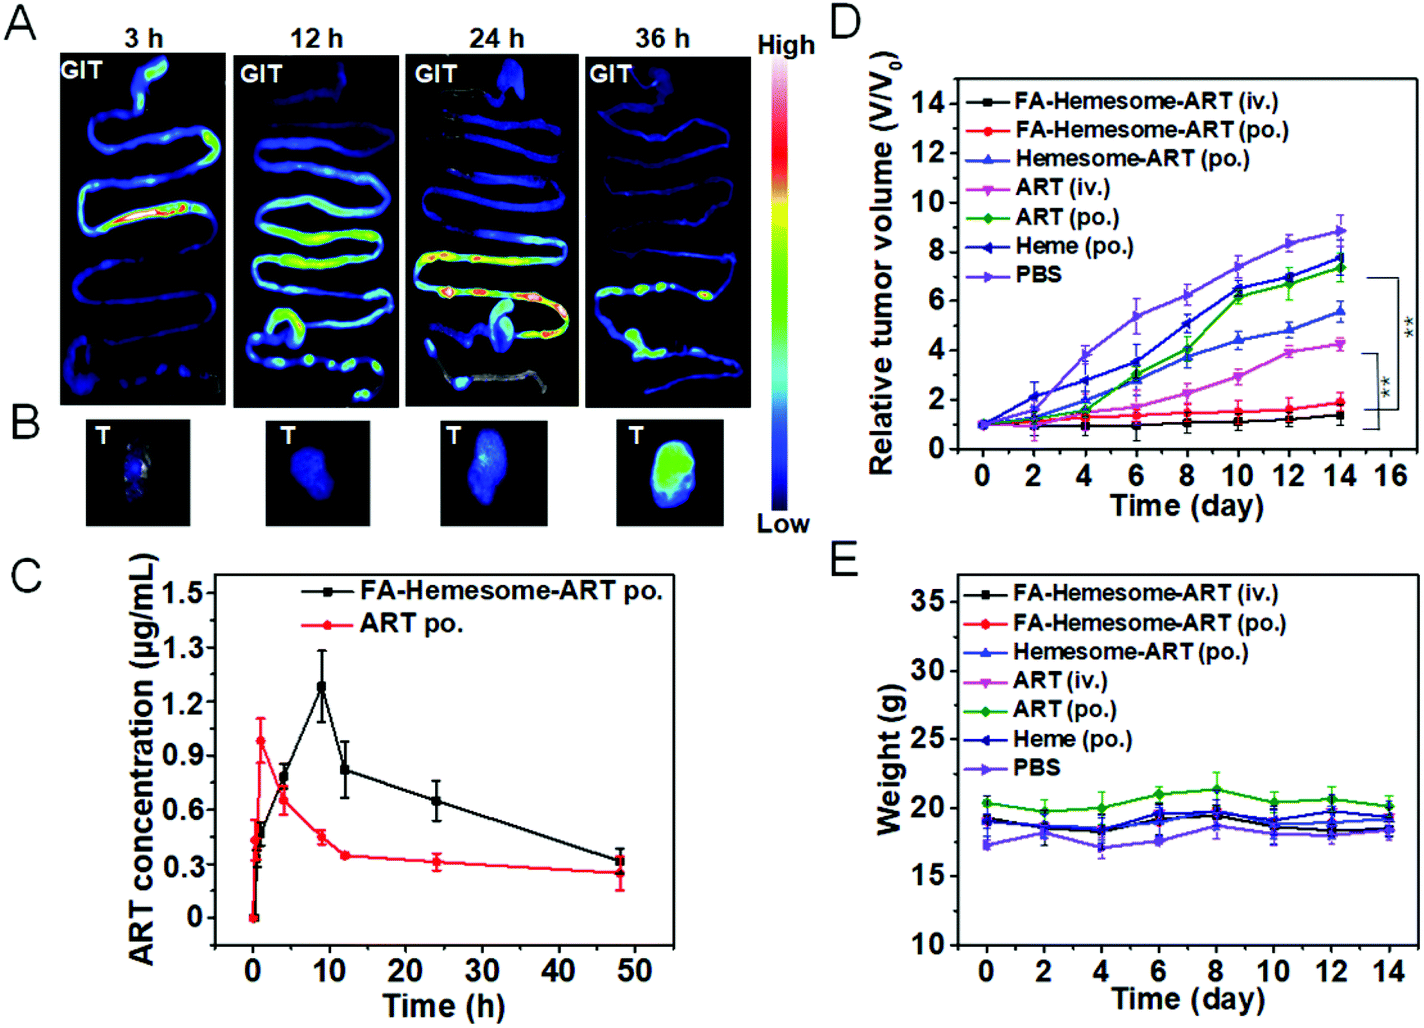 | ||
| Fig. 5 The in vivo biodistribution and pharmacokinetic study of FA-Hemesome-ART NPs after oral administration. (A) Ex vivo fluorescence images of the gastrointestinal tract (GIT) of 4T1 tumors bearing mice after oral administration of FA-PpIXsome-ART NPs at different time-points. (B) Corresponding ex vivo tissue images. (C) Plasma concentration-time profiles of ART and FA-Hemesome-ART NPs in mice by oral administration with 5 mg kg−1 within 48 h. Data represent mean ± SD, n = 3. (E) 4T1 tumor growth curves after different treatments. Mice (n = 4) were administered orally every other day or intravenously on day 1 at a dose of 5 mg kg−1. (F) Body weights of mice in different groups (n = 4). **P value <0.01, obtained by Student's two-tailed t test. | ||
Subsequently, the in vivo pharmacokinetic study was performed by measuring the plasma ART concentration at different time points. In order to compare with the FA-Hemesome-ART NPs, we set up the group of free ART (prepared by dissolving in DMSO followed by dilution to 1000 times with sterile PBS containing 3% Tween-80). As shown in Fig. 5C, FA-Hemesome-ART NPs exhibited a bigger area under the plasma concentration–time curve (AUC) than that of free ART in both intravenous (Fig. S9†) and oral (Fig. 5C) administration, which indicated better in vivo therapeutic effects. With a prolonged drug exposure and a lower peak concentration, FA-Hemesome-ART NPs as an oral drug could be more effective with fewer side-effects.
The antitumor effect of FA-Hemesome-ART NPs was then evaluated on 4T1 tumor bearing mice via either oral or intravenous administration. All the drugs were given orally 7 times in 2 day intervals at a dose of 5 mg ART per kg mice or intravenously once at a dose of 5 mg kg−1. As shown in Fig. 5D and Fig. S10,† the oral administration of free ART minimally induced tumor inhibition due to its low aqueous solubility and poor absorption. In contrast, no obvious tumor growth was observed within 14 days after oral administration of FA-Hemesome-ART. The drug efficacy of FA-Hemesome-ART NPs (po., 5 mg kg−1) via oral administration is comparable to that administered via the iv. route (iv., 5 mg kg−1), being much more effective than free ART, free hemin and Hemesome-ART. Besides, the weight of mice remained stable with no significant fluctuation in all groups (Fig. 5E). No mice were found dead within 45 days after oral treatment with FA-Hemesome-ART NPs, while only 25% survived after oral treatment with ART at the same concentration (Fig. S11†). All the results demonstrated the excellent anticancer efficacy in vivo of FA-Hemesome-ART NPs as an oral drug.
In vivo immunotherapy
We then evaluated the anti-tumor therapeutic efficacy and immunological memory induction of FA-Hemesome-ART NPs combined with checkpoint blockade immunotherapy on MC38 tumor bearing mice in vivo. The oral administration of FA-Hemesome-ART NPs could inhibit tumor growth and increase the survival rate to 80% within 40 days (Fig. 6B and C). After the combination of aPD-L1 (75 μg per mouse) and FA-Hemesome-ART NPs, the tumor shrunk and was even eradicated with no mice dead after 50 days (Fig. 6B and C). There was also no obvious weight fluctuation, as shown in Fig. 6D. The intratumoral infiltration of CTLs and Tregs was then analyzed. As shown in Fig. 6F–I, after oral treatment with FA-Hemesome-ART NPs (5 mg kg−1), the percentage of CTLs (CD3+CD8+) increased from 14.0% to 32.6% and the percentage of Tregs (CD25+Foxp3+) was significantly decreased from 35.2% to 18.2% compared to the ART only group. The combination of aPD-L1 and FA-Hemesome-ART even increased the CTLs to 54.8% and decreased the Tregs to 7.2%. Also, the in situ expression of HMGB-1 and the proportion of CD8+ T cells were elevated in the tumor observed by immunohistochemistry (Fig. S12†), which is consistent with the above results. All the results demonstrated that the anticancer immunological responses of FA-Hemesome-ART NPs could synergize aPD-L1 for enhanced antitumor responses.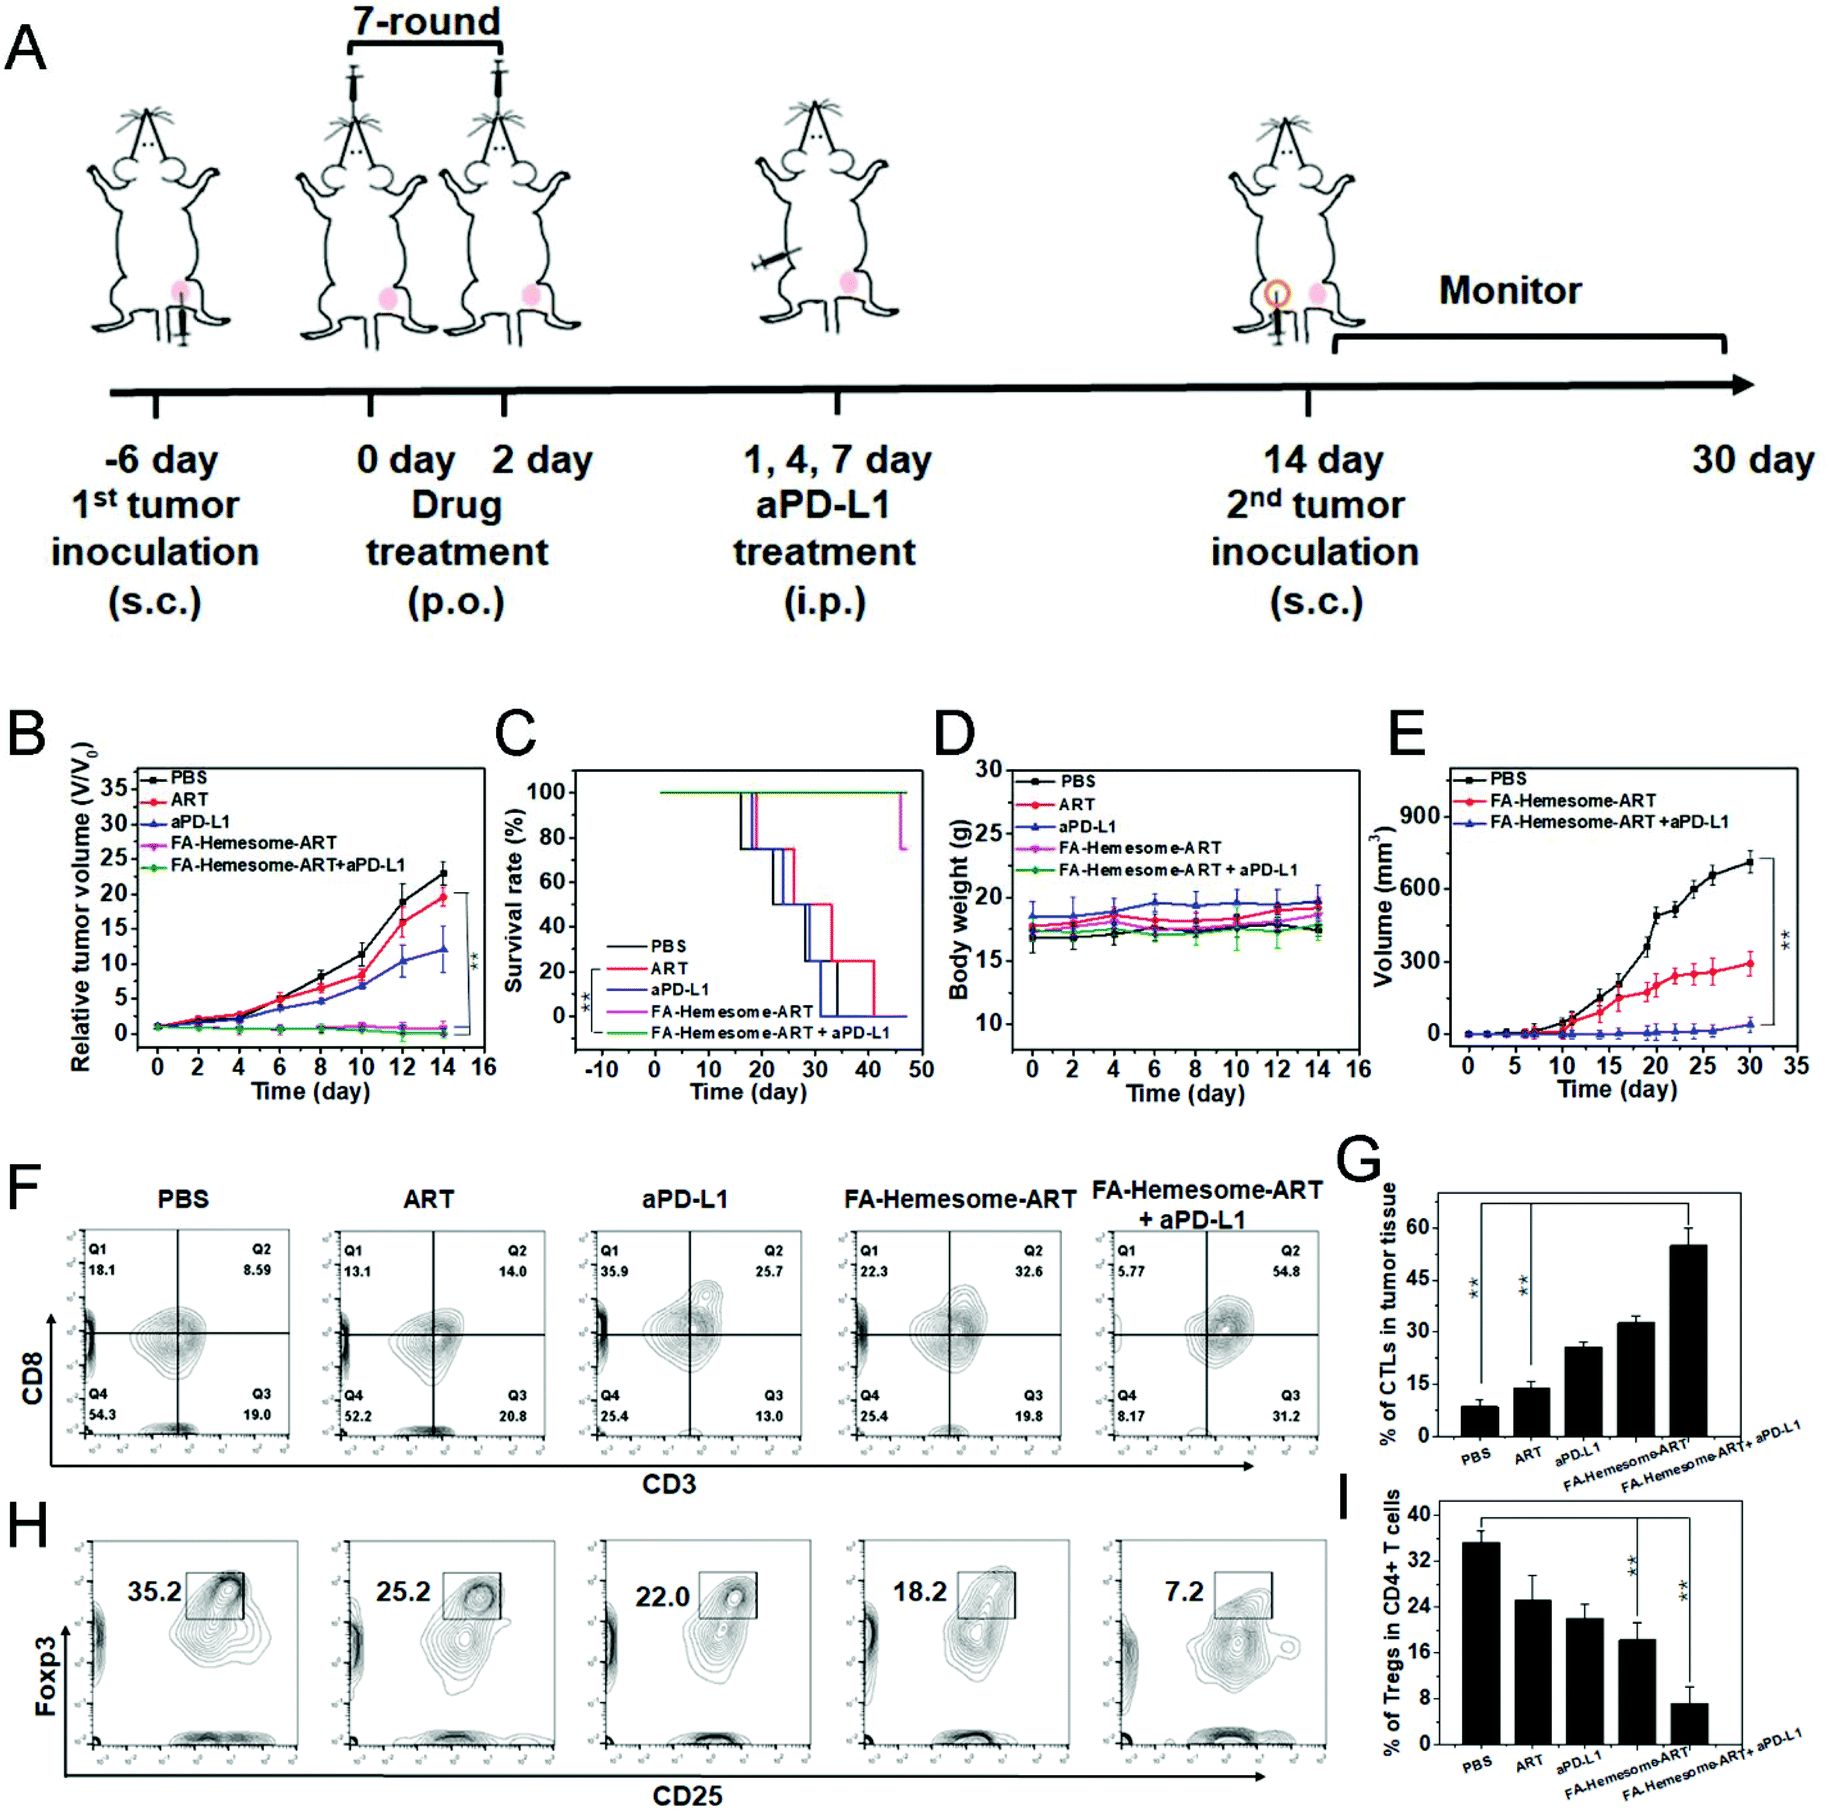 | ||
| Fig. 6 FA-Hemesome-ART NPs mediated chemotherapy generates ICD to synergize aPD-L1. (A) Schematic illustration of chemotherapy combined with immunotherapy for MC38 tumor-bearing mice. (B–D) Tumor growth curves (B), survival curves (C) and body weights (D) of MC38 tumor bearing mice after oral treatment with PBS, ART, aPD-L1, FA-Hemesome-ART NPs and FA-Hemesome-ART NPs + aPD-L1 at a dose of 5 mg kg−1 ART every other day (n = 4). aPD-L1 was intraperitoneally injected at the 1st, 4th, and 7th day at a total dose of 75 μg per mouse. (E) Tumor growth curves after re-challenge with MC38 tumor cells on cured mice as treated from Fig. 5A. (F–G) Flow cytometric (F) and statistic analysis (G) of the intratumoral infiltration of CTLs (CD3+CD8+) (n = 3). (H–I) Flow cytometric (H) and statistic analysis (I) of the intratumoral infiltration of Tregs (CD25+Foxp3+) (n = 3). **p < 0.01 obtained by Student's two-tailed t test. | ||
In addition, the relevant cytokines (such as TNF-α and IL-6) would be produced during the process of antitumor immunity.36,37 After treated orally with ART and FA-Hemesome-ART for 3 days, the tumor samples from each group were obtained and the contents of TNF-α and IL-6 were detected via ELISA. As shown in Fig. S13†, the intratumoral contents of TNF-α and IL-6 obviously increased at least two times in the FA-Hemesome-ART group. Meanwhile, the dendritic cells (DCs) maturation rate was 2.9-fold higher than that of free ART (14.6 vs. 4.9) in lymph nodes (LNs) of tumor mouse (Fig. S14†).
We then performed the tumor challenge study to confirm the immune memory response in MC38 tumor-bearing mice. After oral treatment with FA-Hemesome-ART NPs with aPD-L1 injection, 1 × 10⁶ MC38 cells were inoculated again into the contralateral flank (Fig. 6A). The mice treated with FA-Hemesome-ART NPs plus aPD-L1 remained tumor free 30 days after the challenge (Fig. 6E), indicating its strong immune memory effect against subsequent encounters with the same tumor cells after combination treatment with checkpoint blockade immunotherapy.
The biosafety of FA-Hemesome-ART NPs
To evaluate the biosafety of FA-Hemesome-ART NPs, mice were sacrificed 1 day and 7 days post-treatment with FA-Hemesome-ART NPs orally, and the blood biochemistry and hematologic indexes were analyzed. All the analyses were in the normal range (Fig. 7A and B). The hematoxylin and eosin (H&E) staining further indicated no obvious inflammation or damage in any organs after treatment (Fig. 7C). Thus, we believe that the oral administration of FA-Hemesome-ART NPs has great biocompatibility. | ||
| Fig. 7 The biosafety of FA-Hemesome-ART NPs. (A) Blood biochemistry and (B) hematology analysis of healthy mice 1 day and 7 days after oral treatment with FA-Hemesome-ART NPs (n = 3). ALT, alanine transferase; AST, aspartate transferase; BUN, blood urea nitrogen; TP, total protein; WBC, white blood cells; RBC, red blood cells; HGB, hemoglobin; HCT, hematocrit; MCH, mean corpuscular hemoglobin; MCV, mean corpuscular volume; RDW, red cell distribution width; and MCHC, mean corpuscular hemoglobin concentration. (C) H&E staining of heart, liver, spleen, lungs, and kidneys excised from mice treated with FA-Hemesome-ART NPs and without treatment after an in vivo antitumor study. Scale bar: 50 μm. | ||
Conclusions
In summary, we developed a folate receptor-targeted drug delivery system (FA-Hemesome-ART NPs) to co-deliver ART and hemin for enhanced cancer chemotherapy and immunotherapy. FA-Hemesome-ART NPs were relatively stable in the blood circulation and gastrointestinal tract environment, but could be triggered to release ART in PLA2 at pH 5.5. Moreover, FA-Hemesome-ART NPs can be efficiently transported across the epithelium of the intestine, with a plasma concentration–time curve area around 30.83 μg h mL−1, suitable for oral administration. The synergistic chemotherapeutic effect of hemin and ART was demonstrated both in vitro and in vivo. In mouse models, oral administration of FA-Hemesome-ART NPs (5 mg kg−1 ART per day for two weeks) together with intraperitoneal injection of aPD-L1 (70 μg per mouse) completely inhibited tumor growth within 30 days. The cured mice remained tumor free 30 days after they were challenged with another inoculation of MC38 cells, indicating a strong immune memory response. Together with their excellent biocompatibility and high bioavailability, we believe that these FA-Hemesome-ART NPs hold great potential as an oral drug for cancer therapy.Author contributions
Qing Wang: investigation, data curation, visualization, and writing—original draft. Naijie Wei: data curation, visualization, and writing—original draft. Jingru Guo: visualization and investigation. Kai Feng: visualization and investigation. Jinwei Zhang: visualization. Yin Kwan Wong: visualization and writing—reviewing and editing. Jigang Wang: validation, supervision, writing—reviewing and editing, and funding acquisition. Xiaolian Sun: conceptualization, validation, supervision, writing—reviewing and editing, funding acquisition, and project administration.Conflicts of interest
There are no conflicts to declare.Acknowledgements
This work was supported by the National Key Research and Development Program of China (2016YFA0203600), the National Natural Science Foundation of China (81971738 81571743), and the Project Program of State Key Laboratory of Natural Medicines, China Pharmaceutical University (SKLNMZZRC05).References
- H. Sung, J. Ferlay, R. L. Siegel, M. Laversanne, I. Soerjomataram, A. Jemal and F. Bray, Ca-Cancer J. Clin., 2021, 71(3), 209–249 CrossRef PubMed.
- S. Srivastava, E. J. Koay, A. D. Borowsky, A. M. De Marzo, S. Ghosh, P. D. Wagner and B. S. Kramer, Nat. Rev. Cancer, 2019, 19(6), 349–358 CrossRef CAS PubMed.
- M. Overchuk, M. Zheng, M. A. Rajora, D. M. Charron, J. Chen and G. Zheng, ACS Nano, 2019, 13, 4560–4571 CrossRef CAS PubMed.
- D. Wang, J. Zhou, R. Chen, R. Shi, G. Zhao, G. Xia, R. Li, Z. Liu, J. Tian, H. Wang, Z. Guo, H. Wang and Q. Chen, Biomaterials, 2016, 100, 27–40 CrossRef CAS PubMed.
- A. Slomski, J. Am. Med. Assoc., 2018, 320, 2521 Search PubMed.
- Y. Tu, Nat. Med., 2011, 17, 1217–1220 CrossRef CAS PubMed.
- Y. Tu, Angew. Chem., Int. Ed., 2016, 55, 10210–10226 CrossRef CAS PubMed.
- W. B. Yao, F. Wang and H. Wang, Sci. Bull., 2016, 61, 1399–1406 CrossRef CAS.
- Y. Cao, Y. H. Feng, L. W. Gao, X. Y. Li, Q. X. Jin, Y. Y. Wang, Y. Y. Xu, F. Jin, S. L. Lu and M. J. Wei, Int. Immunopharmacol., 2019, 70, 110–116 CrossRef CAS PubMed.
- D. Chaturvedi, A. Goswami, P. Pratimsaikia, N. Barua and P. Rao, Chem. Soc. Rev., 2010, 39, 435–454 RSC.
- G. Zhiguo, L. Yao-Jia, Y. Chaoqun, S. Kai, A. Peijing, S. Chen, W. Ming-Xin, Z. Xiaoli and S. Bai-Wang, ACS Appl. Bio Mater., 2018, 1(2), 270–280 CrossRef PubMed.
- J. Chen, W. Zhang, M. Zhang, Z. Guo, H. Wang, M. He, P. Xu, J. Zhou, Z. Liu and Q. Chen, Nanoscale, 2015, 7, 12542–12551 RSC.
- J. Wang, C. J. Zhang, W. N. Chia, C. C. Loh, Z. Li, Y. M. Lee, Y. He, L. X. Yuan, T. K. Lim, M. Liu, C. X. Liew, Y. Q. Lee, J. Zhang, N. Lu, C. T. Lim, Z. C. Hua, B. Liu, H. M. Shen, K. S. Tan and Q. Lin, Nat. Commun., 2015, 6, 10111 CrossRef CAS PubMed.
- C. J. Zhang, J. Wang, J. Zhang, Y. M. Lee, G. Feng, T. K. Lim, H. M. Shen, Q. Lin and B. Liu, Angew. Chem., Int. Ed., 2016, 55, 13770–13774 CrossRef CAS PubMed.
- T. D. MacDonald, T. W. Liu and G. Zheng, Angew. Chem., Int. Ed., 2014, 53, 6956–6959 CrossRef CAS PubMed.
- W. Hou, J. W. H. Lou, J. Bu, E. Chang, L. Ding, M. Valic, H. H. Jeon, D. M. Charron, C. Coolens and D. Cui, Angew. Chem., Int. Ed., 2019, 58(42), 14974–14978 CrossRef CAS PubMed.
- J. F. Lovell, C. S. Jin, E. Huynh, H. Jin, C. Kim, J. L. Rubinstein, W. C. Chan, W. Cao, L. V. Wang and G. Zheng, Nat. Mater., 2011, 10, 324–332 CrossRef CAS PubMed.
- L. Cui, Q. Lin, C. S. Jin, W. Jiang and G. Zheng, ACS Nano, 2015, 9, 4484–4495 CrossRef CAS PubMed.
- B. Meunier and A. Robert, Acc. Chem. Res., 2010, 43, 1444–1451 CrossRef CAS PubMed.
- Y. Zhou, W. Li and Y. Xiao, ACS Chem. Biol., 2016, 11, 882–888 CrossRef CAS PubMed.
- C. S. Jin, L. Cui, F. Wang, J. Chen and G. Zheng, Adv. Healthcare Mater., 2014, 3(8), 1240–1249 CrossRef CAS PubMed.
- Y. Shahzad, S. N. H. Shah, M. T. Ansari, R. Riaz, A. Safdar, T. Hussain and M. Malik, Chin. Sci. Bull., 2012, 57, 1685–1692 CrossRef CAS.
- F. Mathot, A. D. Rieux, A. AriëN, Y. J. Schneider, M. Brewster and V. Préat, J. Controlled Release, 2007, 124, 134–143 CrossRef CAS PubMed.
- J. D. Castile and K. M. Taylor, Int. J. Pharm., 1999, 188, 87–95 CrossRef CAS PubMed.
- J. M. Harris and R. B. Chess, Nat. Rev. Drug Discovery, 2003, 2, 214–221 CrossRef CAS PubMed.
- R. I. Pinhassi, Y. G. Assaraf, S. Farber, M. Stark, D. Ickowicz, S. Drori, A. J. Domb and Y. D. Livney, Biomacromolecules, 2010, 11, 294–303 CrossRef CAS PubMed.
- P. J. Pedersen, M. S. Christensen, T. Ruysschaert, L. Linderoth and M. H. Clausen, J. Med. Chem., 2009, 52, 3408–3415 CrossRef CAS PubMed.
- J. P. Laye and J. H. Gill, Drug Discovery Today, 2003, 8, 710–716 CrossRef CAS PubMed.
- T. Shimizu, A. Lengalova, V. Martínek and M. Martínková, Chem. Soc. Rev., 2019, 48(24), 5624–5657 RSC.
- J. Huang, Z. Xiao, Y. An, S. Han, W. Wu, Y. Wang, Y. Guo and X. Shuai, Biomaterials, 2021, 269, 120636 CrossRef CAS PubMed.
- L. F. Hou and H. C. Huang, Pharmacol. Ther., 2016, 166, 123–127 CrossRef CAS PubMed.
- Y. Zhang, G. M. Xiong, Y. Ali, B. O. Boehm, Y. Y. Huang and S. Venkatraman, Nanoscale, 2021, 13, 776–789 RSC.
- H. Li, M. Chen, Z. Su, M. Sun and Q. Ping, Int. J. Pharm., 2016, 511, 524–537 CrossRef CAS PubMed.
- P. Artursson, K. Palm and K. Luthman, Adv. Drug Delivery Rev., 2012, 64, 280–289 CrossRef.
- M. and Singh, Pharmaceuticals, 2019, 12, 164 CrossRef PubMed.
- B. Feng, Z. Niu, B. Hou, L. Zhou, Y. Li and H. Yu, Adv. Funct. Mater., 2020, 30, 1906605 CrossRef CAS.
- C. Zhang, F. Gao, W. Wu, W. X. Qiu, L. Zhang, R. Li, Z. N. Zhuang, W. Yu, H. Cheng and X. Z. Zhang, ACS Nano, 2019, 13, 11249–11262 CrossRef CAS PubMed.
Footnotes |
| † Electronic supplementary information (ESI) available: Synthesis and characterization of lipid-hemin; details on cytotoxicity studies in vitro and in vivo. See DOI: 10.1039/d1nr01302e |
| ‡ These authors made equal contributions to this work. |
| This journal is © The Royal Society of Chemistry 2021 |