
 Open Access Article
 This Open Access Article is licensed under a
 Creative Commons Attribution 3.0 Unported Licence
Small iron oxide nanoparticles as MRI T1 contrast agent: scalable inexpensive water-based synthesis using a flow reactor†
Maximilian O.
Besenhard
 a,
Luca
Panariello
a,
Céline
Kiefer
b,
Alec P.
LaGrow
c,
Liudmyla
Storozhuk
d,
Francis
Perton
b,
Sylvie
Begin
b,
Damien
Mertz
b,
Nguyen Thi Kim
Thanh
*de and
Asterios
Gavriilidis
*a
a,
Luca
Panariello
a,
Céline
Kiefer
b,
Alec P.
LaGrow
c,
Liudmyla
Storozhuk
d,
Francis
Perton
b,
Sylvie
Begin
b,
Damien
Mertz
b,
Nguyen Thi Kim
Thanh
*de and
Asterios
Gavriilidis
*a
aDepartment of Chemical Engineering, University College London, London, WC1E 7JE, UK. E-mail: a.gavriilidis@ucl.ac.uk
bInstitut de Physique et Chimie des Matériaux de Strasbourg, BP 43, 67034, Strasbourg, France
cInternational Iberian Nanotechnology Laboratory, Braga 4715-330, Portugal
dBiophysics group, Department of Physics and Astronomy, University College London, London, WC1E 6BT, UK. E-mail: ntk.thanh@ucl.ac.uk
eUCL Healthcare Biomagnetic and Nanomaterials Laboratories, 21 Albemarle Street, London, W1S 4BS, UK
First published on 24th March 2021
Abstract
Small iron oxide nanoparticles (IONPs) were synthesised in water via co-precipitation by quenching particle growth after the desired magnetic iron oxide phase formed. This was achieved in a millifluidic multistage flow reactor by precisely timed addition of an acidic solution. IONPs (≤5 nm), a suitable size for positive T1 magnetic resonance imaging (MRI) contrast agents, were obtained and stabilised continuously. This novel flow chemistry approach facilitates a reproducible and scalable production, which is a crucial paradigm shift to utilise IONPs as contrast agents and replace currently used Gd complexes. Acid addition had to be timed carefully, as the inverse spinel structure formed within seconds after initiating the co-precipitation. Late quenching allowed IONPs to grow larger than 5 nm, whereas premature acid addition yielded undesired oxide phases. Use of a flow reactor was not only essential for scalability, but also to synthesise monodisperse and non-agglomerated small IONPs as (i) co-precipitation and acid addition occurred at homogenous environment due to accurate temperature control and rapid mixing and (ii) quenching of particle growth was possible at the optimum time, i.e., a few seconds after initiating co-precipitation. In addition to the timing of growth quenching, the effect of temperature and dextran present during co-precipitation on the final particle size was investigated. This approach differs from small IONP syntheses in batch utilising either growth inhibitors (which likely leads to impurities) or high temperature methods in organic solvents. Furthermore, this continuous synthesis enables the low-cost (<£10 per g) and large-scale production of highly stable small IONPs without the use of toxic reagents. The flow-synthesised small IONPs showed high T1 contrast enhancement, with transversal relaxivity (r2) reduced to 20.5 mM−1 s−1 and longitudinal relaxivity (r1) higher than 10 mM−1 s−1, which is among the highest values reported for water-based IONP synthesis.
Introduction
The current interest for novel positive (T1) contrast agents for magnetic resonance imaging (MRI) arises from the health risks posed by the current clinical choices, i.e., gadolinium complexes.1 Iron oxide nanoparticles (IONPs) are a potential substitute, as they are biocompatible with several FDA approved products2–4 and high T1 values (i.e., long times till the longitudinal magnetisation regrows to its maximum value before an MRI pulse) have been observed for exceedingly small particles.5–8The promising T1 performance of small IONPs (≤5 nm) is due to their high surface-to-volume ratio increasing the exposure of surface Fe ions to the surrounding water/hydrogen.6,9,10 In contrast to IONPs used for T2 contrast enhancement, their performance is not dominated by the high magnetic moment. The exact mechanism controlling T1 performance is still not clear, but may rely on the accessibility of water molecules to surface iron ions similarly to Gd complexes. Despite their desirable characteristics, the reproducible and scalable production of biocompatible small IONPs remains challenging.6,11,12
Thermal decomposition syntheses, where organic iron precursors are heated above 200 °C in high boiling point organic solvents can provide highly monodisperse IONPs with diameters significantly below 5 nm and excellent T1 performance.13–20 When targeting biomedical applications, however, the involved reagents, by-products, and organic solvents present challenges. For example, labour and cost-intensive post-processing are required, such as a time-consuming ligand exchange step, to render the IONPs dispersible in aqueous solution. For polyol methods, however, ligand exchange has been achieved via simple experimental protocols.11
Water-based precipitation methods, such as co-precipitation (CP) methods21 or the oxidation of initially precipitated ferrous hydroxides22 are more desirable from a regulatory perspective, but provide limited control of particle formation dynamics, hence, IONP size. Still, the synthesis of small IONPs via aqueous precipitation methods was demonstrated recently, as described below. The common method to synthesise small IONPs is the addition of chelating ions23 or macromolecules such as dextran (which likely yields agglomerates with a reduced surface area),7,24 frequently in combination with the initiation of CP, i.e., mixing of the precursor and base solution, at high temperatures25 followed by a controlled cooling.26,27 Also, fast mixing has been shown to promote the synthesis of small IONPs.28–30 Alternatively, small IONPs for MRI can be produced via rapid (microwave) heating of a FeCl3 and trisodium citrate solution together with the reducing agent hydrazine.31,32
The route for IONP T1 contrast agents to reach market maturity is long and brings challenges, not only for chemists, but also engineers and entrepreneurs. It is well understood that only synthetic protocols yielding high performance contrast agents without using scarce, expensive, or toxic reagents/additives are worth considering. The scalability of a synthesis is pivotal too.
Scale-up is commonly considered as the logical step following the proof of principle, but up-scaling of lab procedures is frequently very challenging. Hence scalability and pilot production (at rates way below full-scale production) have been identified as key issues in bringing research across the so called “Valley of Death” (the gap between research and commercialisation) in high-cost, and high-risk areas such as nanotechnology.33,34
In this work, we present a novel synthesis of small IONPs utilising flow chemistry. Flow reactors have been widely used for nanoparticle synthesis35–38 including IONPs39–43 as they are advantageous for fast mixing, precise temperature control, and can operate continuously, providing opportunities for large-scale production. We demonstrate how these advantages, in conjunction with closely timed reagent addition to quench particle growth just after the formation of the most magnetic iron oxide phase (the inverse spinel structure of magnetite Fe3O4 and/or maghemite γ-Fe2O3), lead to small IONPs with good T1 performance at large scale using aqueous syntheses.
In the following, we show how the presence of dextran, alteration of the quenching time and of the reaction temperature affect the flow synthesis, discuss the exact quenching mechanism and the IONP T1 contrast agent potential.
Materials and methods
Solution preparation
Following our previous procedure,44 a 0.1 M Fe precursor solution was prepared by dissolving ferrous and ferric chlorides in a 1![[thin space (1/6-em)]](https://www.rsc.org/images/entities/char_2009.gif) :2 FeCl2·4H2O:FeCl3·6H2O molar ratio in deionised (DI) water (resistivity ≥ 15 MΩ cm), yielding a pHprecursor of 1.8. For studies using dextran (Mw ∼6000 g mol−1), the equivalent of one H(C6H10O5) unit per Fe was added to the precursor solution. The precursor solution was prepared freshly for each experiment. As base solution served a 0.57 M NaOH solution prepared from 2 M NaOH stock solution and DI water. For growth quenching and stabilisation (as discussed later) a 0.32 M citric acid (CA) solution, with a pHCA of 1.8, was used. Details of all chemicals used including product numbers are provided in the electronic supplementary information (ESI), see Table S1.†
:2 FeCl2·4H2O:FeCl3·6H2O molar ratio in deionised (DI) water (resistivity ≥ 15 MΩ cm), yielding a pHprecursor of 1.8. For studies using dextran (Mw ∼6000 g mol−1), the equivalent of one H(C6H10O5) unit per Fe was added to the precursor solution. The precursor solution was prepared freshly for each experiment. As base solution served a 0.57 M NaOH solution prepared from 2 M NaOH stock solution and DI water. For growth quenching and stabilisation (as discussed later) a 0.32 M citric acid (CA) solution, with a pHCA of 1.8, was used. Details of all chemicals used including product numbers are provided in the electronic supplementary information (ESI), see Table S1.†
IONP flow synthesis
Independently of the CA quantity fed, the IONP diameter changed only marginally and stayed around 7 nm (which corresponds to about three times the volume of 5 nm particles). We envisioned that an earlier addition of the CA solution (before IONP growth is completed) could initiate the partial dissolution of IONPs formed or possible intermediates, hindering the particles from growing further. Therefore, a CA solution was fed via a second T-mixer, just after initiating the CP. In order to find the optimum time to quench IONP growth, i.e., just after magnetite/maghemite formation (within seconds after initiating CP),44 the PTFE tube length between the first and second T-mixer was adapted to quench after 0.5 s, 2 s, 5 s, (see Fig. 1a) or 100 s. In the following, “magnetite” is used to refer to magnetite/maghemite mixtures, since an accurate differentiation between magnetite and maghemite is not possible with the diffraction-based characterisation and imaging methods used.
 | ||
| Fig. 1 Schematic of (a) precisely-timed quenching (Q) of particle growth after 0.5 s, 2 s and 5 s after initiation of co-precipitation (CP) and (b) multistage flow reactor to initiate co-precipitation (step 1), quenching and stabilisation (step 2, here after 0.5 s) and aging (step 3). | ||
The three steps could be performed at different but well defined temperatures (30–90 °C) due to the modular reactor design. The temperature was controlled by magnetically stirred water baths, into which the reactor elements were immersed to guarantee uniform conditions. For all flow syntheses 60 °C was used for step 3. A schematic of the entire flow set-up is shown in Fig. 1b. The details of the reactor components used including geometries, materials, and part numbers/manufacturers are provided in Table S2.†
Characterisation
The hydrodynamic diameter Dh was obtained at 22 °C via dynamic light scattering (DelsaMax-Pro, Beckman Coulter). Samples were diluted with DI water up to the point where the Dh plateaued (typically after a four-fold dilution). Transmission electron microscope (TEM) images were captured with a JEOL 1200 EX microscope at a 120 kV acceleration voltage. High resolution TEM (HRTEM) images were taken with a JEOL 2100 operating at 200 kV. TEM samples were prepared by dropping 20 μl of washed IONP solution onto carbon-coated copper grids, which were then dried overnight. The washing procedure, repeated twice, included precipitation from solution with isopropyl alcohol (IPA) (2:1 IPAvol:samplevol) and magnetic decantation. The particle diameter refers to a circle with the same area as the polygon obtained by fitting the edges of a particle. The average diameter DTEM was obtained by manually fitting polygons around at least 100 particles in ImageJ (errors refer to the standard deviation).
The concentration of Fe in the form of particles (mgFe-IONP ml−1) was measured via microwave plasma atomic emission spectroscopy (MP-AES) using a 4210 MP-AES (Agilent). Samples for MP-AES were washed as described above and dried before digestion in aqua regia (3:1 HClvol:HNO3 vol). After digestion, the samples were diluted with DI water (1:9 aqua regiavol:DI watervol). The percentage of Fe conversion from precursor (concentration in mgFe-sol ml−1) to IONPs (which could be separated by the described washing procedure) was calculated as [(mgFe-IONP ml−1)/(mgFe-sol ml−1)] 100. X-ray diffraction (XRD) patterns of washed and dried samples were recorded using a PANalytical X'Pert3 diffractometer (Malvern Instruments) equipped with a Co Kα radiation source (λ = 0.179 nm) operated at 40 mA and 40 kV.
SAXS measurements were performed with a Ganesha SAXSlab (Xenocs) equipped with a point focus X-ray source and a 2D detector. All curves were recorded over 1 h measurement time, within 24 h after synthesis. SAXS samples were prepared by injecting the IONP solutions (as synthesised) into 1 mm borosilicate glass capillaries (Capillary Tube Supplies).
Magnetisation hysteresis cycles at 5 K and 300 K were recorded using a superconducting quantum interference device (SQUID) magnetometer (MPMS, Quantum Design). For that, dialysed IONP solutions were dried and loaded in a capsule adapted for SQUID measurements.
Thermogravimetric analysis (TGA) was performed on an SDT 600 (TA instruments), heating the dried sample from 25 to 600 °C at 5 °C min−1 under air. The TGA results were used to normalise the magnetic hysteresis curves by the amount of IONP (magnetite) and Fe per g sample (see ESI 5†).
T 1 and T2 relaxation times of IONPs were measured on a Minispec 60 (Brucker) at 37 °C, a frequency of 60 MHz, and using magnetic field strength of 1.41 T. The longitudinal (r1 [mM−1 s−1]) and transversal (r2 [mM−1 s−1]) relaxivities were obtained from a linear regression through the relaxivity and iron concentration (CFe [mM]) dependent relaxation rates R (=1/T [s−1]): R = R0 + r·CFe, where R0 is the relaxation rate of the aqueous medium. The iron concentration of IONP sample solutions (which were consecutively diluted for R measurements) was quantified by T1-relaxometry using a calibration curve for Fe3+ as reported previously.46,47 To establish the calibration curve, T1 relaxation rates of standard solutions, i.e., Fe(III) nitrate (Fe(NO3)3) in 2%vol nitric acid (HNO3), were traced as a function of Fe3+. The IONP sample solutions were digested with concentrated nitric acid (i.e., a strong oxidising agent) overnight to yield an Fe(III) solution, and subsequently diluted with DI water to obtain a 2%vol HNO3 solution, i.e., the same HNO3 concentration used for the calibration curve. T1 relaxation time measurements of the 2%vol HNO3 sample solution provided the iron concentration by comparison with the calibration curve.
Results and discussion
IONP flow synthesis in the presence of dextran
Following a common method to synthesise small IONPs, a macromolecule, i.e., dextran, was added to the precursor solution. When feeding the CA solution at 2.1 ml min−1 using a tube length corresponding to 100 s after initiating CP (all steps carried out at the standard reaction temperature of 60 °C), agglomerates of precipitates formed and grew on their way through the reactor. This resulted in plugging after several minutes of operation. Stable reactor operation, however, was possible when adding the CA solution using a tube length corresponding to 5 s after initiating CP. Since the precursor solution is more acidic with dextran added, the feed rate of the CA solution was reduced from 2.1 ml min−1 (used to stabilise particles in absence of dextran44) to 1.7 ml min−1 in order to avoid dissolving the particles completely. TEM analysis showed a small fraction of particles >10 nm (Fig. 2a1) with most of the particles being too small to determine their size (Fig. 2a2). HRTEM showed that these particles had a diameter around 2 nm (see Fig. 2b). The presence of such ultra-small particles (≤3 nm) at short process times (such as just after initiating the CP) is in line with previous reports on CP synthesis with macromolecules,26 including dextran.48,49 | ||
| Fig. 2 Analysis of IONPs synthesised with dextran in the precursor solution and quenching 5 s after initiating co-precipitation. (a) TEM images of small fraction of particles >10 nm (a1) and ultra-small IONPs (a2). (b) HRTEM image of ultra-small IONPs with a higher magnification image matching the [111] zone axes of magnetite with the two 2.5 Å (113) planes and one 2.9 Å (220) plane. (c) Electron diffraction pattern (of the area in Fig. 2b) and the radially averaged diffraction profile matching the pattern of magnetite (PDF ref. 03-065-3107). (d) Schematic of flow synthesis in the presence of dextran. | ||
The ultra-small particles were identified as crystalline and of the inverse spinel structure (magnetite and/or maghemite) by HRTEM analysis including electron diffraction and zone axis analysis (see Fig. 2b and c). This agrees with the XRD pattern showing only peaks characteristic for the inverse spinel structure (see Fig. S1†). The low conversion obtained of 35% (0.85 mgFe-IONP ml−1) is anticipated as the CA solution was shown to dissolve ∼50% of the IONPs at this CA flow rate.44
SAXS analysis indicated highly aggregated/agglomerated structures, as the SAXS curve follows a power law function, (see Fig. S11b†). The formation of agglomerated structures in the presence of dextran is consistent with the measured hydrodynamic diameter Dh = 60 nm (which is much larger than the structures seen via TEM). The continuation of this agglomeration when quenching after 100 s (instead of 5 s) is what caused reactor plugging.
IONP flow synthesis with different quenching times
As explained for step 2 when describing the reactor operation, the CP synthesis yields magnetite particles within seconds. Hence, the CA solution was fed 0.5 s, 2 s and 5 s after initiating CP (i.e., mixing the base and precursor solution without dextran at the standard reaction temperature of 60 °C) to find the optimum time to quench IONP growth. The synthesis with the shortest quenching time (0.5 s) yielded a dilute brownish solution when exiting the second T-mixer, as observed previously when excess CA was used for stabilisaiton.44 Hence, the CA solution flow rate was reduced to 1.9 ml min−1. Still, the sample appeared reddish and separation via magnetic decantation (after precipitation out of solution with IPA) was challenging. This suggested the presence of phases other than the magnetic inverse spinel structure. The intermediate particles reported for CP syntheses were shown to be amorphous and significantly larger than the final IONPs (of the inverse spinel structure).45,50 This is in agreement with the large hydrodynamic diameter (Dh = 90 nm) and the XRD pattern showing no evidence of another crystalline phase (see green line in Fig. 3a). The XRD pattern corresponding to a quenching time of 0.5 s shows no clear indication for crystalline phases, besides the broad peaks for magnetite.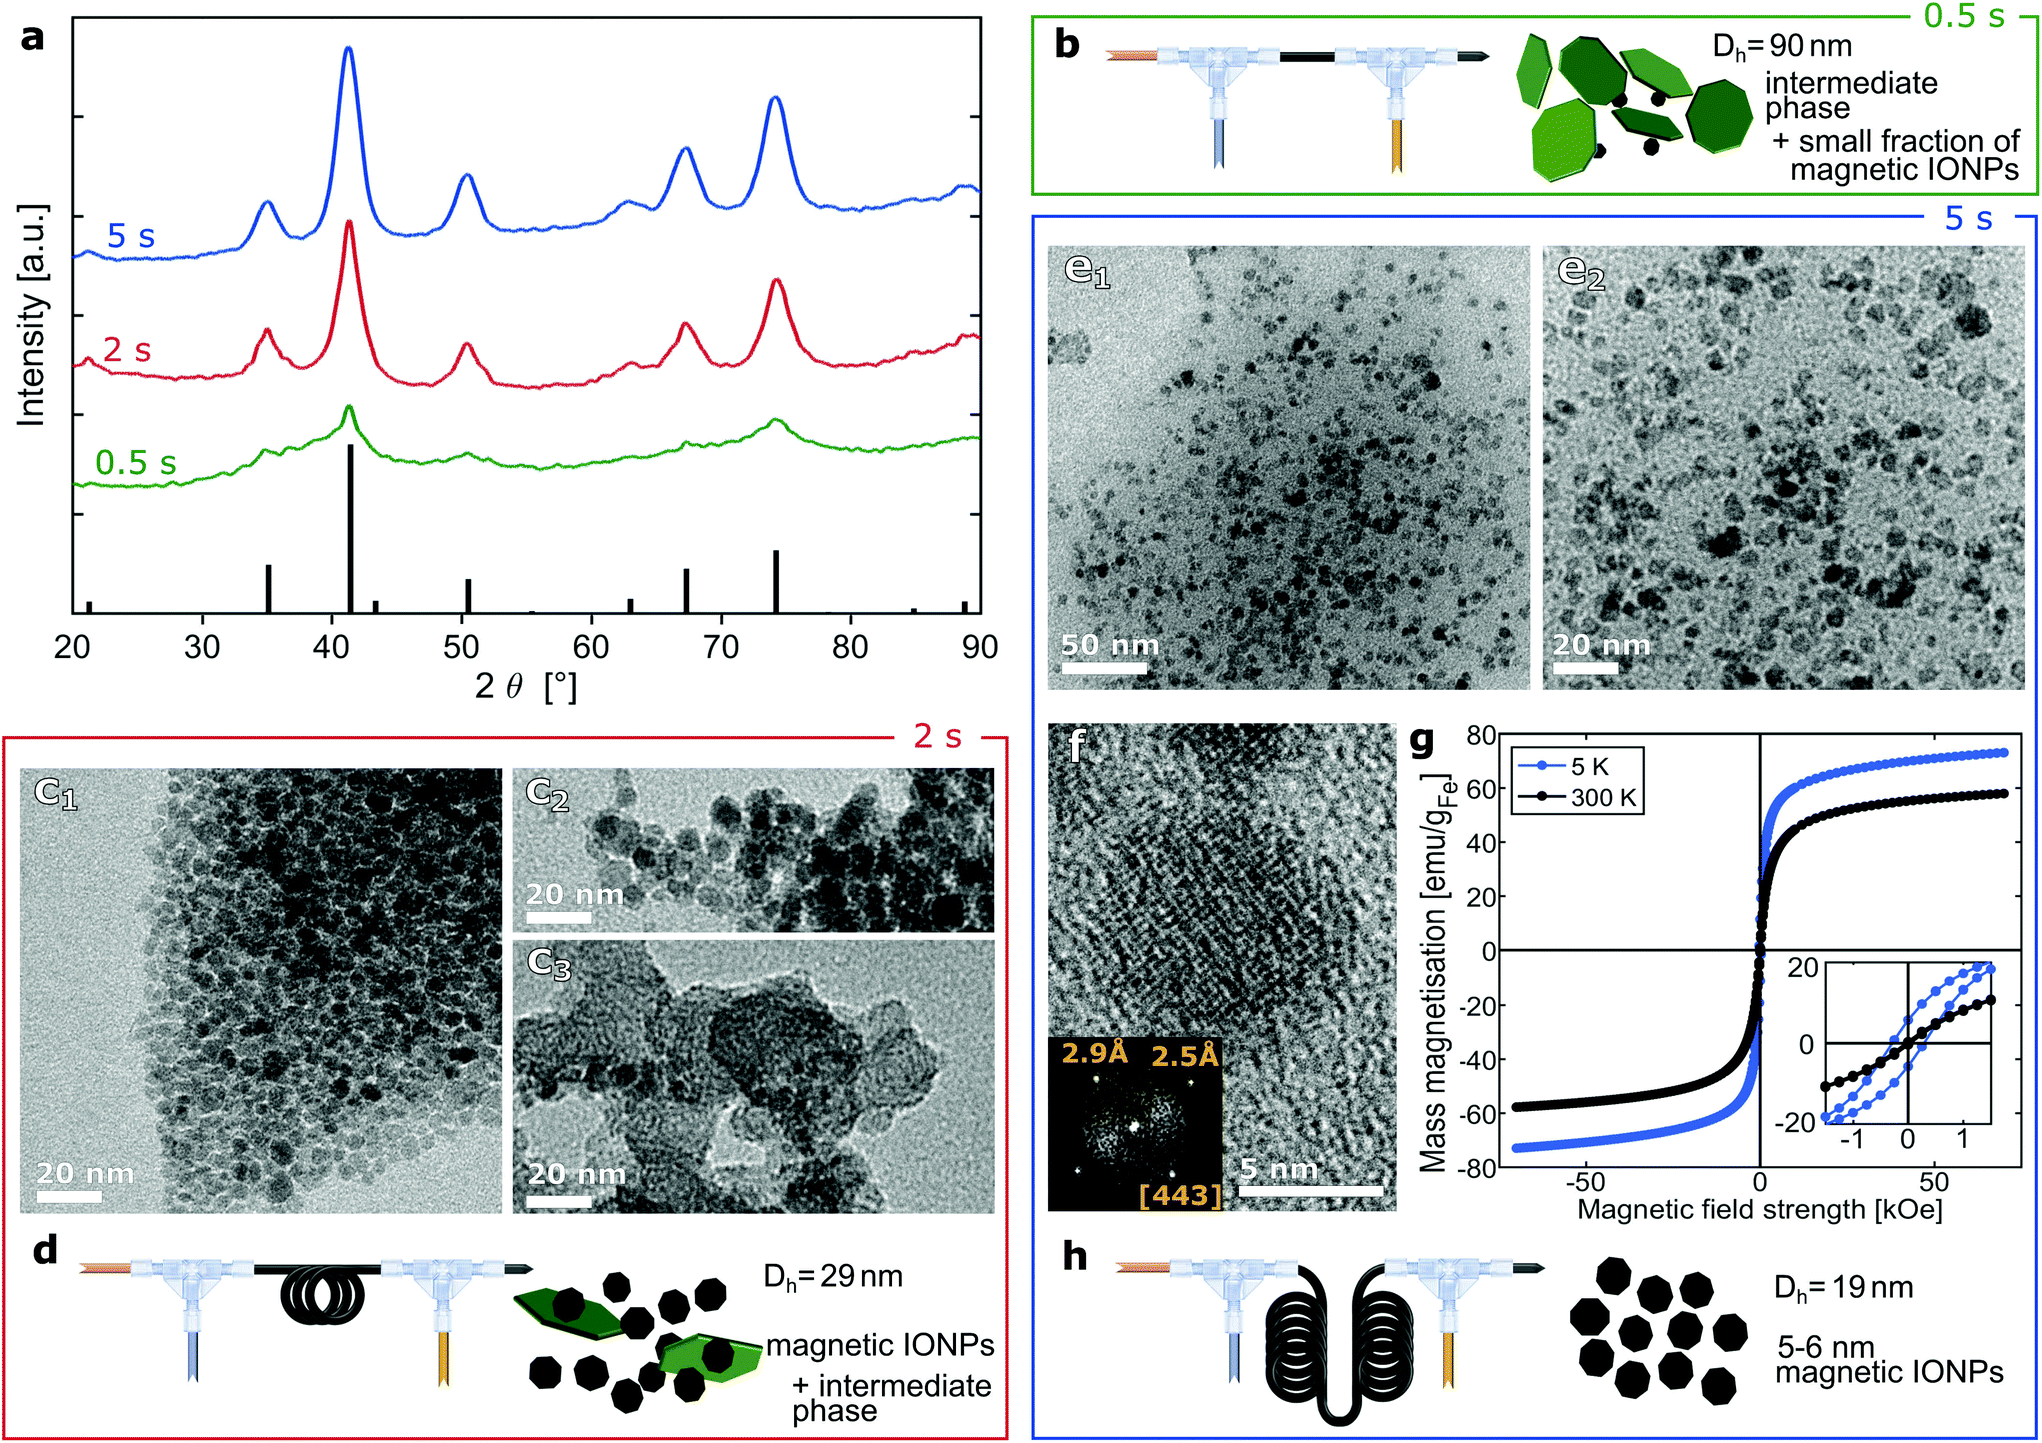 | ||
| Fig. 3 Analysis of IONPs synthesised with quenching at 0.5, 2 and 5 s after initiating co-precipitation. (a) XRD pattern. The black bars at the bottom reference the pattern of the inverse spinel structure (magnetite: PDF ref. 03-065-3107). Fig. S2† shows the overlaid patterns (including the one for quenching at 100 s). (b) Schematic of flow synthesis with quenching at 0.5 s. (c1–3) TEM images of IONPs synthesised with quenching at 2 s, DTEM = 4.6 ± 1.0 nm (analysing only particles that were assumed to be magnetite based on contrast, size and shape). Fig. S3† shows the particle size distribution. (d) Schematic of flow synthesis with quenching at 2 s. (e1–2) TEM images (of different magnifications) of small IONPs synthesised with quenching at 5 s, DTEM = 5.3 ± 0.9 nm. Fig. S4† shows the particle size distribution. (f) HRTEM image of IONPs synthesised with quenching at 5 s. The inset shows the FFT analysis confirming the inverse spinel structure viewed down the [443] zone axis. (g) Magnetisation hysteresis curves of IONPs synthesised with quenching at 5 s. (h) Schematic of flow synthesis with quenching at 5 s. | ||
For a quenching time of 2 s with the standard CA solution feed rate of 2.1 ml min−1, no problem in terms of excessive particle dissolution was found. The collected solution had the expected black colour and it was a highly stable colloid with a conversion of 42% (0.98 mgFe-IONP ml−1). The Dh dropped to 29 nm and the XRD showed the peaks expected for inverse spinel IONPs (see red line in Fig. 3a). Still, TEM analysis revealed, besides the expected particles in the range of 4–6 nm (see Fig. 3c1), larger structures of a different appearance (see Fig. 3c2–3).
When quenching after 5 s with a feed of 2.1 ml min−1 CA solution, the conversion remained at 42% and peaks of the XRD pattern became even more pronounced (see blue line in Fig. 3a). TEM analysis showed only the expected small IONPs (see Fig. 3e). The Dh dropped further to 19 nm, which is in good agreement with the particle dimensions determined by SAXS analysis (DSAXS = 10.3 nm, see Table S3†). As the IONP diameters obtained via TEM are similar, this proves that agglomeration is marginal. HRTEM revealed that these IONPs were single crystalline inverse spinel structure of magnetite (see Fig. 3f).
The magnetisation hysteresis confirmed that the IONPs were superparamagnetic (see Fig. 3g) with coercivities <0.3 kOe at 5 K and <0.04 kOe at 300 K. The saturation mass magnetisations at 300 K of 30 emu per g dialysed and dried IONPs was normalised by the IONP weight fraction of 70% determined via TGA (see Fig. S12†) yielding 58 emu gFe−1 assuming IONPs were magnetite only (see eqn (S3)†). As expected, these values are significantly below the bulk magnetisation (103 and 128 emu gFe−1 for maghemite and magnetite)51 as surface effects cause a strong reduction in the magnetisation of such small IONPs. These surface effects cause different spin-ordering at the surface layer reducing the average magnetic moment.52,53
The reproducibility of this small IONPs flow synthesis was proven by repeating the synthesis with quenching after 5 s feeding CA solution at 2.1 ml min−1 (as used above) and at 1.9 ml min−1 and quenching after 100 s (as used previously). TEM analysis showed DTEM = 5.4 ± 0.8 nm (see Fig. S7 and S10†), DTEM = 5.5 ± 1.0 nm (see Fig. S8 and S10†), and DTEM = 7.0 ± 1.0 nm (see Fig. S9 and S10†) respectively. In addition, a batch study was performed for comparison (see ESI 6†). It was shown that a batch synthesis can also yield small IONPs when using small volumes. The small IONPs obtained in batch, however, were agglomerated and more polydisperse (see Fig. S13 and S14†). This was assigned to higher spatial inhomogeneity of temperature, pH, and reagent concentrations, hence, co-precipitation, quenching and stabilisation occurred at less uniform conditions in batch. Also, scale-up in batch is challenging, as the precisely timed quenching after seconds and required mixing time can hardly be achieved for batch volumes larger than 10 ml.54,55
IONP flow synthesis at different temperatures
Although there is no universal correlation between the size of co-precipitated IONPs and the reaction temperature, the temperature is known to affect the size.26,56,57 The temperature dependence was studied by initiating CP and quenching after 5 s (i.e., synthesis steps 1 and 2) at 30 °C and 90 °C, but keeping the standard reaction temperature of 60 °C for aging (i.e., step 3). When performing step 1 and 2 at 30 °C, the CA solution feed rate of 2.1 ml min−1 caused significant dilution of the formed precipitates. Reducing the CA solution flow rate to 1.7 ml min−1 led to a stable colloid, and the darker colour suggested an increased particle concentration. The collected solutions, however, appeared “reddish” and a significant fraction of particles could not be separated via magnetic decantation after precipitation out of solution. The Dh of 55 nm indicated different particle formation kinetics compared to operation at 60 °C, i.e., magnetite formation is not completed after 5 s (see Fig. 4a).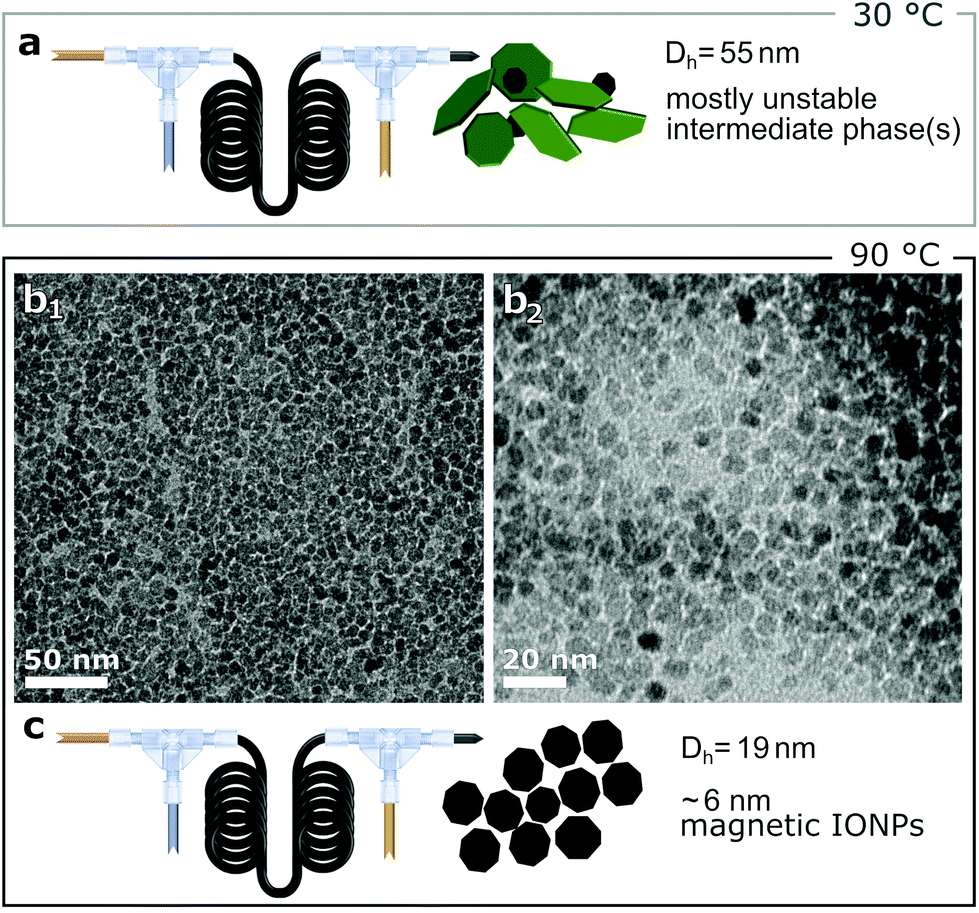 | ||
| Fig. 4 (a) Schematic of flow synthesis with co-precipitation performed at 30 °C. (b1–2) TEM images of IONPs synthesised with co-precipitation performed at 90 °C, DTEM = 6.1 ± 0.9 nm. (c) Schematic of flow synthesis with co-precipitation initiated at 90 °C. Fig. S5† shows the particle size distribution. For both temperatures, quenching was performed at 5 s. | ||
Operation of steps 1 and 2 at 90 °C yielded stable IONPs solutions at the standard CA solution feed rate of 2.1 ml min−1. The TEM images (see Fig. 4b), showed relatively monodisperse IONPs with a DTEM = 6.1 ± 0.9 nm. The obtained conversion was 41% (0.96 mgFe-IONP ml−1) and the Dh was 19 nm.
Although the flow reactor was operated in single phase mode it was robust against plugging and fouling for all experiments performed except the dextran studies. This was attributed to the T-mixers’ geometry (no edges or grooves where encrustation is likely), the shear forces due to relatively high flow rates, as well as the highly negative zeta potential values of the PTFE tubing and PTFE like T mixer (see Table S2†) used in alkaline solutions.58 The pH only dropped to neutral values after CA addition, hence, after IONPs (or intermediates) formed.
Discussion of quenching mechanism
The results of the quenching studies performed at different times and temperatures strongly suggest the formation of poorly crystalline intermediates after initiating CP. These intermediates accompany the formation of the spinel phase (magnetite/maghemite) in the first seconds of the CP synthesis. The presence of such intermediates (e.g., ferrihydrite or green rusts) transforming into the inverse spinel phase is well documented for CP syntheses using a weak base or a strong base which is added slowly.45,50,59,60 Our results indicate that for the CP synthesis used, where a strong base is added rapidly, this transition occurs within ∼3 s at 60 °C and progresses slower at 30 °C. The solubility of intermediate phases at neutral or acidic pH values is higher than that of magnetite.60,61 Therefore, these intermediate phases (also referred to as nanometre-sized primary particles of amorphous iron-rich precursors)62 are more likely to dissolve, or dissolve faster, when feeding the CA solution. The growth of the spinel phase is understood to be a reaction-limited process, where the primary particles supply ferrous and ferric iron.45,59,62,63 Hence, stopping this supply would quench the growth of iron oxide nanoparticles.For CA, its chelating organic anions have been reported to (i) prevent nucleation due to the chelation of iron ions64 and (ii) to inhibit growth due to the adsorption on IONP nuclei, with the latter being dominant.23 For example, a reduction of the IONP size to 6 nm and smaller was observed when adding citric acid to the precursor solution.23,65 Chelating ligands certainly affect the IONP size,66 but using CA solution is unlikely the only reason for the quenching, as it was fed after the initiation of CP, and after the formation of spinel iron oxide. Furthermore, quenching with a HCl instead of a CA solution 5 s and 100 s after initiating CP reduced the IONP size likewise, as indicated by XRD (see Fig. S6†). CA, however, was essential for the IONP stability at neutral pH.44,67 More generally, quenching nanoparticle growth by rapid pH change can not only yield small IONPs via precipitation methods, but also small noble metal nanoparticles (synthesised in water). What these methods have in common is a nucleation step followed by a pH sensitive growth step involving either intermediate phases,68,69 colloidal growth,70,71 or surface mediated growth (or combinations).72–74 Thermal decomposition syntheses of IONPs and other nanomaterials can be quenched by adding a coolant (such as the solvent used) to stop the decomposition reaction or temperature induced colloidal growth.75–78 Although these aqueous and non-aqueous syntheses require minutes to hours for the nanoparticles to reach their final size, their formation can occur within seconds39,79,80 or less.71,81 Other examples are polymeric particles formed via radical polymerization82 facilitating size control by quencher addition. Therefore, the rapid quenching facilitated by flow reactors is a unique tool to synthesise small nanoparticles.
Evaluation of MRI contrast performance
The IONP solutions synthesised at 60 °C with quenching times of 2, 5 and 100 s (i.e., the previous procedure44), and the one synthesised at 90 °C with quenching after 5 s (all quenched via a 2.1 ml min−1 citric acid solution feed) were evaluated for MRI performance (see Fig. 5). IONPs synthesised in the presence of dextran were not considered (despite producing IONPs of DTEM ∼2 nm) due to the bimodal IONP size distribution (indicating different particle formation mechanisms, which are likely to cause scalability issues) and the larger hydrodynamic diameter indicating agglomeration. | ||
| Fig. 5 (a) IONP solutions synthesised with quenching times of 100, 5 and 2 s at 60 °C and 5 s at 90 °C (from left to right) selected for MRI contrast performance evaluation. (b) Relaxation rates R2 (transversal, top) and R1 (longitudinal, bottom) vs. iron concentration in the (consecutively diluted) dialysed samples (CFe) to determine r1 and r2 (i.e., the slope) for IONPs synthesised at co-precipitation temperatures and quenching times as indicated. | ||
Unreacted iron precursor and other reagents were removed from solution by dialysing against DI water using a 12–14 kDa membrane (Medicell) over 4 d, while changing the water frequently. The Fe concentrations (CFe) of the dialysed IONP solutions were 7.7 mM, 7.9 mM, and 6.7 mM (CP at 60 °C, quenching time 100 s, 5 s, and 2 s respectively), and 6.7 mM (precipitated at 90 °C and quenched after 5 s). The relaxation rates (1/T) dependence on the Fe concentration used to determine the relaxivities are shown in Fig. 5b. Table 1 compares the relaxivities of the four studied IONP samples and their sizes.
| Synthesised at: | D TEM/Dh [nm] | r 1 [mM−1 s−1] | r 2 [mM−1 s−1] | r 2/r1 [—] | |
|---|---|---|---|---|---|
| Co-prec. temperature | Quenching time | ||||
| 60 °C | 100 s | 6.9/19 | 12.4 | 57.2 | 4.6 |
| 60 °C | 5 s | 5.4/19 | 10.7 | 36.9 | 3.4 |
| 60 °C | 2 s | 4.6/29 | 6.7 | 20.5 | 3.0 |
| 90 °C | 5 s | 6.1/19 | 11.7 | 46.9 | 4.0 |
The transversal relaxivities (r2) scaled with the IONP size from the lowest of 20.5 mM−1 s−1 to the highest of 57.2 mM−1 s−1 for IONPs quenched 2–100 s after initiating CP. This is expected as r2 depends on the magnetic moment, which is higher for larger particles, as the reduction of magnetisation due to surface effects becomes less prominent with increasing size.
Although the longitudinal relaxivities (r1) also correlated with the IONP size, the highest values of 10.7, 12.4, and 11.7 mM−1 s−1 (for IONPs precipitated at 60 °C and quenched after 5 s and 100 s, and precipitated at 90 °C and quenched after 5 s respectively) are comparable. Longitudinal relaxivities >10 mM−1 s−1 have been previously reported for IONPs produced using thermal decomposition methods.5,13,14,83–85 Ours, however, are among the highest values achieved via a water-based IONP synthesis, hence, without organic solvents.6,8 These high relaxivities are attributed to the large accessible surface of the non-agglomerated, colloidally stable, and small IONPs synthesised, maximising the water-Fe interfacial area. Also, the stabilisation with CA, i.e., a small molecule with a molecular weight <200 g mol−1, is expected to be pivotal. Citric acid is not only biocompatible but also allows the water molecules to approach the superparamagnetic IONPs and was shown in the past to enable high r1 values.13,31,86
Besides a comparison with IONPs developed as T1 contrast agents, it is relevant to compare the r1 and r2 values with superparamagnetic IONPs developed as T2 contrast agents in the literature. Such IONPs usually have a magnetic core size in the range of 10–20 nm, r2 values in the range 80–300 mM s−1, (depending on the design, the shape and the organic coating) and r1 values around 10 mM−1 s−1.83,84 Therefore, compared to IONP T2-agents, the MRI features of the small IONP synthesised in flow have several times lower r2 value, while r1 remains similar, which allows to decrease the r2/r1 ratio, a favoured parameter for T1-MRI.85 Especially the small IONPs synthesised (quenched at 5 s, standard reaction temperature of 60 °C) exhibit a high r1 value (10.7 mM−1 s−1) with a comparatively low r2 value (r2/r1 = 3.4).
These r1 values are also significantly higher than those of Gd complexes used commercially in T1-MRI, e.g., macrocyclic Gd complexes such as Dotarem® and Gadovist®, which have r1 values of 4.2 mM−1 s−1 and 5.3 mM−1 s−1 (at 1.5 T and 37 °C) respectively.87
Conclusions
We have showcased a flow synthesis of nanoparticles benefiting from the efficient heat transfer and rapid mixing of flow reactors, but most importantly, precisely timed reagent addition. Such addition, feasible in flow reactors, enables excellent control during the crucial particle formation stage for nanoparticle syntheses with rapid kinetics (within seconds).We have used this principle to quench the growth of IONPs during a fast co-precipitation synthesis. A multistage flow reactor was used to (i) initiate co-precipitation and (ii) feed an acid solution after the formation of magnetite/maghemite IONPs to stop their growth. Growth quenching was rationalised by the (at least partial) dissolution of intermediate phases before their transition to the inverse spinel structure (magnetite/maghemite); hence, stopping the supply of ferrous and/or ferric ions to form these intermediates. To synthesise small IONPs (≤5 nm) required for T1 MRI contrast agents, particle growth had to be quenched just after the formation of magnetite.
The XRD patterns, TEM studies, hydrodynamic diameters and SAXS curves of IONPs synthesised with quenching times between 0.5 and 100 s show that formation of the inverse spinel structure occurs between 0.5 and 2 s for the synthesis used (NaOH solution added rapidly to a precursor solution of ferric and ferrous chlorides at 60 °C). Quenching the growth significantly later did allow particles to grow larger than 5 nm, whereas premature acid addition yielded undesired oxide phases. Furthermore, temperature affected the reaction kinetics, i.e., lower temperatures delayed the formation of magnetite/maghemite IONPs. When quenching 5 s after initiating CP, the synthesis at 30 °C did not show a high magnetite yield, whereas the synthesis at 60 °C and 90 °C resulted in 5.4 nm and 6.1 nm magnetite particles respectively at precursor conversions of 41–42%.
This flow chemistry protocol facilitated the reproducible production of stable and only marginally agglomerated small IONPs coated with CA at neutral pH values without any toxic reagent. Furthermore, the short synthesis time of the CP method used, and the continuous operation of the flow reactor allows for reproducible production at larger scales (>15 l d−1 with ∼1 gFe-IONP l−1, for the 5 ml min−1 NaOH and precursor solution flow rates used) with a simple lab-scale set-up (no parallelisation, no flow rate increase, etc.). A comparison with batch showed that IONPs produced in flow are more monodisperse, indicating the challenges of batch scale-up.
Our synthesis procedure entails a raw materials cost <£10 per gFe-IONP (calculated based on the yield of ∼1 gFe-IONP l−1 and costs for precursors, CA and NaOH). Despite the slightly higher equipment costs for flow reactors, e.g. for pumps, this difference is insignificant when comparing the total costs of batch and flow nanoparticle production, as shown recently.88
Relaxometric studies revealed the potential of these small IONPs as positive (T1) contrast agents for MRI. The r1 values obtained were larger than 10 mM−1 s−1 (with r2/r1 ≤ 4), which is among the highest values reported for water-based syntheses.
Conflicts of interest
There are no conflicts to declare.Acknowledgements
The authors thank the EPSRC for financial support (EP/M015157/1) through the Manufacturing Advanced Functional Materials (MAFuMa) scheme. NTKT thanks AOARD (FA2386-17-1-4042 award) for funding. LP was supported by the European Union's Horizon 2020 research and innovation programme under the Marie Skłodowska-Curie grant agreement no. 721290. This publication reflects only the author's view, exempting the Community from any liability. Project website: http://cosmic-etn.eu/. This work was carried out in part through the use of the INL Advanced Electron Microscopy, Imaging and Spectroscopy Facility.References
- M. Le Fur and P. Caravan, Metallomics, 2019, 11, 240–254 CrossRef CAS PubMed.
- Q. Feng, Y. Liu, J. Huang, K. Chen, J. Huang and K. Xiao, Sci. Rep., 2018, 8, 2082 CrossRef PubMed.
- G. Cotin, S. Piant, D. Mertz, D. Felder-Flesch and S. Begin-Colin, in Iron Oxide Nanoparticles for Biomedical Applications, Elsevier, Amsterdam, 2018, pp. 43–88 Search PubMed.
- R. Hachani, M. A. Birchall, M. W. Lowdell, G. Kasparis, L. D. Tung, B. B. Manshian, S. J. Soenen, W. Gsell, U. Himmelreich, C. A. Gharagouzloo, S. Sridhar and N. T. K. Thanh, Sci. Rep., 2017, 7, 7850 CrossRef PubMed.
- H. Wei, O. T. Bruns, M. G. Kaul, E. C. Hansen, M. Barch, A. Wiśniowska, O. Chen, Y. Chen, N. Li, S. Okada, J. M. Cordero, M. Heine, C. T. Farrar, D. M. Montana, G. Adam, H. Ittrich, A. Jasanoff, P. Nielsen and M. G. Bawendi, Proc. Natl. Acad. Sci. U.S.A., 2017, 114, 2325–2330 CrossRef CAS PubMed.
- Y. Bao, J. A. Sherwood and Z. Sun, J. Mater. Chem. C, 2018, 6, 1280–1290 RSC.
- C. Tao, Q. Zheng, L. An, M. He, J. Lin, Q. Tian and S. Yang, Nanomaterials, 2019, 9, 170 CrossRef CAS PubMed.
- B. Chen, Z. Guo, C. Guo, Y. Mao, Z. Qin, D. Ye, Z. Fengchao, Z. Lou, Z. Zhang, M. Li, Y. Liu, M. Ji, J. Sun and N. Gu, Nanoscale, 2020, 12, 5521–5532 RSC.
- J. K. Oh and M.-A. Fortin, in Clinical Applications of Magnetic Nanoparticles, ed. N. T. K. Thanh, CRC Press, Taylor & Francis, Boca Raton, London, New York, 2018, pp. 139–160 Search PubMed.
- Z. Zhou, L. Yang, J. Gao and X. Chen, Adv. Mater., 2019, 31, 1804567 CrossRef PubMed.
- J. Wan, R. Yuan, C. Zhang, N. Wu, F. Yan, S. Yu and K. Chen, J. Phys. Chem. C, 2016, 120, 23799–23806 CrossRef CAS.
- M. Mahmoudi and S. Laurent, Iron Oxide Nanoparticles for Biomedical Applications: Synthesis, Functionalization and Application, Elsevier, Amsterdam, 1st edn, 2017 Search PubMed.
- E. Taboada, E. Rodríguez, A. Roig, J. Oró, A. Roch and R. N. Muller, Langmuir, 2007, 23, 4583–4588 CrossRef CAS PubMed.
- F. Hu, Q. Jia, Y. Li and M. Gao, Nanotechnology, 2011, 22, 245604 CrossRef PubMed.
- S. Sun and H. Zeng, J. Am. Chem. Soc., 2002, 124, 8204–8205 CrossRef CAS PubMed.
- U. I. Tromsdorf, O. T. Bruns, S. C. Salmen, U. Beisiegel and H. Weller, Nano Lett., 2009, 9, 4434–4440 CrossRef CAS PubMed.
- M. Z. Iqbal, X. Ma, T. Chen, L. Zhang, W. Ren, L. Xiang and A. Wu, J. Mater. Chem. B, 2015, 3, 5172–5181 RSC.
- Q. Dong, Z. Meng, C. L. Ho, H. Guo, W. Yang, I. Manners, L. Xu and W. Y. Wong, Chem. Soc. Rev., 2018, 47, 4934–4953 RSC.
- S. Xiao, X. Yu, L. Zhang, Y. Zhang, W. Fan, T. Sun, C. Zhou, Y. Liu, Y. Liu, M. Gong and D. Zhang, Int. J. Nanomed., 2019, 14, 8499–8507 CrossRef CAS PubMed.
- F. Hu, K. W. MacRenaris, E. A. Waters, T. Liang, E. A. Schultz-Sikma, A. L. Eckermann and T. J. Meade, J. Phys. Chem. C, 2009, 113, 20855–20860 CrossRef CAS PubMed.
- R. Massart, IEEE Trans. Magn., 1981, 17, 1247–1248 CrossRef.
- A. A. Olowe and J. M. R. Génin, Corros. Sci., 1991, 32, 965–984 CrossRef CAS.
- A. Bee, R. Massart and S. Neveu, J. Magn. Magn. Mater., 1995, 149, 6–9 CrossRef CAS.
- K. Kumar, A. M. Nightingale, S. H. Krishnadasan, N. Kamaly, M. Wylenzinska-Arridge, K. Zeissler, W. R. Branford, E. Ware, A. J. deMello and J. C. deMello, J. Mater. Chem., 2012, 22, 4704 RSC.
- Z. Li, P. W. Yi, Q. Sun, H. Lei, H. Li Zhao, Z. H. Zhu, S. C. Smith, M. B. Lan and G. Q. M. Lu, Adv. Funct. Mater., 2012, 22, 2387–2393 CrossRef CAS.
- B. Chen, Z. Guo, C. Guo, Y. Mao, Z. Qin, D. Ye, F. Zang, Z. Lou, Z. Zhang, M. Li, Y. Liu, M. Ji, J. Sun and N. Gu, Nanoscale, 2020, 12, 5521–5532 RSC.
- B. Chen, J. Sun, F. Fan, X. Zhang, Z. Qin, P. Wang, Y. Li, X. Zhang, F. Liu, Y. Liu, M. Ji and N. Gu, Nanoscale, 2018, 10, 7369–7376 RSC.
- J.-M. Lim, A. Swami, L. M. Gilson, S. Chopra, S. Choi, J. Wu, R. Langer, R. Karnik and O. C. Farokhzad, ACS Nano, 2014, 8, 6056–6065 CrossRef CAS PubMed.
- M. Fang, V. Ström, R. T. Olsson, L. Belova and K. V. Rao, Nanotechnology, 2012, 23, 145601 CrossRef PubMed.
- F. Haseidl, B. Müller and O. Hinrichsen, Chem. Eng. Technol., 2016, 39, 2051–2058 CrossRef CAS.
- J. Pellico, J. Ruiz-Cabello, I. Fernández-Barahona, L. Gutiérrez, A. V. Lechuga-Vieco, J. A. Enríquez, M. P. Morales and F. Herranz, Langmuir, 2017, 33, 10239–10247 CrossRef CAS PubMed.
- I. Fernández-Barahona, L. Gutiérrez, S. Veintemillas-Verdaguer, J. Pellico, M. D. P. Morales, M. Catala, M. A. Del Pozo, J. Ruiz-Cabello and F. Herranz, ACS Omega, 2019, 4, 2719–2727 CrossRef PubMed.
- J. E. M. Allan, Technology Transfer in Nanotechnology, Publications Office of the European Union, Luxembourg, 2019 Search PubMed.
- R. Bawa, G. F. Audette and B. E. Reese, Handbook of Clinical Nanomedicine: Law, Business, Regulation, Safety, and Risk, Pan Stanford Publishing Pte. Ltd., Boca Raton, 2016 Search PubMed.
- X. Z. Lin, A. D. Terepka and H. Yang, Nano Lett., 2004, 4, 2227–2232 CrossRef CAS.
- J. Wagner and J. M. Köhler, Nano Lett., 2005, 5, 685–691 CrossRef CAS PubMed.
- O. Długosz and M. Banach, React. Chem. Eng., 2020, 5, 1619–1641 RSC.
- B. Pinho and L. Torrente-Murciano, React. Chem. Eng., 2020, 5, 342–355 RSC.
- L. Uson, M. Arruebo, V. Sebastian and J. Santamaria, Chem. Eng. J., 2018, 340, 66–72 CrossRef CAS.
- M. James, R. A. Revia, Z. Stephen and M. Zhang, Nanomaterials, 2020, 10, 1–19 CrossRef.
- L. Panariello, G. Wu, M. O. Besenhard, K. Loizou, L. Storozhuk, N. T. K. Thanh and A. Gavriilidis, Materials, 2020, 13, 1019 CrossRef CAS PubMed.
- J. Mahin and L. Torrente-Murciano, Chem. Eng. J., 2020, 396, 125299 CrossRef CAS.
- A. Abou-Hassan, O. Sandre, V. Cabuil and P. Tabeling, Chem. Commun., 2008, 1783 RSC.
- M. O. Besenhard, A. P. LaGrow, A. Hodzic, M. Kriechbaum, L. Panariello, G. Bais, K. Loizou, S. Damilos, M. Margarida Cruz, N. T. K. Thanh and A. Gavriilidis, Chem. Eng. J., 2020, 399, 125740 CrossRef CAS.
- A. P. LaGrow, M. O. Besenhard, A. Hodzic, A. Sergides, L. K. Bogart, A. Gavriilidis and N. T. K. Thanh, Nanoscale, 2019, 11, 6620–6628 RSC.
- S. Boutry, D. Forge, C. Burtea, I. Mahieu, O. Murariu, S. Laurent, L. Vander Elst and R. N. Muller, Contrast Media Mol. Imaging, 2009, 4, 299–304 CrossRef CAS PubMed.
- F. Perton, M. Tasso, G. A. Muñoz Medina, M. Ménard, C. Blanco-Andujar, E. Portiansky, M. B. F. van Raap, D. Bégin, F. Meyer, S. Begin-Colin and D. Mertz, Appl. Mater. Today, 2019, 16, 301–314 CrossRef.
- K. M. Lee, S.-G. Kim, W.-S. Kim and S. S. Kim, Korean J. Chem. Eng., 2002, 19, 480–485 CrossRef CAS.
- E. A. Osborne, T. M. Atkins, D. A. Gilbert, S. M. Kauzlarich, K. Liu and A. Y. Louie, Nanotechnology, 2012, 23, 215602 CrossRef PubMed.
- T. Ahn, J. H. Kim, H.-M. Yang, J. W. Lee and J.-D. Kim, J. Phys. Chem. C, 2012, 116, 6069–6076 CrossRef CAS.
- D. J. Dunlop and Ö. Özdemir, Rock Magnetism, Cambridge University Press, Cambridge, 1997 Search PubMed.
- A. Demortière, P. Panissod, B. P. Pichon, G. Pourroy, D. Guillon, B. Donnio and S. Bégin-Colin, Nanoscale, 2011, 3, 225–232 RSC.
- D. A. Garanin and H. Kachkachi, Phys. Rev. Lett., 2003, 90, 4 CrossRef PubMed.
- R. A. Ghotli, A. A. A. Raman, S. Ibrahim and S. Baroutian, Chem. Eng. Commun., 2013, 200, 595–627 CrossRef.
- M. Kordas, G. Story, M. Konopacki and R. Rakoczy, Ind. Eng. Chem. Res., 2013, 52, 13818–13828 CrossRef CAS.
- H. C. Roth, S. P. Schwaminger, M. Schindler, F. E. Wagner and S. Berensmeier, J. Magn. Magn. Mater., 2015, 377, 81–89 CrossRef CAS.
- C. Blanco-Andujar, D. Ortega, Q. A. Pankhurst and N. T. K. Thanh, J. Mater. Chem., 2012, 22, 12498 RSC.
- H. Huang, H. Du Toit, M. O. Besenhard, S. Ben-Jaber, P. Dobson, I. Parkin and A. Gavriilidis, Chem. Eng. Sci., 2018, 198, 422–430 CrossRef.
- J. Baumgartner, A. Dey, P. H. H. Bomans, C. Le Coadou, P. Fratzl, N. A. J. M. Sommerdijk and D. Faivre, Nat. Mater., 2013, 12, 310–314 CrossRef CAS PubMed.
- J.-P. Jolivet, C. Chanéac and E. Tronc, Chem. Commun., 2004, 54, 477–483 RSC.
- U. Schwertmann and R. M. Cornell, Iron Oxides in the Laboratory: Preparation and Characterization, Wiley-VCH, Weinheim, 2000 Search PubMed.
- M. Widdrat, E. Schneck, V. Reichel, J. Baumgartner, L. Bertinetti, W. Habraken, K. Bente, P. Fratzl and D. Faivre, J. Phys. Chem. Lett., 2017, 8, 1132–1136 CrossRef CAS PubMed.
- V. Reichel and D. Faivre, in New Perspectives on Mineral Nucleation and Growth, Springer International Publishing, Basel, 2017, pp. 275–291 Search PubMed.
- T. Ishikawa, S. Kataoka and K. Kandori, J. Mater. Sci., 1993, 28, 2693–2698 CrossRef CAS.
- L. Li, K. Y. Mak, C. W. Leung, K. Y. Chan, W. K. Chan, W. Zhong and P. W. T. Pong, Microelectron. Eng., 2013, 110, 329–334 CrossRef CAS.
- S. Laurent, D. Forge, M. Port, A. Roch, C. Robic, L. Vander Elst and R. N. Muller, Chem. Rev., 2008, 108, 2064–2110 CrossRef CAS PubMed.
- M. E. De Sousa, M. B. Fernández Van Raap, P. C. Rivas, P. Mendoza Zélis, P. Girardin, G. A. Pasquevich, J. L. Alessandrini, D. Muraca and F. H. Sánchez, J. Phys. Chem. C, 2013, 117, 5436–5445 CrossRef CAS.
- F. Vereda, J. de Vicente and R. Hidalgo-Alvarez, J. Colloid Interface Sci., 2013, 392, 50–56 CrossRef CAS PubMed.
- A. E. Rawlings, J. P. Bramble, A. M. Hounslow, M. P. Williamson, A. E. Monnington, D. J. Cooke and S. S. Staniland, Chemistry, 2016, 22, 7885–7894 CrossRef CAS PubMed.
- R. Hufschmid, E. Teeman, B. L. Mehdi, K. M. Krishnan and N. D. Browning, Nanoscale, 2019, 11, 13098–13107 RSC.
- J. Polte, X. Tuaev, M. Wuithschick, A. Fischer, A. F. Thuenemann, K. Rademann, R. Kraehnert and F. Emmerling, ACS Nano, 2012, 6, 5791–5802 CrossRef CAS PubMed.
- M. Wuithschick, A. Birnbaum, S. Witte, M. Sztucki, U. Vainio, N. Pinna, K. Rademann, F. Emmerling, R. Kraehnert and J. Polte, ACS Nano, 2015, 9, 7052–7071 CrossRef CAS PubMed.
- J. Polte, CrystEngComm, 2015, 17, 6809–6830 RSC.
- L. Panariello, A. N. P. Radhakrishnan, I. Papakonstantinou, I. P. Parkin and A. Gavriilidis, J. Phys. Chem. C, 2020, 124, 27662–27672 CrossRef CAS.
- A. Lassenberger, T. A. Grünewald, P. D. J. van Oostrum, H. Rennhofer, H. Amenitsch, R. Zirbs, H. C. Lichtenegger and E. Reimhult, Chem. Mater., 2017, 29, 4511–4522 CrossRef CAS PubMed.
- H. Chang, B. H. Kim, H. Y. Jeong, J. H. Moon, M. Park, K. Shin, S. I. Chae, J. Lee, T. Kang, B. K. Choi, J. Yang, M. S. Bootharaju, H. Song, S. H. An, K. M. Park, J. Y. Oh, H. Lee, M. S. Kim, J. Park and T. Hyeon, J. Am. Chem. Soc., 2019, 141, 7037–7045 CrossRef CAS PubMed.
- Q. Dong, G. Li, H. Wang, P. W.-T. Pong, C. W. Leung, I. Manners, C. L. Ho, H. Li and W. Y. Wong, J. Mater. Chem. C, 2015, 3, 734–741 RSC.
- H. Gavilán, E. H. Sánchez, M. E. F. Brollo, L. Asín, K. K. Moerner, C. Frandsen, F. J. Lázaro, C. J. Serna, S. Veintemillas-Verdaguer, M. P. Morales and L. Gutiérrez, ACS Omega, 2017, 2, 7172–7184 CrossRef PubMed.
- P. Sharma, N. Holliger, P. H. Pfromm, B. Liu and V. Chikan, ACS Omega, 2020, 5, 19853–19860 CrossRef CAS PubMed.
- S. G. Kwon and T. Hyeon, Acc. Chem. Res., 2008, 41, 1696–1709 CrossRef CAS PubMed.
- J. Polte, R. Erler, A. F. Thünemann, S. Sokolov, T. T. Ahner, K. Rademann, F. Emmerling and R. Kraehnert, ACS Nano, 2010, 4, 1076–1082 CrossRef CAS PubMed.
- H. J. M. Wolff, M. Kather, H. Breisig, W. Richtering, A. Pich and M. Wessling, ACS Appl. Mater. Interfaces, 2018, 10, 24799–24806 CrossRef CAS PubMed.
- B. Basly, G. Popa, S. Fleutot, B. P. Pichon, A. Garofalo, C. Ghobril, C. Billotey, A. Berniard, P. Bonazza, H. Martinez, D. Felder-Flesch and S. Begin-Colin, J. Chem. Soc., Dalton Trans., 2013, 42, 2146–2157 RSC.
- X. Y. Wang, D. Mertz, C. Blanco-Andujar, A. Bora, M. Ménard, F. Meyer, C. Giraudeau and S. Bégin-Colin, RSC Adv., 2016, 6, 93784–93793 RSC.
- C. Blanco-Andujar, A. Walter, G. Cotin, C. Bordeianu, D. Mertz, D. Felder-Flesch and S. Begin-Colin, Nanomedicine, 2016, 11, 1889–1910 CrossRef CAS PubMed.
- L. Zeng, W. Ren, J. Zheng, P. Cui and A. Wu, Phys. Chem. Chem. Phys., 2012, 14, 2631–2636 RSC.
- P. Hermann, J. Kotek, V. Kubíček and I. Lukeš, Dalton Trans., 2008, 3027–3047 RSC.
- M. Besenhard, A. LaGrow, S. Famiani, M. Pucciarelli, P. Lettieri, N. T. K. Thanh and A. Gavriilidis, React. Chem. Eng., 2020, 5, 1474 RSC.
Footnote |
| † Electronic supplementary information (ESI) available. See DOI: 10.1039/d1nr00877c |
| This journal is © The Royal Society of Chemistry 2021 |