
 Open Access Article
 This Open Access Article is licensed under a Creative Commons Attribution-Non Commercial 3.0 Unported Licence
Mixing iron oxide nanoparticles with different shape and size for tunable magneto-heating performance†
Jesus G.
Ovejero
 a,
Federico
Spizzo
b,
M. Puerto
Morales
*a and
Lucia
Del Bianco
*b
a,
Federico
Spizzo
b,
M. Puerto
Morales
*a and
Lucia
Del Bianco
*b
aDept. Energía, Medio Ambiente y Salud, Instituto de Ciencia de Materiales de Madrid, CSIC, Cantoblanco, E-28049 Madrid, Spain. E-mail: puerto@icmm.csic.es
bDipartimento di Fisica e Scienze della Terra, Università di Ferrara, I-44122 Ferrara, Italy. E-mail: lucia.delbianco@unife.it
First published on 11th March 2021
Abstract
Tuning the magnetic properties of nanoparticles is a strategic goal to use them in the most effective way to perform specific functions in the nanomedicine field. We report a systematic study carried out on a set of samples obtained by mixing together iron oxide nanoparticles with different shape: elongated with aspect ratio ∼5.2 and mean volume of the order of 103 nm3 (excluding the silica coating) and spherical with mean volume one order of magnitude larger. These structural features of the nanoparticles together with their aggregation state determine the magnetic anisotropy and the magnetic relaxation processes. In particular, the spherical nanoparticles turn out to be more stable against superparamagnetic relaxation. Mixing the nanoparticles in different proportions allows to modulate the magnetic response of the samples. The two populations of nanoparticles magnetically influence each other through a mean field mechanism, which depends crucially on temperature and rules the hysteretic magnetic properties and their thermal evolution. This magnetic phenomenology has a direct impact on the ability of the mixed samples to generate heat under an alternating magnetic field, a key function in view of nanomedicine applications. Under proper testing conditions, the heating efficiency of the mixed samples is larger compared to that obtained as the sum of those of the parent nanoparticles. This occurs thanks to the mean field produced by the magnetically blocked spherical nanoparticles that stabilizes the thermally fluctuating moments of the elongated ones, which therefore contribute more effectively to the heat production.
1. Introduction
The latest frontier in the science of magnetic nanoparticles (NPs) is the possibility of creating versatile systems, namely with tunable structural and magnetic properties to meet specific technological requirements. This ambitious goal is of fundamental importance in the field of nanomedicine, which is one of the main sectors of application of magnetic NPs, where they can be employed both as diagnostic and therapeutic tools.1,2 In particular, magnetic NPs can act as heating agents under an alternating magnetic field.3 This function can be exploited in the treatment of cancer, since the heat produced by NPs delivered at the tumor site can raise the local temperature above the systemic one (magnetic hyperthermia), thus inducing the death of cancer cells4–9 or inhibiting their capacity to self-renew.10 Moreover, magnetic hyperthermia can sensitize cancer cells to the effects of radiotherapy11,12 and pre-clinical studies demonstrated its efficiency as an activator of the immune system to treat metastatic tumors.13 In the case of NPs dispersed into a biocompatible matrix together with drug molecules (bound to the NPs themselves or loaded separately), magnetic heating can be used to thermally promote the detachment of the molecules and the degradation of the matrix, for a controlled and targeted drug release.14–17 However, a different heating efficiency is required in these applications and hence the magnetic parameters of the NPs must be adjusted for each of them. It is worth remarking that NPs for biomedical applications must be made of a biocompatible material. This restricts the number of degrees of freedom in the formulation of magnetic NPs. Iron oxide in the form of NPs is one of the few inorganic nanosystems approved by the U.S. Food and Drug Administration (FDA) for use in human patients.18The most common pathways to control the saturation magnetization and the magnetic anisotropy of iron oxide NPs are represented by the synthesis of core–shell structures – in which the inner core and the outer layer are made of two different magnetic phases, coupled by exchange interaction19–23 – or the doping of magnetite with Mn and/or Zn.24–26
An interesting strategy to modify the magnetic response of iron oxide NPs without affecting their chemical composition is to vary their geometry.27 Indeed, shape is a key feature because it directly affects the magnetic anisotropy of each individual NP, a crucial parameter in the description of any magnetic phenomenon.28 Several studies have demonstrated the impact of the shape of NPs on the magnetic heating mechanism.29–32 Magnetite nanocubes are probably the most effective magnetic nanoheaters under high field intensitites.33 Elongated NPs are another less explored, but highly interesting system in which a single easy magnetization axis is well defined.27,34 The synthesis of elongated magnetite NPs smaller than 100 nm is still a challenge. In general, synthetic strategies are based on aqueous media using other non-magnetic iron oxides or oxohydroxides as templates.35 The preparation of spherical NPs is more accessible since several methods have been developed in the last decades.36 Among the most used are the alkaline co-precipitation of ferrous and ferric salts in aqueous media,37 the thermal decomposition of organometallic compounds38 and the polyol-mediated process.39 By properly varying the synthetic parameters, virtually all methods allow a certain control over the mean size of the NP assembly and possibly on the size distribution,40–43 fundamental characteristics that determine the anisotropy energy barriers of the NPs and hence their magnetothermal behavior.44 On the other hand, the degree of crystallinity, the chemical properties of the surface and the aggregation level of the NPs – which have a direct impact respectively on the magnetization and on the magnetic interacting state and colloidal stability – may strongly depend on the synthetic route.
An alternative approach to regulate the magnetic behavior of a NP assembly is to exploit the interparticle dipolar interactions. Magnetic NPs for biomedical applications are very often coated with biocompatible surfactants, which, while preventing direct contact between them, cannot completely hinder the onset of dipolar interactions. In short, the presence of dipolar interactions cannot be practically avoided and indeed becomes an important issue in bioapplications in which the NPs are internalized into cell cytoplasms. In fact, the cellular mechanisms of internalization generally confine the NPs in small vesicles reducing the distance between them and thus enhancing the dipolar interactions.45 Dipolar interactions may result in an increase of the anisotropy energy barriers of the NPs and hence in an improved stability of their moments against thermal fluctuations and superparamagnetic relaxation.44,46,47 If the dipolar interactions are strong enough, the anisotropy energy barriers can become interdependent and collective magnetic behaviors may even appear (super-spin-glass behavior, super-ferromagnetism).48–50 Several studies have demonstrated that this phenomenology may have a positive impact on the NP magnetic heating efficiency.26,51–55 However, the issue is quite controversial since dipolar interactions may also cause unwanted effects. For instance, strong dipolar interactions may reduce the colloidal stability and lead to sedimentation effects. It has been reported that the formation of large NP agglomerates may reduce the heating efficiency due to demagnetizing effects56 or to a slowing down of the Brownian relaxation.45,57 If the medium is a solid polymeric matrix or a hydrogel, a high concentration of NPs can affect the mechanical and degradation properties.58,59
The strategy we have conceived to modulate the magnetic properties of a NP system consists of combining NPs with different intrinsic magnetic anisotropy and exploiting the magnetic interaction between them. This approach relies on the growing know-how in synthetic methods, enabling the production of NPs with an amazing variety of geometrical shapes.60–62 In fact, we have studied samples obtained by mixing, in different proportions, NPs made of the same magnetic material, i.e. iron oxide, but having elongated and spherical shape and different mean volume, structural features that determine the magnetic anisotropy and the magnetic relaxing behavior. Changing the relative fractions of the two types of NPs emerges as an easy and effective way to tailor the hysteretic properties of the whole system and their thermal evolution. We will show that the magnetic properties of the mixed samples do not correspond to the mere superposition of those of the parent NPs, but are affected by their mutual influence, which we will describe through a mean field model, in consideration of their particular aggregation state. We will demonstrate that the interplay between the differently shaped NPs produces beneficial effects on the heating efficiency of the mixed samples, confirming the potential of this approach to tune and enhance this specific functionality.
2. Experimental section
2.1 Synthesis of the samples
Two types of magnetic iron oxide NPs are synthesized differing in their shape, which is spherical in one case and elongated in the other. The spherical NPs (labelled as SP) are prepared by a polyol method as described elsewhere.43 In brief, 2.62 mmol ferric chloride (FeCl3·6H2O) are dissolved in 109 mL of ethylene glycol using an ultrasound bath. Then, 140 mmol polyvinylpyrrolidone (PVP40) are added to the solution drop by drop under vigorous stirring and mild heating. Then, 36.5 mmol sodium acetate trihydrate (NaAc·3H2O) are added to the solution. The final solution is transferred to a Teflon-lined autoclave (100 mL) and heated at 200 °C for 16 h inside an oven. The product obtained is washed by triple magnetic precipitation with ethanol, air dried and transferred into water. The SP NPs prepared by polyol synthesis usually preserve a protective thin layer of the polyol employed that stabilizes the magnetic colloids. In this case, the polyol is ethylene glycol and its amount is ∼2 wt%, as determined by thermogravimetric analysis.The elongated NPs (labelled as EL) are synthesized using a three-step process. First, elongated goethite NPs are prepared as a precursor for a later reduction to magnetite (Scheme 1).27 For the synthesis of goethite (α-FeOOH), 19 mmol Fe(II) sulfate (FeSO4·7H2O) are dissolved in 125 mL of DI water previously bubbled with N2, and mixed with 125 mL of 0.225 M sodium carbonate solution.63 The mixture is oxidized with a constant air flow at 2 L min−1 keeping the temperature at 44 °C with a thermal bath for 180 min. The final suspension of NPs is washed 5 times with distilled water by centrifugation and collected by filtration. Goethite elongated NPs are transformed to hematite (α-Fe2O3) by dehydration in an oven at 300 °C for 3 hours. In order to avoid the sintering of hematite NPs during the final phase transformation to magnetite, they are coated with a protective silica shell grown by the Stöber method (Fig. S1†).64 For this purpose, 160 mg of hematite NPs are dispersed in 480 mL of a mixture of 2-isopropanol/H2O with a 2![[thin space (1/6-em)]](https://www.rsc.org/images/entities/char_2009.gif) :1 v/v ratio with strong ultrasound agitations and 32 mL of NH4OH 28% v/v are added to the mixture in the ultrasound bath before the drop by drop addition of 0.32 mL of tetraethyl orthosilicate (TEOS). The solution is vigorously shaken overnight to complete the silica coating. The product is washed by centrifugation (7500 rpm for 45 min) with ethanol and the sample dried by vacuum filtration. In the last step, the powder is dehydrated in a vacuum line for 20 hours and then reduced to magnetite in 1 atm H2 atmosphere at 360 °C for 4 hours. The SP and EL NPs are dispersed in deionized water at a concentration of 4.6 mg mL−1. A certain amount of NPs from each of the two batches is dried in order to obtain powdered samples to be used for the evaluation of magnetization. Then, we prepared a set of samples by mixing together the solutions of EL and SP in different proportions and by subjecting the resulting mixture to vigorous stirring and alternating ultrasonic treatments for about 15 minutes. The samples are labelled as Mn, where n is a number that increases from 1 to 6 as the fraction of EL increases (hence, numbers 1 and 6 are assigned to the samples with the lowest and highest content of EL, respectively).
:1 v/v ratio with strong ultrasound agitations and 32 mL of NH4OH 28% v/v are added to the mixture in the ultrasound bath before the drop by drop addition of 0.32 mL of tetraethyl orthosilicate (TEOS). The solution is vigorously shaken overnight to complete the silica coating. The product is washed by centrifugation (7500 rpm for 45 min) with ethanol and the sample dried by vacuum filtration. In the last step, the powder is dehydrated in a vacuum line for 20 hours and then reduced to magnetite in 1 atm H2 atmosphere at 360 °C for 4 hours. The SP and EL NPs are dispersed in deionized water at a concentration of 4.6 mg mL−1. A certain amount of NPs from each of the two batches is dried in order to obtain powdered samples to be used for the evaluation of magnetization. Then, we prepared a set of samples by mixing together the solutions of EL and SP in different proportions and by subjecting the resulting mixture to vigorous stirring and alternating ultrasonic treatments for about 15 minutes. The samples are labelled as Mn, where n is a number that increases from 1 to 6 as the fraction of EL increases (hence, numbers 1 and 6 are assigned to the samples with the lowest and highest content of EL, respectively).
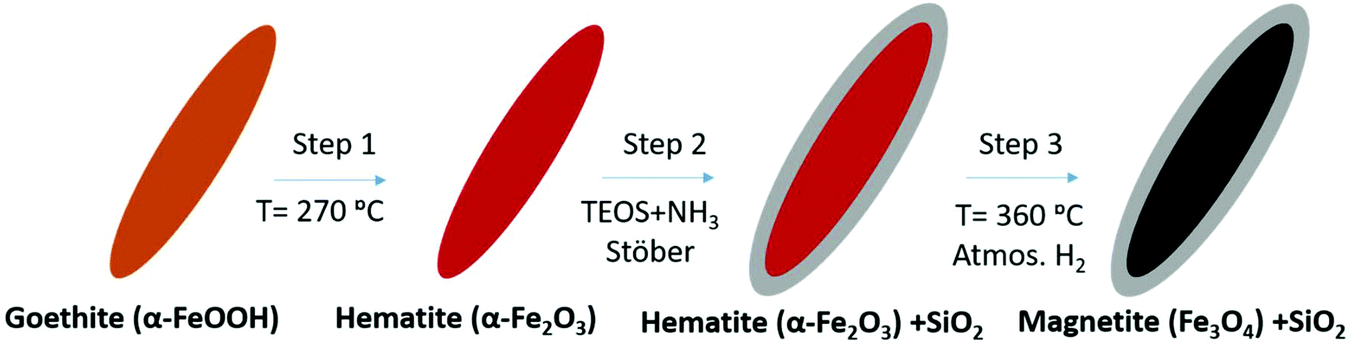 | ||
| Scheme 1 Phase transformation of goethite elongated NPs to silica coated magnetite NPs. | ||
The mixed samples have the same concentration as the parent solutions and therefore their composition can be expressed in terms of weight fractions of EL and SP, as reported in Table 1.
| Sample | Composition (wt%) ±1 | Total Fe amount (wt%) ±2 | D H (nm) | PDI | |
|---|---|---|---|---|---|
| EL [Fe3O4; SiO2] | SP [Fe3O4; (CH2OH)2] | ||||
| SP | 0 | 100 [98; 2] | 70 | 127 | 0.21 |
| M1 | 25 [10; 15] | 75 [74; 1] | 60 | 196 | 0.22 |
| M2 | 50 [20; 30] | 50 [49; 1] | 49 | 196 | 0.18 |
| M3 | 63 [25; 38] | 37 [36; 1] | 44 | 208 | 0.18 |
| M4 | 75 [29; 46] | 25 [25; 0] | 39 | 216 | 0.16 |
| M5 | 88 [34; 54] | 12 [12; 0] | 33 | 187 | 0.19 |
| M6 | 94 [37; 57] | 6 [6; 0] | 31 | 187 | 0.20 |
| EL | 100 [39; 61] | 0 | 28 | 143 | 0.13 |
2.2 Characterization techniques
Transmission electron microscopy (TEM) observations are carried out on the SP and EL NPs using a JEOL JEM 2100. The NPs are prepared as diluted colloids and dried over Cu TEM grids at room temperature. The size distributions of the NPs are obtained by measuring more than 150 NPs from TEM pictures with the software ImageJ and adjusting the data to a lognormal distribution.X-ray diffraction (XRD) spectra for the SP and EL NPs are collected over samples in the powder form using a Bruker D8 Advance A25 with Cu Kα1 radiation (λ = 1.5406 Å) and a detector PSD-XE (DAVINCI). The XRD patterns are obtained from 2θ = 20°–70° in steps of 0.03° and time steps of 2 s.
The hydrodynamic size and polydispersity of the NPs are determined by dynamic light scattering (DLS) on highly diluted aqueous colloids, using a Zetasizer Nano S, from Malvern Instruments (UK). The measurements are repeated diluting the colloid in order to maximize the count rate.
The magnetic properties of the produced samples are studied using a superconducting quantum interference device (SQUID) magnetometer, operating in the 5–300 K temperature range (maximum applied field 50 kOe). For this analysis, 100 mL of each prepared solution is placed in a small cylindrical container. A fixed amount of cotton is inserted in the small container so that it absorbs all the fluid and it can be assumed that the NPs are immobilized into the cotton swab in a configuration close to the one they assume in the aqueous solution. After being allowed to dry in air for at least 24 hours, the cotton swab is removed from the container and put in a proper sample holder for SQUID. Samples of EL and SP in the form of powder are also measured: the powder is inserted directly into the sample holder and slightly pressed in order to avoid any movement during the measurement. Hence, the pressed powder constitutes a large agglomerate of NPs in very intimate contact.
The magnetic heating measurements are carried out using a FiveCELES AC magnetic field inductor equipped with water cooled 50 mm diameter coil of 6 turns. The temperature was registered with an optic fiber thermal probe (OSENSA).
3. Results
3.1 Structural characterization
Fig. 1 shows typical TEM images of the prepared NPs. Both SP and EL NPs appear arranged in the form of aggregates on the TEM grid (frames a and b). A closer inspection confirms the rounded geometry of the SP NPs, that we schematically assume as spherical (frame d), and the markedly elongated shape of the EL ones (frame e). In the EL NPs, we can distinguish a darker area at the center, which corresponds to the iron oxide core, surrounded by a light-grey layer, which corresponds to the silica coating. For both SP and EL NPs, TEM images show an internal porosity of the magnetic cores, which is in agreement with previous studies on similar samples.34,43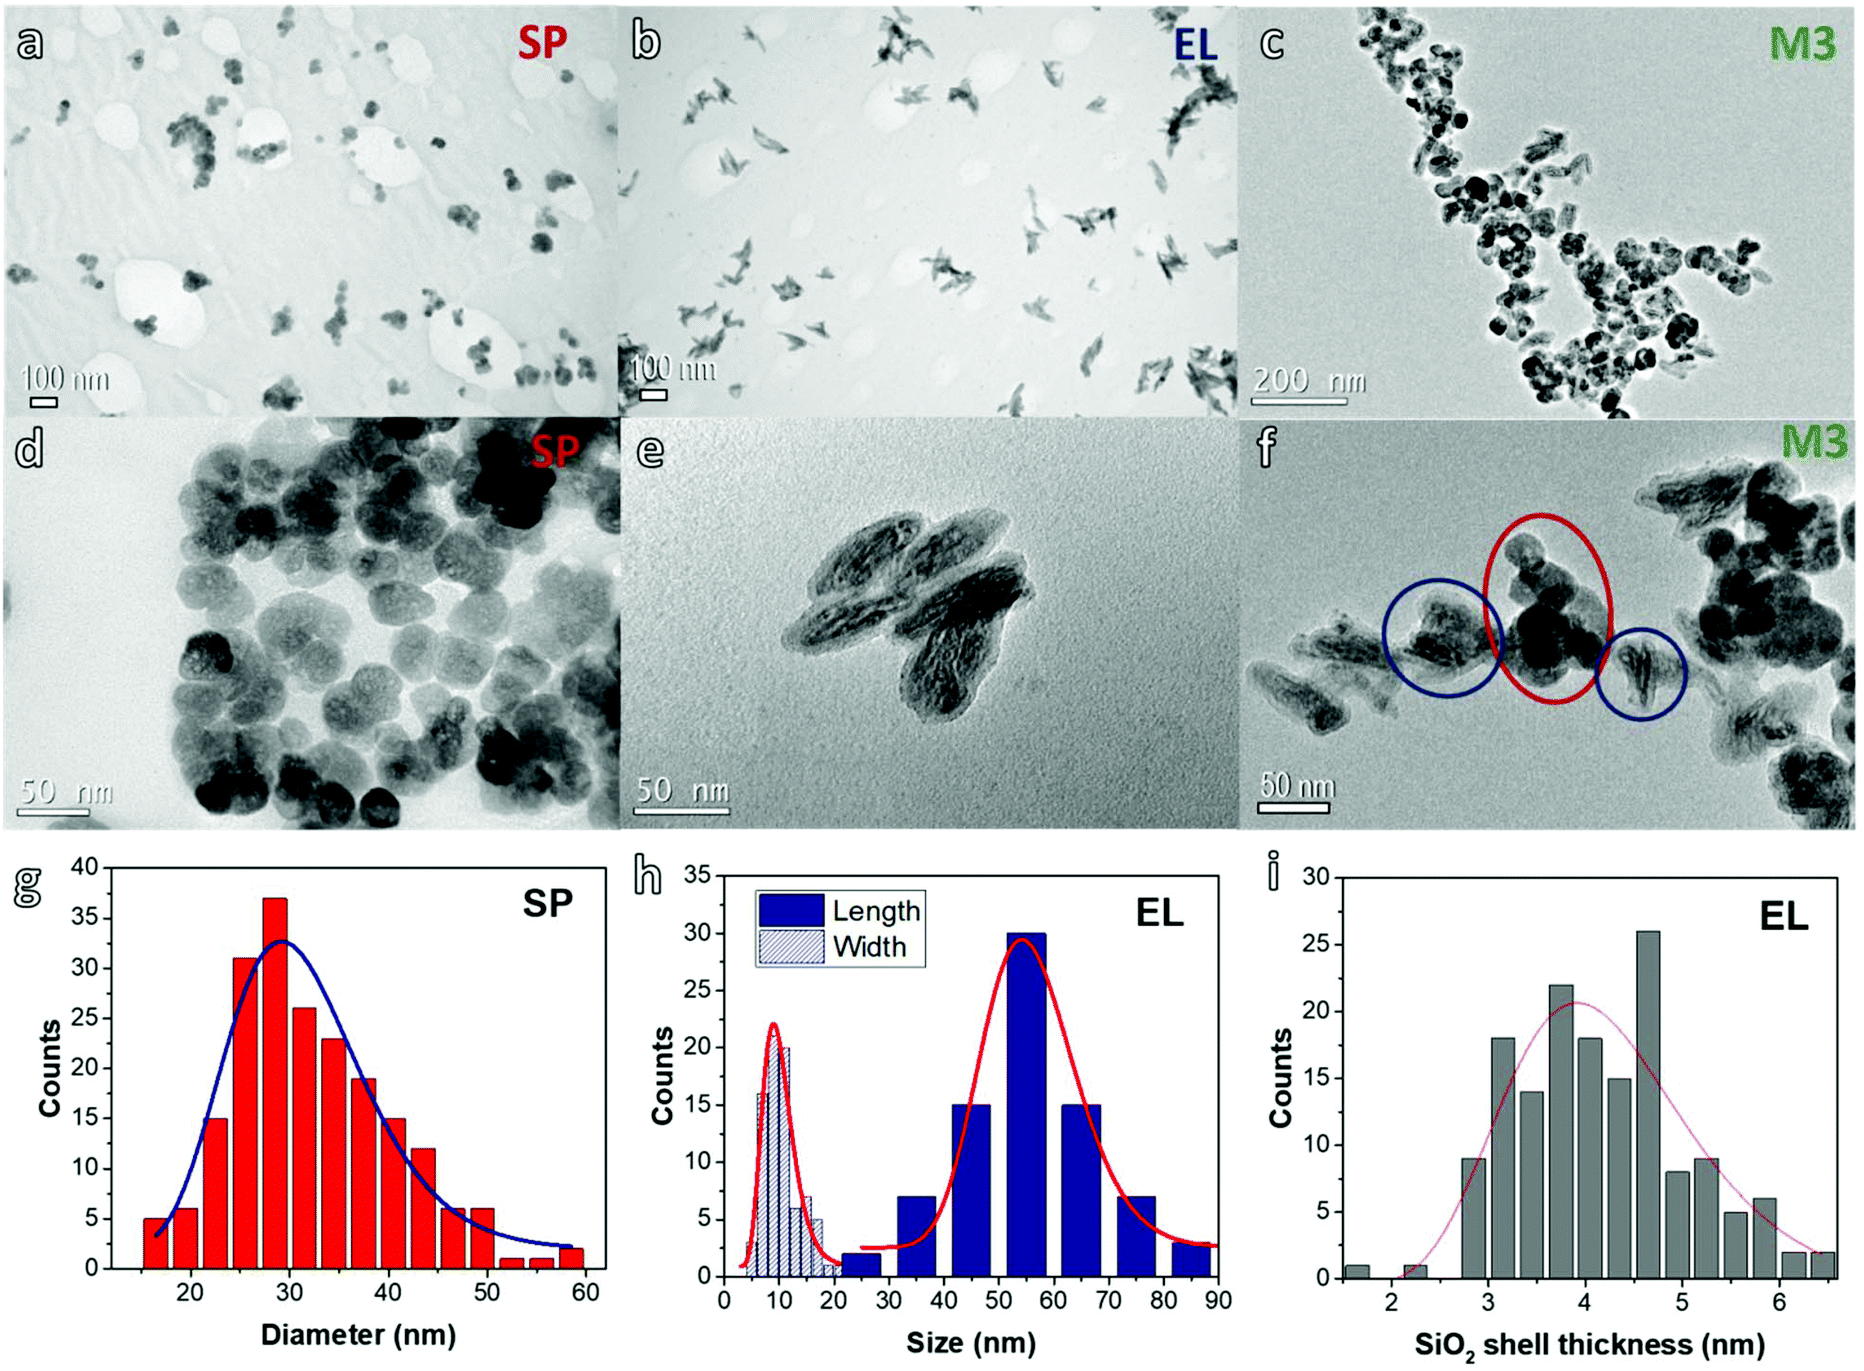 | ||
| Fig. 1 TEM images of (a and d) spherical NPs (SP), (b and e) elongated NPs (EL) and (c and f) a mixture dispersion of both (sample M3). Distributions obtained from TEM images of: (g) SP diameter, (h) length and width of the magnetic core of EL NPs, (i) silica shell thickness of EL NPs. | ||
Fig. 1 also includes the distributions and corresponding log-normal fitting for: the diameter of the SP NPs (frame g); the length L (i.e. the major axis) and the width W (i.e. the minor axis) of the magnetic core of the EL NPs (frame h); the thickness of the silica shell of the EL NPs (frame i). The mean diameter of the SP NPs, as obtained by the fitting, is 31 nm (normalized standard deviation σ = 0.23) resulting in a mean volume of ∼1.6 × 10⁴ nm3. The average dimensions of the EL cores are: 〈L〉 = 56 nm (σ = 0.16) and 〈W〉 = 10 nm (σ = 0.29). The average ratio between length and width, i.e. the aspect ratio, is 5.2 (σ = 0.24) (the distribution is shown in Fig. S1†). Hence, the core mean volume is ∼2.9 × 10³ nm3, under the assumption of a perfect prolate spheroidal shape. The average thickness of the silica shell is 4 nm (σ = 0.24). Hence, the mean volume of the EL NPs (including silica) is ∼1 × 10⁴ nm3, of the same order of magnitude as that of the SP NPs. It is easy to calculate that the core:shell volume ratio is approximately 1:3.
Fig. 1c and f are TEM images for sample M3. Although the NPs show a tendency to form large agglomerates on the TEM grid, they are not homogeneously mixed, but aggregates of EL and SP NPs can be well distinguished (highlighted by the circles in Fig. 1f).
The crystalline structure of the samples is studied by XRD (Fig. S2†) in order to confirm the magnetic phase of sample SP, prepared in one step, and the complete transformation of the goethite core of EL NPs after reduction, i.e. after step 3 of the synthesis process (Scheme 1). For both samples, the diffraction peak positions match with the inverse spinel structure of the magnetite/maghemite iron oxide phases. The peaks in the SP spectrum are much narrower than those in the EL one, which is consistent with the larger mean size of the SP NPs. In the spectrum of the EL NPs, no residual peak of either the goethite phase or the hematite phase is visible.
The hydrodynamic sizes DH of the SP and EL NPs in suspension, estimated by DLS (Fig. S3†), are ∼127 and 143 nm, respectively (Table 1). The silica coating in EL and the polyol rests in SP NPs represent a steric barrier that ensures the spacing between magnetic cores and introduces a negative surface charge responsible for the electrostatic repulsion that helps keeping the particles apart and provide colloidal stability during the measurements. The DH values are larger than the sizes estimated by TEM, which is usual for magnetic colloids dispersed in aqueous media. The effect is generally attributed to the formation of small aggregates of few NPs during the synthesis, known as primary aggregates,65 which cannot be broken even with strong sonication. It is worth remarking that DLS is an optical technique performed over suspensions of NPs diluted at a concentration much smaller than that of the original samples prepared for the magnetic study and heating tests (i.e. 4.6 mg mL−1). Therefore the NPs may present a different aggregation state. Despite such concern, the low polydispersity index (PDI), 0.21 and 0.13 in SP and EL samples respectively (Table 1), indicates the homogeneity and stability of these colloids. Interestingly, the hydrodynamic size in mixed samples averages around 200 nm, i.e. the aggregate size increases slightly as a consequence of the mixing. Most likely this reflects the formation of secondary aggregates consisting of SP and EL primary aggregates, as suggested by the TEM study on sample M3 (Fig. 1c and f), although the NPs are under a very different condition in the TEM analysis and in the DLS one. This can be explained considering that the two colloids present different coatings and their stabilization mechanism are hampered in the mixture. However, the PDI parameter remains low, below 0.2 for most samples, which seems to indicate that these secondary aggregates maintain a good colloidal stability.
3.2 Magnetic study
Regarding EL, the thermal decrease of MS in the 5–300 K range is similar to that of bulk magnetite. Since the magnetization is obtained by dividing the magnetic moment measured by SQUID by the weight of the whole sample, the apparent reduction of MS compared to magnetite is mainly due to the presence of the non-magnetic SiO2 coating layer. The magnetite content in EL NPs can be estimated by comparing the measured MS to that of the bulk phase. We find that the magnetite fraction is ∼39 wt% and, accordingly, the SiO2 fraction is ∼61 wt%. Hence, the total amount of magnetite in the mixed samples, relative to both EL and SP NPs, decreases moving from sample M1 to M6 (Table 1). Considering the density of bulk Fe3O4 (∼5 g cm−3) and SiO2 (∼2.6 g cm−3),66 we estimate that the volume fractions of magnetite and silica are ∼25% and ∼75% respectively, in line with the ratio 1:3, obtained by TEM. It is to be considered that, as revealed by TEM (Fig. 1), the EL NPs have a porous structure and, therefore, the density values of the magnetite core and silica shell are certainly lower than that of the bulk phases, actually. Hence, the agreement between the core:shell volume ratio estimated by magnetic measurement and that estimated by TEM implies that the density of magnetite and silica is reduced to the same extent, compared to the bulk values.
As for SP, the low MS compared to the value of bulk magnetite cannot be entirely ascribed to the presence of the ethylene glycol layer (∼2 wt%). The reduction of MS and its stronger thermal dependence compared to magnetite can be determined by traces of maghemite (the bulk phase has MS ∼83 emu g−1 at T = 5 K (ref. 28)) and by structural/magnetic disorder effects, such as an altered distribution of vacancies in the spinel structure and spin-canting, which may affect the NPs with smaller size,67–69 also due to their porosity.
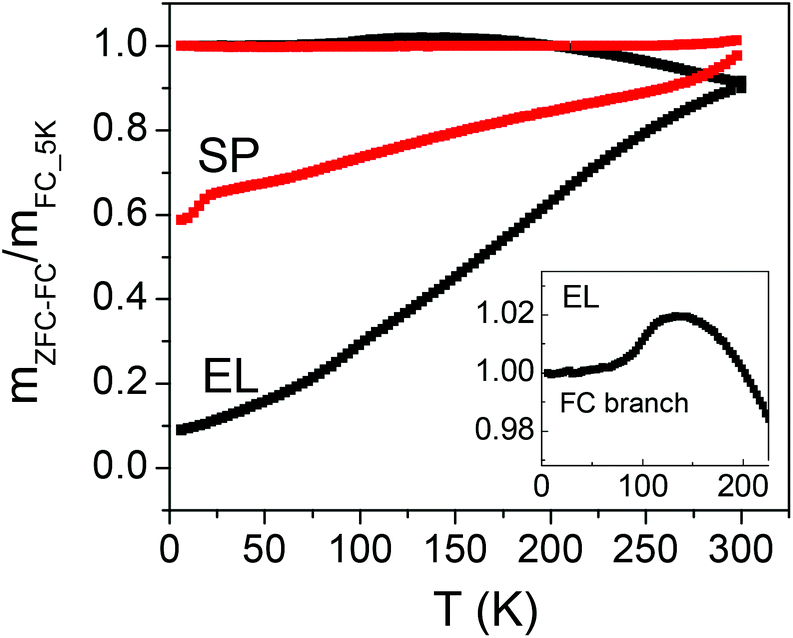 | ||
| Fig. 2 Magnetic moment measured on samples EL and SP for increasing temperature T at Happl = 20 Oe, after zero-field-cooling (mZFC, lower branch of each displayed curve) and after field-cooling (mFC, upper branch); the inset is a close-up of the FC branch for sample EL. The curves are normalized to the value of mFC at T = 5 K. | ||
In general, it is assumed that all the NPs are in the full superparamagnetic state at the temperature where the mZFC and mFC branches join together.
The Néel expression for the magnetic relaxation time of a magnetic NP moment is:
| τN = (1/f0)exp(KV/kBT) | (1) |
| V = ln(tmf0)kBT/K | (2) |
A value of ln(tmf0) ∼ 25 is usually considered for SQUID measurements, which assumes tm = 100 s (i.e., measuring frequency fm = 0.01 Hz) and f0 = 109 Hz.26,72
Regarding SP, the mZFC and mFC branches are not seen to join even at T = 300 K. Setting K equal to the magnetocrystalline anisotropy of bulk magnetite (1.1 × 10⁵ erg cm−3) and T = 300 K in eqn (2), the size D below which the SP NPs are superparamagnetic is ∼26 nm (being V = πD3/6). Based on the size distribution of the SP NPs (Fig. 1g), it turns out that only a minor fraction (∼23%) is in the superparamagnetic regime at that temperature, under the adopted experimental conditions. From eqn (2), we can also estimate that the smallest SP NPs of the distribution, with D ∼ 17 nm, block around 100 K. Hence, we schematically consider that all the moments of the SP NPs are blocked at T = 100 K.
In EL, the mZFC and mFC branches join at T = 300 K and hence we assume that at this temperature substantially all the NPs are in the superparamagnetic state. In fact, the magnetic anisotropy of EL NPs is certainly larger than the magnetocrystalline anisotropy of bulk magnetite, due to the elongated shape which results in the appearance of an anisotropy contribution of magnetostatic origin (i.e. shape anisotropy);28 on the other hand, the mean volume of the magnetic core of the EL NPs is one order of magnitude smaller than that of the SP ones.
The mFC curve for EL features a step at T ∼ 100 K (inset of Fig. 2), which can be ascribed to the Verwey transition, i.e. the change from the monoclinic to the cubic lattice structure typical of magnetite.73 The Verwey transition is very seldom observed in NPs, due to the structural disorder that the scaling to the nanometric regime may induce.74,75 Hence, the observation of this phenomenon in EL NPs confirms the good crystallinity and high order degree of the Fe3O4 phase. It has been previously reported how the silica coating reduces the exposure to the oxygen present in the liquid media preventing the natural oxidation of Fe2+ ions in magnetite.76
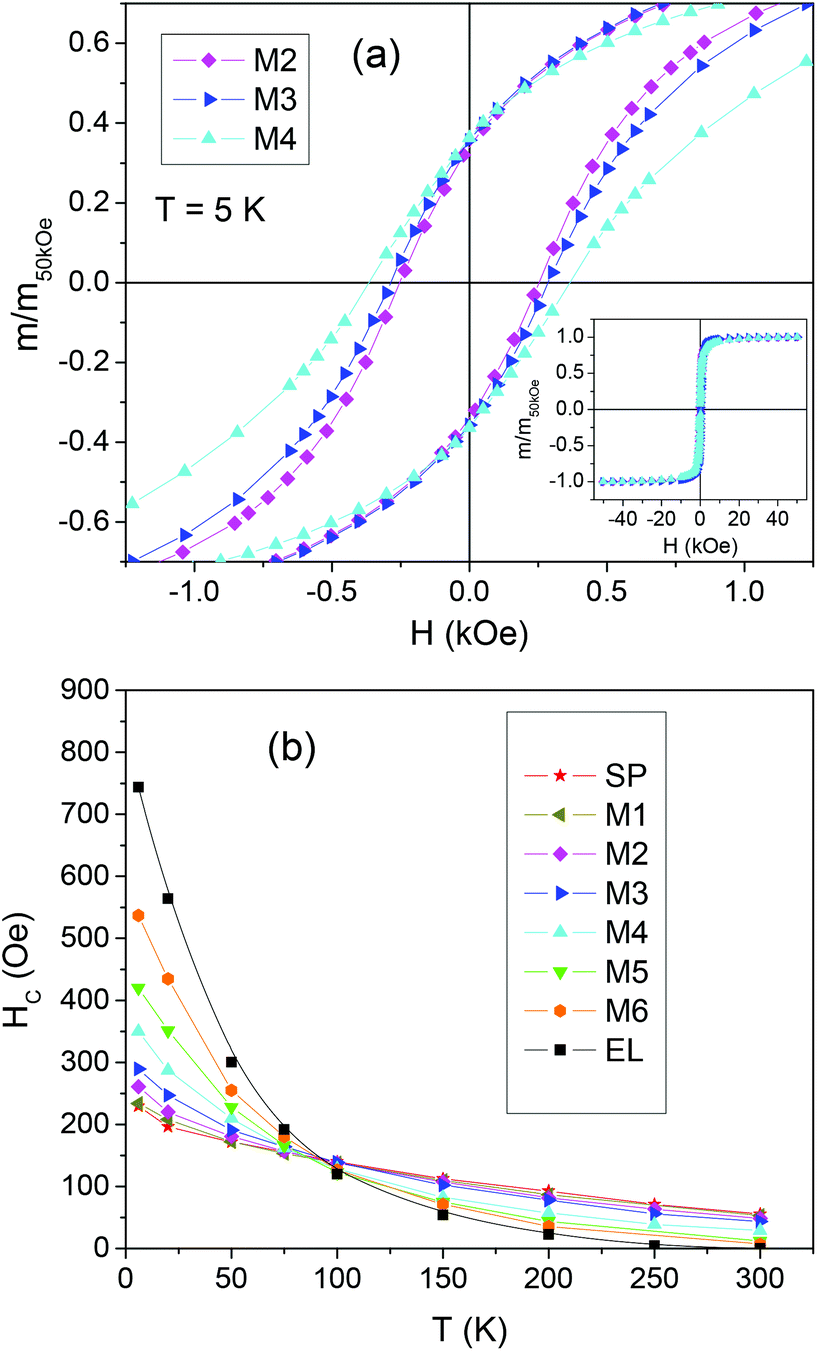 | ||
| Fig. 3 (a) Magnetic hysteresis loops measured at T = 5 K on representative mixed samples (M2, M3 and M4); expressed as m/m50kOevs. magnetic field H, being m the magnetic moment and m50kOe the value at H = 50 kOe. The main frame is a close up of the central region of the loops, which are displayed in the inset. (b) Coercivity HCvs. T for the indicated samples. | ||
The curves of coercivity HCvs. T are shown in Fig. 3b.
At T = 5 K, HC is ∼230 Oe in SP, a value in line with that usually found in magnetite NPs;74,77 a much higher HC ∼ 743 Oe is measured for EL, consistent with the existence of shape anisotropy. Since, based on the Stoner Wohlfarth model, HC and the magnetic anisotropy are proportional in a random assembly of magnetite NPs,28 we can roughly estimate that the anisotropy coefficient K for the EL NPs is about three times larger than that for the SP NPs. For T < 100 K, the coercivity of EL is larger than that of SP, whereas for T > 100 K the opposite relation holds. At T = 300 K, HC is null in EL, which is in favor of a predominant superparamagnetic behavior of the NP assembly; HC is ∼56 Oe for SP, confirming that not all the NPs are in the superparamagnetic regime. For T < 100 K the coercivity of the mixed samples increases with increasing the fraction of EL, i.e. going from sample M1 to M6, whereas the opposite occurs at higher temperature.
The loops measured on the mixed samples are compared to loops calculated as the weighted sum of the loops of EL and SP, according to the sample composition. These calculated loops are the expected ones under the assumption that the two populations of NPs do not influence each other. In Fig. 4a, the measured and calculated HC values are reported as a function of the fraction of EL NPs in the samples, for T = 5, 50, 100, 150 and 300 K.
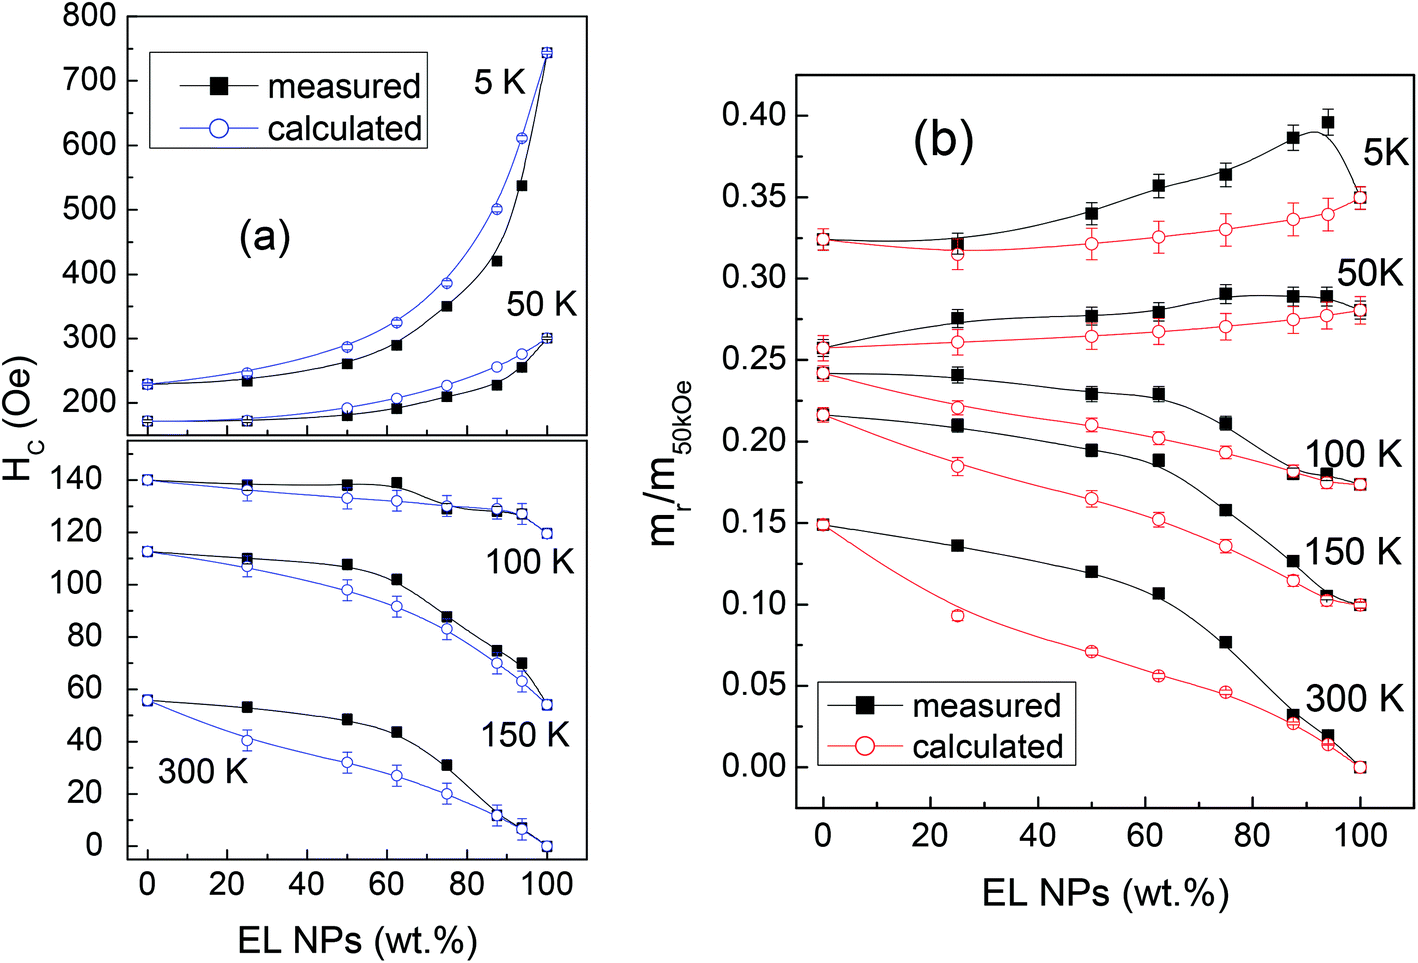 | ||
| Fig. 4 (a) Coercivity HC and (b) squareness mr/m50kOe as functions of the fraction of EL NPs in the samples, at different temperatures. The curves of the measured and calculated values are compared (see text for details). In many cases the error bar is smaller than the symbol size. | ||
Obviously, the measured and calculated curves join at the ends. At T = 5 and 50 K, i.e. for temperatures at which the EL NPs are magnetically harder than the SP ones, the curve of the measured HC lies below that of the calculated HC. On the opposite, for T ≥ 100 K, i.e. for temperatures at which the EL NPs are softer than the SP NPs, the measured HC is larger than the calculated one, particularly in M2 and M3 (actually, at T = 100 K, the measured and calculated HC are similar within the experimental error, apart from M3). We also consider the squareness parameter, i.e. the ratio mr/m50kOe, where mr is the remanent moment and m50kOe is the moment at H = 50 kOe. The measured and calculated curves of squareness vs. EL NPs fraction are shown in Fig. 4b. At all temperatures, the measured curve lies above the calculated one. At T = 5 and 50 K, the squareness slightly increases passing from M1 to M6 and the opposite trend is observed at the higher T values.
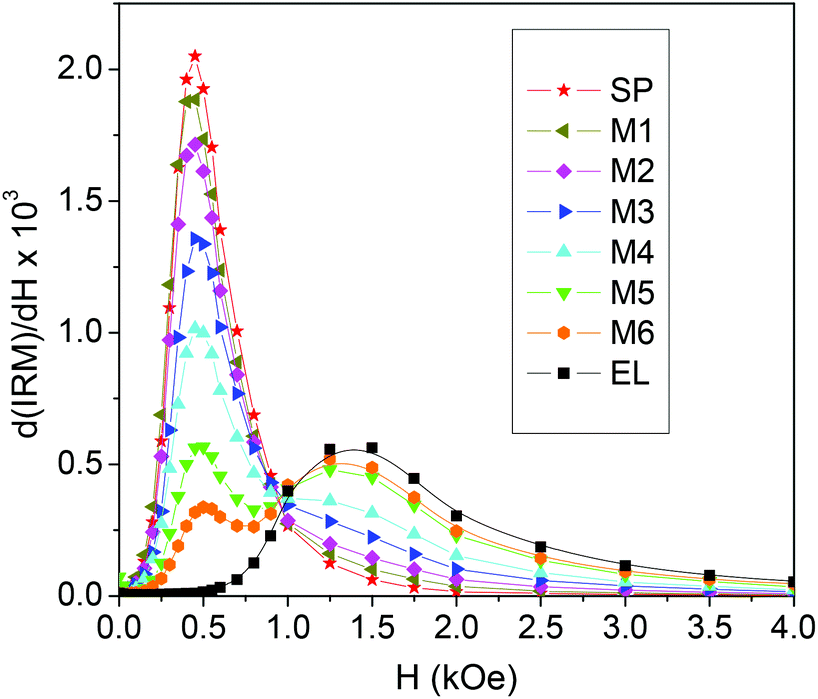 | ||
| Fig. 5 Field derivative of the isothermal remanent magnetization curves (IRM) measured at T = 5 K on the investigated samples. | ||
The peak at a higher field is reasonably related to the fraction of EL NPs and, in fact, increases as that increases. As we have done for the hysteresis loops, we calculate the IRM curves for the mixed samples as the weighted sum of the IRM of EL and SP.
In Fig. 6a–f, we compare the field derivatives relative to the measured and calculated IRM. In all samples, the measured curve features a low-field peak higher than that visible in the calculated curve and broadened, particularly on the right side. On the contrary, the measured high-field peak is lower than the calculated one and shifted to the left so that in samples M2, M3 and M4 it actually constitutes the tail of the distribution or a shoulder of the first peak.
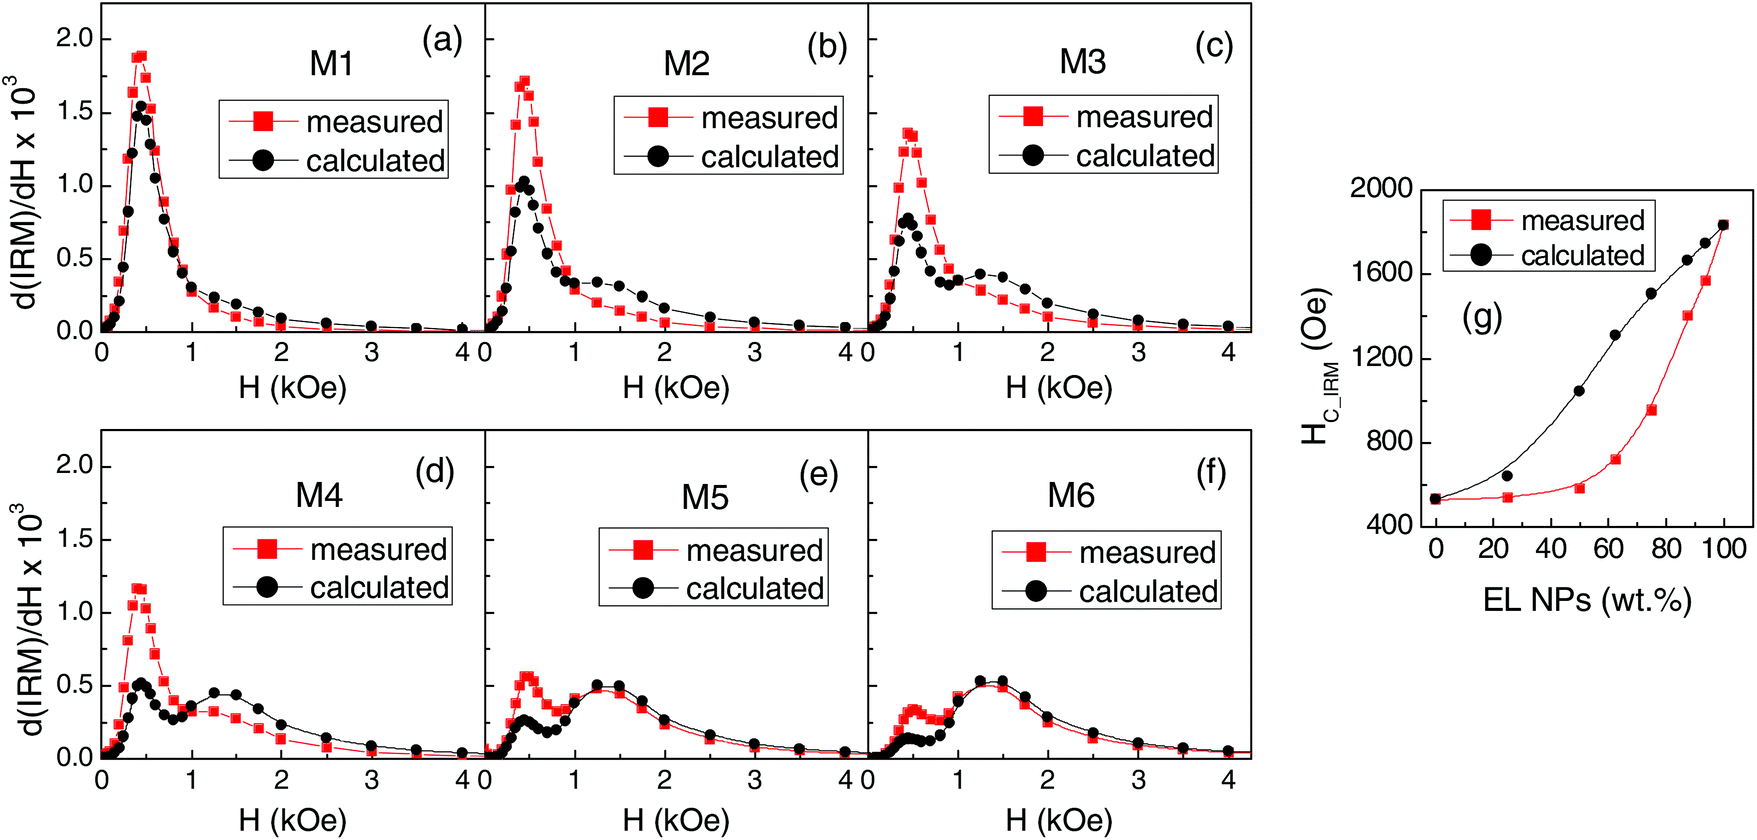 | ||
| Fig. 6 (a–f) Measured and calculated switching field distributions for the mixed samples (T = 5 K). (g) Measured and calculated values of HC_IRM shown as functions of the fraction of EL NPs in the samples. | ||
The field value at which IRM = 0.5 is the isothermal remanence coercivity HC_IRM, a measure of the difficulty of magnetizing irreversibly the sample.78,79 The measured HC_IRM values and those obtained from the calculated IRM curves are shown in Fig. 6g as functions of the fraction of EL NPs in the samples. The measured HC_IRM increases with increasing the EL NP content, in agreement with what is observed for HC at T < 100 K (Fig. 4a), but is lower than the calculated one. This confirms that, at low temperature, the assembly of magnetic moments can be more easily oriented by the field than in the case of having two non-interacting populations of EL and SP NPs.
From the IRM and DCD curves, the parameter ΔM(H) = DCD(H) − [1 − 2IRM(H)] can be derived, which provides information on the nature of magnetic interactions in the system.80–82 The plots of ΔM vs. H for EL, SP and for some representative mixed samples are shown in Fig. S5c.† A negative ΔM is measured in EL and SP, which indicates the existence of predominant dipolar interparticle interactions.26,72,80 The field value corresponding to the minimum of ΔM is larger in sample EL compared to what is observed for SP, consistent with the greater magnetic hardness of the EL NPs at low temperature. Regarding the mixed samples, two minima can be well distinguished in the ΔM plots, which clearly reveal the existence of two distinct regimes of dipolar interactions, corresponding to the two populations of SP and EL NPs.
On sample M3, showing particularly relevant differences between the measured and calculated magnetic properties (Fig. 4 and 6), we measure the IRM at different temperatures, in order to study the thermal evolution of the switching field distribution, as shown in Fig. 7a. It is worth recalling that the distributions obtained from the IRM curves are normalized to the area and that at T = 5 K all the NPs are magnetically blocked and can contribute to the measured remanent magnetization whereas, with increasing temperature, those undergoing superparamagnetic relaxation do not. The distribution shifts towards lower field values with increasing temperature. This behaviour is reflected in the trend of HC_IRMvs. T (inset of Fig. 7a), which is consistent with that of HCvs. T (Fig. 3b), namely with the thermally induced magnetic softening generally observed in all the samples. In Fig. 7b, the switching field distributions measured on SP and M3 at T = 300 K are directly compared. At this temperature, the elongated NPs are superparamagnetic and no IRM curve can be measured. The switching field distribution of M3 is shifted to the right compared to that of SP, i.e. the sample is more stable against the field compared to SP and obviously EL, taken separately.
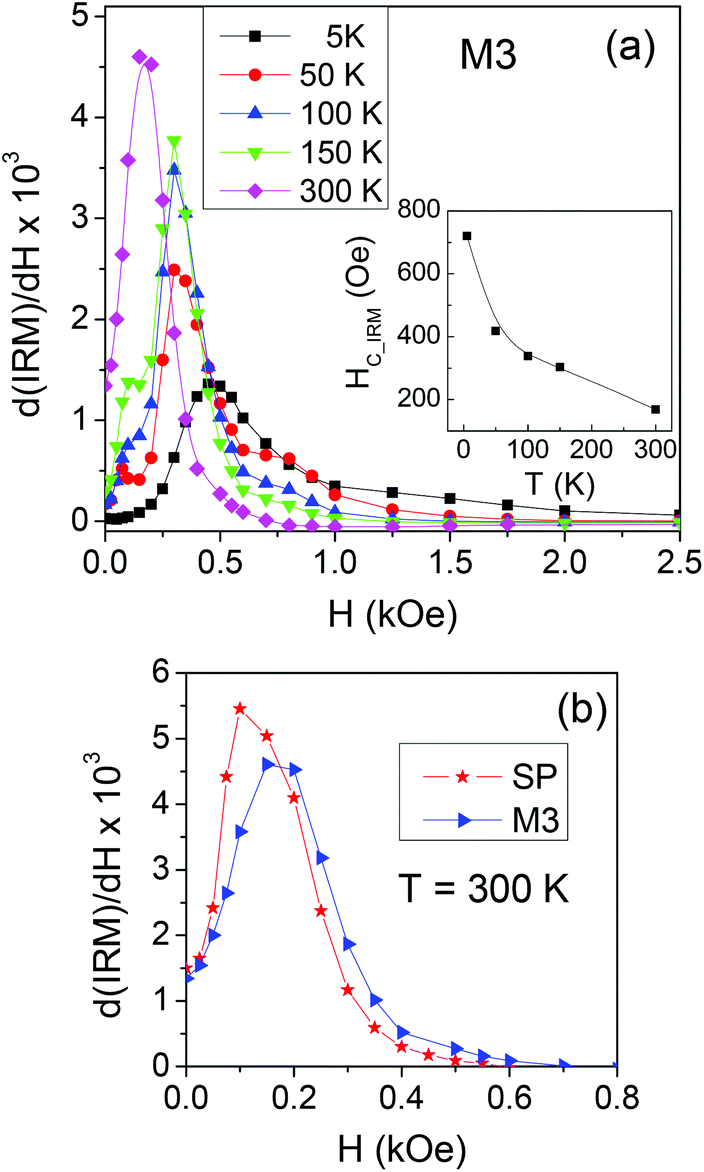 | ||
| Fig. 7 (a) Switching field distributions measured at the indicated temperatures on sample M3. Inset: Curve of HC_IRMvs. T. (b) Switching field distributions for SP and M3 at T = 300 K. | ||
On samples EL, SP and M3, we measure the thermoremanent magnetization (TRM) using this procedure: at T = 250 K a field Happl = 100 Oe is applied to the sample; then, the temperature is lowered down to T = 5 K, the field is removed and the remanence is measured as a function of temperature up to 250 K.
The temperature derivative curve d(TRM)/dT is a figure of the distribution of anisotropy energy barriers associated with the relaxing magnetic moments of the assembly. The TRM curves and corresponding derivatives are shown in Fig. 8a and b. In the distribution of EL, the highest contributions are at T ∼ 90 K. The distribution of SP shows a high peak at T ∼ 15 K and a plateau at higher temperatures. The peak may be the hint of a low-temperature collective freezing of the spins at the surface and/or in the core of the smallest SP NPs, possibly associated with their not fully homogeneous structure, as often observed in ferrite NPs.50,67,83,84 This hypothesis is supported by the observation that the peak position shows a weak field dependence, i.e. almost does not change in distributions for smaller or higher Happl, i.e. 20 Oe and 500 Oe (Fig. S6†), as expected for a low-temperature glassy magnetic transition.50,70 To fully elucidate this phenomenon is not among the main goals of the present study, actually. We have briefly commented on the presence of this peak in the distribution of SP because it also appears in that of M3.
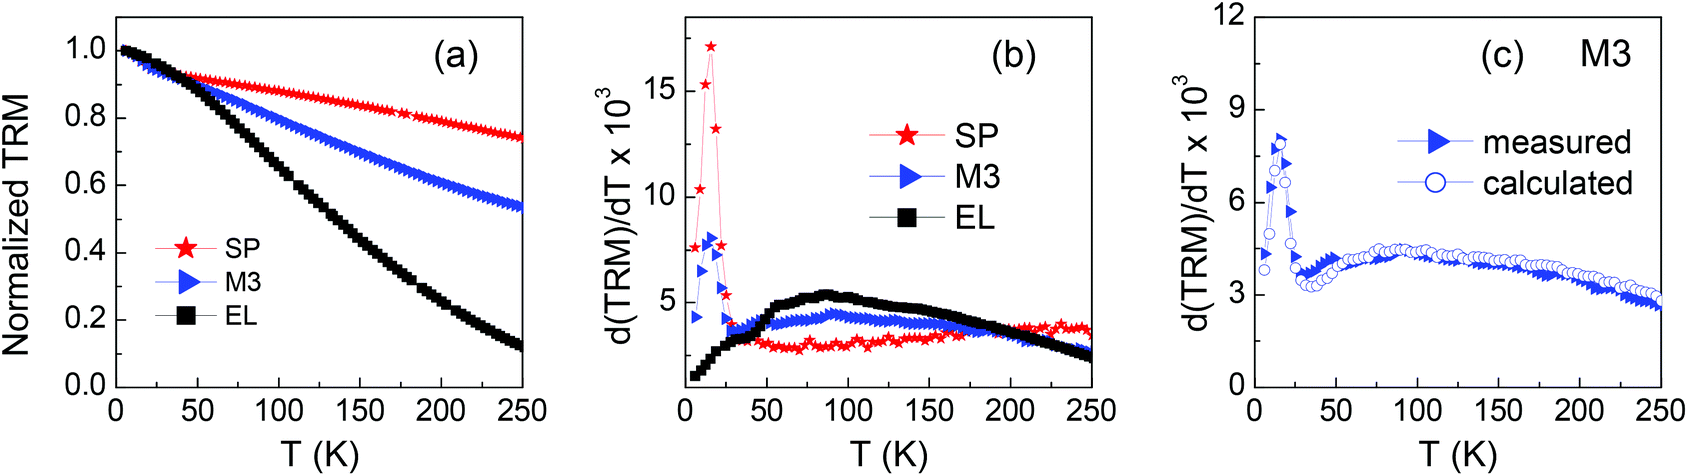 | ||
| Fig. 8 (a) Thermoremanent magnetization (TRM) vs. T for samples SP, M3 and EL (magnetic field previously applied to the samples Happl = 100 Oe); the curves are normalized to their initial value at T = 5 K. (b) Temperature derivatives of the curves in (a). (c) Temperature derivative of the TRM curve for sample M3 compared to the calculated one (see text for explanation). | ||
The latter is shown again in Fig. 8c together with the calculated one, obtained as the weighted sum of those of SP and EL. The curves are almost perfectly superposed, which indicates that the relaxing behavior of the EL and SP NPs, as disclosed by the TRM measurement, is not affected by their coexistence.
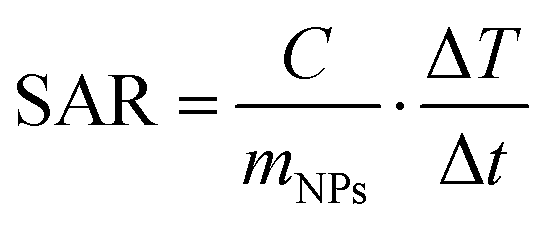
3.3 Magnetic heating tests
The magnetic heating tests are carried out on 1 mL of the prepared solutions (at the concentration of 4.6 mg mL−1) placed in Eppendorf vials adapted with a hole for thermal measurements. The Eppendorf vial is continuously thermalized with a water jacket at 21 °C that isolates the sample from the inductive coil. An alternating magnetic field of amplitude Hmax = 600 Oe (i.e. ∼48 kA m−1) and frequency fm = 96 kHz is applied. These parameters respect the criterion to avoid negative effects on living tissues, requiring (Hmax × fm) < 5 × 10⁹ A m−1s−1,85 which is crucial in view of prospective nanomedicine applications.The temperature is registered for 60 seconds in no field and then for 300 seconds after the field application. In Fig. 9a, the curves of temperature increase ΔT vs. time t are reported, being t = 0 s the moment when the field is applied and ΔT = T(t) − T(t = 0 s). The specific absorption rate (SAR), which expresses the heating efficiency, is obtained through the initial slope method using the relation86
 | (3) |
 | ||
| Fig. 9 (a) Heating curves for the indicated samples, subjected to an alternating magnetic field of amplitude Hmax = 600 Oe and frequency fm = 96 kHz. (b) Measured and calculated SAR values shown as functions of the fraction of EL NPs in the samples. (c) Measured and calculated SARFe values vs. fraction of EL NPs. The solid lines in frames (b) and (c) are guides to the eye. | ||
Some heating curves exhibit sudden slope changes, which are generally ascribed to the formation of agglomerates of NPs caused by the exposition of highly concentrated magnetic colloids to the alternating magnetic field.87,88
More precisely, this effect is observed in SP, M1, M6 and EL, namely in the parent NPs and in the mixed samples where they are present in a high fraction. In contrast, monotonic curves are measured on the other mixed samples. This is a peculiar behavior that we think may be correlated to the formation of secondary aggregates, with quite uniform dimensions and good colloidal stability as inferred from the DH and PDI values (Table 1), which do not evolve further during the magnetic heating test. The effect is interesting and will deserve to be deepened. In any case, all the curves present a monotonous growth in the time interval considered in the SAR calculation.
In Fig. 9b, the measured SAR values are reported as a function of the fraction of EL NPs in the samples, together with those calculated as the weighted sum of the SAR of EL and SP. They are distributed on a wide range going from ∼620 W g−1 of SP to ∼143 W g−1 of EL. The measured SAR is significantly larger than the calculated one in the samples with intermediate mixed composition.
Since the total weight fraction of Fe3O4 in the samples is known, we can also provide SAR values normalized to the total mass of Fe (Table 1), rather than to mNPs as in relation (3), which is the convention more often used in the literature. The values so obtained, indicated as SARFe, are plotted in Fig. 9cvs. the fraction of EL NPs in the samples; the values calculated as the weighted sum of SARFe of EL and SP are also shown. In sample M2, SARFe is ∼970 W gFe−1, the largest value measured in the whole set of investigated samples and considerably high. M1 and M3 also show SARFe close to 900 W gFe−1, comparable to that for SP.
Heating measurements are carried out on sample M3 in alternating field of different amplitudes Hmax (fm = 96 kHz). The results are reported in Fig. 10a. The SAR parameter increases with increasing Hmax and approaches a saturation value, as shown in Fig. 10b.
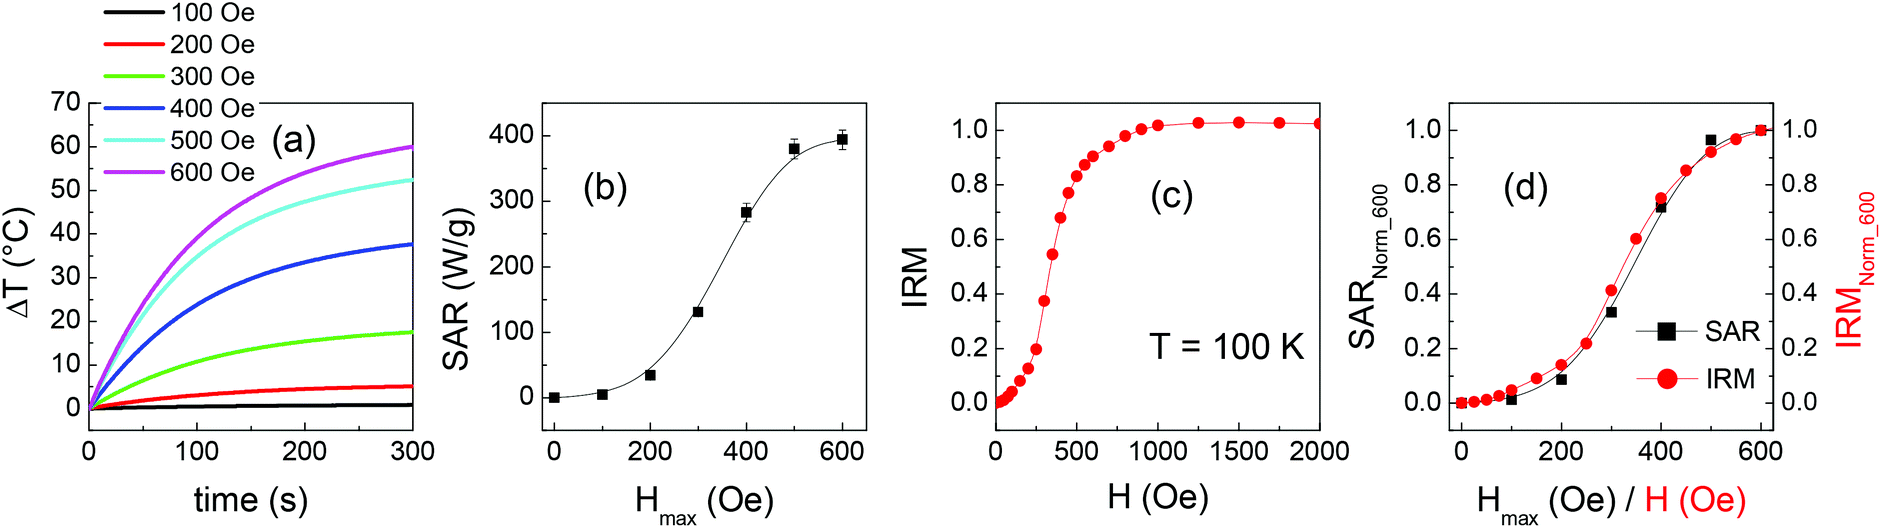 | ||
| Fig. 10 (a) Heating curves measured on sample M3 at different amplitudes Hmax of the alternating magnetic field (frequency fm = 96 kHz). (b) SAR values vs. Hmax. (c) IRM measured on sample M3 at T = 100 K. (d) The SAR vs. Hmax and the IRM curves are shown as normalized to the value they assume at Hmax (for SAR) and H (for IRM) equal to 600 Oe; to highlight this normalization, the left y-axis is labelled as SARNorm_600 and the right y-axis is labelled as IRMNorm_600. | ||
Finally, in order to compare the SAR measured on M3 at Hmax = 100 Oe with the calculated value, the heating curves of samples EL and SP are also measured at this field amplitude (Fig. S7†). It turns out that the measured and calculated SAR values for M3 are ∼5 W g−1, equal within the experimental error of 5%.
4. Discussion
4.1 Magnetic properties
In the mixed samples, the SP and EL NPs magnetically influence each other and this determines the hysteretic properties. In fact, the coercivity and squareness parameters do not correspond to the mere superposition of those measured on the parent EL and SP NPs (Fig. 4). On the other hand, the bimodal character of the switching field distributions and of the ΔM plots, measured at T = 5 K, clearly reveals the presence of the two distinct populations of NPs, each one dominated by interparticle dipolar interactions, similarly to what is observed in the parent EL and SP NPs. This behavior can be explained considering that, as indicated by TEM and DLS analyses (Fig. 1, Table 1) the EL and SP NPs form primary aggregates, which are not broken after mixing them together. Therefore, the magnetic behavior of each nanoparticle is mainly determined by the magnetic interaction between NPs with the same morphology, belonging to the same aggregate.To account for the effects of interaction between EL and SP NPs, we draw a phenomenological model based on the assumption that each population of NPs, when magnetized to a certain extent by the externally applied field, produces a mean field, which intervenes in the magnetization and demagnetization processes of the NP assembly.
Let's consider first the temperature range at T < 100 K, where the SP NPs are magnetically softer than the EL ones and therefore respond first to the applied field. In the switching field distributions (T = 5 K), the position of the first peak is approximately the same in all the samples, which indicates that the moments of the SP NPs switch irreversibly at similar values of the applied field, barely feeling the presence of the EL NPs. The aligned moments of the SP NPs give rise to a mean field that favors the reversal of the moments of the EL NPs, which therefore occurs at a lower field than that observed in the parent EL NPs. This produces the observed increase and right-side broadening of the first peak compared to that visible in the calculated switching field distribution, as well as the shift to a lower field and the depression of the second peak (Fig. 6). These differences are more pronounced in samples M2, M3 and M4 where the amount of SP NPs is high enough to produce a consistent mean field and the amount of EL NPs, on which this mean field acts, is high enough to make the differences between the measured and calculated distributions well appreciable.
In a loop measurement, the whole assembly of mixed NPs is first brought to saturation by a positive applied field H = 50 kOe. Then the field is reduced to zero and we measure a larger squareness, compared to that calculated under the hypothesis of two non-interacting populations of NPs (Fig. 4b). Moreover, the measured squareness increases with increasing the fraction of EL NPs in a more pronounced manner than the calculated one. We schematically consider that the moments of the EL NPs, which are more stable against the variations of the applied field due to the higher magnetic anisotropy, give rise to a positive mean field. This mean field, stronger in the samples containing a larger fraction of EL NPs, favors the alignment of the moments of the SP NPs, leading to the squareness enhancement. Then, when an increasing negative field is applied, the SP NPs moments align with the field first and produce a negative mean field, which favors the reversal of the EL NP moments. This causes the observed reduction of HC in the mixed samples, with respect to the calculated values (Fig. 4a).
At T ≥ 100 K, the EL NPs turn to be softer than the SP ones, due to stronger thermally induced magnetic relaxation effects. Actually, both populations of NPs are affected by magnetic relaxation processes (Fig. 2 and 8). Therefore, we should distinguish between superparamagnetic and blocked NPs instead of elongated and spherical. However, in section 3.2.2, we have established that, under SQUID measurement conditions, the SP NPs are blocked at T = 100 K and only a minor fraction is superparamagnetic at T = 300 K. On the contrary, the fraction of EL NPs entering the superparamagnetic regime becomes larger and larger with increasing temperature and, at T = 300 K, substantially all the moments undergo superparamagnetic relaxation. Hence, for simplicity of description, we schematically assume that, at each temperature, all the SP NPs remain in the blocked state and consequently the superparamagnetic NPs are only of the EL type.
The thermal evolution of the switching field distribution in sample M3 appears complex (Fig. 7a). At 100 K and 150 K, up to three distinct switching regimes can be distinguished, probably determined by the co-existence of blocked moments – subjected to an intrinsic magnetic anisotropy (magnetocrystalline and/or shape in type) whose coefficient undergoes the usual reduction with rising temperature28 – and thermally fluctuating moments, not yet fully superparamagnetic. At 300 K, the situation is more defined and a single peak is observed, but shifted to the right compared to that visible in the distribution of the parent SP NPs. In an IRM measurement, the applied field tends to align the blocked moments and, to some extent, also the superparamagnetic moments. In this process, an increasing fraction of moments of the blocked SP NPs aligns irreversibly with the applied field and the mean field they produce can grow strong enough to stabilize the fluctuating moments of the EL NPs, even in the absence of the applied field. This results in the observed shift of the switching field distribution of M3 at T = 300 K, with respect to that of the SP sample (Fig. 7b). The existence of a stabilizing mean field – capable of blocking some of the otherwise fluctuating magnetic moments and thus realizing a low-energy magnetic state of correlated moments – also accounts for the increase of squareness and coercivity at T ≥ 100 K, with respect to the calculated values (Fig. 4). Indeed, these differences, particularly relevant in M2 and M3, are substantially annihilated in M5 and M6. In these last samples, the amount of blocked SP NPs is much lower than that of EL NPs and apparently insufficient to produce a mean field strong enough to affect the magnetic behavior of the whole assembly.
It is now quite well established that, given an assembly of magnetic NPs subjected to magnetic relaxation processes, interparticle dipolar interactions can stabilize the thermally fluctuating moments, preventing or shifting to higher temperature their passage to the superparamagnetic regime.26,44,47,89 Therefore, one may object that the mechanism we propose, based on the existence of a stabilizing mean field, is basically the same effect produced by interparticle dipolar interactions. However, once more we would like to point out that the SP and EL NPs form primary aggregates and therefore we exclude the hypothesis of predominant dipole–dipole interactions between NPs of different types. The existence of strong dipolar interactions between the aggregates of NPs of the same type also should be disregarded since the configuration of the magnetic moments inside them is expected to favor the closure of the magnetic flux.79,90 Nevertheless, the two populations of NPs do influence each other and we propose that, at T ≥ 100 K, the EL NPs feel the extra mean field that the SP NPs produce when magnetized to a certain extent. This last requirement marks a difference with the stabilizing effect of interparticle dipolar interactions, which may affect the magnetic properties of a NP assembly regardless of the presence of an external applied field and of a remanent magnetization. This difference is also demonstrated by the TRM measurements. The measured and calculated anisotropy energy barrier distributions for M3 are very similar (Fig. 8c). This indicates that the (thermo)remanent magnetization obtained with Happl = 100 Oe is too small to generate a mean field strong enough to perturb the magnetic relaxing behavior of the assembly, which is rather determined by the dipolar interactions between NPs of the same type, as in the parent NPs.
4.2 Magnetic heating efficiency
The heating efficiency of the mixed samples, as expressed by the SAR parameter, varies between the two extremes represented by the SP and EL NPs and, remarkably, for some samples it is definitely larger than the calculated one (Fig. 9b). It is well known that the heat released by magnetic NPs subjected to an alternating magnetic field, during one cycle, is equal to the area A of the resulting hysteresis loop. The SAR parameter, very often measured through a calorimetric method as in the present case,3,86,91,92 actually corresponds to the product of A and the frequency fm of the magnetic field.71The difference in the trends of the measured and calculated SAR curves (Fig. 9b) closely resembles that observed for HC and for the squareness at T ≥ 100 K (Fig. 4). This striking similarity appears reasonable since an enhanced coercivity and squareness imply an overall increase of the loop area and therefore a higher SAR. However, two items need to be better addressed in this explanation: (i) the measuring frequency fm is different in SQUID and calorimetric measurements; (ii) coercivity and squareness refer to a major hysteresis loop, whereas minor loops are executed during a SAR test. The first point implies that the magnetic relaxing states of the EL and SP NPs as seen in SQUID measurements and magnetic heating tests are different. According to eqn (2), a superparamagnetic transition observed at a certain temperature operating at a certain fm is seen to occur at lower temperature operating at lower fm. Heating tests are carried out starting from a temperature of 21 °C (i.e. 294 K). We can use eqn (2) to estimate the value of temperature Tsquid that, operating with a SQUID at fm = 0.01 Hz (tm = 100 s), corresponds to the same magnetic relaxing state probed at T = 294 K operating at fm = 96 kHz (tm = 1 × 10⁻⁵ s). A temperature Tsquid ∼ 108 K is obtained (see the ESI file† for details on the calculation), a value which, based on Fig. 4, is in the range where, as general tendency, the measured HC and squareness are effectively larger than the calculated ones. It is also to be considered that Tsquid actually increases during the heating test, as the temperature rises above the initial value of 294 K. Hence a qualitative correlation is established between the static magnetic properties of the samples and the heating efficiency tested through an alternating field, which constitutes a promising result. The validity of this reasoning is confirmed by the following argument. We expect that the rising trend of the SAR vs. Hmax curve measured on M3 (Fig. 10b) reflects the progressive increase of the remanent magnetization in the sample, resulting in a progressive growth of the loop area. Hence, this curve should resemble the IRM measured on M3 at Tsquid ∼ 108 K. We have not measured the IRM at this temperature actually, but we can refer to IRM at T = 100 K (Fig. 10c). The SAR vs. H and the IRM curves are shown in Fig. 10d. For an easier comparison, they are normalized to Hmax (for SAR) and H (for IRM) equal to 600 Oe. As expected, they are almost perfectly superposed.
This argument also helps to elucidate item (ii). Considering again the IRM curve of M3 at T = 100 K (Fig. 10c), we observe that IRM is larger than 0.9 at H = 600 Oe, namely the sample is close to reaching its maximum remanent magnetization and, accordingly, the SAR also is close to its saturation value at Hmax = 600 Oe. This reasoning, extended also to the other investigated samples, allows us to correlate the trend of HC and squareness for T ≥ 100 K, reported in Fig. 4, with those of SAR shown in Fig. 9b, although the first parameters are relative to major hysteresis loops and the second to minor loops. Hence, the coexistence of EL and SP NPs in the mixed samples affects in a similar way the hysteretic properties and the magnetic heating capacity as measured at Hmax = 600 Oe. However, we have verified that in sample M3 no difference exists between the measured and calculated SAR values for Hmax = 100 Oe. This indicates that the two populations of NPs do not influence each other under a so weak applied field, in perfect agreement with the TRM results (Fig. 8) and with our mean field model.
Fig. 9c, which reports the SARFe values, namely the heating efficiency per unit mass of Fe in the samples, offers an interesting perspective. Let's suppose to prepare, for heating tests, two different aqueous solutions of NPs containing the same total amount of Fe, one consisting of SP NPs and the other of EL NPs. Fig. 9c indicates that a larger amount of heat is produced by the SP sample. In fact, the EL NPs that, under the experimental conditions adopted in a heating test, are in the superparamagnetic regime are useless for generating heat because of their null hysteresis.26,52 However, Fig. 9c also indicates that if we prepare a third sample with the same Fe content, but consisting of SP and EL NPs mixed in the right proportion (i.e. as in M1, M2 or M3), this will produce a comparable or even higher amount of heat, with respect to that generated by the SP one. In fact, as explained above, the mean field, produced by the blocked SP NPs, stabilizes the fluctuating moments of the EL NPs, particularly those which have not yet entered the full superparamagnetic regime. Therefore, the EL NPs are able to contribute more effectively to the heat production. It is to be considered that if the EL NPs were spherical but with the same volume, the associated anisotropy energy barriers would be considerably lower and, for a given temperature, the effects of relaxation of the magnetic moments would be much stronger. Therefore, a larger fraction of EL NPs would be fully superparamagnetic under the SAR measurement conditions and the stabilizing action of the SP NPs would result to be much less effective.
In the biomedical field, the use of the mixed sample, with its fraction of EL NPs ranging from 25 to 63 wt% in the M1, M2 and M3 formulations (Table 1), can be advantageous with respect to the SP sample, the heating efficiency being equal. If, after a therapeutic heating treatment, the alternating field is turned off paying attention that no net magnetization remains and that the whole NP assembly is demagnetized (this can be easily obtained by reducing progressively the field amplitude to zero28), the mean field also is turned off and hence the EL NPs regain their full superparamagnetic character. Hence, using the mixed sample, instead of the SP one, implies that the weight fraction of blocked ferrimagnetic NPs retained in the body is less, which reduces the risk that they form large agglomerates that may be dangerous for the patient's health.
This is an advantage, although it is known that other factors besides magnetic interactions may cause the formation of agglomerates of NPs, such as van der Waals or, more generally, electrostatic interactions. This kind of interaction is generally compensated by coating the magnetic NPs with steric barriers, as in the case of EL and SP NPs, that ensures their colloidal stability and minimizes the protein corona formation.93,94
5. Conclusions
We have prepared an original magnetic system whose magnetic properties and heating performance can be tuned by mixing together, in different proportions, NPs made of the same magnetic material, i.e. iron oxide, but having different magnetic features. This has been achieved by properly selecting NPs with different shape (spherical and elongated) and mean volume, implying different magnetic anisotropy and magnetic relaxing behavior. Each population of NPs is structurally arranged in the form of primary aggregates, possibly forming larger secondary aggregates. The magnetic study of a set of mixed samples and of the parent NPs has provided evidence that the two types of NPs magnetically influence each other and this interplay affects the magnetization process and the hysteretic properties, investigated by SQUID. The interaction mechanism is based on the mean field that the two populations of NPs produce when the whole assembly is subjected to a magnetic field or is in a state of remanent magnetization. However, the mechanism leads to a different magnetic response depending on temperature, more precisely depending on whether the EL NPs are magnetically harder than the SP ones (at T < 100 K) or vice versa (at T ≥ 100 K). This phenomenology impacts the magnetic heating efficiency of the investigated samples and we have disclosed a connection between the SQUID measurements and the heating tests, which are carried out at different measurement frequencies and therefore probe the samples under different magnetic relaxation conditions.The enhanced heating efficiency of the mixed samples compared to the calculated one – tested in a field with Hmax = 600 Oe and fm = 96 kHz – is the result of the stabilizing action that the mean field produced by the magnetically blocked SP NPs exerts on the relaxing EL NPs, hindering their passage to the superparamagnetic regime. The effect occurs provided that a sufficiently strong mean field is generated and this, for a fixed composition of the sample, depends on Hmax. An interesting point is that the stabilizing mean field is turned on by applying the alternating field and can be turned off by reducing the field to zero. In short, we exploit the SP NPs to potentiate the heating ability of the EL NPs when subjected to the alternating field, while preserving, once the field has been removed, their superparamagnetic character. This mechanism can be regulated by properly varying the composition of the mixed samples, as we have shown.
The method we have illustrated is highly versatile and the characteristics of the parent NPs can be optimized in view of the specific use of the mixed samples. For instance, to improve the biosafety of hyperthermia treatments it may be necessary to reduce the value of Hmax. In this case, to play the role of the SP NPs, one can select components with higher MS, so as to increase the mean field they produce at a given value of Hmax. To play the role of the EL NPs, one can select components with a different distribution of anisotropy energy barriers so that the relaxing magnetic moments, present in the assembly at a given measuring frequency fm, can be stabilized by a weaker mean field.
Indeed, considering the extraordinary variety of NPs that can be synthesized with different shapes and sizes, the possible combinations for realizing mixed systems is ideally unlimited and this emerges as an effective route, still largely unexplored, to tune the magnetic properties of systems of NPs and their heating performance.
Conflicts of interest
There are no conflicts to declare.Acknowledgements
J. G. O. and M. P. M. acknowledge funding from the Spanish Ministry of Economy and Competitiveness under grant MAT2017-88148-R (AEI/FEDER, UE), PIE-201960E062 project and from the EU project H2020-FETOPEN-RIA 829162, HOTZYMES.Notes and references
- T. D. Schladt, K. Schneider, H. Schild and W. Tremel, Dalton Trans., 2011, 40, 6315, 10.1039/c0dt00689k.
- L. H. Reddy, J. L. Arias, J. Nicolas and P. Couvreur, Chem. Rev., 2012, 112, 5818, DOI:10.1021/cr300068p.
- E. A. Périgo, G. Hemery, O. Sandre, D. Ortega, E. Garaio, F. Plazaola and F. J. Teran, Appl. Phys. Rev., 2015, 2, 041302, DOI:10.1063/1.4935688.
- A. Jordan, R. Scholz, K. Maier-Hauff, M. Johannsen, P. Wust, J. Nadobny, H. Schirra, H. Schmidt, S. Deger, S. Loening, W. Lanksch and R. Felix, J. Magn. Magn. Mater., 2001, 225, 118, DOI:10.1016/S0304-8853(00)01239-7.
- P. Wust, B. Hildebrandt, G. Sreenivasa, B. Rau, J. Gellermann, H. Riess, R. Felix and P. Schlag, Lancet Oncol., 2002, 3, 487, DOI:10.1016/S1470-2045(02)00818-5.
- D. Ortega and Q. A. Pankhurst, in Nanoscience, ed. P. O'Brien, Royal Society of Chemistry, Cambridge, U.K., 2012, p. 60, 10.1039/9781849734844-00060.
- R. Ivkov, S. J. DeNardo, W. Daum, A. R. Foreman, R. C. Goldstein, V. S. Nemkov and G. L. DeNardo, Clin. Cancer Res., 2005, 11, 7093s, DOI:10.1158/1078-0432.CCR-1004-0016.
- L. Lartigue, P. Hugounenq, D. Alloyeau, S. P. Clarke, M. Lévy, J. C. Bacri, R. Bazzi, D. F. Brougham, C. Wilhelm and F. Gazeau, ACS Nano, 2012, 6, 10935, DOI:10.1021/nn304477s.
- U. M. Engelmann, A. A. Roeth, D. Eberbeck, E. M. Buhl, U. P. Neumann, T. Schmitz-Rode and I. Slabu, Sci. Rep., 2018, 8, 13210, DOI:10.1038/s41598-018-31553-9.
- S. Moise, J. M. Byrne, A. J. El Haj and N. D. Telling, Nanoscale, 2018, 10, 20519, 10.1039/c8nr05946b.
- A. Attaluri, S. K. Kandala, M. Wabler, H. Zhou, C. Cornejo, M. Armour, M. Hedayati, Y. Zhang, T. L. DeWeese, C. Herman and R. Ivkov, Int. J. Hyperthermia, 2015, 31, 359, DOI:10.3109/02656736.2015.1005178.
- K. Maier-Hauff, F. Ulrich, D. Nestler, H. Niehoff, P. Wust, B. Thiesen, H. Orawa, V. Budach and A. Jordan, J. Neurooncol., 2011, 103, 317, DOI:10.1007/s11060-010-0389-0.
- N. R. Datta, S. G. Ordóñez, U. S. Gaipl, M. M. Paulides, H. Crezee, J. Gellermann, D. Marder, E. Puric and S. Bodis, Cancer Treat. Rev., 2015, 41, 742, DOI:10.1016/j.ctrv.2015.05.009.
- C. S. S. R. Kumar and F. Mohammad, Adv. Drug Delivery Rev., 2011, 63, 789, DOI:10.1016/j.addr.2011.03.008.
- H. Oliveira, E. Pérez-Andrés, J. Thevenot, O. Sandre, E. Berra and S. Lecommandoux, J. Controlled Release, 2013, 169, 165, DOI:10.1016/j.jconrel.2013.01.013.
- C. R. Thomas, D. P. Ferris, J. H. Lee, E. Choi, M. H. Cho, E. S. Kim, J. F. Stoddart, J. S. Shin, J. Cheon and J. I. Zink, J. Am. Chem. Soc., 2010, 132, 10623, DOI:10.1021/ja1022267.
- L. de Alcântara Sica de Toledo, H. C. Rosseto, R. S. dos Santos, F. Spizzo, L. Del Bianco, M. C. Montanha, E. Esposito, E. Kimura, P. de S. Bonfim-Mendonça, T. I. E. Svidzinski, R. Cortesi and M. L. Bruschi, AAPS PharmSciTech, 2018, 19, 3258, DOI:10.1208/s12249-018-1163-4.
- C. L. Ventola, P T, 2017, 42, 742 Search PubMed.
- S. Famiani, A. P. Lagrow, M. O. Besenhard, S. Maenosono and N. T. K. Thanh, Chem. Mater., 2018, 30, 8897, DOI:10.1021/acs.chemmater.8b04056.
- J. H. Lee, J. T. Jang, J. S. Choi, S. H. Moon, S. H. Noh, J. W. Kim, J. G. Kim, I. S. Kim, K. I. Park and J. Cheon, Nat. Nanotechnol., 2011, 6, 418, DOI:10.1038/nnano.2011.95.
- S. He, H. Zhang, Y. Liu, F. Sun, X. Yu, X. Li, L. Zhang, L. Wang, K. Mao, G. Wang, Y. Lin, Z. Han, R. Sabirianov and H. Zeng, Small, 2018, 14, 1800135, DOI:10.1002/smll.201800135.
- Q. Zhang, I. Castellanos-Rubio, R. Munshi, I. Orue, B. Pelaz, K. I. Gries, W. J. Parak, P. Del Pino and A. Pralle, Chem. Mater., 2015, 27, 7380, DOI:10.1021/acs.chemmater.5b03261.
- M. Sanna Angotzi, V. Mameli, C. Cara, A. Musinu, C. Sangregorio, D. Niznansky, H. L. Xin, J. Vejpravova and C. Cannas, Nanoscale Adv., 2020, 2, 3191, 10.1039/d0na00134a.
- J. Giri, P. Pradhan, T. Sriharsha and D. Bahadur, J. Appl. Phys., 2005, 97, 10Q916, DOI:10.1063/1.1855131.
- J. T. Jang, H. Nah, J. H. Lee, S. H. Moon, M. G. Kim and J. Cheon, Angew. Chem., Int. Ed., 2009, 48, 1234, DOI:10.1002/anie.200805149.
- L. Del Bianco, F. Spizzo, G. Barucca, M. R. Ruggiero, S. Geninatti Crich, M. Forzan, E. Sieni and P. Sgarbossa, Nanoscale, 2019, 11, 10896, 10.1039/C9NR03131F.
- H. Gavilán, O. Posth, L. K. Bogart, U. Steinhoff, L. Gutiérrez and M. P. Morales, Acta Mater., 2017, 125, 416, DOI:10.1016/j.actamat.2016.12.016.
- B. D. Cullity and C. D. Graham, Introduction to Magnetic Materials, Wiley-IEEE Press, Piscataway NJ, USA, 2nd edn, 2009 Search PubMed.
- Z. Nemati, J. Alonso, I. Rodrigo, R. Das, E. Garaio, J. Á. García, I. Orue, M. H. Phan and H. Srikanth, J. Phys. Chem. C, 2018, 122, 2367, DOI:10.1021/acs.jpcc.7b10528.
- R. Das, J. Alonso, Z. Nemati Porshokouh, V. Kalappattil, D. Torres, M. H. Phan, E. Garaio, J. Á. García, J. L. Sanchez Llamazares and H. Srikanth, J. Phys. Chem. C, 2016, 120, 10086, DOI:10.1021/acs.jpcc.6b02006.
- K. Simeonidis, M. P. Morales, M. Marciello, M. Angelakeris, P. de la Presa, A. Lazaro-Carrillo, A. Tabero, A. Villanueva, O. Chubykalo-Fesenko and D. Serantes, Sci. Rep., 2016, 6, 38382, DOI:10.1038/srep38382.
- A. Walter, C. Billotey, A. Garofalo, C. Ulhaq-Bouillet, C. Lefèvre, J. Taleb, S. Laurent, L. Vander Elst, R. N. Muller, L. Lartigue, F. Gazeau, D. Felder-Flesch and S. Begin-Colin, Chem. Mater., 2014, 26, 5252, DOI:10.1021/cm5019025.
- P. Guardia, R. Di Corato, L. Lartigue, C. Wilhelm, A. Espinosa, M. Garcia-Hernandez, F. Gazeau, L. Manna and T. Pellegrino, ACS Nano, 2012, 6, 3080, DOI:10.1021/nn2048137.
- M. Avolio, H. Gavilán, E. Mazario, F. Brero, P. Arosio, A. Lascialfari and M. P. Morales, Phys. Chem. Chem. Phys., 2019, 21, 18741, 10.1039/c9cp03441b.
- M. Ocaña, M. P. Morales and C. J. Serna, J. Colloid Interface Sci., 1995, 171, 85, DOI:10.1006/jcis.1995.1153.
- A. G. Roca, R. Costo, A. F. Rebolledo, S. Veintemillas-Verdaguer, P. Tartaj, T. González-Carreño, M. P. Morales and C. J. Serna, J. Phys. D: Appl. Phys., 2009, 42, 224002, DOI:10.1088/0022-3727/42/22/224002.
- R. Massart and V. Cabuil, J. Chim. Phys., 1987, 84, 967, DOI:10.1051/jcp/1987840967.
- A. G. Roca, J. F. Marco, M. Del Puerto Morales and C. J. Serna, J. Phys. Chem. C, 2007, 111, 18577, DOI:10.1021/jp075133m.
- S. Ammar and F. Fiévet, Nanomaterials, 2020, 10, 1, DOI:10.3390/nano10061217.
- J. H. Wu, S. P. Ko, H. L. Liu, S. Kim, J. S. Ju and Y. K. Kim, Mater. Lett., 2007, 61, 3124, DOI:10.1016/j.matlet.2006.11.032.
- P. Guardia, B. Batlle-Brugal, A. G. Roca, O. Iglesias, M. P. Morales, C. J. Serna, A. Labarta and X. Batlle, J. Magn. Magn. Mater., 2007, 316, e756, DOI:10.1016/j.jmmm.2007.03.085.
- G. Salas, C. Casado, F. J. Teran, R. Miranda, C. J. Serna and M. P. Morales, J. Mater. Chem., 2012, 22, 21065, 10.1039/c2jm34402e.
- H. Gavilán, E. H. Sánchez, M. E. F. Brollo, L. Asín, K. K. Moerner, C. Frandsen, F. J. Lázaro, C. J. Serna, S. Veintemillas-Verdaguer, M. P. Morales and L. Gutiérrez, ACS Omega, 2017, 2, 7172, DOI:10.1021/acsomega.7b00975.
- J. L. Dormann, D. Fiorani and E. Tronc, in Advances in Chemical Physics vol. XCVIII, John Wiley & Sons, Inc., New York, USA, 2007, p. 283, DOI:10.1002/9780470141571.ch4.
- D. Cabrera, A. Coene, J. Leliaert, E. J. Artés-Ibáñez, L. Dupré, N. D. Telling and F. J. Teran, ACS Nano, 2018, 12, 2741, DOI:10.1021/acsnano.7b08995.
- F. Burrows, C. Parker, R. F. L. Evans, Y. Hancock, O. Hovorka and R. W. Chantrell, J. Phys. D: Appl. Phys., 2010, 43, 474010, DOI:10.1088/0022-3727/43/47/474010.
- C. Binns, M. J. Maher, Q. A. Pankhurst, D. Kechrakos and K. N. Trohidou, Phys. Rev. B: Condens. Matter Mater. Phys., 2002, 66, 184413, DOI:10.1103/PhysRevB.66.184413.
- S. Bedanta and W. Kleemann, J. Phys. D: Appl. Phys., 2009, 42, 013001, DOI:10.1088/0022-3727/42/1/013001.
- E. H. Sánchez, M. Vasilakaki, S. S. Lee, P. S. Normile, G. Muscas, M. Murgia, M. S. Andersson, G. Singh, R. Mathieu, P. Nordblad, P. C. Ricci, D. Peddis, K. N. Trohidou, J. Nogués and J. A. De Toro, Chem. Mater., 2020, 32, 969, DOI:10.1021/acs.chemmater.9b03268.
- L. Del Bianco, F. Spizzo, G. Barucca, G. Marangoni and P. Sgarbossa, Materials, 2019, 12, 3958, DOI:10.3390/ma12233958.
- P. De La Presa, Y. Luengo, V. Velasco, M. P. Morales, M. Iglesias, S. Veintemillas-Verdaguer, P. Crespo and A. Hernando, J. Phys. Chem. C, 2015, 119, 11022, DOI:10.1021/jp5115515.
- B. Mehdaoui, R. P. Tan, A. Meffre, J. Carrey, S. Lachaize, B. Chaudret and M. Respaud, Phys. Rev. B: Condens. Matter Mater. Phys., 2013, 87, 174419, DOI:10.1103/PhysRevB.87.174419.
- G. Salas, J. Camarero, D. Cabrera, H. Takacs, M. Varela, R. Ludwig, H. Dähring, I. Hilger, R. Miranda, M. D. P. Morales and F. J. Teran, J. Phys. Chem. C, 2014, 118, 19985, DOI:10.1021/jp5041234.
- U. M. Engelmann, E. M. Buhl, S. Draack, T. Viereck, F. Ludwig, T. Schmitz-Rode and I. Slabu, IEEE Magn. Lett., 2018, 9, 1, DOI:10.1109/LMAG.2018.2879034.
- P. B. Balakrishnan, N. Silvestri, T. Fernandez-Cabada, F. Marinaro, S. Fernandes, S. Fiorito, M. Miscuglio, D. Serantes, S. Ruta, K. Livesey, O. Hovorka, R. Chantrell and T. Pellegrino, Adv. Mater., 2020, 32, 2003712, DOI:10.1002/adma.202003712.
- J. G. Ovejero, D. Cabrera, J. Carrey, T. Valdivielso, G. Salas and F. J. Teran, Phys. Chem. Chem. Phys., 2016, 18, 10954, 10.1039/c6cp00468g.
- F. Arteaga-Cardona, K. Rojas-Rojas, R. Costo, M. A. Mendez-Rojas, A. Hernando and P. De La Presa, J. Alloys Compd., 2016, 663, 636, DOI:10.1016/j.jallcom.2015.10.285.
- M. Zrínyi, L. Barsi and A. Büki, Polym. Gels Networks, 1997, 5, 415, DOI:10.1016/S0966-7822(97)00010-5.
- F. Xu, F. Inci, O. Mullick, U. A. Gurkan, Y. Sung, D. Kavaz, B. Li, E. B. Denkbas and U. Demirci, ACS Nano, 2012, 6, 6640, DOI:10.1021/nn300902w.
- A. G. Roca, L. Gutiérrez, H. Gavilán, M. E. Fortes Brollo, S. Veintemillas-Verdaguer and M. del P. Morales, Adv. Drug Delivery Rev., 2019, 138, 68, DOI:10.1016/j.addr.2018.12.008.
- L. Qiao, Z. Fu, J. Li, J. Ghosen, M. Zeng, J. Stebbins, P. N. Prasad and M. T. Swihart, ACS Nano, 2017, 11, 6370, DOI:10.1021/acsnano.7b02752.
- K. Zhu, Y. Ju, J. Xu, Z. Yang, S. Gao and Y. Hou, Acc. Chem. Res., 2018, 51, 404–413, DOI:10.1021/acs.accounts.7b00407.
- R. Pozas, M. Ocaña, M. P. Morales and C. J. Serna, J. Colloid Interface Sci., 2002, 254, 87, DOI:10.1006/jcis.2002.8568.
- Y. Kobayashi, H. Katakami, E. Mine, D. Nagao, M. Konno and L. M. Liz-Marzán, J. Colloid Interface Sci., 2005, 283, 392, DOI:10.1016/j.jcis.2004.08.184.
- P. J. Vikesland, R. L. Rebodos, J. Y. Bottero, J. Rose and A. Masion, Environ. Sci.: Nano, 2016, 3, 567, 10.1039/c5en00155b.
- G. V. Samsonov, The Oxide Handbook, Springer US, Boston, MA, 1973, DOI:10.1007/978-1-4615-9597-7.
- J. M. D. Coey, Phys. Rev. Lett., 1971, 27, 1140, DOI:10.1103/PhysRevLett.27.1140.
- M. P. Morales, C. J. Serna, F. Bødker and S. Mørup, J. Phys.: Condens. Matter, 1997, 9, 5461, DOI:10.1088/0953-8984/9/25/013.
- M. Coduri, P. Masala, L. Del Bianco, F. Spizzo, D. Ceresoli, C. Castellano, S. Cappelli, C. Oliva, S. Checchia, M. Allieta, D. V. Szabo, S. Schlabach, M. Hagelstein, C. Ferrero and M. Scavini, Nanomaterials, 2020, 10, 867, DOI:10.3390/nano10050867.
- L. Del Bianco, D. Fiorani, A. M. Testa, E. Bonetti, L. Savini and S. Signoretti, Phys. Rev. B: Condens. Matter Mater. Phys., 2002, 66, 174418, DOI:10.1103/PhysRevB.66.174418.
- J. Carrey, B. Mehdaoui and M. Respaud, J. Appl. Phys., 2011, 109, 083921, DOI:10.1063/1.3551582.
- M. Blanco-Mantecón and K. O'Grady, J. Magn. Magn. Mater., 2006, 296, 124, DOI:10.1016/j.jmmm.2004.11.580.
- E. J. W. Verwey and P. W. Haayman, Physica, 1941, 8, 979, DOI:10.1016/S0031-8914(41)80005-6.
- G. F. Goya, T. S. Berquó, F. C. Fonseca and M. P. Morales, J. Appl. Phys., 2003, 94, 3520, DOI:10.1063/1.1599959.
- A. Mitra, J. Mohapatra, S. S. Meena, C. V. Tomy and M. Aslam, J. Phys. Chem. C, 2014, 118, 19356, DOI:10.1021/jp501652e.
- P. Mathieu, Y. Coppel, M. Respaud, Q. T. Nguyen, S. Boutry, S. Laurent, D. Stanicki, C. Henoumont, F. Novio, J. Lorenzo, D. Montpeyó and C. Amiens, Molecules, 2019, 24, 4629, DOI:10.3390/molecules24244629.
- L. Del Bianco, I. G. Lesci, G. Fracasso, G. Barucca, F. Spizzo, M. Tamisari, R. Scotti and L. Ciocca, Mater. Res. Express, 2015, 2, 065002, DOI:10.1088/2053-1591/2/6/065002.
- M. Fearon, R. W. Chantrell and E. P. Wohlfarth, J. Magn. Magn. Mater., 1990, 86, 197, DOI:10.1016/0304-8853(90)90121-6.
- L. Del Bianco, F. Spizzo, P. Sgarbossa, E. Sieni, G. Barucca, M. R. Ruggiero and S. Geninatti Crich, J. Phys. Chem. C, 2019, 123, 30007, DOI:10.1021/acs.jpcc.9b09146.
- P. E. Kelly, K. O'Grady, P. L. Mayo and R. W. Chantrell, IEEE Trans. Magn., 1989, 25, 3881, DOI:10.1109/20.42466.
- J. García-Otero, M. Porto and J. Rivas, J. Appl. Phys., 2000, 87, 7376, DOI:10.1063/1.372996.
- L. Del Bianco, F. Spizzo, T. Li, R. Adhikari and A. Bonanni, Phys. Chem. Chem. Phys., 2018, 20, 25411, 10.1039/C8CP04475A.
- R. Aquino, J. Depeyrot, M. H. Sousa, F. A. Tourinho, E. Dubois and R. Perzynski, Phys. Rev. B: Condens. Matter Mater. Phys., 2005, 72, 184435, DOI:10.1103/PhysRevB.72.184435.
- B. Martínez, X. Obradors, L. Balcells, A. Rouanet and C. Monty, Phys. Rev. Lett., 1998, 80, 181, DOI:10.1103/PhysRevLett.80.181.
- R. Hergt and S. Dutz, J. Magn. Magn. Mater., 2007, 311, 187, DOI:10.1016/j.jmmm.2006.10.1156.
- I. Andreu and E. Natividad, Int. J. Hyperthermia, 2013, 29, 739, DOI:10.3109/02656736.2013.826825.
- L. Gutiérrez, L. De La Cueva, M. Moros, E. Mazarío, S. De Bernardo, J. M. De La Fuente, M. P. Morales and G. Salas, Nanotechnology, 2019, 30, 112001, DOI:10.1088/1361-6528/aafbff.
- I. Morales, R. Costo, N. Mille, G. da Silva, J. Carrey, A. Hernando and P. de la Presa, Nanomaterials, 2018, 8, 970, DOI:10.3390/nano8120970.
- P. Allia, M. Coisson, P. Tiberto, F. Vinai, M. Knobel, M. A. Novak and W. C. Nunes, Phys. Rev. B: Condens. Matter Mater. Phys., 2001, 64, 1444201, DOI:10.1103/PhysRevB.64.144420.
- S. L. Tripp, R. E. Dunin-Borkowski and A. Wei, Angew. Chem., Int. Ed., 2003, 42, 5591, DOI:10.1002/anie.200352825.
- M. Coïsson, G. Barrera, F. Celegato, L. Martino, S. N. Kane, S. Raghuvanshi, F. Vinai and P. Tiberto, Biochim. Biophys. Acta, Gen. Subj., 2017, 1861, 1545, DOI:10.1016/j.bbagen.2016.12.006.
- E. Natividad, M. Castro and A. Mediano, Appl. Phys. Lett., 2008, 92, 093116, DOI:10.1063/1.2891084.
- P. C. Ke, S. Lin, W. J. Parak, T. P. Davis and F. Caruso, ACS Nano, 2017, 11, 11773–11776, DOI:10.1021/acsnano.7b08008.
- S. P. Schwaminger, S. A. Blank-Shim, I. Scheifele, V. Pipich, P. Fraga-García and S. Berensmeier, Biotechnol. J., 2019, 14, 1800055, DOI:10.1002/biot.201800055.
Footnote |
| † Electronic supplementary information (ESI) available. See DOI: 10.1039/d0nr09121a |
| This journal is © The Royal Society of Chemistry 2021 |