
 Open Access Article
 This Open Access Article is licensed under a
 Creative Commons Attribution 3.0 Unported Licence
Debye vs. Casimir: controlling the structure of charged nanoparticles deposited on a substrate†
Oleg A.
Vasilyev
 ab,
Emanuele
Marino
cd,
Bas B.
Kluft
d,
Peter
Schall
*d and
Svyatoslav
Kondrat
*abe
ab,
Emanuele
Marino
cd,
Bas B.
Kluft
d,
Peter
Schall
*d and
Svyatoslav
Kondrat
*abe
aMax-Planck-Institut für Intelligente Systeme, Heisenbergstraße 3, D-70569 Stuttgart, Germany. E-mail: svyatoslav.kondrat@gmail.com; skondrat@ichf.edu.pl
bIV. Institut für Theoretische Physik, Universität Stuttgart, Pfaffenwaldring 57, D-70569 Stuttgart, Germany
cDepartment of Chemistry, University of Pennsylvania, Philadelphia, Pennsylvania 19104, USA
dVan der Waals-Zeeman Institute, University of Amsterdam, Amsterdam, Netherlands. E-mail: p.schall@uva.nl
eInstitute of Physical Chemistry, Polish Academy of Sciences, Kasprzaka 44/52, 01-224 Warsaw, Poland
First published on 10th March 2021
Abstract
Fine-tuning the interactions between particles can allow one to steer their collective behaviour and structure. A convenient way to achieve this is to use solvent criticality to control attraction, via critical Casimir forces, and to control repulsion via the Debye screening of electrostatic interactions. Herein, we develop a multiscale simulation framework and a method for controlled deposition of quantum dots to investigate how these interactions affect the structure of charged nanoparticles deposited on a substrate, altogether immersed in a binary liquid mixture intermixed with salt. We consider nanoparticles and substrates favouring the same component of the mixture and find that the critical Casimir interactions between the nanoparticles become drastically reduced at the substrate. In particular, the interactions can become a few kBT weaker and their decay length a few orders of magnitude smaller than in the bulk. At off-critical compositions, the decay length increases upon approaching criticality, as expected, but the interaction strength decreases. With molecular dynamics simulations and experiments, we reveal that the nanoparticles can self-assemble into crystalline clusters which form superstructures resembling cluster fluids and spinodal morphology. The simulations additionally predict the formation of fractal-like nanoparticle gels and bicontinuous phases. Our results demonstrate that charged nanoparticles in a salty binary liquid mixture provide exciting opportunities to study the formation of complex structures experimentally and theoretically, which may lead to applications in optoelectronics and photonics.
Introduction
The ability to tune the interactions between particles provides a means to control their collective behaviour and structure. Perhaps the simplest way to tune the range and the strength of interactions between charged particles is to vary the concentration of ions in solution. In the case of identical particles, the interactions are repulsive and decay exponentially with the Debye screening length, which is proportional to inverse of the square root of the ion concentration. The Debye length can be well-controlled in the range from a nanometre to a hundred of nanometres,1 corresponding to the ion concentration ranging from about 1 M to 1 μM, respectively, for water–2,6-lutidine mixture at room temperature.Another way to control interactions among particles is through immersion in a near-critical fluid. A distinct feature of such a fluid is the emergence of long-range forces acting among the immersed particles or substrates.2–13 These forces are called critical Casimir forces, in analogy with the Casimir forces due to quantum fluctuations,14 as they arise due to fluctuations of the order parameter associated with the solvent criticality;15 for a binary liquid mixture, for instance, such an order parameter is the difference in the concentrations of the two components. Critical Casimir forces are attractive for identical particles, and their range and strength can be tuned by changing the composition of the fluid or by varying temperature.13
Frequently, colloidal particles with sizes ranging from hundreds of nanometres to a few micrometres are used to probe the interactions mediated by critical fluids.3,6,16–18 Such micrometer-sized colloids can be observed and studied in real-time using confocal laser scanning optical microscopy, which is inapplicable to colloids smaller than the diffraction limit. However, fine temperature control of the order of few milli Kelvins is needed to reach correlation lengths ξ comparable to the particle size, in order for the critical Casimir interactions among the colloids to become significantly strong. The maximum achievable ξ reported so far is about 200 nm (see, e.g., ref. 19) so that the colloid–colloid interactions extend to about one colloidal radius at most.
Using nano-sized particles effectively extends the range of critical Casimir interactions up to a few particle radii, while simultaneously requiring a coarser tuning of the temperature to control the interaction strength and range. So far the experimental and theoretical work on nanoparticles in critical media has been focused on their bulk behaviour.20–25 For instance, Hopkins et al. used classical density functional theory to calculate the effective potential between nanoparticles dispersed in a binary liquid mixture,20 and El Fassi et al. calculated the critical Casimir force between nanoparticles immersed in a crosslinked polymer blend.21 Lu et al. studied glass transitions in a suspension of silica nanoparticles in a water–lutidine mixture near its consolute point,22 while Marino et al. used the critical Casimir forces to assemble and control quantum dot superstructures.23,24
Herein, we study how the combination of electrostatic repulsion, via Debye screening, and critical Casimir attraction determines the structure of charged nanoparticles depositing on a substrate. We consider substrates and nanoparticles with the same preference for the fluid phase or component of a binary liquid mixture (e.g., hydrophilic nanoparticles on hydrophilic substrates) and investigate how nanoparticles structure depends on various parameters, such as the composition of a mixture, temperature and salt concentration. To this end, we develop a multiscale simulation framework. We first employ Monte Carlo simulations of the Ising model, which mimics a binary liquid mixture or a simple fluid close to criticality, to obtain an effective critical Casimir potential between the deposited nanoparticles. We then use this potential in molecular dynamics simulations to study their collective behaviour. To compare the simulated structures to experiment, we develop a novel method to drive the deposition of quantum dots on silicon substrates that does not rely on DNA functionalisation26 or nanoscale patterning.27 The deposited superstructures reproduce the main features of the simulations well, demonstrating a novel pathway to quantum dot epitaxy through critical Casimir forces.
Interaction of nanoparticles at a substrate
Binary liquid mixture, Ising model and thermodynamic paths
Our goal in this article is to understand the behaviour of nanoparticles at a substrate, as shown in Fig. 1a, driven by the interplay between the Debye-screened electrostatic repulsion and critical Casimir attraction. The latter emerges in solvents such as binary liquid mixtures in the vicinity of their critical points. A computationally feasible and reliable method to study such interactions is to employ the Ising model (eqn (6) in Methods), which belongs to the same universality class as a binary liquid mixture.28 Magnetization m in the Ising model corresponds to concentration c of a binary mixture and bulk field h to the difference of the chemical potentials Δμ of the two species of the mixture (for the details of this correspondence, see ref. 29–31). Schematic phase diagrams of the two systems are drawn in Fig. 1b and c.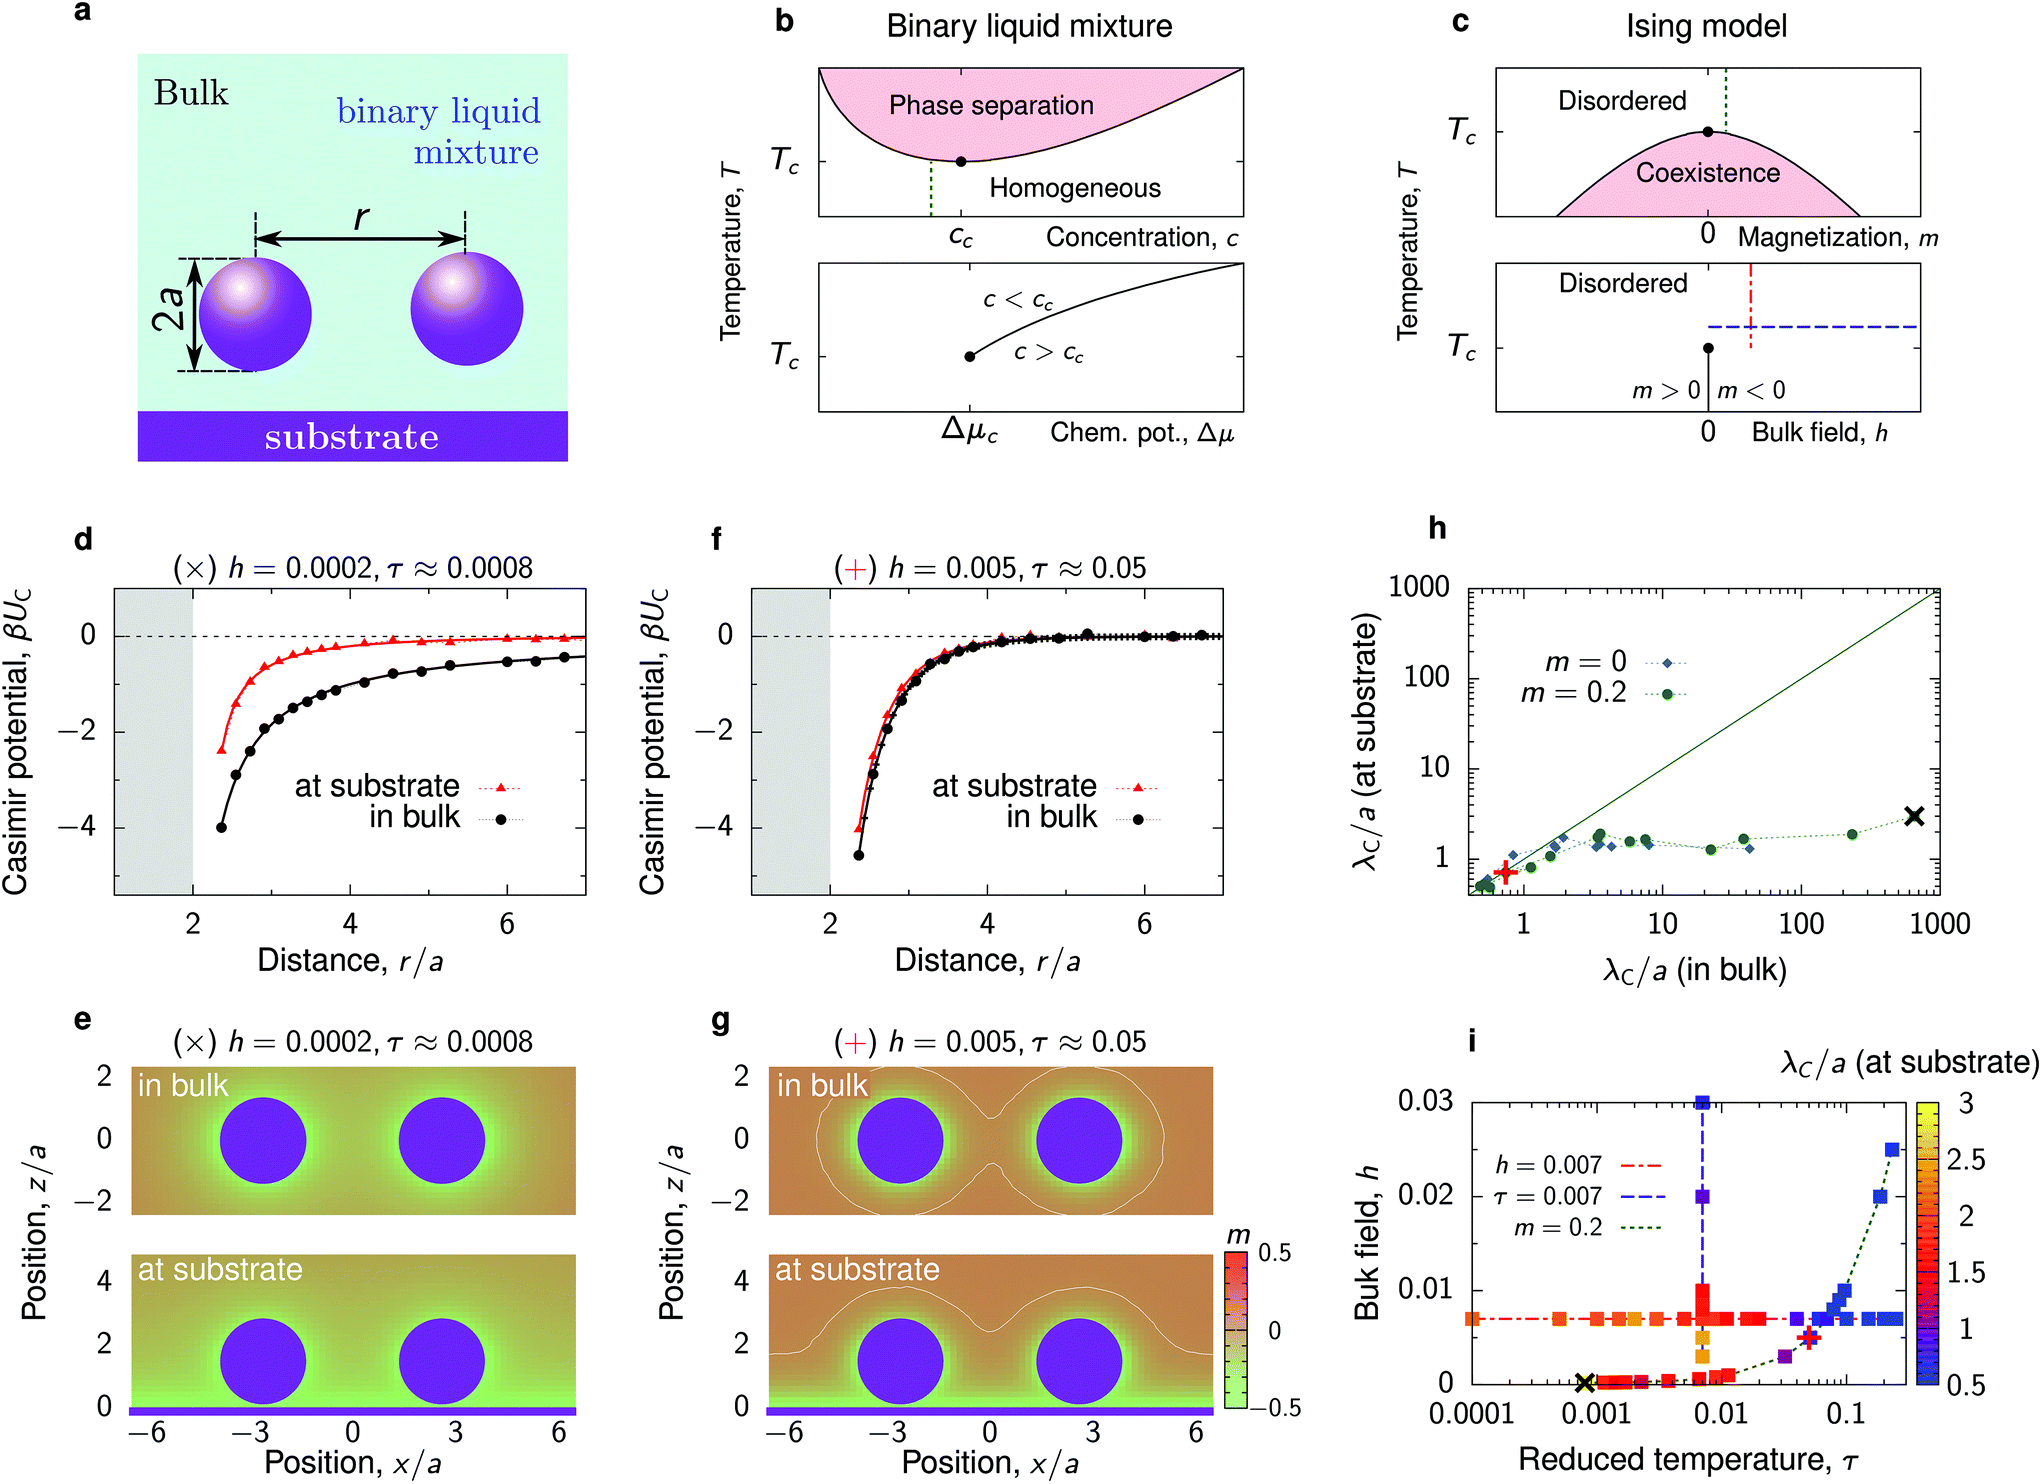 | ||
| Fig. 1 Critical Casimir interactions between nanoparticles. (a) Schematics of two nanoparticles at a substrate immersed in a binary liquid mixture. The nanoparticles and the substrate favour the same component of the mixture. (b and c) Schematic bulk phase diagrams of a binary liquid mixture, around its lower critical point, and of the Ising model (eqn (6) in Methods), which models the binary mixture close to criticality. Concentration of the binary mixture corresponds to magnetization in the Ising model and the difference in the chemical potentials of the two components of the mixture to bulk field h. The thin vertical and horizontal lines show the paths used in our experiments (b) and simulations (c). (d) Critical Casimir potential for two nanoparticles in bulk and at the substrate obtained by Monte Carlo (MC) simulations of the Ising model for the values of bulk field h and reduced temperature τ = (T − Tc)/Tc indicated on the plot. The shaded area shows the region of steric exclusion. Both particles are located at z/a ≈ 1.45 above the substrate (unless they are in bulk). (e) Magnetization heat maps from the MC simulations. Nanoparticle separation r/a ≈ 4.91. (f and g) The same as (d and e) but for h and τ further away from the criticality along the path of constant magnetization (m = 0.2, cf. panel (i)). The white lines mark zero magnetization. (h) Decay length λC of the critical Casimir potential for two nanoparticles at the substrate as a function of λC in bulk along the paths of constant magnetization m = 0.2 and m = 0 (critical composition). (i) Thermodynamic paths defined by constant reduced temperature τ, constant bulk field h, and constant bulk magnetisation m. The colored symbols show the values of the decay length λC of the critical Casimir potential for two nanoparticles at the substrate. Symbols + and × in (h) and (i) show the values of τ and h used in (d–g). | ||
In experiments with binary liquid mixtures, one typically keeps the concentration fixed and varies the temperature, as denoted schematically by a thin vertical line in Fig. 1b. In simulations of the Ising model, however, it is more convenient to vary either the bulk field or temperature, while keeping one of these variables constant (the lower plot in Fig. 1c). This has been done in virtually all theoretical and simulation studies on critical Casimir forces10–13,32–34 (see, however, ref. 35 and 36 where such forces were computed in the canonical ensemble). In this work, in order to mimic our experimental system as closely as possible, we chose to follow the path of constant bulk magnetization, which corresponds to constant concentration of a binary liquid mixture. To this end, we first performed Monte Carlo (MC) simulations of the Ising model in bulk and determined the bulk magnetization m for various values of the bulk field h and reduced temperature τ = (T − Tc)/Tc, where Tc is the critical temperature. We then selected the (h, τ) pairs that provide the same bulk magnetization (Fig. S1 and Table S1†) and performed MC simulations for two nanoparticles at a substrate and in bulk for these values of h and τ. In addition to these simulations, for comparison we also carried out simulations along the conventional paths of constant h and τ.
Critical Casimir interactions
Our MC simulations reveal that the presence of substrate can significantly modify the critical Casimir interactions between nanoparticles. Fig. 1d compares the interaction potentials between two identical particles in bulk and at a substrate, where the substrate favours the same fluid component as the particles, for the parameters close to the critical point. At the substrate, both the depth and the extent of interactions are significantly reduced. This is because the substrate promotes an environment (i.e., attracts a fluid component) preferred by the particles (Fig. 1e), which reduces the deformations of the magnetization (or concentration) profile between the particles and consequently the strength of the interaction.The effect of substrate becomes less pronounced as one moves away from the critical point, that is, upon increasing h and τ (Fig. 1f). In the considered case, the bulk field in the Ising model favours magnetization opposite in sign to what is preferred by the nanoparticles. This leads to the formation of a capillary-like bridge connecting the two particles (Fig. 1g) and correspondingly strong but short-range forces.34,37,38 Since the bridge formation is similar at the substrate and in bulk, the interaction potential changes little when the particles are brought to the substrate.
To quantify the reduction of the critical Casimir interactions by substrate, we extracted the decay lengths λC of the critical Casimir potentials by fitting the MC data to an exponentially decaying function of separation
 | (1) |
Fig. 1h shows that the substrate reduces the decay length λC by a few orders of magnitude in the region where λC in bulk is extremely large (>10a), but it remains practically unaltered in the region where λC ≲ a. The Casimir decay length λC (for particles at the substrate) is shown as a heat-map in Fig. 1i along three different paths. Although reduced as compared to the bulk value, λC is still large close to the critical point (τ = 0, h = 0) but decreases as τ or h increases. For constant bulk field, the decay length varies little with τ and decreases significantly only sufficiently far from τ = 0.
Interplay of the Debye-screened repulsion and critical Casimir attraction
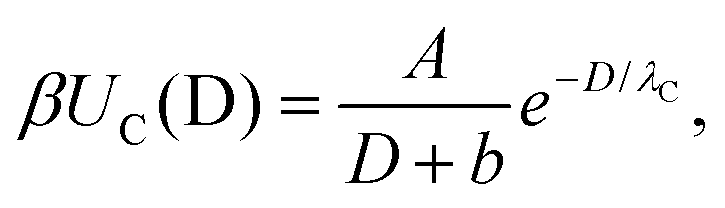
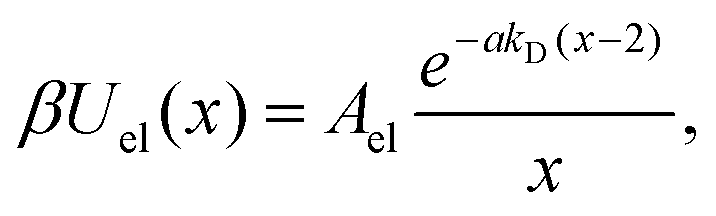
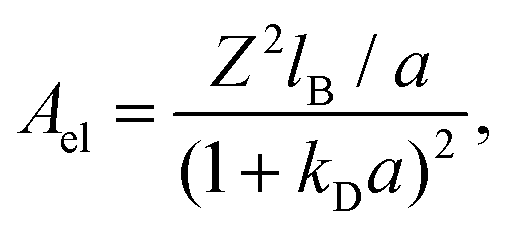
The total interaction potential between the deposited, charged nanoparticles consists of the above-discussed critical Casimir attraction and electrostatic and Lennard-Jones interactions. However, we consider nanoparticles with the dielectric constant close to the solvent's dielectric constant, implying small or vanishing van der Waals (dispersion) forces. This assumption is consistent with our experiments, where the relative dielectric constant of nanoparticles (quantum dots) ε ≈ 5–6.25,40,41 while ε ≈ 7 for the critical water–lutidine mixture.42 For non-vanishing dispersion forces, the electrostatic repulsion (see below) will have to be re-adjusted to compensate partially for the der Waals attraction. We note that both van der Waals and electrostatic interactions change very little with temperature in the range of temperatures considered (20 °C to 33 °C),43,44 compared to drastic changes of the critical Casimir interactions.45 Thus, the system behaviour can be steered by the interplay between the Debye-screened repulsion, through varying salt concentration, and critical Casimir attraction, via fine temperature control.In this work, therefore, we neglect dispersion interactions and combine the computed critical Casimir potentials with the Debye-screened electrostatic potential, taken in the DLVO form, and short-ranged Lennard-Jones repulsive potential (eqn (4) and (3) in Methods). Fig. 2a demonstrates how this combination creates a minimum (−Edepth) and an energy barrier (Emax) in the total interaction potential. We calculated Edepth and Emax along the thermodynamic paths used in our MC simulations (Fig. 1i) at different values of the Debye screening length λD as well as for varying λD at fixed values of bulk field h and reduced temperature τ. This is shown in Fig. 2b and c in the plane of λD and the extracted decay length λC of the critical Casimir potential at the substrate.
 | ||
| Fig. 2 Interactions between nanoparticles at substrate. (a) Example of the critical Casimir, electrostatic and total interaction potentials between two identical nanoparticles at a substrate immersed in a near-critical fluid. The substrate and the particles favour the same fluid component. (b) Diagram showing the parameter space of the Debye screening length λD and the decay length of the Casimir interactions, λC. The colored symbols show the values of the depth of the total interaction potential. (c) The same as (b) but showing the energy barrier of the total interaction potential. The diagrams are built along the thermodynamic paths indicated in Fig. 1i. The × symbols in (b and c) denote the values of λD and λC corresponding to panel (a). The nanoparticle structures for the paths of constant λD/a = 1 and constant λC/a = 2.5 (bulk magnetization m = 0.2) are shown in Fig. 3 and 4 as denoted on panels (b) and (c). The paths of constant bulk field h = 0.007 and reduced temperature τ = 0.007 (at fixed Debye lengths) are shown in Fig. S4 and S5.† | ||
Perhaps surprisingly, the depth of the potential decreases with increasing λC, that is, the interactions become weaker upon approaching criticality (Fig. 2b). This is in contrast to the behaviour at the critical composition in bulk, where both the potential depth and the extent of interactions increase upon approaching the critical temperature.6,13 The substrate screens the interactions in the immediate vicinity of criticality, reducing the potential depth significantly. The increase of Edepth with moving away from the criticality can be attributed to the formation of capillary bridges34,37,38 (Fig. 1g). We note that we observe a similar behaviour at off-critical compositions also in bulk, but its magnitude is less pronounced (Fig. S2†).
A large Debye screening length λD can lead to the appearance of an energy barrier Emax and hence to the repulsive tail in the total interaction potential (Fig. 2a and c). Such potentials, called SALR (short-range attraction, long-range repulsion) or mermaid potentials,46 have attracted much attention recently, as they can give rise to a variety of complex structures and mesophases.46–50 We will see that the emergence of such repulsive tails in our potentials can influence the nanoparticle behaviour in a nontrivial way.
Collective behaviour of nanoparticles at the substrate
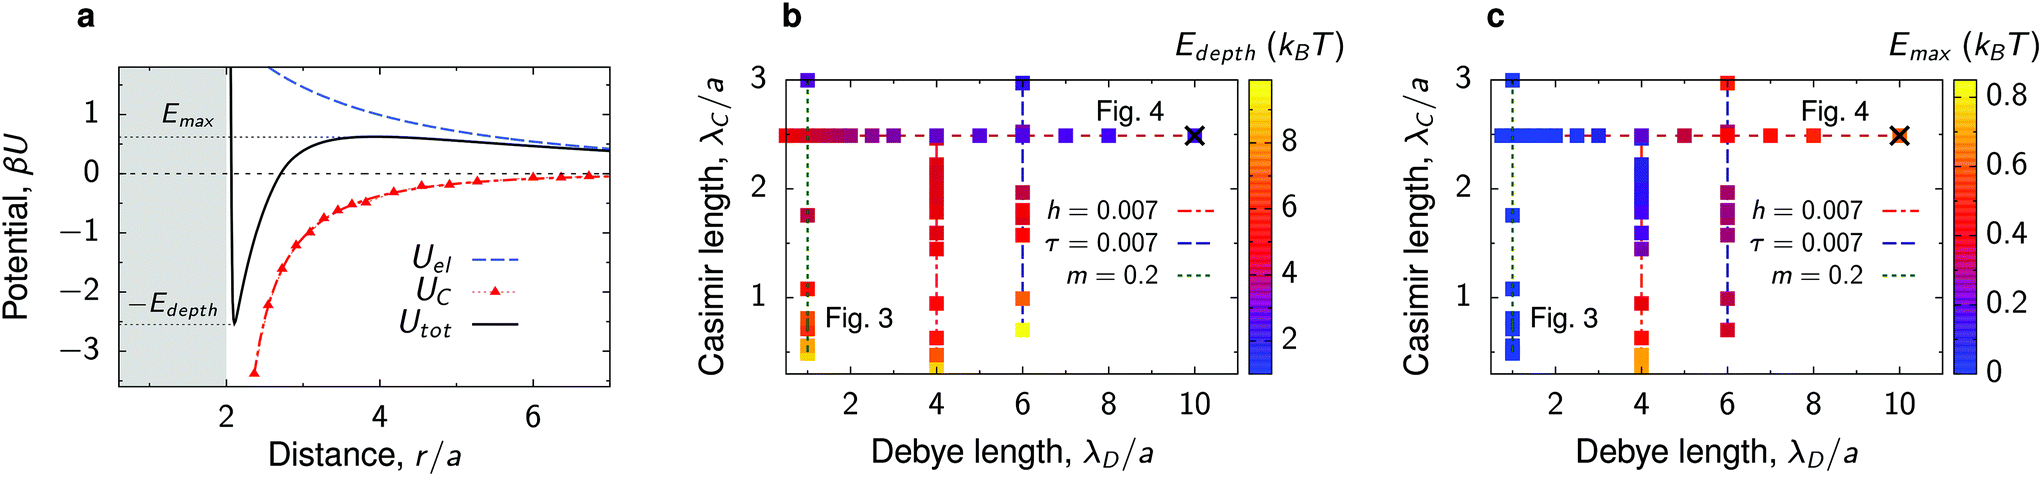
To investigate the collective behaviour of nanoparticles at the substrate, we performed 2D molecular dynamics (MD) simulations using the total interaction potentials discussed above. To characterize the obtained structures, we calculated radial distribution functions (RDFs), which describe how density varies as a function of distance from a reference particle. In addition, we computed distributions of clusters formed by the nanoparticles and the average cluster sizes. A nanoparticle was considered part of a cluster when the distance to at least one of the cluster's nanoparticles was smaller than 2.5 the particle radius. To gain insights into the structure within a cluster, we calculated the hexatic order parameter ψ6 for the nanoparticles belonging to this cluster, where ψ6 = 1 for the perfect hexagonal lattice (eqn (7) in Methods).Dependence on the decay length of the critical Casimir interactions
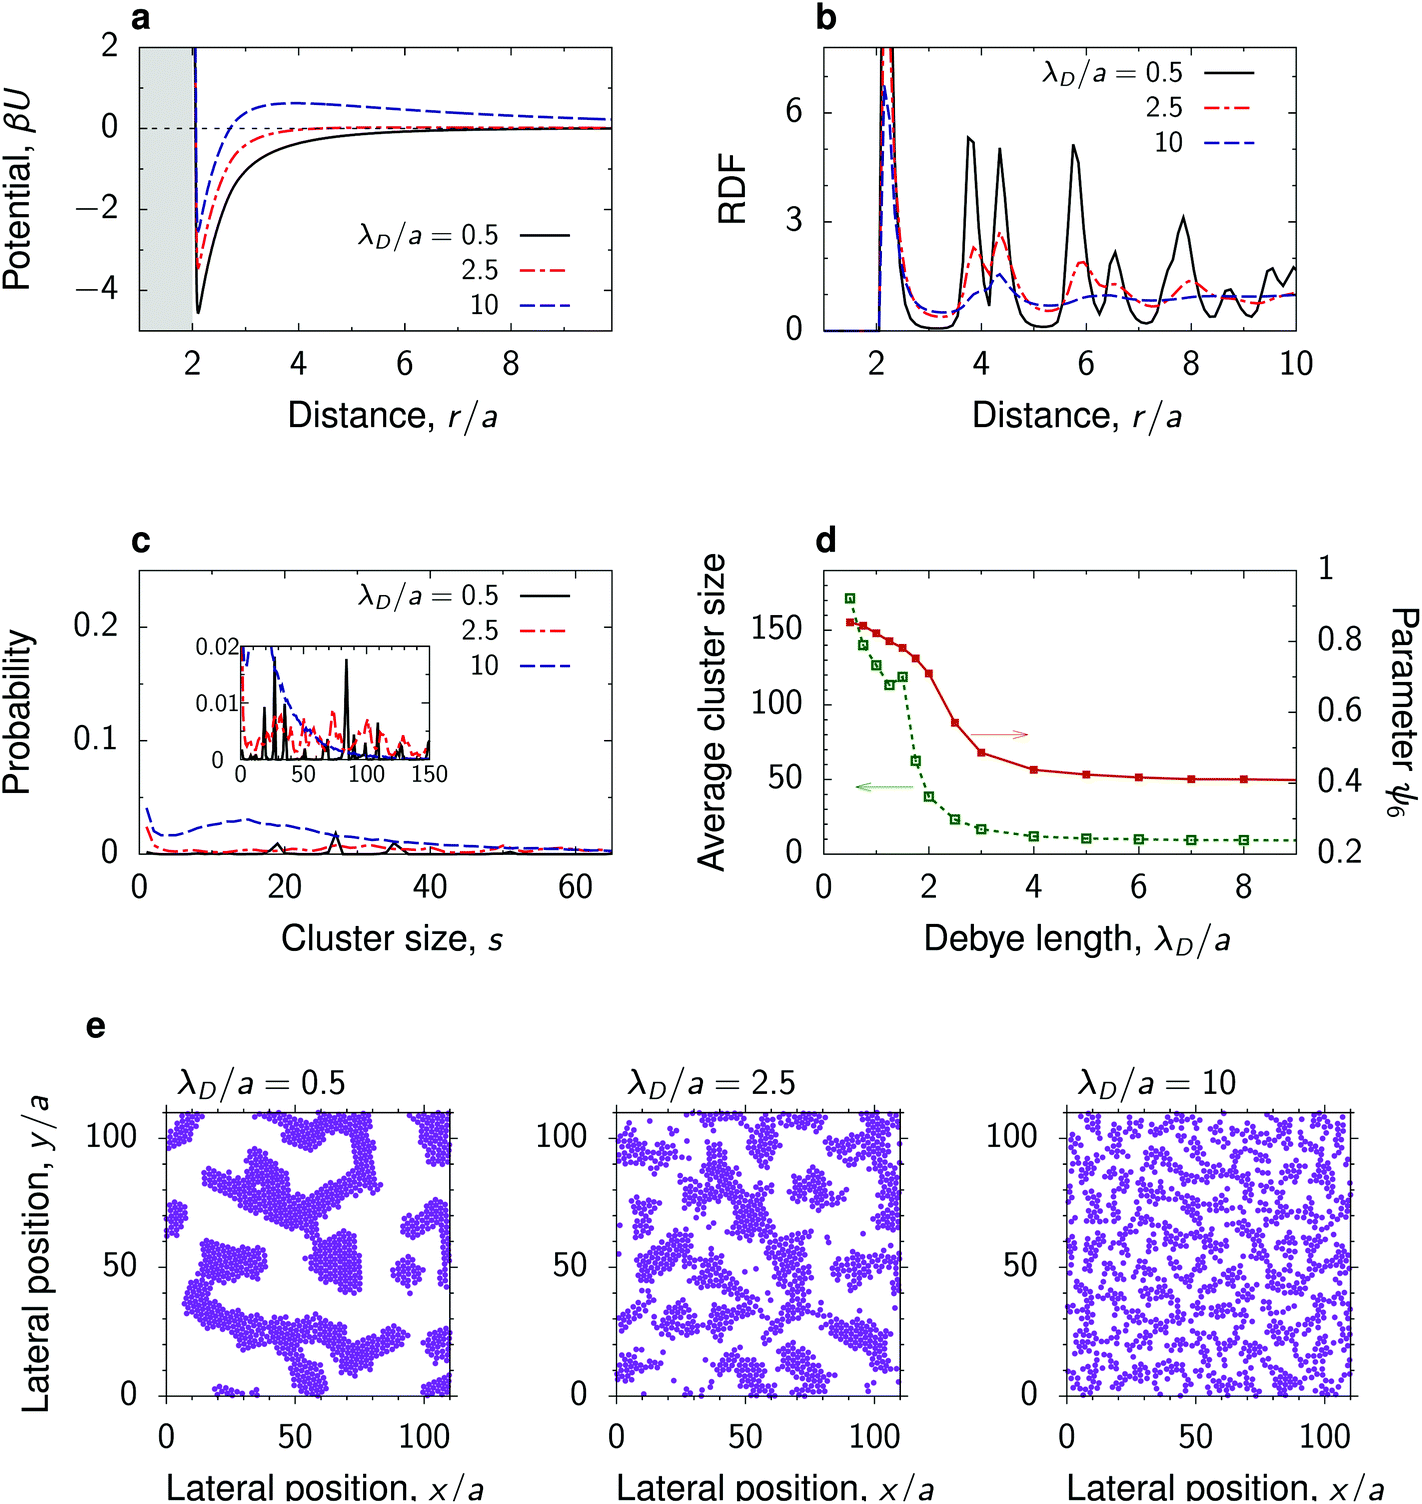
To study the dependence of the nanoparticle structure on the decay length λC of the critical Casimir interactions, we chose the thermodynamic path of constant (non-zero) magnetization in the Ising model, which corresponds to a constant (off-critical) concentration in a binary liquid mixture (Fig. 1). To single out the effect of λC, we took a low value of the Debye screening length, λD/a = 1, so that the long distance behaviour is mainly determined by the critical Casimir interactions.Fig. 3a shows that as the decay length λC decreases, the depth of the total interaction potential increases (see also Fig. 2a and b). For a small λC ≈ 0.53a, the potential depth reaches the value of about 8kBT. Such strong attraction leads to the formation of clusters of nanoparticles with almost perfect hexagonal ordering within the clusters. This is demonstrated by the short-distance behaviour of RDF and by the order parameter ψ6 ≈ 1 (Fig. 3b and d). Remarkably, the nanoparticle clusters form a structure redolent of colloidal gels, consisting of a network of fractal-like aggregates.51,52
 | ||
| Fig. 3 Effect of the decay length of the critical Casimir interactions. (a) Total interaction potential between nanoparticles at a substrate immersed in a near-critical fluid for three values of the decay length λC along the path of constant magnetization m = 0.2 (Fig. 1). The substrate has the same preference for the fluid phase as the nanoparticles. (b) Radial distribution functions (RDFs) and (c) cluster size distributions in systems with the interaction potentials from panel (a) obtained by 2D molecular dynamics (MD) simulations. (d) Average cluster size and hexatic parameter ψ6, eqn (7), as functions of λC. (e) Snapshots from the MD simulations, showing fractal-like, coarsened and spinodal-like structures (see also Video†). In all plots, the Debye screening length λD/a = 1 and surface packing fraction η = 0.3. See Fig. S3† for the case of bulk magnetization m = 0 corresponding to the critical composition. For the dependence on η see Fig. S6 and S7.† | ||
As the decay length λC increases, the clusters coarsen and the structure inside the clusters becomes more amorphous. This is manifested by the decreasing order parameter ψ6 and occurs because the depth of the potential decreases with increasing λC. The nanoparticles can thus detach from the clusters more easily, which leads to a decreasing average cluster size. For the largest decay length studied (λC ≈ 3a), the nanoparticles assemble into a structure reminiscent of the spinodal morphology. Similar coarsening of nanoparticle clusters with approaching criticality can be obtained at the critical composition (Fig. S3†) and along the thermodynamic paths of constant reduced temperature τ or constant bulk field h, provided the h and τ values are close to critical and the Debye screening length is sufficiently low (Fig. S4 and S5†).
Dependence on the Debye screening length
The strength and the range of electrostatic repulsion can be controlled by the Debye screening length λD through varying the salt concentration (eqn (4) in Methods). To study how the nanoparticle structure is affected by λD, we chose the parameters providing a large value of the decay length λC of the critical Casimir attraction, so that we could obtain a transformation between the potentials with attractive and repulsive tails.Fig. 4 shows that the total interaction potential and the structure change significantly upon varying λD. At a high salt concentration, implying a small λD, the repulsive electrostatic interactions are strongly screened, and the interaction between the nanoparticles is attractive at all separations (λD/a = 0.5 in Fig. 4a). This leads to the formation of coarsened structures, consisting of randomly arranged, partially connected clusters, within which the nanoparticles are hexagonally ordered. Again, the order is manifested by well-developed peaks in the RDF and by a high value of the hexatic order parameter (Fig. 4b and d). With increasing λD, i.e., with reducing the salt concentration, a small energy barrier develops in the interaction potential, which impedes the nanoparticles from coming close to each other. This breaks the hexagonal order and we observe the growth of spinodal-like structures, characterized by smaller cluster sizes and lower values of the hexatic order parameter (Fig. 4d and e). Upon further increase of λD, the nanoparticle clusters break and form a dispersed liquid-like structure without apparent long-ranged order. In this case, the RDF quickly decays to unity, and the hexatic order parameter and the average number of clusters decrease. The latter saturates at s ≈ 8 already for λD/a ≳ 3. Interestingly, the hexatic parameter saturates at ψ6 ≈ 0.4, which suggests that the particles tend to form local hexagonal order even in the dispersed state.
 | ||
| Fig. 4 Effect of the Debye screening length. (a) Total interaction potential between nanoparticles at a substrate in a near-critical fluid for a few values of the Debye screening length λD measured in units of the particle radius a. The substrate has the same preference for the fluid phase as the particles. (b) Radial distribution functions and (c) distribution of cluster sizes in the systems with the interaction potentials from panel (a) obtained by 2D molecular dynamics (MD) simulations. (d) Average cluster size and hexatic parameter ψ6, eqn (7), as functions of λD. (e) Snapshots from MD simulations, showing coarsened, spinodal-like and dispersed structures. In all plots the reduced temperature τ = 0.007 and the bulk field of the Ising model h = 0.003 (giving λC/a ≈ 2.5), and the surface packing fraction η = 0.3. For the dependence on η see Fig. S8–S10.† | ||
Effect of density
We have carried out MD simulations for various densities of the deposited nanoparticles for the parameters from Fig. 3 and 4. In most cases, we found that the density has a minor effect on the nanoparticles structure (Fig. S7–S10†). For increasing density, the average cluster size increases, as small clusters unite to form bigger structures, but the ordering inside the clusters does not change dramatically. Perhaps not very surprisingly, our simulations show that the most interesting behaviour is obtained in the case of mermaid potentials with sufficiently large potential depths and relatively low energy barriers. One such case is shown in Fig. 5 and discussed below.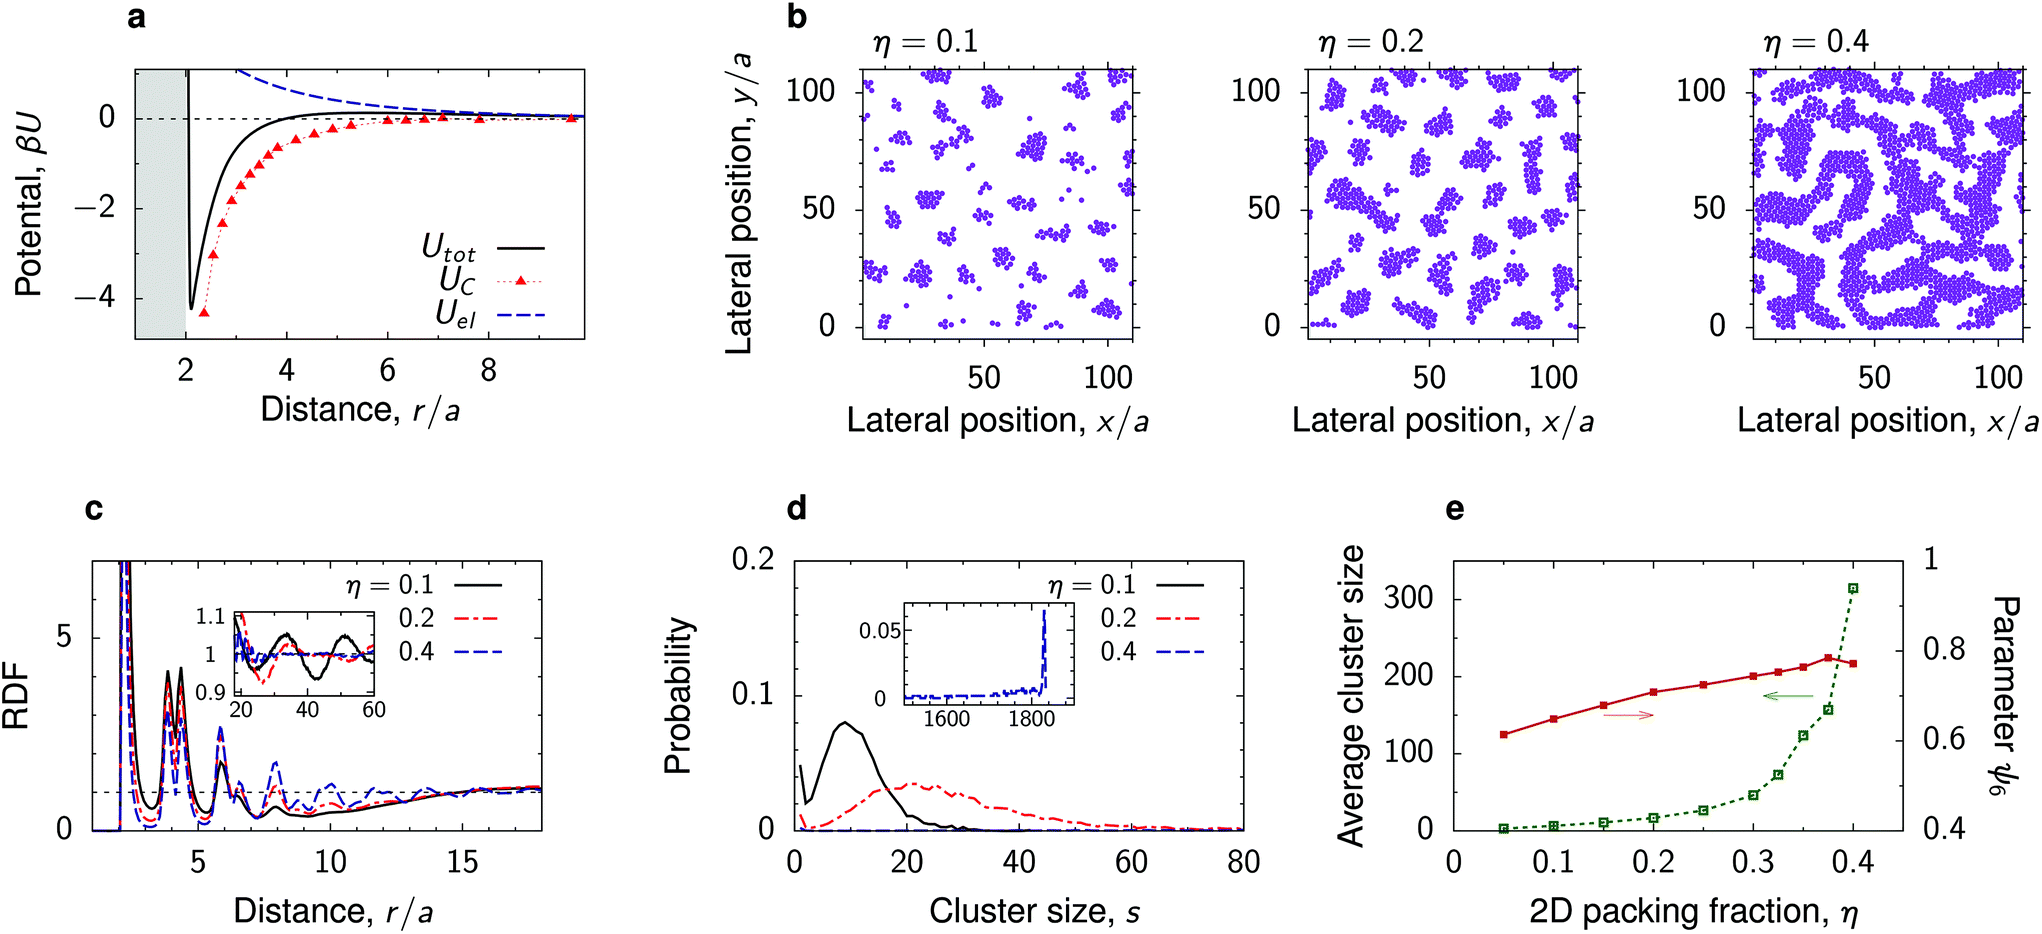 | ||
| Fig. 5 Effect of nanoparticle density. (a) Electrostatic, critical Casimir and the total interaction potential between two nanoparticles at a substrate in a near-critical fluid. The substrate and the particles prefer the same fluid component. (b) Snapshots from MD simulations for a few values of the two-dimensional packing fraction η = πNa2/A, where N is the number of particles, A the surface area and a the particle radius. (c) Radial distribution functions and (d) cluster size distributions for the same systems. The cluster size distributions are averages of 100 simulations. (e) Average cluster size and hexatic parameter ψ6, eqn (7), as functions of η. The reduced temperature τ = 0.007 and bulk field h = 0.007, giving λC/a ≈ 2, and the Debye screening length λD/a = 4. | ||
At a low surface area fraction (η = 0.1), the nanoparticles self-assemble into small polydisperse clusters that arrange themselves into a liquid-like structure with the tendency for ordering (Fig. 5b). This is manifested by long-ranged oscillations apparent in the RDF (the inset in Fig. 5c). However, we have not obtained any well-defined crystal structure of these clusters, likely due to their polydispersity (Fig. 5d). It is worth noting that similar cluster-fluid structures have been observed in experiments with quantum dots at a water–air interface.53
The cluster size distribution exhibits a peak that widens and moves toward larger s as η increases (Fig. 5d). Correspondingly, the average cluster size increases with increasing η and at a high density (η = 0.4) one eventually obtains a bicontinuous phase similar to microemulsions.54 This is apparent from the cluster size distribution, which shows a well defined peak at large s comprising nearly all particles in the simulation box (the inset in Fig. 5d).
Our simulations show that there are no significant changes in the structure within the clusters. This is reflected in the RDF, which exhibits only a slight increase of the first peaks as η increases (Fig. 5c). The hexatic parameter ψ6 also changes only moderately with η, showing that indeed the structure inside the clusters remains practically unaltered (Fig. 5e).
Percolated network of deposited nanoparticles
Sufficiently far from the critical point, where the decay length of the solvent-induced intersections is smaller than the particle radius, our simulations reveal the formation of fractal-like clusters that consist of thin but elongated aggregates of nanoparticles with nearly crystalline order inside the aggregates (Fig. 3 and Fig. S6†). At a high nanoparticle density, these aggregates merge and form structures reminiscent of colloidal gels or percolated networks. These structures appear for interaction potentials with deep attractive wells and none or very weak repulsive tails. Increasing the strength of repulsion, which can be done by increasing the Debye length, breaks the percolated network so that the deposited structure consist of separated, rather than inter-connected, but still elongated nanoparticle clusters (Fig. 6). Percolation can thus be induced by manipulating repulsion through varying the salt concentration.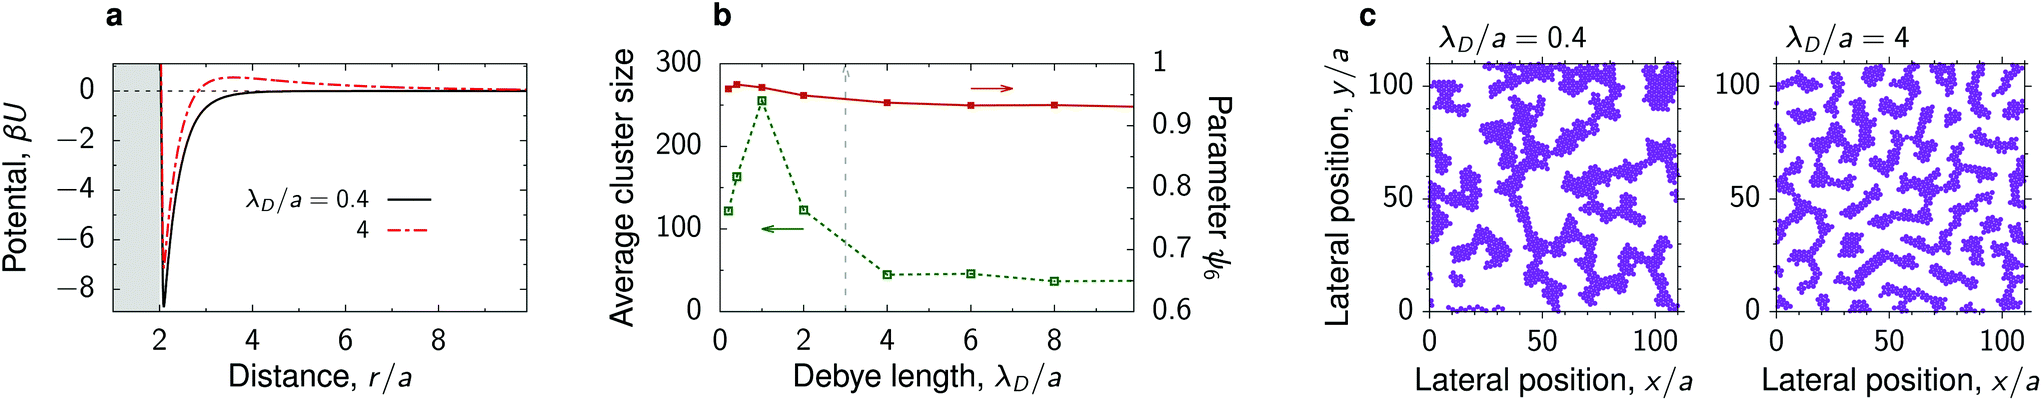 | ||
| Fig. 6 Percolated network of deposited nanoparticles. (a) Interaction potential between deposited nanoparticles in a near-critical fluid for two values of the Debye screening length λD. The substrate and the particles prefer the same fluid component. (b) Average cluster size and hexatic parameter ψ6, eqn (7), as functions of λD. The vertical dash line shows approximately the ‘percolation’ value of λD. (c) Snapshots from MD simulations for the potentials from panel (a). The reduced temperature τ = 0.1 and the bulk field h = 0.01 of the Ising model give the bulk magnetization m = 0.2 and the decay length of the critical Casimir interactions between the deposited nanoparticles λC/a ≈ 0.53. | ||
We note that such fractal-like nanoparticle gels are likely only kinetically stable in the sense that, if formed, they can persist for a long time but may eventually collapse into a single compact cluster.51,55 This is unlike cluster fluids or bicontinuous phases, which are thermodynamically stable.56,57 In our simulations, this difference can be seen in the dependence on the initial particle configuration. In the former case, starting from a densely packed, rather than a random configuration, leads to a single crystalline cluster (with defects); in the latter case the densely-packed aggregate breaks and the system evolves towards the structure consistent with the one obtained with the initially random configuration (Fig. S11†).
The possibility to control the formation of 2D particle networks and tune their percolation properties is exciting and may find applications in optoelectronic devices and sensors.58
Deposition of quantum dots on a silicon substrate
To test the predictions of our simulations, we performed experiments on deposition of quantum dots (QDs) driven by the interplay of the Debye-screened electrostatic repulsion and the critical Casimir attraction. The setup is shown in Fig. 7a. QDs were synthesized following the reported procedure.59 The native hydrophobic oleate ligands were replaced with hydrophilic 2,3-dimercapto-1-propanesulfonates (DMPS). The diameter of the QD was 2a = 5.5 nm ± 13% as measured from small-angle X-ray scattering. The QDs were dispersed in an off-critical (30 w/w%) water–2,6-lutidine mixture, which was placed in contact with a silicon substrate made hydrophilic by oxygen plasma treatment. The substrate was in contact with a thermostated steel block and heated to temperature T, such that ΔT = Tc − T > 0, where Tc is the critical temperature of the water–lutidine mixture. Keeping the bulk of the solvent at room temperature drives a vertical temperature gradient, making the surface of the substrate the only location for QD deposition by critical Casimir forces. After one hour the substrate was removed, dried, and imaged with scanning electron microscopy.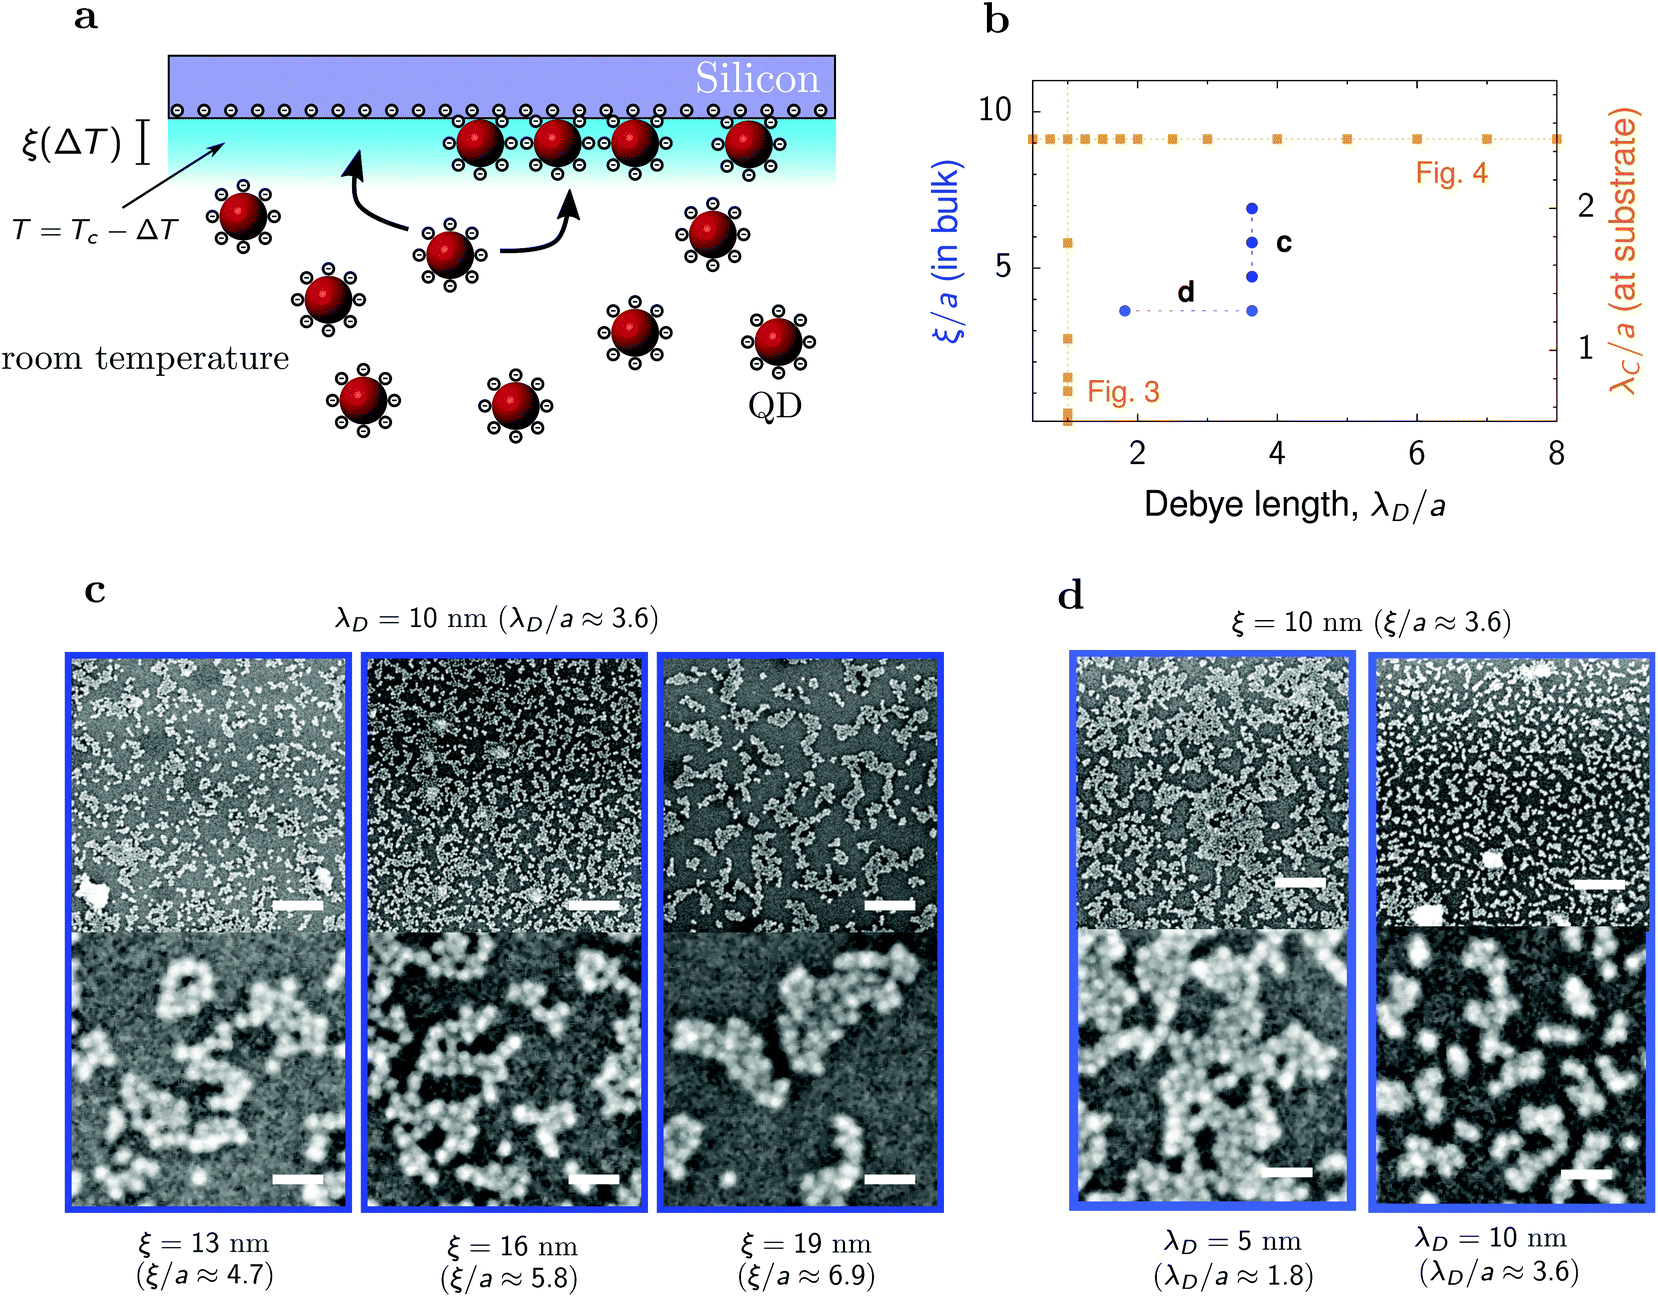 | ||
| Fig. 7 Deposition of quantum dots on a silicon substrate. (a) Schematics of the experimental setup. Hydrophilic quantum dots (QDs) of diameter 2a = 5.5 nm are immersed in a water–2,6-lutidine mixture at off-critical composition (30 w/w%) in contact with a hydrophilic silicon substrate. Temperature varies from room temperature in the bulk to a nearly critical at the substrate. (b) Diagram in the plane of the Debye screening length λD and bulk correlation length ξ, showing the values of λD and ξ used in the experiments (circles). The bulk correlation lengths correspond to the decay lengths of the Casimir interactions between QDs at the substrate ranging from about 1.5a to 2a (Fig. 1h). The squares indicate the simulations results shown in Fig. 3 and 4. (c) SEM images of deposited QDs for a few values of the bulk correlation length ξ and for the Debye screening length λD = 10 nm. The deposited structure coarsens with increasing ξ, similarly as in the simulations (Fig. 3). (d) SEM images for two values of the Debye screening length and for the bulk correlation length ξ = 10 nm. The size of clusters decreases with increasing λD, in agreement with the simulations (Fig. 4). In (c and d), the lower row shows the enlargement of small areas from the upper row, demonstrating crystal-like structures inside the clusters. The sizes of bars are 125 nm (upper row) and 25 nm (lower row). | ||
We measured the size of solvent density fluctuations, the correlation length ξ, in proximity of the substrate prior to each deposition by measuring the hydrodynamic diameter of the fluctuations with dynamic light scattering and correcting for the T-dependence of the viscosity.60 As the probe beam of the light scattering setup had a diameter of ∼0.5 mm, it measured the bulk correlation length. Thus, the measured ξ describes the decay of the critical Casimir interactions in the bulk fluid, rather than in the immediate nano-scale environment of the substrate, as in the simulations. In the experiments, we consider the values of ξ ranging from 10 to 19 nm (Fig. 7b), which in terms of the QD radius is 3.6a to 7a. Using the results of our MC simulations (Fig. 1h), we estimate that this bulk decay length corresponds to modified decay lengths between 1.5a and 2a at the substrate.
We obtained QD structures that are consistent with the simulation results. Fig. 7c shows micrographs of the obtained structures for three correlation lengths ξ and for the Debye length λD = 10 nm. We observe the formation of clusters that coarsen and evolve into spinodal-like structures upon increasing ξ, as in the simulations (Fig. 3). The lower micrographs in Fig. 7c show amorphous structures of QDs within the clusters, with some tendency for ordering. Unlike in the simulations, which predict hexagonal ordering, the QDs tend to arrange themselves into a square lattice. This is likely because of their cubic-like shapes.61
We also varied the Debye screening length at fixed ξ. Fig. 7d shows that for a fixed correlation length, the size of the clusters decreases as the Debye screening length increases. This is again in agreement with the simulations (Fig. 4), confirming experimentally the coarsening of the spinodal structures and thus demonstrating the control offered by the critical Casimir interactions over the deposited nanoparticle structures.
While we observe the same trends in the simulations and experiments, including the appearance of liquid-like and spinodal structures of clusters, the simulations additionally predict the formation of fractal-like gels and bicontinuous phases, which we could not identify in the experiments. The absence of nanoparticle gels is not very surprising, as our goal with experiments was to explore the critical regime, while gels appear farther away from the criticality, which gives rise to strong short-ranged interactions between the particles (Fig. 6). Bicontinuous phases and long-range cluster fluids appear in a relatively narrow range of parameters and are not easy to locate even with MD simulations. A more detailed investigation is thus desirable, particularly with MC simulations or classical density functional theory, which are more efficient in determining thermodynamically stable phases. However, we also cannot exclude that additional effects might be at play in the experiments, which are not taken into account in our model, but which may affect the formation of such mesophases. In particular, the electrostatic interactions were taken in the simplest DLVO form that does not account for solvent's critical fluctuations. It is possible that the varying correlation length influences the nanoparticle surface charge density and hence the strength of electrostatic repulsion.61 QD's polydispersity and ligands may further affect the stability and kinetics of mesophases. These effects require separate experimental and theoretical investigations and fall beyond the scope of the present work.
How interactions define structure
Our multiscale simulations and experiments suggest that there is a relation between the length scales of the interactions and the deposited nanoparticle structures, which we discuss below. The variety of the structures obtained by the simulations are summarized in Fig. 8.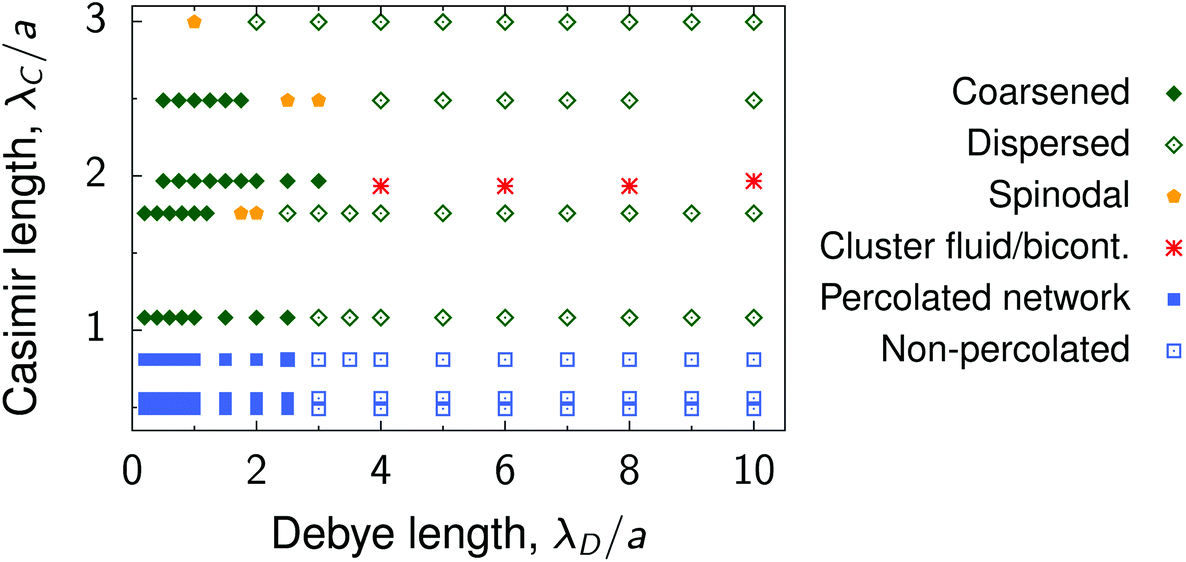 | ||
| Fig. 8 Summary of nanoparticle structures. Diagram shows the summary of structures in the plane of the Debye screening length λD and the decay length of the critical Casimir interactions between nanoparticles of radius a deposited on a substrate. Examples of the coarsened and dispersed structures are shown in Fig. 4e, λD/a = 0.5 and λD/a = 10, respectively. Spinodal structures are shown in Fig. 3e (λC/a = 3) and Fig. 4e (λD/a = 2.5). Cluster fluid and bicontinuous phases are presented in Fig. 5. Examples of percolated and non-percolated nanoparticle networks are shown in Fig. 6. | ||
• Elongated, coarsened structures, consisting of large non-spherical clusters with near-crystalline ordering of nanoparticles inside the clusters, form for λC ≳ a, λD ≲ a and coarsen with increasing λC. Examples: λC/a = 1.76 in Fig. 3 and λD/a = 0.5 in Fig. 4; ξ = 13 nm and ξ = 16 nm in Fig. 7b.
• Increasing λD leads to a larger energy barrier and a stronger repulsive tail in the interaction potential, which breaks large aggregates and gives rise to smaller dispersed clusters. Examples: λD/a = 10 in Fig. 4 and 7c.
• Spinodal-like morphologies appear for sufficiently large λC ≳ a and likely separate the dispersed and coarsened structures. Large λC and λD lead to a decreased potential depth (Fig. 2) and hence the spinodal structures are more amorphous than the coarsened ones. Examples: λC/a = 3 in Fig. 3 and ξ = 19 nm in Fig. 7.
• Cluster fluid or bicontinuous phases (depending on the density) emerge when λD ≳ λC ≳ a, provided there is a weak repulsive tail in the interaction potential. An example is shown in Fig. 5. Such mesophases appear in a narrow parameter range, and we could not easily locate them. For increasing λC, the attraction becomes weaker (Fig. 2) and hence these phases transform into the dispersed ones. For decreasing λC, the attraction increases, but the long-range behaviour becomes determined by the electrostatic repulsion, leading again to the dispersed structures.
• Fractal-like nanoparticle gels or percolated networks appear for λC < a and λD ≲ a, provided the depth of the interparticle potential is sufficiently large so that a nanoparticle attaches to an existing cluster virtually irreversibly. Such strong short-range potentials exist in the wetting regime and are caused by capillary bridging.34,37,38 In contrast to the critical regime, these forces can be well-controlled also for large colloids.62 Examples: λC/a = 0.53 in Fig. 3 and 6.
In addition to the interplay of the length scales of the interactions, also the potential depth and the height of the repulsive tail (energy barrier) play an important role in the formation of these structures. The strength and the range of critical Casimir interactions cannot be varied independently, but the repulsive interactions can be additionally controlled by changing the nanoparticle charge, which has been assumed the same throughout this work. Clearly, the parameter range, where various structures appear, may be modified by the particle charge. However, we expect the relations between the decay lengths to hold for the structures emerge due to the interplay of the long-range tails of the attractive and repulsive components.
We finally note that the repulsion can also be induced by other means. For instance, for nanoparticles with magnetic cores, the repulsion can be controlled with an external magnetic field,63,64 which may provide a convenient way to steer the structural transformations without the need to change an experimental setup.
Conclusion
We have developed an experimental method and a multiscale simulation framework to study the behaviour of charged hydrophilic nanoparticles deposited on hydrophilic substrates, immersed in a near-critical binary liquid mixture intermixed with salt. With Monte Carlo simulations of the Ising model, which mimics the binary mixture, we found that the critical Casimir interactions between nanoparticles can be drastically reduced at the substrate (Fig. 1). Notwithstanding, our multiscale molecular dynamics simulations predict the formation of a large variety of superstructures that can be controlled by varying composition of the mixture or temperature and salt concentration (Fig. 3–6 and 8). In particular, the simulations show that the structures coarsen with increasing solvent correlation length and decreasing Debye screening length. The experiments support these trends (Fig. 7), demonstrating new opportunities to steer nanoscale structures with external control. These results signify that nanoparticles in near-critical electrolytic solvents represent an exciting system with the potential for controlled fabrication of complex structures. We hope that our work will stimulate further experimental and theoretical studies that may lead to the emergence of novel fabrication techniques and optoelectronic devices, particularly those based on quantum dots.65Methods
Multiscale simulations
| U(r) = Urep(r) + Uel(r) + UC(r), | (2) |
| βUrep(x) = Arep(x − 2)−7, | (3) |
 | (4) |
 | (5) |
It has been shown that for 2,6-lutidine–water mixture the effect of various salts (viz., potassium chloride, potassium bromide and magnesium nitrate) on the correlation length ξ and the critical temperature Tc was minor.67 We correspondingly assumed that adding salt does not change the critical Casimir interactions.
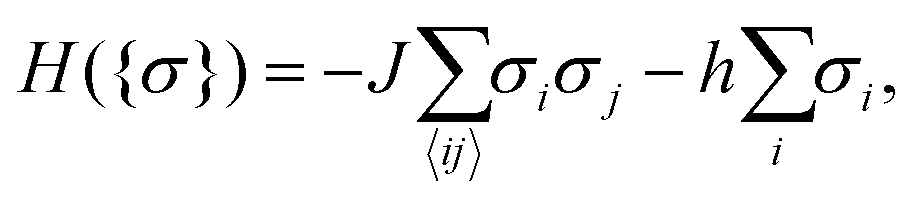 | (6) |
In all simulations, the system size was 200 × 60 × 60 lattice units in the x, y and z directions, respectively (Fig. 1e and g). The particle diameter was 11 lattice sites. The averaging was performed over 2 × 10⁶ hybrid Mont Carlo steps29 with preliminary thermalization of 2 × 10⁵ MC steps. For the configuration with the maximal distance between the particles (89 lattice sites), the number of MC steps was ten times larger to achieve a better accuracy (this value was subtracted from the Casimir potentials obtained at other distances to have zero at large separations).
 | (7) |
 | (8) |
Experimental
We synthesized oleate-passivated CdSe quantum dots (QDs) by following procedures reported in the literature.59 After washing, we redispersed the QDs in 10 mL of hexanes, and measured their concentration by following the sizing curve reported in the literature.71 We evaluated the size distribution of the QD dispersion by fitting the small-angle X-ray pattern to a spherical form factor convoluted with a normal distribution centered around the radius a and of width σ. The polydispersity was then extracted as (σ/a) × 100%. The polydispersity can also be evaluated from spectrophotometry by measuring the half-width at half-maximum of the first exciton peak and following the fit provided in the literature.72We replaced the native hydrophobic oleate ligands with hydrophilic DMPS ligands by following a ligand-exchange procedure. A 40 μM dispersion of QDs in hexane was placed in contact with a 40 mM solution of DMPS in N-methylformamide (NMF) and stirred vigorously for 1 hour. During this time, the QDs migrated from the apolar to the polar phase, as visually confirmed by the apolar phase becoming colorless and the polar phase gaining color. We then stopped the stirring, allowed for the two phases to separate, and transferred the polar phase to a centrifuge tube. Then we precipitated the QDs by adding a volume of acetonitrile equal to the volume of NMF and mixing. After centrifuging at 3000g for 20 minutes, we discarded the clear supernatant and redispersed the QDs at a concentration of 2 μM in the binary solvent, a 30% w/w solution of 2,6-lutidine in water, with an additional 0.89 mM sodium chloride to control the Debye screening length and 10 mM sodium hydroxide to improve colloidal stability of QDs.
We transferred the colloidal dispersion to a glass vessel for dynamic light scattering, where we placed it in contact with an oxygen plasma-treated silicon substrate placed at the top and attached to a steel block. Placing the substrate at the top allows us to rule out sedimentation as a contribution to the structures we observe and minimizes convection. The substrate was heated by means of a heating element embedded in the steel block, to a temperature T, such that ΔT = Tc − T > 0, where Tc is the critical temperature of the binary solvent. By keeping the bulk of the solvent at room temperature (RT), we drive a steep vertical temperature gradient going from T in proximity of the substrate to RT far from the substrate (Fig. 7a). To ensure experiment reproducibility, we measured the size of the solvent density fluctuations prior to each deposition in proximity of the substrate by measuring the hydrodynamic diameter of the fluctuations with dynamic light scattering and correcting for the T-dependence of the viscosity.60 The temperature range was 20 °C to 33.1 °C. After 1 hour, the substrate was retrieved, dipped in pure acetonitrile, and dried under vacuum prior to electron microscopy studies. By controlling the Debye screening length through the concentration of salt dissolved in the binary solvent, and the solvent correlation length through temperature, we are able to drive the assembly of nanoparticles towards structures of strikingly different morphologies.61
Conflicts of interest
There are no conflicts to declare.Acknowledgements
This work is part of the research programme “Nanoarchitectures: Smart Assembly, Quantum Electronics and Soft Mechanics” with project number 680.47.615, which is financed by the Dutch Research Council (NWO). P. S. acknowledges financial support from NWO through personal Vici grant. Open Access funding provided by the Max Planck Society.References
- J. N. Israelachvili, Intermolecular & Surface Forces, Academic, London, 1998 Search PubMed.
- M. E. Fisher and P. G. de Gennes, Phénomènes aux parois dans un mélange binaire critique, C. R. Acad. Sci., Paris, Ser. B, 1978, 287, 207 CAS.
- D. Beysens and D. Estève, Adsorption Phenomena at the Surface of Silica Spheres in a Binary Liquid Mixture, Phys. Rev. Lett., 1985, 54, 2123 CrossRef CAS PubMed.
- A. Hanke, F. Schlesener, E. Eisenriegler and S. Dietrich, Critical Casimir Forces between Spherical Particles in Fluids, Phys. Rev. Lett., 1998, 81, 1885 CrossRef CAS.
- F. Schlesener, A. Hanke and S. Dietrich, Critical Casimir Forces in Colloidal Suspensions, J. Stat. Phys., 2003, 110, 981 CrossRef CAS.
- C. Hertlein, L. Helden, A. Gambassi, S. Dietrich and C. Bechinger, Direct measurement of critical Casimir forces, Nature, 2008, 451, 172 CrossRef CAS PubMed.
- S. Kondrat, L. Harnau and S. Dietrich, Critical Casimir interaction of ellipsoidal colloids with a planar wall, J. Chem. Phys., 2009, 131, 204902 CrossRef CAS PubMed.
- M. Tröndle, S. Kondrat, A. Gambassi, L. Harnau and S. Dietrich, Normal and lateral critical Casimir forces between colloids and patterned substrates, EPL, 2009, 88, 40004 CrossRef.
- M. Tröndle, S. Kondrat, A. Gambassi, L. Harnau and S. Dietrich, Critical Casimir effect for colloids close to chemically patterned substrates, J. Chem. Phys., 2010, 133, 074702 CrossRef PubMed.
- O. A. Vasilyev and S. Dietrich, Critical Casimir forces for films with bulk ordering fields, EPL, 2013, 104, 60002 CrossRef.
- O. A. Vasilyev, Critical Casimir interactions between spherical particles in the presence of bulk ordering fields, Phys. Rev. E: Stat., Nonlinear, Soft Matter Phys., 2014, 90, 012138 CrossRef CAS PubMed.
- T. F. Mohry, S. Kondrat, A. Maciołek and S. Dietrich, Critical Casimir interactions around the consolute point of a binary solvent, Soft Matter, 2014, 10, 5510 RSC.
- A. Maciołek and S. Dietrich, Collective behavior of colloids due to critical Casimir interactions, Rev. Mod. Phys., 2018, 90, 045001 CrossRef.
- H. B. G. Casimir, On the attraction between two perfectly conducting plates, Proc. R. Acad. Sci. Amsterdam, 1948, 51, 793 Search PubMed.
- A. Gambassi, The Casimir effect: From quantum to critical fluctuations, J. Phys.: Conf. Ser., 2009, 161, 012037 CrossRef.
- V. D. Nguyen, S. Faber, Z. Hu, G. H. Wegdam and P. Schall, Controlling colloidal phase transitions with critical Casimir forces, Nat. Commun., 2013, 4, 1584 CrossRef PubMed.
- P. B. Shelke, V. D. Nguyen, A. V. Limaye and P. Schall, Controlling Colloidal Morphologies by Critical Casimir Forces, Adv. Mater., 2013, 25, 1499 CrossRef CAS PubMed.
- A. Magazzù, A. Callegari, J. P. Staforelli, A. Gambassi, S. Dietrich and G. Volpe, Controlling the dynamics of colloidal particles by critical Casimir forces, Soft Matter, 2019, 15, 2152 RSC.
- S. Paladugu, A. Callegari, Y. Tuna, L. Barth, S. Dietrich, A. Gambassi and G. Volpe, Nonadditivity of Critical Casimir Forces, Nat. Commun., 2016, 7, 11403 CrossRef CAS PubMed.
- P. Hopkins, A. J. Archer and R. Evans, Solvent mediated interactions between model colloids and interfaces: A microscopic approach, J. Chem. Phys., 2009, 131, 124704 CrossRef PubMed.
- S. El Fassi, M. Benhamou, M. Boughou, H. Kaidi, M. El Yaznasni and H. Ridouane, Casimir Force between Nanoparticles Immersed in a Cross linked Polymer Blend, Acta Phys. Pol., A, 2010, 118, 606 CrossRef CAS.
- X. Lu, S. G. J. Mochrie, S. Narayanan, A. R. Sandy and M. Sprung, Temperature-dependent structural arrest of silica colloids in a water-lutidine binary mixture, Soft Matter, 2010, 6, 6160 RSC.
- E. Marino, T. E. Kodger, J. B. ten Hove, A. H. Velders and P. Schall, Assembling quantum dots via critical Casimir forces, Sol. Energy Mater. Sol. Cells, 2016, 158, 154 CrossRef CAS.
- E. Marino, D. M. Balazs, R. W. Crisp, D. Hermida-Merino, M. A. Loi, T. E. Kodger and P. Schall, Controlling Superstructure–Property Relationships via Critical Casimir Assembly of Quantum Dots, J. Phys. Chem. C, 2019, 123, 13451 CrossRef CAS PubMed.
- H. Guo, G. Stan and Y. Liu, Nanoparticle separation based on size-dependent aggregation of nanoparticles due to the critical Casimir effect, Soft Matter, 2018, 14, 1311 RSC.
- M. X. Wang, S. E. Seo, P. A. Gabrys, D. Fleischman, B. Lee, Y. Kim, H. A. Atwater, R. J. Macfarlane and C. A. Mirkin, Epitaxy: Programmable Atom Equivalents Versus Atoms, ACS Nano, 2016, 11, 180 CrossRef PubMed.
- S. M. Rupich, F. C. Castro, W. T. M. Irvine and D. V. Talapin, Soft epitaxy of nanocrystal superlattices, Nat. Commun., 2014, 5, 5045 CrossRef CAS PubMed.
- M. N. Barber, Finite-size scaling, in Phase Transitions and Critical Phenomena, ed. C. Domb and J. L. Lebowitz, Academic, London, 1983, vol. 8, p. 145 Search PubMed.
- D. P. Landau and K. Binder, A Guide to Monte Carlo Simulations in Statistical Physics, Cambridge University, London, 2005 Search PubMed.
- A. Pelissetto and E. Vicari, Critical phenomena and renormalization-group theory, Phys. Rep., 2002, 368, 549 CrossRef CAS.
- S. G. Stuij, M. Labbé-Laurent, T. E. Kodger, A. Maciołek and P. Schall, Critical Casimir interactions between colloids around the critical point of binary solvents, Soft Matter, 2017, 13, 5233 RSC.
- T. F. Mohry, A. Maciołek and S. Dietrich, Phase behavior of colloidal suspensions with critical solvents in terms of effective interactions, J. Chem. Phys., 2012, 136, 224902 CrossRef CAS PubMed.
- M. Hasenbusch, Thermodynamic Casimir forces between a sphere and a plate: Monte Carlo simulation of a spin model, Phys. Rev. E: Stat., Nonlinear, Soft Matter Phys., 2013, 87, 022130 CrossRef PubMed.
- O. A. Vasilyev, S. Dietrich and S. Kondrat, Nonadditive interactions and phase transitions in strongly confined colloidal systems, Soft Matter, 2018, 14, 586 RSC.
- M. Gross, O. Vasilyev, A. Gambassi and S. Dietrich, Critical adsorption and critical Casimir forces in the canonical ensemble, Phys. Rev. E, 2016, 94, 022103 CrossRef PubMed.
- C. M. Rohwer, A. Squarcini, O. Vasilyev, S. Dietrich and M. Gross, Ensemble dependence of critical Casimir forces in films with Dirichlet boundary conditions, Phys. Rev. E, 2019, 99, 062103 CrossRef CAS PubMed.
- B. Chacko, R. Evans and A. J. Archer, Solvent fluctuations around solvophobic, solvophilic, and patchy nanostructures and the accompanying solvent mediated interactions, J. Chem. Phys., 2017, 146, 124703 CrossRef PubMed.
- O. A. Vasilyev, M. Labbé-Laurent, S. Dietrich and S. Kondrat, Bridging transitions and capillary forces for colloids in a slit, J. Chem. Phys., 2020, 153, 014901 CrossRef CAS PubMed.
- T. W. Burkhardt and E. Eisenriegler, Casimir Interaction of Spheres in a Fluid at the Critical Point, Phys. Rev. Lett., 1995, 74, 3189 CrossRef CAS PubMed.
- U. Pal, D. Samanta, S. Ghorai and A. K. Chaudhuri, Optical constants of vacuum-evaporated polycrystalline cadmium selenide thin films, J. Appl. Phys., 1993, 74, 6368 CrossRef CAS.
- T. Wakaoka, K. Hirai, K. Murayama, Y. Takano, H. Takagi, S. Furukawa and S. Kitagawa, Confined synthesis of CdSe quantum dots in the pores of metal–organic frameworks, J. Mater. Chem. C, 2014, 2, 7173 RSC.
- F. Pousaneh, O. Edholm and A. Maciołek, Molecular dynamics simulation of a binary mixture near the lower critical point, J. Chem. Phys., 2016, 145, 014501 CrossRef PubMed.
- U. Kaatze and D. Woermann, Dielectric study of a binary aqueous mixture with a lower critical point, J. Phys. Chem., 1984, 88, 284 CrossRef CAS.
- M. Bertolotti, V. Bogdanov, A. Ferrari, A. Jascow, N. Nazorova, A. Pikhtin and L. Schirone, Temperature dependence of the refractive index in semiconductors, J. Opt. Soc. Am. B, 1990, 7, 918 CrossRef CAS.
- M. Tröndle, Statics and dynamics of critical Casimir forces, 2012 Search PubMed.
- C. P. Royall, Hunting mermaids in real space: known knowns, known unknowns and unknown unknowns, Soft Matter, 2018, 14, 4020 RSC.
- Y. Zhuang and P. Charbonneau, Recent Advances in the Theory and Simulation of Model Colloidal Microphase Formers, J. Phys. Chem. B, 2016, 120, 7775 CrossRef CAS PubMed.
- M. B. Sweatman and L. Lue, The Giant SALR Cluster Fluid: A Review, Adv. Theory Simul., 2019, 2, 1900025 CrossRef.
- Y. Liu and Y. Xi, Colloidal systems with a short-range attraction and long-range repulsion: Phase diagrams, structures, and dynamics, Curr. Opin. Colloid Interface Sci., 2019, 39, 123 CrossRef CAS PubMed.
- O. Patsahan, M. Litniewski and A. Ciach, Self-assembly in mixtures with competing interactions, Soft Matter, 2021 10.1039/d0sm02072a.
- S. Lazzari, L. Nicoud, B. Jaquet, M. Lattuada and M. Morbidelli, Fractal-like structures in colloid science, Adv. Colloid Interface Sci., 2016, 235, 1 CrossRef CAS PubMed.
- H. Wu and M. Morbidelli, A Model Relating Structure of Colloidal Gels to Their Elastic Properties, Langmuir, 2001, 17, 1030 CrossRef CAS.
- R. Sear, S.-W. Chung, G. Markovich, W. Gelbart and J. Heath, Spontaneous patterning of quantum dots at the air-water interface, Phys. Rev. E: Stat. Phys., Plasmas, Fluids, Relat. Interdiscip. Top., 1999, 59, R6255 CrossRef CAS PubMed.
- A. Ciach, J. Pekalski and W. T. Góźdź, Origin of similarity of phase diagrams in amphiphilic and colloidal systems with competing interactions, Soft Matter, 2013, 9, 6301 RSC.
- P. J. Lu and D. A. Weitz, Colloidal Particles: Crystals, Glasses, and Gels, Annu. Rev. Condens. Matter Phys., 2013, 4, 217 CrossRef CAS.
- R. Roth, Fluid of discs with competing interactions, Mol. Phys., 2011, 109, 2897 CrossRef CAS.
- J. Pękalski, A. Ciach and N. G. Almarza, Periodic ordering of clusters and stripes in a two-dimensional lattice model. I. Ground state, mean-field phase diagram and structure of the disordered phases, J. Chem. Phys., 2014, 140, 114701 CrossRef PubMed.
- J. Laube, S. Gutsch, D. Wang, C. Kübel, M. Zacharias and D. Hiller, Two-dimensional percolation threshold in confined Si nanoparticle networks, Appl. Phys. Lett., 2016, 108, 043106 CrossRef.
- B. D. Chernomordik, A. R. Marshall, G. F. Pach, J. M. Luther and M. C. Beard, Quantum Dot Solar Cell Fabrication Protocols, Chem. Mater., 2016, 29, 189 CrossRef.
- E. Gülari, A. F. Collings, R. L. Schmidt and C. J. Pings, Light Scattering and Shear Viscosity Studies of the Binary System 2,6-Lutidine-Water in the Critical Region, J. Chem. Phys., 1972, 56, 6169 CrossRef.
- E. Marino, O. A. Vasilyev, B. B. Kluft, M. J. Stroink, S. Kondrat and P. Schall, Controlled Deposition of Nanoparticles with Critical Casimir Forces, to be published.
- C. Gögelein, M. Brinkmann, M. Schröter and S. Herminghaus, Controlling the Formation of Capillary Bridges in Binary Liquid Mixtures, Langmuir, 2010, 26, 17184 CrossRef PubMed.
- K. Marolt, M. Zimmermann and R. Roth, Microphase separation in a two-dimensional colloidal system with competing attractive critical Casimir and repulsive magnetic dipole interactions, Phys. Rev. E, 2019, 100, 052602 CrossRef CAS PubMed.
- K. Marolt and R. Roth, Statics and dynamics of a finite two-dimensional colloidal system with competing attractive critical Casimir and repulsive magnetic dipole interactions, Phys. Rev. E, 2020, 102, 042608 CrossRef CAS PubMed.
- P. O. Anikeeva, J. E. Halpert, M. G. Bawendi and V. Bulović, Electroluminescence from a Mixed Red-Green-Blue Colloidal Quantum Dot Monolayer, Nano Lett., 2007, 7, 2196 CrossRef CAS PubMed.
- D. Henderson, D.-M. Duh, X. Chu and D. Wasan, An Expression for the Dispersion Force between Colloidal Particles, J. Colloid Interface Sci., 1997, 185, 265 CrossRef CAS PubMed.
- U. Nellen, J. Dietrich, L. Helden, S. Chodankar, K. Nygard, J. Friso, van der Veen and C. Bechinger, Salt-induced changes of colloidal interactions in critical mixtures, Soft Matter, 2011, 7, 5360 RSC.
- K. Binder, Critical behaviour at surfaces, in Phase Transitions and Critical Phenomena, ed. C. Domb and J. L. Lebowitz, Academic, London, 1983, vol. 8, p. 1 Search PubMed.
- T. F. Mohry, A. Maciołek and S. Dietrich, Crossover of critical Casimir forces between different surface universality classes, Phys. Rev. E: Stat., Nonlinear, Soft Matter Phys., 2010, 81, 061117 CrossRef CAS PubMed.
- O. A. Vasilyev, Monte carlo simulation of critical casimir forces, in Order, Disorder and Criticality: Advanced Problems of Phase Transition Theory, World Scientific, 2015, pp. 55–110 Search PubMed.
- W. W. Yu, L. Qu, W. Guo and X. Peng, Experimental Determination of the Extinction Coefficient of CdTe, CdSe, and CdS Nanocrystals, Chem. Mater., 2003, 15, 2854 CrossRef CAS.
- E. Marino, A. W. Keller, D. An, S. van Dongen, T. E. Kodger, K. E. MacArthur, M. Heggen, C. R. Kagan, C. B. Murray and P. Schall, Favoring the Growth of High-Quality, Three-Dimensional Supercrystals of Nanocrystals, J. Phys. Chem. C, 2020, 124, 11256 CrossRef CAS.
Footnote |
| † Electronic supplementary information (ESI) available. See DOI: 10.1039/D0NR09076J |
| This journal is © The Royal Society of Chemistry 2021 |