
 Open Access Article
 This Open Access Article is licensed under a
 Creative Commons Attribution 3.0 Unported Licence
Direct measurement of curvature-dependent surface tension of an alcohol nanomeniscus†
Dohyun
Kim
 a,
Jongwoo
Kim
b,
Jonggeun
Hwang
a,
Dongha
Shin
ac,
Sangmin
An
ad and
Wonho
Jhe
*a
a,
Jongwoo
Kim
b,
Jonggeun
Hwang
a,
Dongha
Shin
ac,
Sangmin
An
ad and
Wonho
Jhe
*a
aCenter for 0D Nanofluidics, Institute of Applied Physics, Department of Physics and Astronomy, Seoul National University, Seoul 08826, Republic of Korea. E-mail: whjhe@snu.ac.kr
bCenter for Convergent Research of Emerging Virus Infection, Korea Research Institute of Chemical Technology, Daejeon 34114, Republic of Korea
cDepartment of Chemistry and Chemical Engineering, Inha University, Incheon 22212, Republic of Korea
dDepartment of Physics, Research Institute of Physics and Chemistry, Jeonbuk National University, Jeonju 54896, Korea
First published on 19th March 2021
Abstract
Surface tension is a key parameter for understanding nucleation in the very initial stage of phase transformation. Although surface tension has been predicted to vary with the curvature of the liquid–vapor interface, particularly at the large curvature of, e.g., the subnanometric critical nucleus, experimental study still remains challenging due to inaccessibility to such a small cluster. Here, by directly measuring the critical size of a single capillary-condensed nanomeniscus using atomic force microscopy, we address the curvature dependence of surface tension of alcohols and observe that the surface tension is doubled for ethanol and n-propanol with a radius-of-curvature of ∼−0.46 nm. We also find that the interface of larger negative (positive) curvature exhibits larger (smaller) surface tension, which evidently governs nucleation at the ∼1 nm scale and below, indicating more facilitated nucleation than normally expected. Such well characterized curvature effects contribute to better understanding and accurate analysis of nucleation occurring in various fields including materials science and atmospheric science.
Introduction
Nucleation of alcohols is a fundamentally important process since it plays a critical role in investigating the atmospheric new particle formation, which affects the Earth radiation budget, climate change and human health.1–4 To study the formation and growth of aerosol particles from the initial stage of nucleation, alcohols are widely employed to activate and help grow fine molecular particles to detectable sizes, such as those used in condensation particle counters.5,6 In addition, alcohols are a simple type of organic compound that serve as major contributors to new particle formation in the atmosphere.1 Therefore, quantitative understanding of nucleation of alcohols is essential from laboratory experiments to field studies that address the mechanism of atmospheric new particle formation as well as the activation properties of those particles and vapors, which are attracting increasingly more attention as concerns about environmental issues such as air pollution increase.7–9When characterizing phase transitions including such nucleation processes, surface tension is an important thermodynamic parameter.10–12 It determines the energy barrier to overcome to form a cluster of new phase and also provides the equilibrium criteria for the critical nucleus, the very first stage of nucleation. However, surface tension is expected to vary depending on the curvature of the interface (Fig. 1(a)–(d)), particularly for a very small cluster down to sub-nanometer scale.13,14 Despite numerous simulation and theoretical studies, the curvature-dependent surface tension is still an issue under ongoing debate.15–17 Especially for alcohols, there have been studies that incorporate the curvature correction to the alcohols’ surface tension for better analysis of the results in the homogeneous nucleation (HON) rate experiment.18,19 Nevertheless, there is no direct measurement of surface tension of alcohols for sufficiently large curvature of interface, or extremely small size, to identify the clear change in surface tension.
 | ||
| Fig. 1 (a) In saturated vapor (p/p0 = 1), the liquid–vapor (LV) interface is planar in equilibrium with constant surface tension σ0. (b) and (c) In supersaturated vapor, the LV interface has a positive curvature in equilibrium, irrespective of a solid interface. (d) In unsaturated vapor, the LV interface of a meniscus has a negative curvature. Notice that surface tension σ varies depending on the curvature in (b)–(d) unlike in (a). (e) A fused quartz tip is glued on a QTF prong for shear-mode AFM. (f) Amplitude and phase signals of the QTF obtained as the tip approaches mica. Capillary condensation occurs at the critical distance dc. (i)–(iv) show each step of the tip approach, allowing direct measurement of dc and contact point (d = 0). | ||
For example, surface-force apparatus (SFA) experiments showed the validity of constant surface tension for a cyclohexane meniscus with a mean radius-of-curvature down to −4 nm.20 Although the researchers directly measured the distance between two mica surfaces where the meniscus is formed upon contact, they could not clarify further the curvature-dependent change in surface tension due to the experimental limit of distance measurement. Later, SFA experiments provided the adhesion force measurement for capillary-condensed cyclohexane in the contact zone down to the molecular scale; however, the radius-of-curvature of the liquid–vapor interface below −4 nm was not directly measured but derived from the Kelvin equation.21 Moreover, they concluded that their adhesion force measurement data were not available to calculate the curvature effect on surface tension because of uncontrollable experimental issues.21
Another example is the nucleation-rate measurement for alcohols, which has been conducted in supersaturated alcohol vapor.22–24 This corresponds to the production of the nuclei of the positive-curvature interface in equilibrium (Fig. 1(b) and (c)), but they are thermodynamically unstable, thus leading to spontaneous growth immediately after nucleation. In such systems, it is impossible to observe directly a nanoscale critical nucleus, and size measurement can be done only when the nucleus grows enough to be detected. Therefore, for better understanding of nucleation of alcohols, the main subject of the present work, one needs to investigate the surface tension by direct size measurement of the critical nucleus, which is available only under non-supersaturated conditions (Fig. 1(d)).
Here, we measure the surface tension of ethanol and n-propanol at the nanoscale by direct size measurement of a single critical nucleus, capillary-condensed between two surfaces, which enables the identification of the unambiguous increase of surface tension. Since the experiment is conducted at unsaturated low vapor pressure (p/p0 < 0.5), a nanomeniscus with large negative curvature is formed (Fig. 1(d)), which is (meta-)stable in equilibrium, thus minimizing the typical systematic errors in size characterization, in contrast to the supersaturated case.25–27 Note that the curvature dependent change in surface tension for nucleation systems that have either sign of curvature (Fig. 1(b)–(d)) is closely interrelated.28
Experiments and results
For simultaneous formation and direct observation of a critical nucleus with large negative curvature, we approach a sharp quartz tip to the mica substrate under ambient conditions, employing quartz tuning fork-based atomic force microscopy (QTF-AFM). The AFM operates in shear mode with the tip oscillating laterally, allowing precise measurement of the tip–substrate distance (Fig. 1(e)). Mica is used as a substrate because its surface is atomically flat and provides small contact angles for alcohols. On such a surface, the height of the meniscus becomes larger than on other substrates with larger contact angles, and size measurement errors due to surface roughness are minimized.As the tip and substrate get close, a nanomeniscus-shaped nucleus is produced in the gap at the critical tip–substrate distance of nucleation, dc, which characterizes the size of a critical nucleus and relates uniquely to its equilibrium curvature (inset of Fig. 1(e)). Nucleation and the presence of the alcohol nanomeniscus are seen in the collected AFM signal. The amplitude and phase responses of the on-resonance oscillating QTF reflect the interaction force exerted on the tip29 and are monitored during the approach (Fig. 1(f)). When the tip approaches (i), the abrupt drop in the amplitude indicates nucleation (ii). The contact point is defined where the oscillation amplitude starts to decrease rapidly (iii), with ±0.1 nm uncertainty (see ESI section 1†). As the tip approaches further, the amplitude variation saturates, which marks the tip–substrate hard contact (iv).
Since the QTF is a very sensitive and stiff oscillator, QTF-AFM is suitable to detect in situ the single critical nucleus (Fig. 1(f) (ii)), as well as to control the tip–substrate distance accurately without mechanical instability. Detailed conditions of measurement and equipment are reported in previous works29–31 and ESI section 1.†
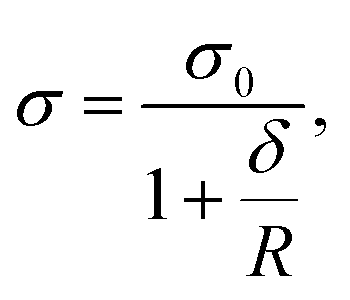
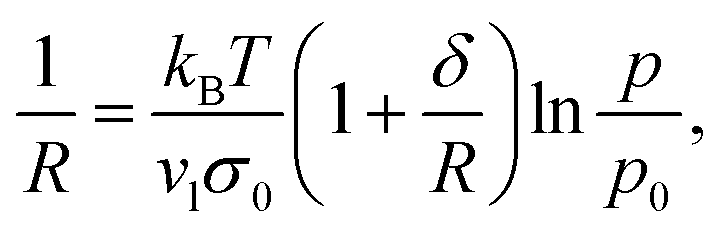
The liquid–vapor (LV) interface of the formed nanomeniscus can be described by the Kelvin equation, which relates the equilibrium curvature with the vapor pressure,
 | (1) |
It is important to remark that the equilibrium mean curvature (1/R) of the nanomeniscus obtained at certain p/p0 is uniquely determined by a measured dc which corresponds to a vertical height of a nanomeniscus when it is formed. They are related by the Young–Laplace equation of the form for an axi-symmetric shaped interface:
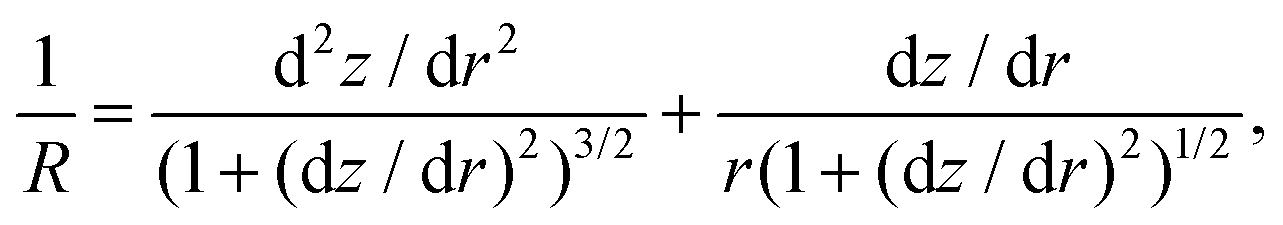 | (2) |
The typical approach curves are presented in Fig. 2(a) for ethanol (see Fig. S2† for n-propanol and approach-retraction cycle). The histograms and Gaussian fittings for the measured values of dc are shown in Fig. 2(b) and (c), obtained by 25 to 39 independent measurements at three different saturation ratios, p/p0 = 0.1, 0.2 and 0.45, for each alcohol. As summarized in Fig. 2(d), larger dc is obtained at larger p/p0 for both ethanol and n-propanol, for which the general tendency follows eqn (1). While dc also depends on the material of the tip and substrate and their contact angle for alcohols, the surface tension we measure is affected little if the contact angles are properly considered (ESI section 4†). Surface tension is defined at the LV interface regardless of the solid surfaces.
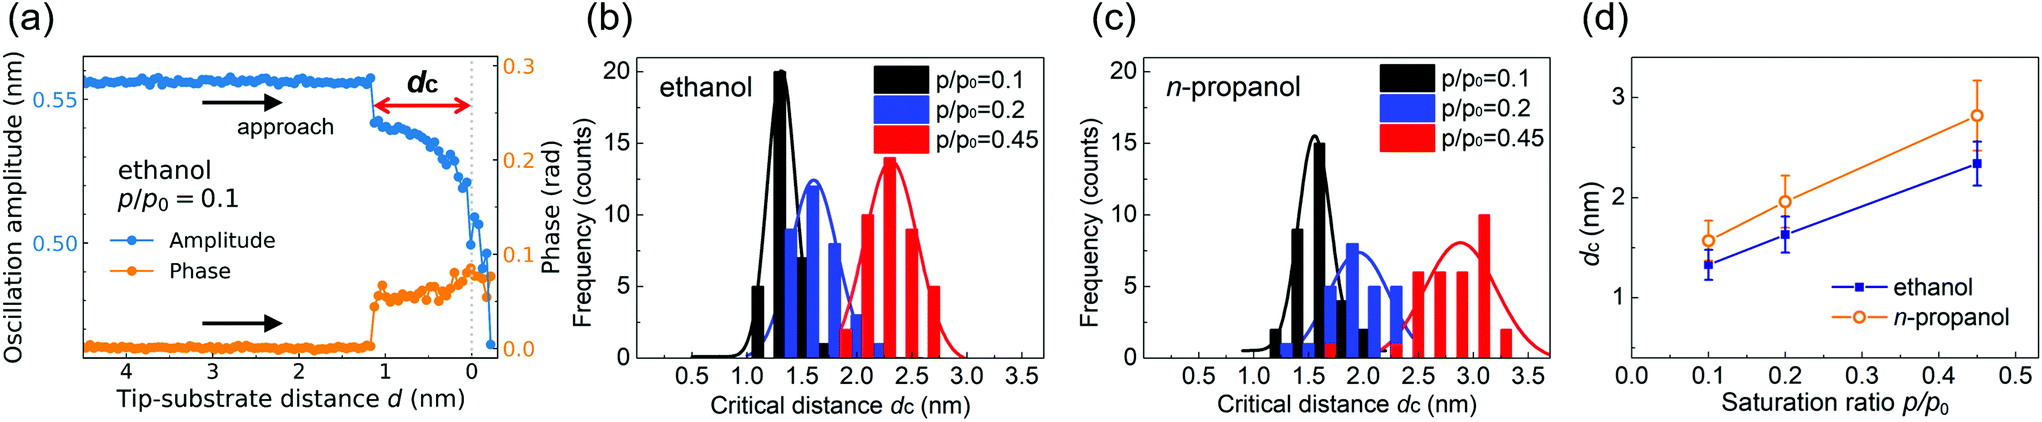 | ||
| Fig. 2 (a) Typical amplitude and phase for ethanol at p/p0 = 0.1. The tip approaches in steps of 0.05 nm and stays for 500 ms at each step. (b) The histogram plot of dcversus p/p0 obtained for 30 to 39 times tip approach in ethanol vapor and (c) for 25 to 33 times measurement in n-propanol vapor. (d) Larger dc at larger p/p0. dc is measured as 1.33 ± 0.15 nm, 1.63 ± 0.18 nm and 2.34 ± 0.22 nm at p/p0 = 0.1, 0.2 and 0.45, respectively, for ethanol and 1.57 ± 0.2 nm, 1.96 ± 0.26 nm and 2.82 ± 0.35 nm at each p/p0 for n-propanol. Each error denotes the standard deviation and the solid lines are for eye guide. | ||
Notice that for accurate measurements of dc, we carefully deal with the contamination issue and the liquid film left over on the surfaces: to prevent contamination of the tip and substrate, the tip is retracted before reaching the hard contact (Fig. 1(e)(iv)) as in Fig. 2(a), which also protects the tip from being deformed. To avoid the overestimation of dc due to the leftover liquid films on the mica surface,36–38 each measurement is conducted at different locations of about 100 nm apart on mica. Detailed analysis of the factors that can affect the measurement is in ESI section 3.† The effect of the tip oscillation on the dc measurement can be negligible, as the oscillating amplitude (∼0.5 nm) is small enough compared to the lateral size of the meniscus (∼10 nm) and the oscillation period is longer than the relaxation time of the confined molecules. Our previous study also showed that the dc measurements are not affected by the amplitude change in a range less than 1 nm.31
Fig. 3 presents the results of the exact 1/R versus p/p0, where the plotted values of 1/R (black squares) correspond uniquely to each measured dc. As observed clearly, experimental data show considerable discrepancies with the simple 1/R behavior predicted by eqn (1) (dashed lines), where we use the well-known constant surface tension for ethanol (22.01 mN m−1) and n-propanol (23.5 mN m−1) in Fig. 3(a) and (b), respectively. As shown, larger discrepancies between the observed and predicted values occur at lower saturation ratio p/p0. It implies that the curvature-dependent surface tension has to be incorporated, since careful consideration of other factors, including nonideality of the fluid and contact-angle change due to the line-tension effect at the three-phase contact line,39–41 fails to fully explain the discrepancies. In particular, the discrepancy actually increases with an increase in contact angle within the range 0 < θ < π/2, but decreases for vanishing contact angle. Even when zero contact angles are assumed both between tip and meniscus and between meniscus and mica, considerable discrepancies still prevail; see ESI section 4† for details.
 | ||
| Fig. 3 Plot of p/p0versus the equilibrium curvature 1/R. Black squares with error bars represent the 1/R values obtained from the measured dc. The solid curves represent the fits of the Kelvin equation considering the first order curvature dependency of the surface tension on the experimental data by eqn (3), the Tolman equation. They show (a) δ = 0.23 nm for ethanol and (b) δ = 0.27 nm for n-propanol, respectively, whereas the dashed lines indicate the Kelvin equation that assumes constant surface tension. | ||
The curvature-dependent surface tension has been characterized by the Tolman length δ, as given by the Tolman equation,14
 | (3) |
 | (4) |
 | ||
| Fig. 4 (a) The normalized ratio of surface tension σ/σ0. The larger surface tension is obtained for the smaller nanomeniscus, which equivalently implies that the smaller nanodroplet of positive curvature has smaller surface tension than the bulk value σ0. (b) The curvature-dependent surface tension is employed in the results of the HEN rate measurement of ref. 7. Fitting with the second-order expansion of surface tension gives two coefficients, δ∞ = −0.18 nm and (δ∞2 + α)/4 = 0.19 nm2, which provides excellent agreement, but deviates from our result due to the temperature difference. | ||
Notice that the errors of 1/R in Fig. 3 and 4(a) correspond to the error of δ up to ±0.09 nm for ethanol and ±0.16 nm for n-propanol. Although each error range of δ somewhat overlaps (Fig. 4(a)), the fact that δethanol < δpropanol reflects the slight difference in their molecular size and shape. This is because, based on its definition, the value of δ is known to be closely related to the intermolecular distance and interaction range.16 In addition, quantitative analysis of possible errors for other quantities used in the calculation shows that even when δ varies by −33% up to +78%, the sign of δ is invariant (see ESI section 4†).
The effect of the heterogeneity and confinement by solid surfaces is applied to our analysis only by geometrical factors such as contact angles and a tip radius since our main focus is on the LV interface and the area of solid–liquid interface is comparable with that of the LV interface of our nanomeniscus. Nevertheless, further study on the solid–liquid interface would improve the precision of the resulted curvature-dependent surface tension and understanding of HEN.
Discussion
Interestingly, the positive sign of δ indicates that a cluster of condensed phase with more positive (negative) curvature 1/R has smaller (larger) surface tension σ than the bulk value σ0 at the planar interface (solid curves in Fig. 4(a)). This suggests that alcohols can nucleate more frequently, or equivalently, activate at a lower vapor pressure than what the classical nucleation theory (CNT) predicts. This is because although CNT has been considered as a qualitatively correct way to describe the critical nucleus and to predict the nucleation rate, it is based on eqn (1), assuming constant surface tension. Our results are also consistent with the previous studies on the positive curvature case, including the HON rate measurement and nucleating colloidal liquid, all reporting the lower surface tension than bulk to properly explain their data.18,19,42 Notice that the better agreement appears when the second-order correction is implemented by using the curvature dependence of the Tolman length itself (ESI section 5†).Moreover, our result can be employed for the heterogeneous nucleation (HEN) case, because eqn (1) is established for the LV interface regardless of the presence of the solid surface.43 Previous studies on the HEN rate measurement have shown the same tendency as ours, that the onset saturation ratio p/p0 is lower than what the CNT with constant surface tension expects.7,39 Since these experiments that form convex clusters of n-propanol on pre-existing particles (Fig. 1(c)) mainly focus on the size of the activated particles and the liquid–solid interface properties rather than the LV interface, surface tension change has not been seriously considered even for sufficiently large curvature. In fact, the slight discrepancy that still exists between HEN experiments and the theory7 can be quantitatively accounted for by incorporating the curvature-dependent surface tension, as in Fig. 4(b). The equilibrium curvature of the liquid–vapor interface of the critical nucleus 1/R (=2/r*, for a radius of the spherical critical nucleus r*) in ref. 7 and the corresponding saturation ratio p/p0 are plotted (black dots) and fitted with the second-order expansion of the Tolman equation (green curve). Their first and second order coefficients of the curvature are δ∞ = −0.18 nm and (δ∞2 + α)/4 = 0.19 nm2, respectively. The fitting with our curvature-dependency results (δ∞ = 0.25 nm and δ∞2 + α = −0.057 nm2) is expressed as an orange curve, showing some discrepancy due to the temperature difference at which experiments were performed, 280 K for ref. 7 and 296 K for ours. Obviously, the temperature plays a critical role in the curvature-dependent change of surface tension18,44 and thus, further studies of temperature dependence would provide more quantitative values. Details of the calculation process are discussed in ESI section 6.†
We have demonstrated that our results on curvature-dependent surface tension may be helpful in further studies on nucleation and subsequent growth of molecular-scale particles in various fields such as atmospheric physics and chemistry. Moreover, the surface tension value of alcohols can practically contribute to accurate analysis and interpretation in those studies since only ∼20% change in surface tension leads to orders-of-magnitude change in the nucleation rate prediction.10,18,42
Conclusions
In summary, the change in surface tension of ethanol and n-propanol, showing up to twofold enhancement, is obtained by directly measuring the size of the critical nucleus with curvature up to ∼−2.2 nm−1 and −1.7 nm−1, respectively. By considering this curvature dependence in surface tension, the macroscopic Kelvin equation is demonstrated valid down to the mean radius-of-curvature of −0.45 nm for ethanol and −0.59 nm for n-propanol. In addition, the Tolman length, a parameter characterizing the curvature dependency of the surface tension, for ethanol is found to be ∼20% smaller than that for n-propanol, reflecting the relevant difference of the molecular structure. Exact knowledge of the curvature dependency of pure fluid's surface tension provides a crucial basis for analyzing the binary, ternary, and multi-component cases, which is necessary for understanding and characterizing the nucleation processes in complex real systems from atmospheric to biological systems.1,2,11Conflicts of interest
There are no conflicts of interest to declare.Acknowledgements
The SEM images of the quartz tip were obtained at the Research Institute of Advanced Materials, Seoul National University. The authors acknowledge Jongsook Kim for operating SEM. This work was supported by the National Research Foundation of Korea (NRF) grant funded by the Korean government (MSIP) (No. 2016R1A3B1908660), by the Basic Science Research Program through the National Research Foundation of Korea (NRF) funded by the Ministry of Education, Science and Technology (2020R1I1A1A01070755), and by a National Research Council of Science and Technology (NST) grant from the Korean Government (MSIT) (CRC-16-01-KRICT).References
- D. Stolzenburg, L. Fischer and A. L. Vogel, et al. , Proc. Natl. Acad. Sci. U. S. A., 2018, 115, 9122–9127 CrossRef CAS PubMed.
- M. Kulmala, J. Kontkanen, H. Junninen, K. Lehtipalo, H. Manninen, T. Nieminen, T. Petäjä, M. Sipilä, S. Schobesberger and P. Rantala, et al. , Science, 2013, 339, 943–946 CrossRef CAS PubMed.
- M. Andreae and D. Rosenfeld, Earth-Sci. Rev., 2008, 89, 13–41 CrossRef.
- M. Shiraiwa, K. Ueda, A. Pozzer, G. Lammel, C. J. Kampf, A. Fushimi, S. Enami, A. M. Arangio, J. Frhlich-Nowoisky, Y. Fujitani, A. Furuyama, P. S. J. Lakey, J. Lelieveld, K. Lucas, Y. Morino, U. Pschl, S. Takahama, A. Takami, H. Tong, B. Weber, A. Yoshino and K. Sato, Environ. Sci. Technol., 2017, 51, 13545–13567 CrossRef CAS PubMed.
- M. Kulmala, T. Petäjä and T. Nieminen, et al. , Nat. Protoc., 2012, 7, 1651–1667 CrossRef CAS PubMed.
- L. Dada, K. Lehtipalo, J. Kontkanen, T. Nieminen, R. Baalbaki, L. Ahonen, J. Duplissy, C. Yan, B. Chu, T. Petäjä, K. Lehtinen, V.-M. Kerminen, M. Kulmala and J. Kangasluoma, Nat. Protoc., 2020, 15, 1013–1040 CrossRef CAS PubMed.
- P. Winkler, G. Steiner, A. Vrtala, H. Vehkamäki, M. Noppel, K. Lehtinen, G. Reischl, P. Wagner and M. Kulmala, Science, 2008, 319, 1374–1377 CrossRef CAS PubMed.
- L. Yao, O. Garmash, F. Bianchi, J. Zheng, C. Yan, J. Kontkanen, H. Junninen, S. B. Mazon, M. Ehn, P. Paasonen, M. Sipilä, M. Wang, X. Wang, S. Xiao, H. Chen, Y. Lu, B. Zhang, D. Wang, Q. Fu, F. Geng, L. Li, H. Wang, L. Qiao, X. Yang, J. Chen, V.-M. Kerminen, T. Petäjä, D. R. Worsnop, M. Kulmala and L. Wang, Science, 2018, 361, 278–281 CrossRef CAS PubMed.
- S. Guo, M. Hu, J. Peng, Z. Wu, M. L. Zamora, D. Shang, Z. Du, J. Zheng, X. Fang, R. Tang, Y. Wu, L. Zeng, S. Shuai, W. Zhang, Y. Wang, Y. Ji, Y. Li, A. L. Zhang, W. Wang, F. Zhang, J. Zhao, X. Gong, C. Wang, M. J. Molina and R. Zhang, Proc. Natl. Acad. Sci. U. S. A., 2020, 117, 3427–3432 CrossRef CAS PubMed.
- J. Ovadnevaite, A. Zuend, A. Laaksonen, K. Sanchez, G. Roberts, D. Ceburnis, S. Decesari, M. Rinaldi, N. Hodas and M. Facchini, et al. , Nature, 2017, 546, 637 CrossRef CAS PubMed.
- S. Alberti, A. Gladfelter and T. Mittag, Cell, 2019, 176, 419–434 CrossRef CAS PubMed.
- Nucleation in Condensed Matter: Applications in Materials and Biology, ed. K. Kelton and A. Greer, Pergamon, 2010, vol. 15 Search PubMed.
- R. Tolman, J. Chem. Phys., 1948, 16, 758–774 CrossRef CAS.
- R. Tolman, J. Chem. Phys., 1949, 17, 333–337 CrossRef CAS.
- M. Anisimov, Phys. Rev. Lett., 2007, 98, 035702 CrossRef CAS PubMed.
- Y. Lei, T. Bykov, S. Yoo and X. Zeng, J. Am. Chem. Soc., 2005, 127, 15346–15347 CrossRef CAS PubMed.
- P. Rehner, A. Aasen and O. Wilhelmsen, J. Chem. Phys., 2019, 151, 244710 CrossRef CAS PubMed.
- N. Bruot and F. Caupin, Phys. Rev. Lett., 2016, 116, 056102 CrossRef PubMed.
- A. Aasen, D. Reguera and O. Wilhelmsen, Phys. Rev. Lett., 2020, 124, 045701 CrossRef CAS PubMed.
- L. Fisher and J. Israelachvili, Nature, 1979, 277, 548 CrossRef CAS.
- L. Fisher and J. Israelachvili, Chem. Phys. Lett., 1980, 76, 325–328 CrossRef CAS.
- R. Strey, P. E. Wagner and T. Schmeling, J. Chem. Phys., 1986, 84, 2325–2335 CrossRef CAS.
- A. Graßmann and F. Peters, J. Chem. Phys., 2002, 116, 7617–7620 CrossRef.
- R. Zhang, Science, 2010, 328, 1366–1367 CrossRef CAS PubMed.
- F. Restagno, L. Bocquet and T. Biben, Phys. Rev. Lett., 2000, 84, 2433 CrossRef CAS PubMed.
- Y. Men, X. Zhang and W. Wang, J. Chem. Phys., 2009, 131, 184702 CrossRef PubMed.
- X. Zhang, C. D. Cappa, S. H. Jathar, R. C. McVay, J. J. Ensberg, M. J. Kleeman and J. H. Seinfeld, Proc. Natl. Acad. Sci. U. S. A., 2014, 111, 5802–5807 CrossRef CAS PubMed.
- J. Melrose, Ind. Eng. Chem., 1968, 60, 53–70 CrossRef CAS.
- M. Lee, J. Jahng, K. Kim and W. Jhe, Appl. Phys. Lett., 2007, 91, 023117 CrossRef.
- H. Choe, M.-H. Hong, Y. Seo, K. Lee, G. Kim, Y. Cho, J. Ihm and W. Jhe, Phys. Rev. Lett., 2005, 95, 187801 CrossRef CAS PubMed.
- S. Kim, D. Kim, J. Kim, S. An and W. Jhe, Phys. Rev. X, 2018, 8, 041046 Search PubMed.
- M. Kohonen and H. Christenson, Langmuir, 2000, 16, 7285–7288 CrossRef CAS.
- M. Factorovich, V. Molinero and D. Scherlis, J. Am. Chem. Soc., 2014, 136, 4508–4514 CrossRef CAS PubMed.
- Q. Yang, P. Z. Sun, L. Fumagalli, Y. V. Stebunov, S. J. Haigh, Z. W. Zhou, I. V. Grigorieva, F. C. Wang and A. K. Geim, Nature, 2020, 588, 250–253 CrossRef CAS PubMed.
- F. Orr, L. Scriven and A. Rivas, J. Fluid Mech., 1975, 67, 723–742 CrossRef.
- P. Bampoulis, J. P. Witteveen, E. S. Kooij, D. Lohse, B. Poelsema and H. J. W. Zandvliet, ACS Nano, 2016, 10, 6762–6768 CrossRef CAS PubMed.
- S. Loi, G. Sun, V. Franz and H.-J. Butt, Phys. Rev. E: Stat., Nonlinear, Soft Matter Phys., 2002, 66, 031602 CrossRef PubMed.
- M. L. Gee, T. W. Healy and L. R. White, J. Colloid Interface Sci., 1989, 133, 514–516 CrossRef CAS.
- A. I. Hienola, P. M. Winkler, P. E. Wagner, H. Vehkamki, A. Lauri, I. Napari and M. Kulmala, J. Chem. Phys., 2007, 126, 094705 CrossRef CAS PubMed.
- P. M. Winkler, R. L. McGraw, P. S. Bauer, C. Rentenberger and P. E. Wagner, Sci. Rep., 2016, 6, 26111 CrossRef CAS PubMed.
- M. Iwamatsu and H. Mori, Phys. Rev. E, 2019, 100, 042802 CrossRef CAS PubMed.
- V. D. Nguyen, F. C. Schoemaker, E. M. Blokhuis and P. Schall, Phys. Rev. Lett., 2018, 121, 246102 CrossRef CAS PubMed.
- M. Yarom and A. Marmur, Adv. Colloid Interface Sci., 2015, 222, 743–754 CrossRef CAS PubMed.
- A. V. Giessen and E. Blokhuis, J. Chem. Phys., 2002, 116, 302–310 CrossRef.
Footnote |
| † Electronic supplementary information (ESI) available. See DOI: 10.1039/D0NR08787D |
| This journal is © The Royal Society of Chemistry 2021 |