
 Open Access Article
 This Open Access Article is licensed under a Creative Commons Attribution-Non Commercial 3.0 Unported Licence
Hyperspectral-enhanced dark field analysis of individual and collective photo-responsive gold–copper sulfide nanoparticles†
Paula
Zamora-Perez
 a,
Beatriz
Pelaz
b,
Dionysia
Tsoutsi
a,
Mahmoud G.
Soliman
cd,
Wolfgang J.
Parak
c and
Pilar
Rivera-Gil
*a
a,
Beatriz
Pelaz
b,
Dionysia
Tsoutsi
a,
Mahmoud G.
Soliman
cd,
Wolfgang J.
Parak
c and
Pilar
Rivera-Gil
*a
aIntegrative Biomedical Materials and Nanomedicine Lab, Department of Experimental and Health Sciences (DCEXS), Pompeu Fabra University (UPF), Biomedical Research Park (PRBB), carrer Doctor Aiguader 88, 08003 Barcelona, Spain. E-mail: pilar.rivera@upf.edu
bCentro Singular de Investigación en Química Biolóxica e Materiais Moleculares (CIQUS), Grupo de Física de Coloides y Polímeros, Departamento de Química Inorgánica, Universidade de Santiago de Compostela, Santiago de Compostela, 15782, Spain
cCenter for Hybrid Nanostructures, Universität Hamburg, 22607 Hamburg, Germany
dPhysics Department, Faculty of Science, Al-Azhar University, Cairo, Egypt
First published on 2nd August 2021
Abstract
We used hyperspectral-enhanced dark field microscopy for studying physicochemical changes in biomaterials by tracking their unique spectral signatures along their pathway through different biological environments typically found in any biomedical application. We correlate these spectral signatures with discrete environmental features causing changes in nanoparticles’ physicochemical properties. We use this correlation to track the nanoparticles intracellularly and to assess the impact of these changes on their functionality. We focus on one example of a photothermal nanocomposite, i.e., polymer-coated gold/copper sulfide nanoparticles, because their performance depends on their localized surface plasmon peak, which is highly sensitive to environmental changes. We found spectral differences both in the dependence of time and discrete environmental factors, affecting the range of illumination wavelengths that can be used to activate the functionality of these types of nanoparticles. The presence of proteins (protein corona) and the increase in ionic strength induce a spectral broadening towards the NIR region which we associated with nanoparticles’ agglomeration. In acidic environments, such as that of the lysosome, a red shift was also observed in addition to a decrease in the scattering intensity probably associated with a destabilization of the proteins and/or the change in the net charge of the polymer around the nanoparticles. We observed a loss of the photo-excitation potential of those nanoparticles exposed to acidic conditions in the <600 nm spectral rage. In a similar manner, ageing induces a transitioning from a broad multipeak spectrum to a distinct shoulder with time (up to 8 months) with the loss of spectral contribution in the 450–600 nm range. Hence, a fresh preparation of nanoparticles before their application would be recommended for an optimal performance. We highlight the impact of ageing and the acidic environment on the responsiveness of this type of plasmonic nanoparticle. Regardless of the spectral differences found, polymer-coated gold/copper sulfide nanoparticles retained their photothermal response as demonstrated in vitro upon two-photon irradiation. This could be ascribed to their robust geometry provided by the polymer coating. These results should be useful to rationally design plasmonic photothermal probes.
Introduction
Bio-nanotechnology aims at designing, engineering, and applying nanomaterials and nanotools for the diagnosis and therapy of diseases among other applications. Examples of such nanomaterials are those with unique photo-physical or magnetic properties for sensing, imaging, and photodynamic or radiation therapy,1–3 and those with thermo/magnetic-responsive properties that allow their remote manipulation (such as on demand opening or targeting),4–6 or their use for hyperthermia treatment of tumors.7–9 There are many materials with outstanding nanoscale control over the composition, size, and shape and they have potential biomedical applications.10 However, an extremely small portion of the huge variety of nanostructures assembled in research laboratories are translocated to clinics. The reasons for the relatively poor translation from development to clinics are not only fundamental problems such as targeted delivery or biocompatibility, but also failed interaction between fabrication and application. Often there is a deficient biological (and toxicological) characterization of the materials, mostly due to a lack of full control over the nanomaterial physicochemical properties.11–15 Even for relatively simple questions, such as labelling of cells with nanoparticles (NPs), the relationship between the biological effect, e.g., uptake efficiency of NPs, and physicochemical parameters such as the size of the NPs is not trivial to understand.12,16–19 Biomedical nanomaterials are dynamic systems changing their physicochemical properties upon their interaction with the physiological milieu. Changes in these properties can induce a performance loss. Therefore, it is strictly necessary to better elucidate the behavioral patterns of nanostructured materials in the physiological milieu and to correlate this with the physicochemical parameters of the materials such as their geometry, size, composition, and charge.12,13,20–22 Only in this way, the cellular response can be anticipated and the interactions of the materials with the cells and the cellular environments can be controlled.11,13,14 The final aim is to maintain the NP physicochemical properties in complex media (like the biological milieu) that are responsible for their functionality because they are likely to change, thus decreasing NP performance.An example of the profitability of such a correlation is the use of plasmonic NPs for photothermal therapy (PTT).9,23 In recent years, photothermal therapy assisted with nanoprobes for cancer treatment has been extensively studied to improve the low selectivity, aggressiveness, and systemic/regional side effects of chemotherapy.52 One of the main advantages is the sensitization of tumor cells to regular treatments such as radiation and chemotherapy.53–58 Heat also causes other positive effects such as alterations in the tumor blood flow and environment, and immune response activation.59,60 NP-based photothermal probes are designed to be excited at a specific plasmon resonance maximum to induce heat and damage of tumor cells. The plasmon resonance wavelength is highly sensitive to the NPs’ geometry and the environment.24–26 Exposure of the NPs to the tumour cells induces uptake and clustering into vesicles of different compositions and pH values.27,28 This results in changes in the surface plasmon resonance wavelength, affecting absorption and heat production, and therefore has a clear impact on performance. This highlights the importance of performing appropriate characterization of nanomaterial interactions with physiological fluids, and biological barriers such as the plasma membrane or endocytic vesicles. This enables better designing and engineering of applicable NPs, which are robust to changes of environmental conditions, thus ensuring performance maintenance. Such performance is ultimately the major metrics to establish the clinical relevance of nanostructured materials.
Hyperspectral-Enhanced Dark Field Microscopy (HEDFM) is currently being implemented in nanomedicine as a promising method for the study of NP–environment interactions (see the scheme in Fig. 1).24,29–33 It provides in situ, real time, long-term, fast-reaction, and label-free optical observation of a wide range of nanomaterials while they interact with biological-based matrices. The interaction of the nanomaterial with light generates characteristic scattering profiles that act as spectral signatures for their in vitro tracking30,31,34–36 and also act as scatterers for advanced cardiovascular in vivo imaging.37 In this way, changes in the physicochemical properties of the nanomaterials upon interaction with the environment can be tracked over time.30,33,36,38–40 HEDFM allows for high resolution and long-term studies in live cells/tissues and optionally also under flow conditions if required. Live and real-time monitoring of cell-induced individual and collective changes in NPs is achieved due to negligible phototoxicity produced by the low power light source. HEDFM provides imaging of low contrast objects in a label-free manner with nanometer resolution, together with spectral and spatial information, engaging non-contact and remote sensing. Other advantages over other techniques such as electron microscopy include its non-invasive operability with simple sample manipulation under standard environmental conditions.29 HEDFM best permitted the direct dynamic analysis of individual and collective particle evolution by tracking the scattering profiles of the nanomaterial in different media,30 and particle–particle and particle–environment interaction patterns under different conditions such as pH values, polarity, cellular milieu, and over time.33
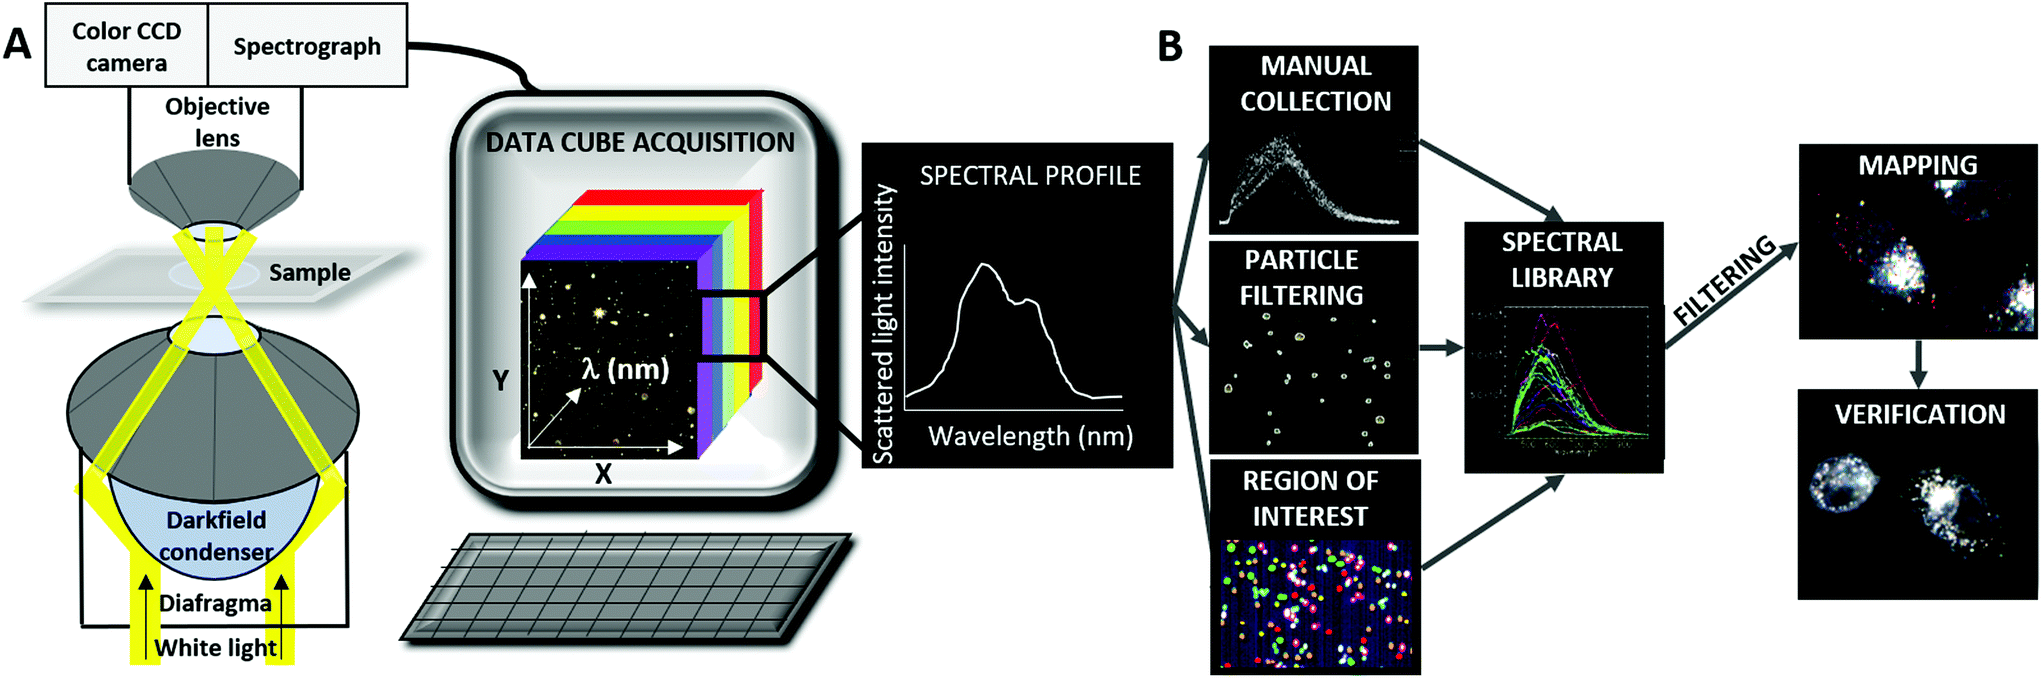 | ||
| Fig. 1 Schematic representation of the HEDFM set-up and the data analysis process. (A) Imaging system that allows spatio-spectral data cube acquisition for the characterization of nanomaterials in the visible-NIR spectral range (400–1000 nm); (B) mapping workflow description: (i) first, the spectral library (SL) is created by collecting the spectra of interest from the HDC of NPs. The spectral profiles can be compiled manually by using software tools for NP filtering or analysis of regions of interest (ROIs); (ii) then, the SL of the NPs is filtered against the spectral data of cells to remove spectral coincidences; (iii) after that, the resultant SL is mapped in the HDC of the cells exposed to NPs using the Small Angle Mapper (SAM) algorithm; and (iv) finally, the SL of the NPs is mapped into the HDC of unexposed control cells using the same parameters to confirm no identification of NPs with the algorithm.33 | ||
Our aim is to study the effectiveness of HEDFM for sensing (probing) and tracking changes in the NPs’ physicochemical properties potentially affecting cellular responses (i.e., toxicity) or NPs’ functionality. We selected polymer-coated gold/copper sulfide (Au/CuS) NPs as a candidate for HEDFM evaluation owing to their unique plasmonic properties41–43 and potential for two-photon excitation (2PE) photothermal therapy (PTT)44–47 in triple-negative breast cancer (TNBC) cells.48–50 The dynamic characterization of NP evolution in different biological media is especially relevant for plasmonic NPs. Their performance as photothermal probes or for sensing2,51 is attributed to the presence of light-induced localized surface plasmons which are highly sensitive to the environment, NP geometry, or NP aggregation state. These factors change during NP interactions with cells, and therefore, their optical properties and consequently also their performance can be affected.
Our results confirm the use of polymer-coated Au/CuS NPs as biocompatible, two-photon-assisted photothermal probes regardless of the changes in the NP geometry (composition and shape) induced by the cellular environment. We further demonstrate the effectiveness of HEDFM for the dynamic analysis of the evolution of individual and collective NPs based on their scattering signature generated upon particle–environment interactions. The analysis is performed by creating a spectral library of NPs based on their behavior when key environmental parameters are individually changed. Those key parameters are the ionic strength, pH, protein corona, solvent polarity, and time. These conditions are known to change the physicochemical properties of the NPs and are therefore potentially connected to toxicity or dysfunctionality.
Methods
Synthesis and polymer coating of Au/CuS nanoparticles
The NPs have been kindly provided by Huan Wang, Wenhua Li and Zhishan Bo, Department of Chemistry, Beijing Normal University, Beijing, 100875, P. R. China. The synthesis procedures have been published previously.61 Afterwards, Au/CuS NPs were transferred to water using an amphiphilic polymer (poly(isobutylene-alt-maleic anhydride)-graft-dodecylamine, PMA). This methodology has been previously reported.62–64 Here, the number of polymer monomers per NP's surface area was experimentally optimized to the value of RP/area = 1000 nm−2. The concentration of the NPs was determined by inductively coupled plasma mass spectrometry (ICP-MS) combined with transmission electron microscopy (TEM) to elucidate the NP size and morphology.63 After the completion of the polymer coating process, the NPs were cleaned from the excess of empty polymer micelles using centrifugation. The samples were cleaned 3 times with Milli Q water after their centrifugation at 12![[thin space (1/6-em)]](https://www.rsc.org/images/entities/char_2009.gif) 500 rpm for 20 min. The centrifugation conditions were also optimized to warrant the integrity of the NPs. The NPs were characterized by TEM, ICP-MS, dynamic light scattering (DLS), photon correlation laser Doppler anemometry (LDA), gel electrophoresis, and HEDFM. The NPs were filtered under sterile conditions using a sterile 0.2 μm syringe filter before their use in vitro. The final stock solution had a NP concentration of 1.08 μM. We refer the reader to the first section of the ESI (cf. Section 1†) for more exhaustive information on surface coating, concentration determination, and the physicochemical characterization of the NPs.
500 rpm for 20 min. The centrifugation conditions were also optimized to warrant the integrity of the NPs. The NPs were characterized by TEM, ICP-MS, dynamic light scattering (DLS), photon correlation laser Doppler anemometry (LDA), gel electrophoresis, and HEDFM. The NPs were filtered under sterile conditions using a sterile 0.2 μm syringe filter before their use in vitro. The final stock solution had a NP concentration of 1.08 μM. We refer the reader to the first section of the ESI (cf. Section 1†) for more exhaustive information on surface coating, concentration determination, and the physicochemical characterization of the NPs.
Cell culture
MDA-MB-231 human TNBC cells (ATCC® HTB-26)65 were cultured and maintained in Dulbecco's modified Eagle's medium/Nutrient Mixture F-12, DMEM/F-12 (Gibco, 11330-057) supplemented with 10% fetal bovine serum (complete cell growth medium, GM), FBS (Sigma-Aldrich, F0804), and 1% penicillin/streptomycin (GE Healthcare Hyclone, SV30010). For cell passaging, the cells were washed with 1× phosphate buffered saline (PBS) (GE Healthcare Hyclone, SH30028.02) and exposed to trypsin phenol red (Gibco, 25300062) for 5–10 minutes. After that, trypsin was inactivated with GM and the cells were cultured at 1:10 dilution for subsequent cell maintenance. The cells were cultured at 37 °C under a 5% CO2 modified atmosphere.
Cellular uptake of polymer-coated Au/CuS nanoparticles by confocal laser scanning microscopy
MDA-MB-231 TNBC human cells were seeded on glass coverslips and incubated for 24 hours in GM for proper cell attachment. Then, polymer-coated Au/CuS NPs at 5 nM in GM were added to the cells and incubated for 3 hours. After NP exposure, the supernatant was removed, and the cells were washed twice with PBS 1× to remove the non-internalized NPs. Moreover, 1 μM LysoTracker Red DND-99 (Life Technologies, L7528) solution in PBS 1× was added to the cells and incubated for 20 minutes at 37 °C, 5% CO2. Finally, the cells were washed with PBS 1× and placed in GM for imaging. Images were acquired with a 543 nm He/Ne laser, using a Leica TCS SP2 laser scanning confocal microscope (Leica Microsystems, IL, USA). Image processing was performed with Fiji.66Cytotoxicity of polymer-coated Au/CuS nanoparticles
Concentrations of polymer-coated Au/CuS NPs from 3.75 to 60 nM were tested in MDA-MB-231 human TNBC cells to check their cytotoxicity. The cells were incubated at 37 °C with 5% CO2 for 24 hours before NP incubation in a clear-bottom-96-well plate. After that, NPs with different concentrations of (100 μL per well) were added to cells and incubated for 3 hours. Then, the tested solutions were removed and washed with PBS 1×, before leaving the cells in the incubator with 10% v/v resazurin-based solution in GM (100 μL per well) for 3 hours. Finally, the fluorescence emission of all tested conditions was recorded at 585 nm with a Cary Eclipse fluorescence spectrophotometer (Agilent technologies, CA, USA). Cell viability was assumed to be proportional to the recorded fluorescence intensity. The values were normalized to cells which had not been exposed to NPs. See the ESI, Section 2† for more information.In vitro photothermal treatment using polymer-coated Au/CuS nanoparticles
MDA-MB-231 human TNBC cells were seeded on 35 mm-diameter dishes, and incubated for 24 hours at 37 °C, with 5% CO2 in GM. Then, a solution of 15 nM polymer-coated Au/CuS NPs was prepared in GM and the cells were exposed to this concentration for 3 hours. Afterwards, the cells were washed to remove the excess of NPs and placed in a solution of 100 nM DAPI (4′,6-diamidino-2-phenylindole) in PBS 1×. DAPI is a cell impermeable dye that only enters the cells when cell membrane damage is induced, for example, by hyperthermia. Immediately after the addition of DAPI, images before and after 2PE (830 nm; Mai Tai DeepSee, Spectra-Physics) were taken within 10 minutes with an upright Leica TCS SP5 CFS confocal microscope. Also, non-treated cells were irradiated to prove that the damage was not caused by the laser irradiation itself. An exhaustive explanation and further results on the cellular uptake of the NPs, cytotoxicity, and photothermal efficiency are presented in the ESI (cf. Section 2†).HEDFM of polymer-coated Au/CuS nanoparticles
The HEDFM system (CytoViva Inc., Auburn, AL, USA) consists of an Olympus BX51 microscope with a dark field condenser mounted and coupled to a spectrograph “V10E 2/3” attached to a CCD Imperx IPX-2M30 camera. The hyperspectral system collects the light scattered by the samples every 2 nm in a wavelength range of 400–1000 nm. Afterwards, the dark field image (DFI) is composed of the spectral information following a red-green-blue (RGB) color code. As a result, each pixel of the image contains one spectrum. The DFI with the spectral information is known as a hyperspectral data cube (HDC).30 The detector collects the signal from 450 nm due to white light excitation; therefore, there is no signal acquired at earlier wavelengths. Fig. 1A shows a scheme of this setup. A detailed explanation of the workflow is provided in cf. ESI Section 3, Fig. 11.†30 Polymer-coated Au/CuS NPs were diluted from the 1.08 μM stock solution to the optimal concentration (>150 NPs per HDC) using different media: Milli Q water, PBS 1×, GM at neutral pH 7, and GM at pH 4 (tuned by using 0.1 M HCl solution). After sonication of the NPs in the solutions, 5 μL of each sample were placed onto a clean microscope slide, and covered with a glass coverslip. Acquisitions were made with an exposure time of 0.3 milliseconds. Once the HDCs were acquired with the ENVI 4.8 software (Exelis Visual Information Solutions, Boulder, CO, USA), spectral analysis was performed using different approaches (cf. ESI Section 3†). The lamp spectrum was subtracted from all the spectra considered in this work.
The spectral changes related to the presence of protein corona were studied using the HDCs mentioned above (cf. ESI Section 4†). A comparison between agglomerated NPs with protein corona and primary NPs in the presence or absence of protein corona was made using manual acquisition of single particle spectra. In addition, the spectral features of different agglomerates were studied using the region of interest (ROI) tool. Concerning the analysis of polymer-coated Au/CuS NPs over time, HDCs were taken at different time points: at time 0, and after 2, 5, and 8 months (cf. ESI Section 5†). Afterwards, the particle filter analysis tool was used to identify and collect the spectral profiles of each NP of interest. Then, the spectral information of the NPs was exported as different ROIs which were classified into different subpopulations depending on their number of pixels that form the light spots. The ROIs related to the same interval size were merged to obtain a mean spectral profile for each subpopulation. A summary of the methods mentioned for data analysis is presented in Fig. 1B.
HEDFM of cells exposed to polymer-coated Au/CuS nanoparticles
MDA-MB-231 human TNBC cells were seeded onto glass coverslips at 2 × 10⁵ cells per well and incubated for 24 hours in GM. The cells were exposed to polymer-coated Au/CuS NPs at 15 nM NP concentration for 3 hours and washed afterwards with PBS 1×. For live cell imaging and spectral characterization, coverslips were positioned onto microscope slides. Then, the HDCs were taken with the HEDFM imaging system using an objective lens of 60×. Control cells without NPs were also imaged for particle filtering and the verification process. The resultant HDCs were analyzed with the ENVI 4.8 software (Fig. 1).30Spectral mapping of intracellular and extracellular polymer-coated Au/CuS nanoparticles
The HDCs of the polymer-coated Au/CuS NPs in neutral GM (ESI, Section 3†) simulating extracellular and early endosome fluid conditions were lamp corrected and resized. Then, an extensive ROI was determined manually for the polymer-coated Au/CuS NPs. The ROI was converted to an SL and filtered against the HDC of control cells using the Small angle mapper (SAM) algorithm set at 0.1 radians. After that, the filtered SLs were sorted into different subsets. The different subsets were mapped in the HDCs of cells with NPs and the spectra with higher number of pixels were identified and selected for the final mapping. The subsets were tested using a parameter of 0.1 radians for the mapping procedure. Recognized spectra were converted into false-color images. The non-identified spectra were not classified. The mapping process is shown in Fig. 1B and further explained in cf. ESI Section 6.† The same procedure was followed for the HDCs of polymer-coated Au/CuS NPs under acidic conditions (pH 4) simulating the lysosomal intracellular fluid, obtaining the SLs (cf. ESI Section 3†). The two SLs of NPs in the simulated cellular fluids (neutral and acidic) were mapped against the MDA-MB-231 human TNBC cells exposed to 15 nm polymer-coated Au/CuS NP solution for 3 hours. The relative abundance of the pixels mapped per cell for the two SLs was calculated using the ROI tool, analyzing a total of 14 cells. For the verification of the spectra mapped, the two SLs were mapped in the HDC of the cells unexposed to NPs, confirming that no spectrum was matched (cf. ESI Section 6†) and that all the spectra belonged to the NPs.Statistical analysis
All data are expressed as the mean ± standard error of the mean (SEM). Significance between data sets was determined by a one-way ANOVA test followed by Dunnett's post-test, with an asterisk for p-values ≤0.05. Three independent sample sets were run for each experiment (n = 3). “One-way ANOVA with Bonferroni's post-test was performed using GraphPad Prism version 5.01 for Windows, GraphPad Software, San Diego California USA, http://www.graphpad.com”.Results and discussion
Bio-physicochemical characterization of polymer-coated Au/CuS nanoparticles
The NPs selected for this work comprise a spherical gold (Au) nanoparticle anchored to a semiconductor domain, copper sulfide (CuS). The final size of the hybrid structure is 25 nm. CuS nanostructures are easy to synthesize at low costs and the NPs show good conductivity, small particle size, and particular optical properties.42,67–70 CuS absorbs in the near infrared (NIR) region and is well-suited for photo-responsive applications. The plasmonic properties of Au strongly enhance the local electromagnetic field and therefore the absorption capacity of CuS.42,69,71 The combination of both nanomaterials results in the improvement of the optical properties compared to their individual counterparts. The improvement in the absorption ability of the resultant nanomaterials is interesting for photo-responsive applications such as PTT where the energy absorbed is transformed into heat.7,8 The absorption enhancement of the NPs is translated into a lower energy required from the laser irradiation for PTT.62,70,72,73Initially hydrophobic Au/CuS NPs (Fig. 2A “Chloroform” and cf. ESI Section 1.1†) were coated with an amphiphilic polymer, PMA (cf. ESI Section 1.2†), to render the NPs hydrophilic and thus providing them colloidal stability in aqueous solution.74 The water transfer process reshaped the morphology of the NPs (Fig. 2A “Water” and Fig. S1-Section 1.3†). Despite this structural change, the NPs maintained their optical behavior and their NIR absorption (Fig. 2B) even after days in PBS 1× solution (Fig. S3-Section 1.4†). To measure the size, two different histograms were produced considering that once in water, the Au NPs were normally localized as satellites of the CuS domains. The resulting inorganic core diameters as determined by TEM were 9.4 ± 1.4 nm and 19.9 ± 2.6 nm for the Au and CuS nanostructures, respectively (Fig. 2C). Fig. 2D shows the NPs’ hydrodynamic diameter and zeta potential values (plots shown in cf. ESI Section 1.5, Fig. S4†). Fig. 2E shows the improved optical response of Au/CuS required for two-photon PTT when comparing the extinction spectra of Au, CuS, and Au/CuS NPs, respectively. The electrophoretic mobility of the NPs was also tested in comparison with control Au NPs of 10 nm modified with phosphine (cf. ESI Section 1.5, Fig. S5†).75 All the results confirm that the narrow size distribution of the NPs after their water transfer is maintained, despite the structural changes. The resulting NP concentration in solution was determined by combining the results obtained from TEM and ICP-MS (cf. ESI Section 1.3†).63
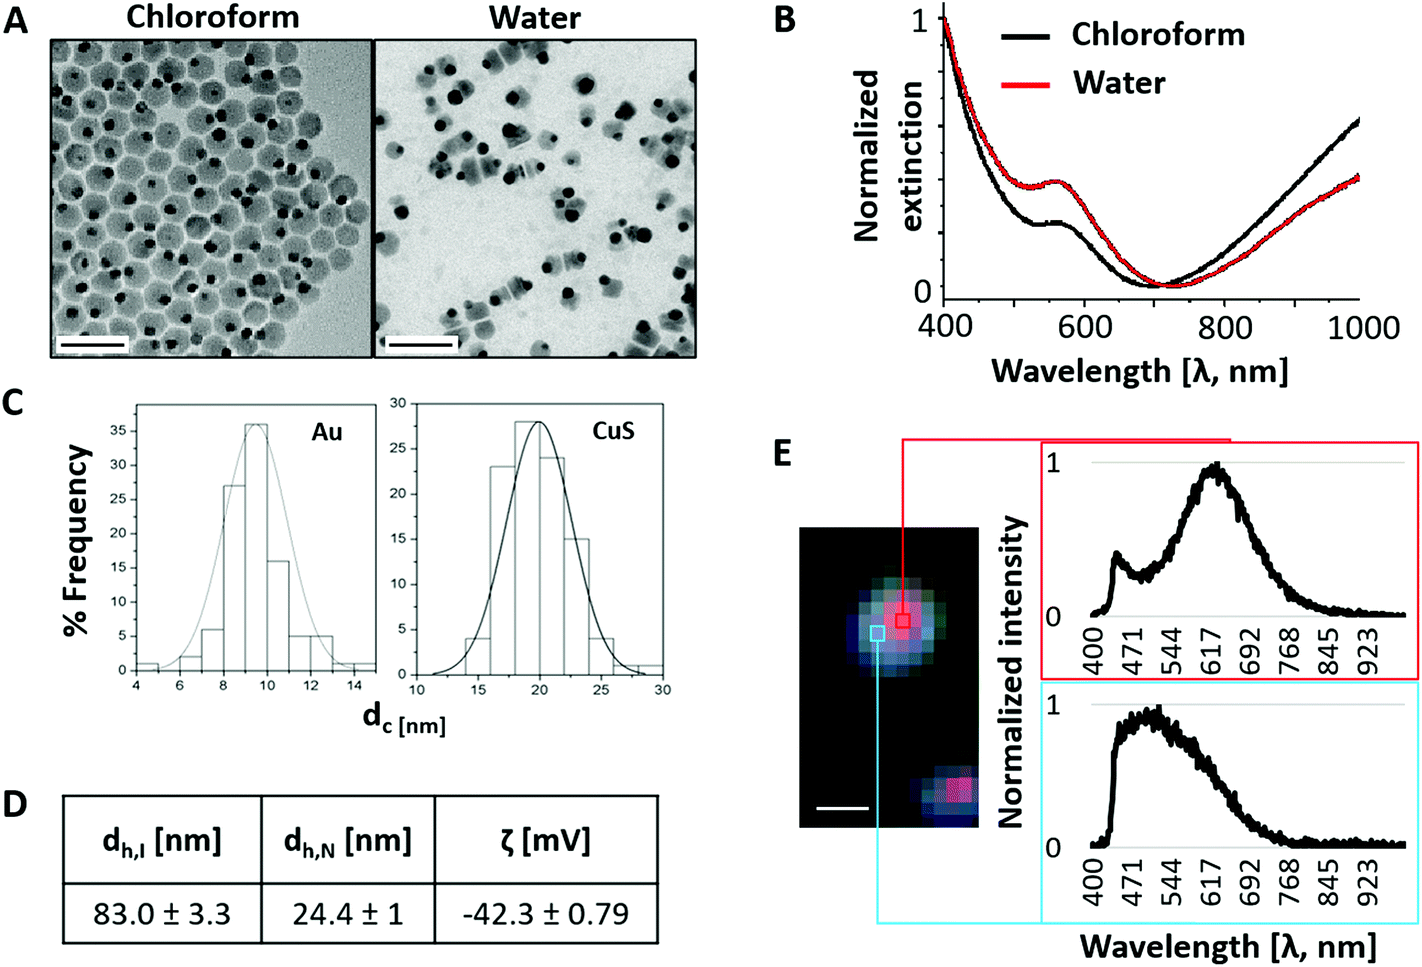 | ||
| Fig. 2 Characterization of polymer-coated Au/CuS nanoparticles. (A) TEM images of Au/CuS NPs before (left) and after (right) their overcoating with an amphiphilic polymer and subsequent transfer to the aqueous phase. Scale bar: 50 μm. (B) Normalized extinction spectra of the particles before (red) and after (black) polymer coating and water transfer; (C) histograms showing the size distribution (diameter) of Au and CuS parts as determined from TEM images; (D) determination of the hydrodynamic diameter of NPs in water by the intensity (dh,I) and number (dh,N) using DLS; and (E) dark field image showing the scattering properties of the NPs and the relevant spectral profiles of a single particle. The maximum intensity for each pixel has been set up to 1. | ||
Additionally, we characterized the scattering properties of polymer-coated Au/CuS NPs through HEDFM (Fig. 2F and cf. ESI Section 1.6, Fig. S6†) showing two characteristic spectral profiles in the 600 nm (612–646 nm, red arrows, Fig. S6B-Section 1.6†) and 500 nm (461–582 nm, blue arrows, Fig. S6B-Section 1.6†) regions in individual NPs. The peak in the red region may correspond to the Au domain responsible for the electromagnetic field enhancement, whereas the peak in the blue region shows a multipeak band with lower intensity. This may correlate with the thin edges of the CuS nanoplate that might be more efficient at absorbing light than at scattering it. Remarkably, HEDFM can image single NPs smaller than 50 nm.76,77 To elucidate whether this was a single-particle or a collective effect, we mapped the two characteristic spectra found in the HDC of polymer-coated Au/CuS NPs in water (the original dispersion medium) (see Fig. S7-Section 1.6†). The pattern found in most of the light spots indicates a similar spectral behavior in water. We refer to the ESI, Section 1,† for further information related to the characterization of the nanomaterials.
Interaction of polymer-coated Au/CuS nanoparticles with cells
To characterize the impact of the NPs’ biological environment on their functionality as photo-responsive probes, their interaction with MDA-MB-231 TNBC human cancer cells was probed. We selected this cell model as it originates from a type of breast cancer that is resistant to conventional treatments and presents poor patient prognosis due to the lack of three surface receptors: progesterone, estrogen and HER2.48 TNBC represents an aggressive cancer type with a high recurrence rate and invasiveness.48–50 Thus, there is a clinical need of finding novel therapeutic strategies. In recent years, NP-assisted PTT has been studied as an alternative7,8 or complementary therapy to conventional cancer treatments characterized by a limited efficacy due to low-specificity systemic side effects.57,78The polymer-coated Au/CuS NPs were exposed to the cells after which we studied the internalization, and the intracellular fate, toxicity and therapeutic value of the NPs. The NPs were taken up and were found colocalizing with the lysosomes after 3 hours cellular exposure (Fig. 3A and cf. ESI Section 2.1†). In general, NPs’ uptake can follow diverse mechanisms depending on the NP size, shape, and charge.21,79–81 Most pathways involved vesicles maturating along their pathway. This maturation is specially characterized by a progressive decrease in the pH. Lysosomes present the highest acidic conditions (pH 5–4).28,82,83 They are a common destination for internalized NPs.82–85 To probe the potential cytotoxicity of the NPs, a fluorometric metabolic assay was employed. Viable cells metabolize the non-fluorescent product into a fluorescent metabolite; therefore, cell viability is correlated with an increase in fluorescence. The results (Fig. 3B and cf. ESI Section 2.2†) indicate that the polymer-coated Au/CuS NPs do not induce acute cytotoxicity for MDA-MB-231 cells at NP concentrations up to 30 nM. Even though the cellular viability at 60 nM of NPs is close to reaching the LC50 threshold (concentration of the NPs responsible for killing half of the cell population), the concentration range of ≤15 nM used in this work correlates with 90% cell viability. Our results indicate that polymer-coated Au/CuS NPs are as biocompatible as other reported CuS NPs.42,70,73,86,87 Copper-based NPs suffer from fast oxidation, regardless of their superior synthesis yielding control over the atomic structure and optothermal properties. As a result, toxic copper ions are leaked to the environment and contribute to killing cells in an uncontrolled manner.62,88,89 This effect has also been reported for other photothermal NPs.90–93 Copper plays a key role in human physiology, controlling different enzymatic processes.94,95In vivo metabolization of CuS NPs has been reported.94,96 The results showed a size-dependent hepatic and/or renal excretion.94,96 The slow dissociation rates of Cu ions from the NPs, combined with a metabolic elimination of Cu ions, is responsible for maintaining Cu homeostasis and preventing toxicity.94,96 Considering these results, we would expect similar degradation behavior for our NPs.
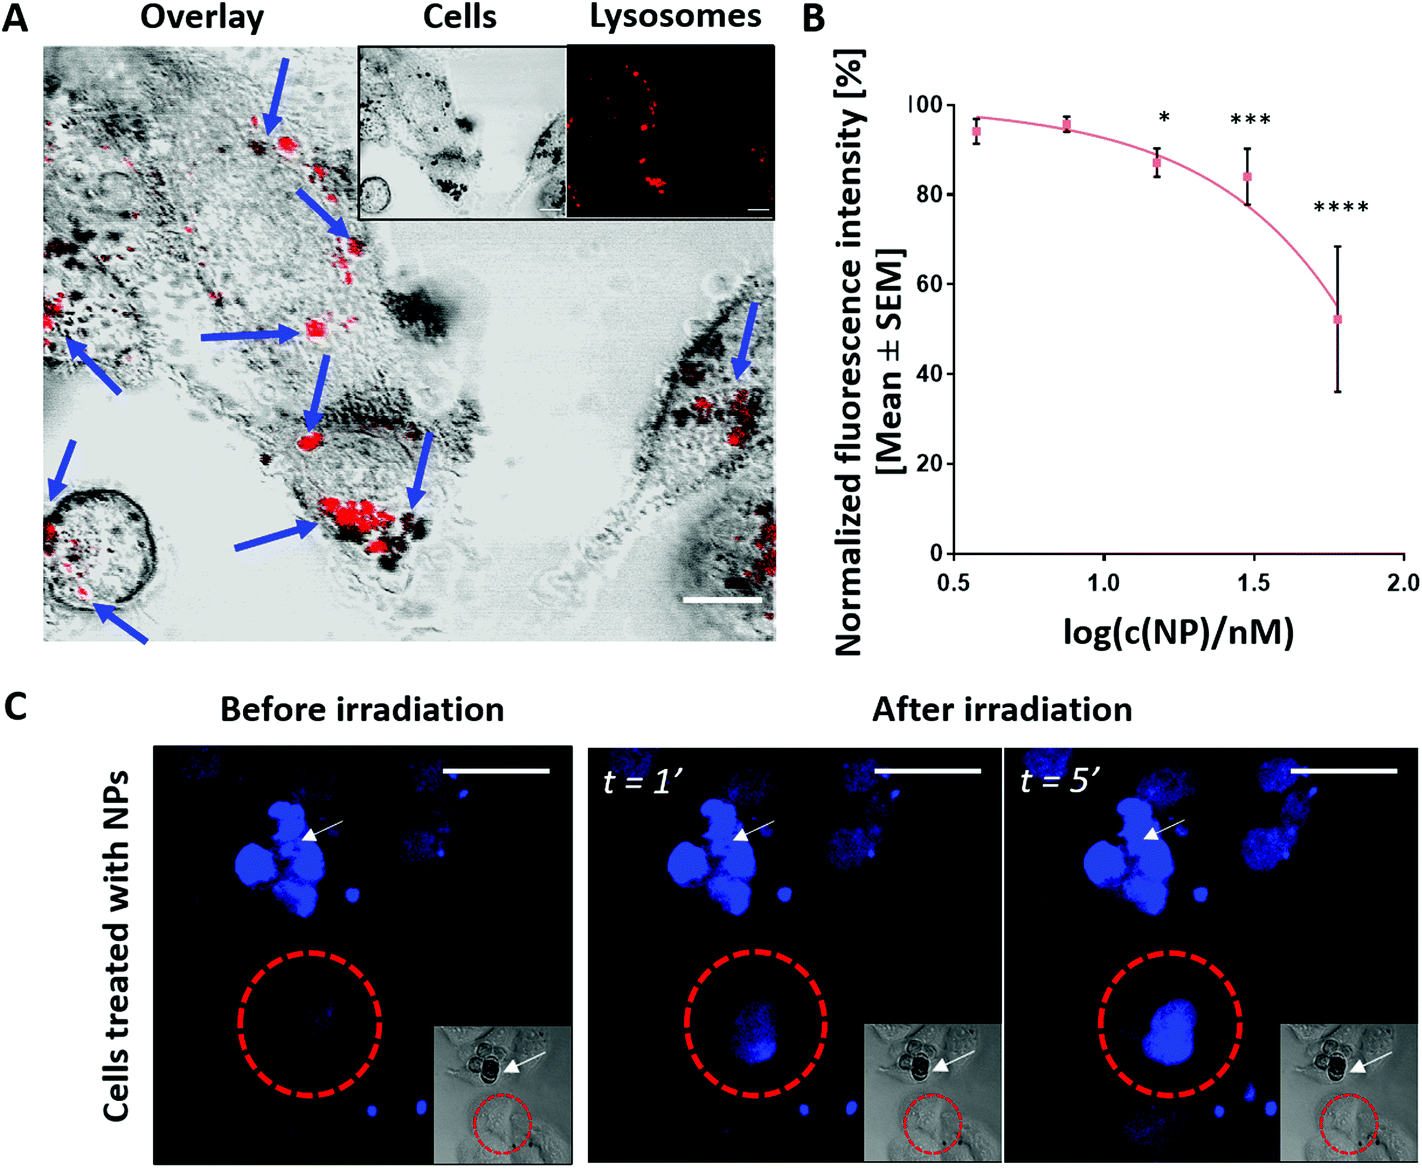 | ||
| Fig. 3 Interaction of polymer-coated Au/CuS nanoparticles with MDA-MB-231 TNBC human cells. (A) CLSM images presenting internalized NPs intracellularly confined in the lysosomes (red fluorescence signal) after 3 hours of incubation (see blue arrows). Bright field (cells) and fluorescence (lysosomes) single images are provided (insets); (B) viability assay of cells exposed to different concentrations of NPs; (C) CLSM images of cells taken before and after PTT with two photon emission at 830 (red circle). White arrows highlight the presence of dead cells with a blue fluorescence signal (DAPI). The insets show the bright field image of the cells. Scale bar: 10 μm. | ||
To validate the two-photon assisted photothermal activity of polymer-coated Au/CuS NPs, the cells were treated with the NPs and were irradiated with 2PE (830 nm). 2PE has several advantages over conventional one-photon excitation: (i) pinhole-free sectioning for the analysis of thick samples and 3D imaging reconstruction and (ii) deeper tissue penetration that empowers this technique for surgical applications.97–99 The increased photothermal effect is correlated with an increase in membrane permeability and cellular damage. We used DAPI as a positive indicator for hyperthermia-driven toxicity because it only penetrates cells upon membrane disruption. Because laser irradiation of NP treated cells caused a significant increase in the fluorescence signal (Fig. 3C (cf. ESI Section 2.3†)), we can confirm the photothermal activity of the NPs. In Fig. 3C, we show the nucleus of treated cells (indicated by a red circle) progressively labelled with DAPI (blue fluorescence signal) at 1 and 5 minutes after 2PE. However, in cf. ESI Section 2, Fig. S9B and S9C,† we observed that the fluorescence signal appears in the nucleus just 15 seconds after NP irradiation. The photothermal effect appears to be highly localized because only cells carrying the irradiated NPs were affected by the heat (see the ESI, cf. Section 2, Fig. S9B and S9C†). Cells non-treated with the NPs and irradiated with the laser maintained their viability (see the ESI, cf. Section 2, Fig. S9A†). These preliminary results indicate that polymer-coated Au/CuS NPs may possess improved photothermal properties as compared to CuTe NPs.62
Dark field imaging and hyperspectral analysis of polymer-coated Au/CuS nanoparticles interacting with dynamic biological environments
As mentioned in the Introduction, it is crucial to correlate the physicochemical properties of NPs with their biological behavior to maintain their functionality and to predict the responses of both systems (NPs and cells). In this work, we hypothesize the use of HEDFM to track changes in the physicochemical properties of the NPs caused by the environment which are susceptible to interfere with their performance. We selected plasmonic NPs because their therapeutic performance as photo-responsive probes depends on their spectral characteristics. We used HEDFM to track the NP physicochemical changes caused by cellular/biological environments.The spectral information of the polymer-coated Au/CuS NPs was first characterized in physiologically relevant environments known to affect the NPs’ morphology and with different refractive indexes (RI) ranging from 1.35 to 1.6.100 Changes in the refractive index are known to alter the plasmon peak, and as a result, the scattering profile recorded by HEDFM. We selected the following media: (i) water (ca. pH 7, RI 1.33);101 (ii) PBS solution characterized by a high ionic strength (ca. pH 7, 140 mM NaCl, RI 1.33101) known to affect colloidal stability because of NPs’ charge screening;102–104 (iii) a simulated extracellular and early endosome fluid (GM pH 7, RI 1.35101) with high ionic strength and content on macromolecules responsible for the formation of a dynamic protein corona around the NPs’ surface affecting cellular interactions;105–108 and (iv) a simulated intracellular lysosomal fluid (GM pH 4, RI 1.6100) where NPs frequently locate and which also affects the colloidal stability and the structure's integrity.79–81,109 We also tracked the optical changes in the NPs over time. NPs’ post-processing in the biological environment is a fact affecting colloidal stability and causing NPs’ reshaping.110
Fig. 4 shows the DFIs (insets) and the spectral signature acquired for polymer-coated Au/CuS NPs in the different dispersion media, i.e. water, PBS, GM pH 7, and GM pH 4. NPs in water (original NP dispersion medium, ca. pH 7, RI 1.3), shows a spectral profile with a maximum scattering peak at 556 nm. NPs transferred to high ionic strength (PBS, same pH and RI value as water) exhibit less spectral broadening, resulting in a narrower band towards smaller wavelengths compared to water likely due to the presence of salts affecting the polymer at the interface. However, when they were transferred from water to the simulated extracellular/early endosome fluid with a neutral pH and containing biomolecules (GM pH 7 in Fig. 4), the shape of the curve was maintained as in water but with a band maximum at 585 nm. This can be ascribed to an increase in particle size due to the interfacial protein corona because the RI and pH values are maintained.111 The adsorption of serum proteins (transport proteins and opsonins, among others) onto the surface of the NPs forms a complex corona, affecting the size, aggregation state, and interfacial composition of the nanomaterials, creating a distinct “biological identity”.112 Agglomerates are also visible in the DFI (white areas in the red-labelled inset of Fig. 4 and ESI cf. Section 3, Fig. S10†). Nonetheless, they were not included in the analysis. NPs’ agglomeration induces plasmon coupling, altering the overall spectral responses and patterns.26,113,114 In the simulated lysosomal fluid (“GM pH a” in Fig. 4), a pronounced shoulder appears at higher wavelengths upon acidification and increase of the medium's RI. Moreover, its light scattering profile shows two maxima, one at 528 nm and a more pronounced one at 619 nm. The acidic pH may affect the protonation status at the interface and consequently the stability of NPs.115 These results confirm that we can accurately identify spectral changes with enough sensitivity using this methodology as reported elsewhere.30,32,36
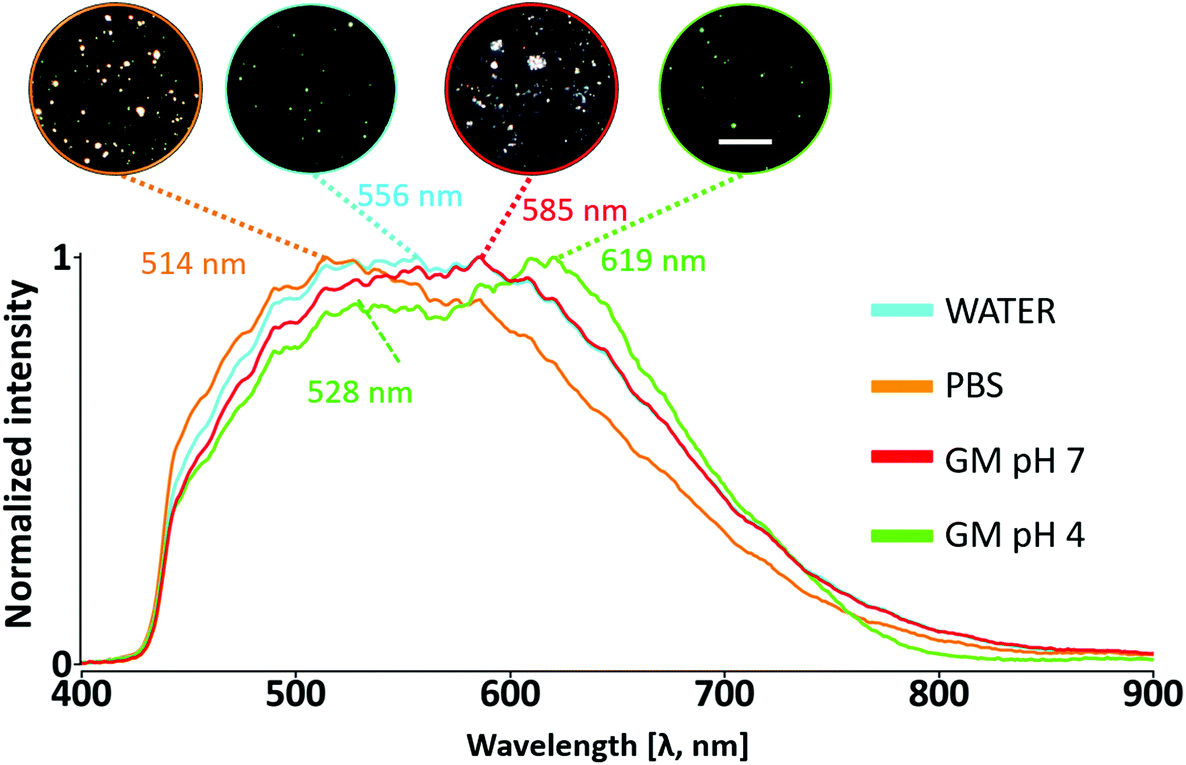 | ||
| Fig. 4 Spectral characterization of polymer-coated Au/CuS nanoparticles exposed to different environments. The mean spectral profiles of NPs exposed to water (blue), PBS (orange), GM at pH 4 (green), and GM at pH 7 (red) are plotted. The mean spectra were calculated as an average from 9275, 6318, 9520 and 10754 spectra. The numbers show the wavelength of the maximum intensity of scattered light. The insets show the dark field images of the NPs under analysis. Agglomerates were not included in this analysis. Scale bar: 10 μm. | ||
We also performed single particle spectral analysis of individual pixels randomly selected from the DFIs (ESI cf. Section 3, Fig. S10†) in the different environments. When comparing the spectra, the NPs in the original dispersant (water) and in neutral GM present a more consistent signature, while the NPs in PBS and acidic GM are more heterogeneous. Then we took the same HDC from Fig. S10† and sorted the light spots by the number of pixels, establishing different size ranges grouped by colors (ESI cf. Section 3, Fig. S11 and S12†).
We observed a homogeneous pattern in the behavior of the NPs in the different environments. The increase in the light spot size is correlated with a red shift of the maximum scattering peak inter- and intra-medium (ESI, cf. Section 3, Fig. S13†). The formation of the protein corona is a common behavior for NPs interacting with a biological system. The proteins change the physicochemical properties of NPs; for example, the hydrodynamic diameter increases, and the composition and charge vary at the interface.116 Therefore, we performed a more detailed analysis. Fig. 5 summarizes the mean scattering profile of NPs because of exposure to protein-rich media. Clearly visible agglomerates of different sizes lead to a heterogeneous multipeak spectral profile. The presence of proteins (“ROI 1, 2”) and increase in ionic strength (“ROI 4”) induce spectral broadening (ESI cf. Section 4.1, Fig. S14A†) compared to the response in the acidic environment (“ROI 3”). This broadening (“ROI 1”) in the NIR region (ca. 650–850 nm) occurs at the level of the whole agglomerate (Fig. 5) as well as at the level of individual pixels from the same agglomerate (ESI cf. Section 4.1 Fig. S14†). Similar spectral behavior has already been reported.32,36,117–119 Big agglomerates resulting from the presence of proteins in the media (“ROI 1”) exhibit a strong scattering variability that affects the signal intensity and spectral profile of each pixel (ESI cf. Section 4.1, Fig. S14†). Comparable results (ESI cf. Section 4.2, Fig. S15 and S16†) were found for other agglomerates (“GM pH 7”) which were excluded in previous analysis (Fig. 4, and ESI, cf. Section 4.1, Fig. S12 and S13†). The mean spectral profile for the NPs exposed to pH 4 (“ROI 3”) showed a different pattern including a red shift associated with agglomeration.32,36,120,121 A decrease in the scattering intensity in the range of ca. 450–600 nm was also observed, suggesting a prominent change in their physicochemical properties. The destabilization of the proteins and/or the change in the net charge of the PMA polymer may be responsible for this different optical response in acidic media (lysosomal conditions).116,122 The spectral studies in biological media indicate a loss of photo-excitation potential of the NPs exposed to acidic conditions in the <600 nm spectral rage. This effect is further analyzed in the following sections.
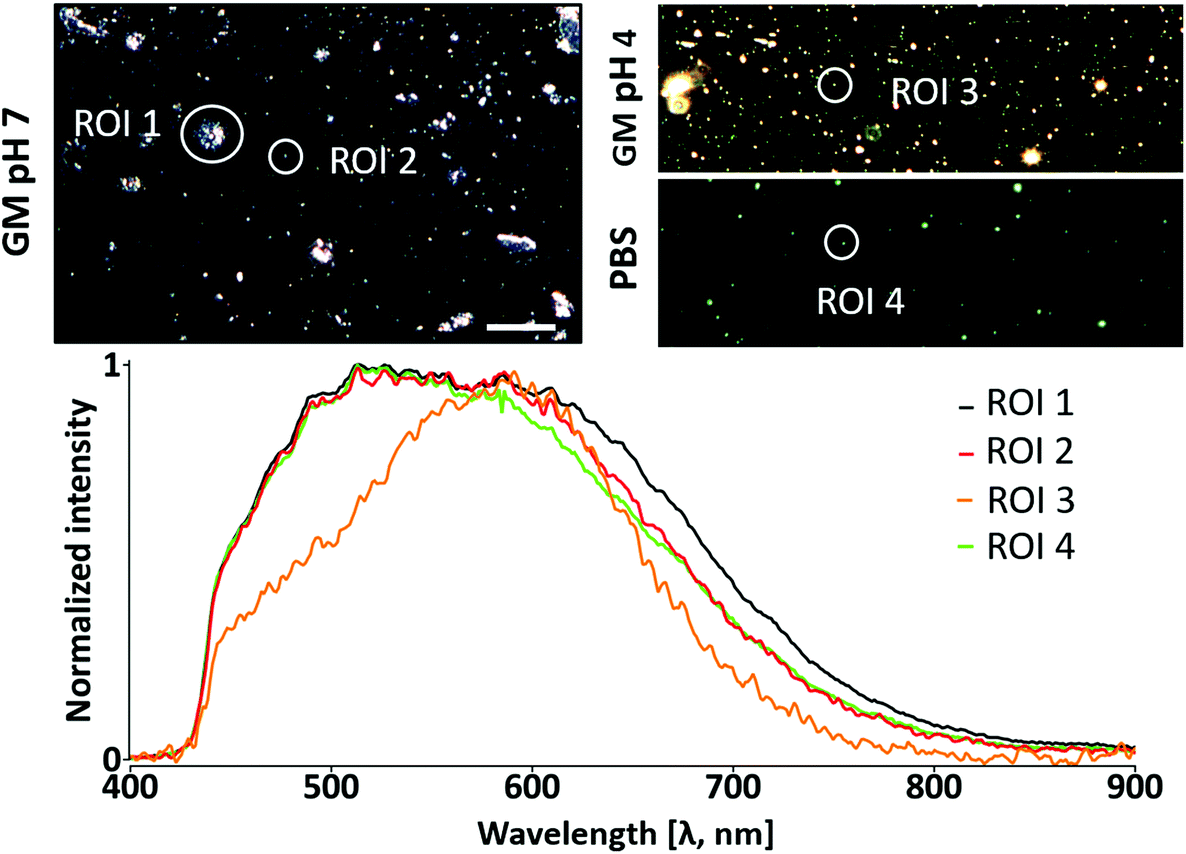 | ||
| Fig. 5 Spectral changes of polymer-coated Au/CuS nanoparticle agglomerates upon protein corona formation. Mean spectral profiles of agglomerated (ROI 1) and individually dispersed NPs with protein corona at neutral (ROI 2) and acidic pH (ROI 3). NPs without protein corona are presented in ROI 4. DFIs with the NPs under study are marked with white circles (top). The HDCs from Fig. 4 were analyzed in this plot. Scale bar: 10 μm. | ||
Spectral profile progression of polymer-coated Au/CuS nanoparticles in biological medium over time
We used a hyperspectral imaging system to characterize the NPs from HDCs (Fig. 6 and ESI cf. Section 5.1 Fig. S17†) obtained at t = 0 (HDC analyzed in Fig. 4 and 5) and after 2, 5, and 8 months of exposure in biological medium (GM pH 7, RI 1.35) to analyze the progression of the spectral profile over time. Fig. 6A shows the stabilization/homogenization of the mean spectral profiles of the false-colored yellow ROIs shown in Fig. 6B for the different time points. We observe the transitioning from a broad multipeak spectrum to a distinct shoulder with time. The spectral differences could be associated with a lowering in the size of the NPs as observed in the TEM images after 8 months (Fig. 6C). This is supported by the disappearance of the scattering signal at higher light spot sizes (ESI cf. Section 5.1 Fig. S17 and S18†). The same pattern of narrowing and loss of spectral contribution in the 450–600 nm range was observed under acidic conditions (t = 0 months) compared to the other environments (Fig. 5 and ESI cf. Section 3 Fig. S10 and S12†). These results prove that the time and pH dramatically alter NPs’ geometry and that these changes happen in the dispersant but also in cellular environments. Spectra of cells exposed to NPs (Fig. 7 – “GM pH 4”) were similar for intralysosomal polymer-coated Au/CuS NPs. The mean spectral profiles corresponding to different pixel ranges (ESI cf. Section 5.1 Fig. S17†) show the same profile pattern, indicating low variability in the spectral analysis at each time point. Within the same time point, the maximum scattering peak red shifts with increasing light spot size (ESI cf. Section 5.1 Fig. S17†). However, we could not elucidate if a red shift occurred because of the multipeak spectra. The range of the band maximum intensity goes from ca. 500 to 620 nm and corresponds to the range observed in the mean spectral profile of the NPs in this environment (Fig. 4 and 5).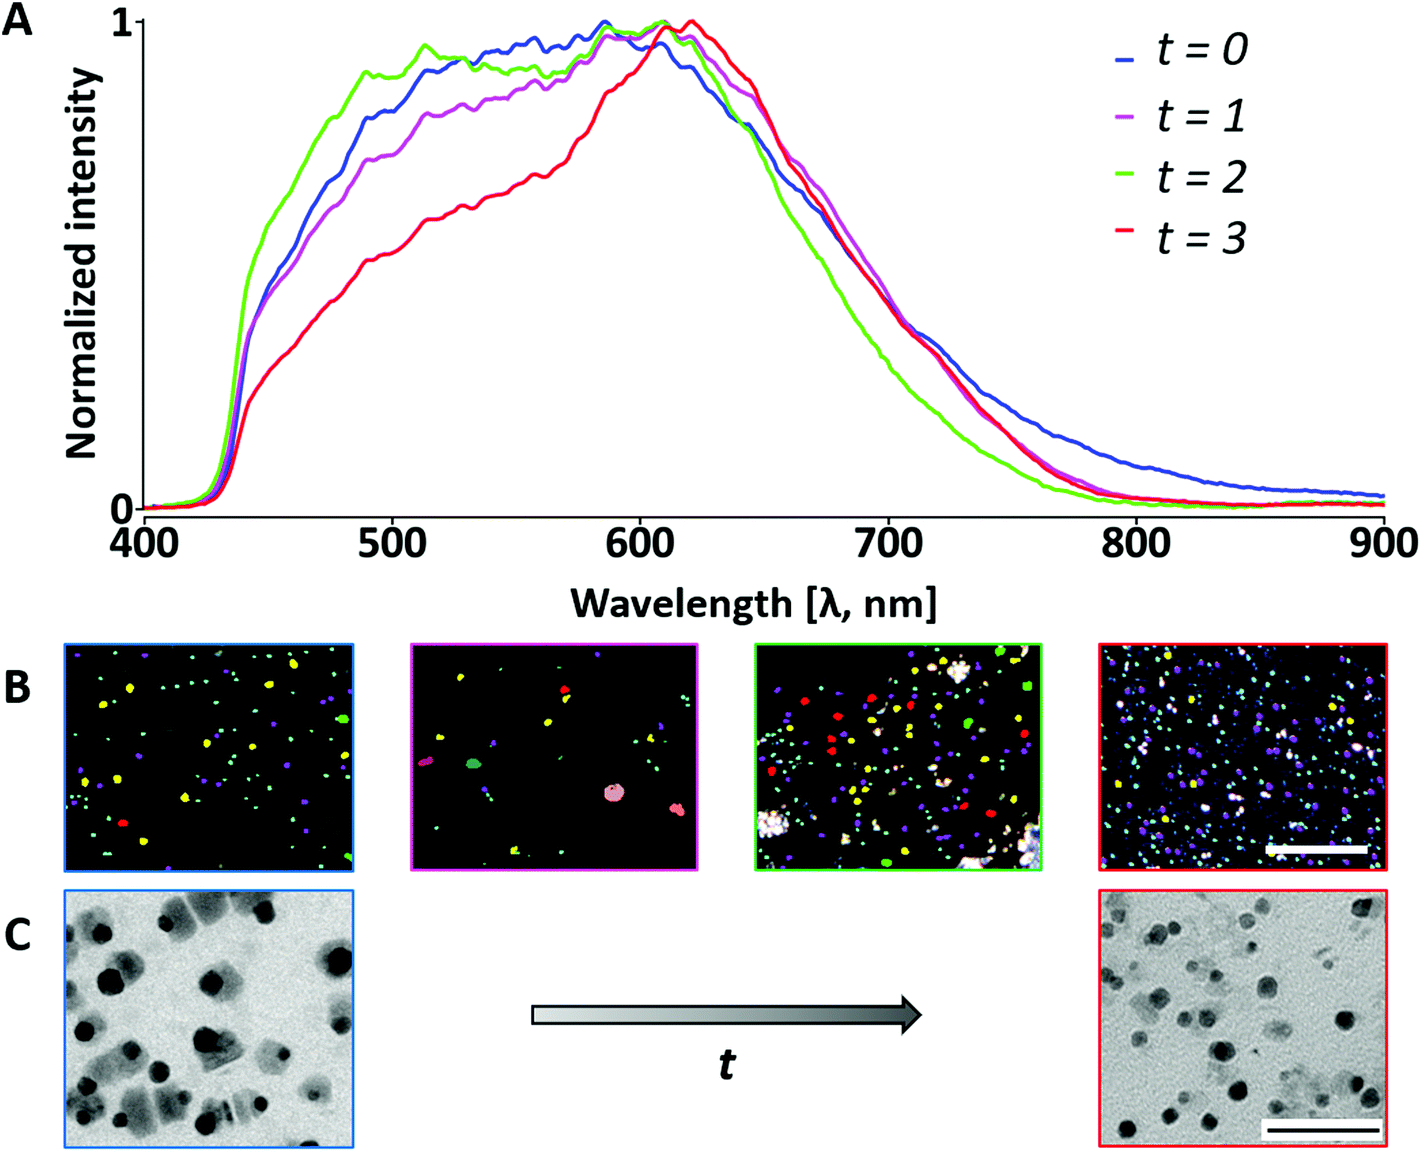 | ||
| Fig. 6 Spectral analysis of polymer-coated Au/CuS nanoparticles up to 8 months. (A) Mean spectral profiles of a subpopulation of NPs in neutral GM (yellow false-colored ROIs in DFIs) at different time points: t = 0, after 2 months (t = 1), 5 months (t = 2), and 8 months (t = 3); (B) DFIs of the NPs at the described time points with the population sorted by light spot sizes (pixels) presented with false-colored ROIs. Scale bar: 10 μm; (C) respective TEM images of the NPs at t = 0 and t = 3, where prominent changes in the morphology can be observed. Scale bar: 50 nm. | ||
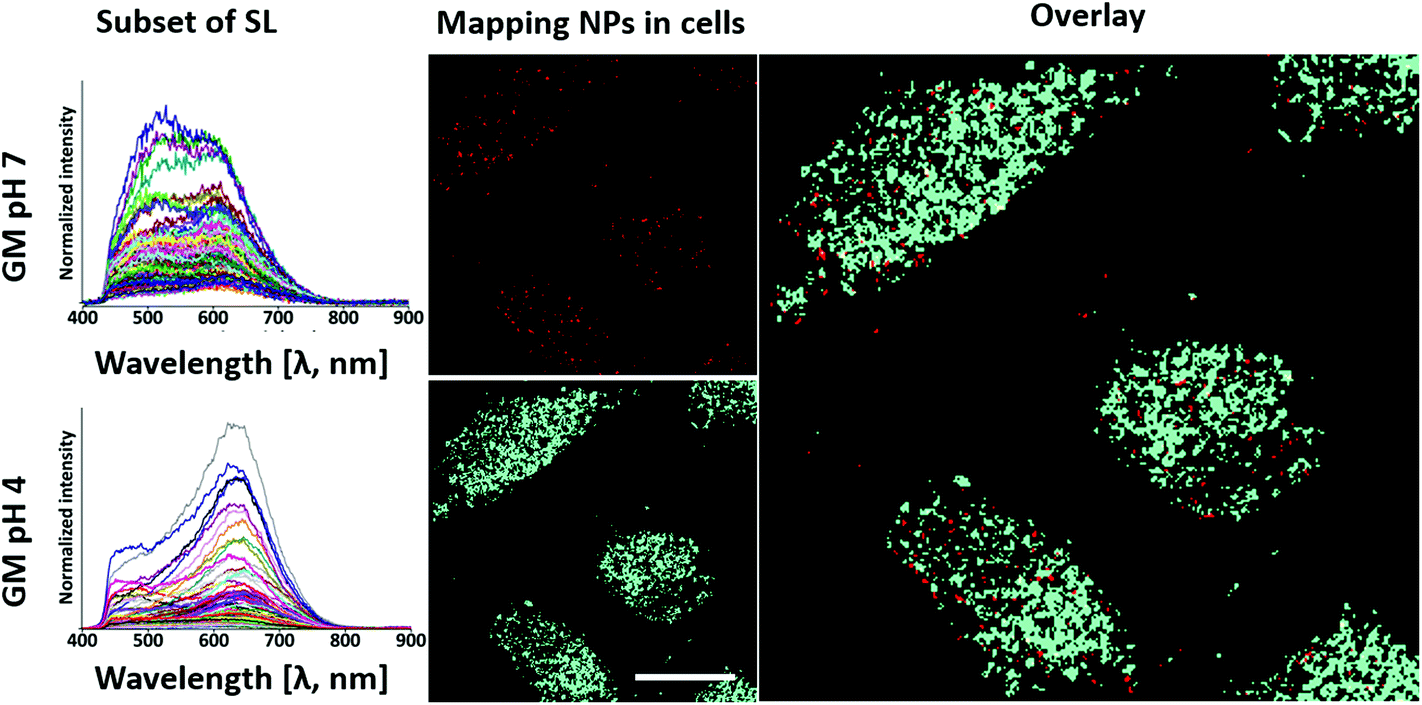 | ||
| Fig. 7 Spectral mapping and intracellular localization of polymer-coated Au/CuS NPs. Left column: subsets of the SLs of NPs exposed to GM pH 7 and pH 4 used in the spectral mapping procedure; middle column: false-colored mapping image of the NPs exposed to pH 7 (red pixels) and pH 4 (blue pixels); right column: the overlay of the two spectral mappings (red and blue pixels) is shown for extracellular/early endosome and lysosomal particle detection, respectively. Scale bar: 10 μm. | ||
The spectral losses of the polymer-coated Au/CuS NPs is associated with ageing, thus indicating NP transformation and/or degradation after 2 months that could affect their functionality. Hence, a fresh preparation of the NPs before PTT would be recommended for an optimal performance. Zhao et al. reported a similar spectral trend in silver NPs upon dissolution in hydrogen peroxide enriched medium monitored over time.34 Hydrogen peroxide is found in cells because of homeostatic and pathological responses.123
Tracking changes of the spectral profile of polymer-coated Au/CuS nanoparticles during intracellular processing
To predict the behavior of the polymer-coated Au/CuS NPs inside living cells, we created a SL of the object (i.e., NPs in different environments), which is used to cross-reference the sample (i.e., cells exposed to NPs) to search for matches. If matched, the HEDFM system sorts, labels the pixels, and provides a mapping image.33 To start with the analysis, a reference SL for the NPs in the different environments (neutral, pH 7 and acidic, pH 4) was acquired (Fig. 7 and ESI cf. Section 6.2 Fig. S19†). Each SL was validated by mapping them on the corresponding NP sample (HDCs) and we overlaid the resulting false coloured NP image with the NP DFI to confirm colocalization (ESI cf. Section 6.2 Fig. S19A†). The spectral data from the control cells (without NPs) are filtered out from the SLs to remove possible similar spectra. We also mapped the cells not exposed to NPs and where no NPs were found (ESI cf. Section 6.2 Fig. S20†). In this way, we ensure that the spectral profiles compiled in each SL used for cell mapping will only relate to the NPs. MDA-MB-231 human breast cancer cells were incubated with 5 nM polymer-coated Au/CuS NP solution for 3 hours and the HDC was taken for mapping. Fig. 7 shows false coloured images of the NPs whose spectral profile matches with the SL. Red pixels fit with the spectral profile of the NPs in the neutral (pH 7) environment, whereas blue pixels fit the acidic (pH 4) environment. The overlay image from both mappings indicates the different locations of the NPs in acidic versus neutral environments, corresponding to different cellular environments.Fig. S19B (ESI cf. Section 6.2†) includes the overlay with the DFI of the cells, indicating intracellular or pericellular location. It is worth mentioning that the number of pixels mapped under acidic conditions is much higher (ca. a power of ten) than that in the neutral environment (Fig. 8 and ESI cf. Section 6.3 Fig. S21†). It is important to note that not all NPs are mapped. We can only map those NPs whose spectral profiles coincide with the SLs selected for mapping, and we cannot correlate the number of pixels with the number of NPs. We could not, for example, track changes of the NPs upon their interaction with the plasma membrane. However, the results obtained previously (Fig. 3) together with these findings support the conclusion of the lysosomal location of the NPs. Most importantly, we could track the progression of the NPs from neutral to more acidic environments during their internalization, typical of endocytosis.80,81,84,124,125 Once we obtained the spectral signatures of the NPs under the different cell-related conditions, changing their physicochemical properties like inducing agglomeration, reshaping or formation of a protein corona, among others, the spectral profiles were the input in the HEDFM system for recognition inside cells. In this way, we can track and predict the cellular behaviour of the NPs.
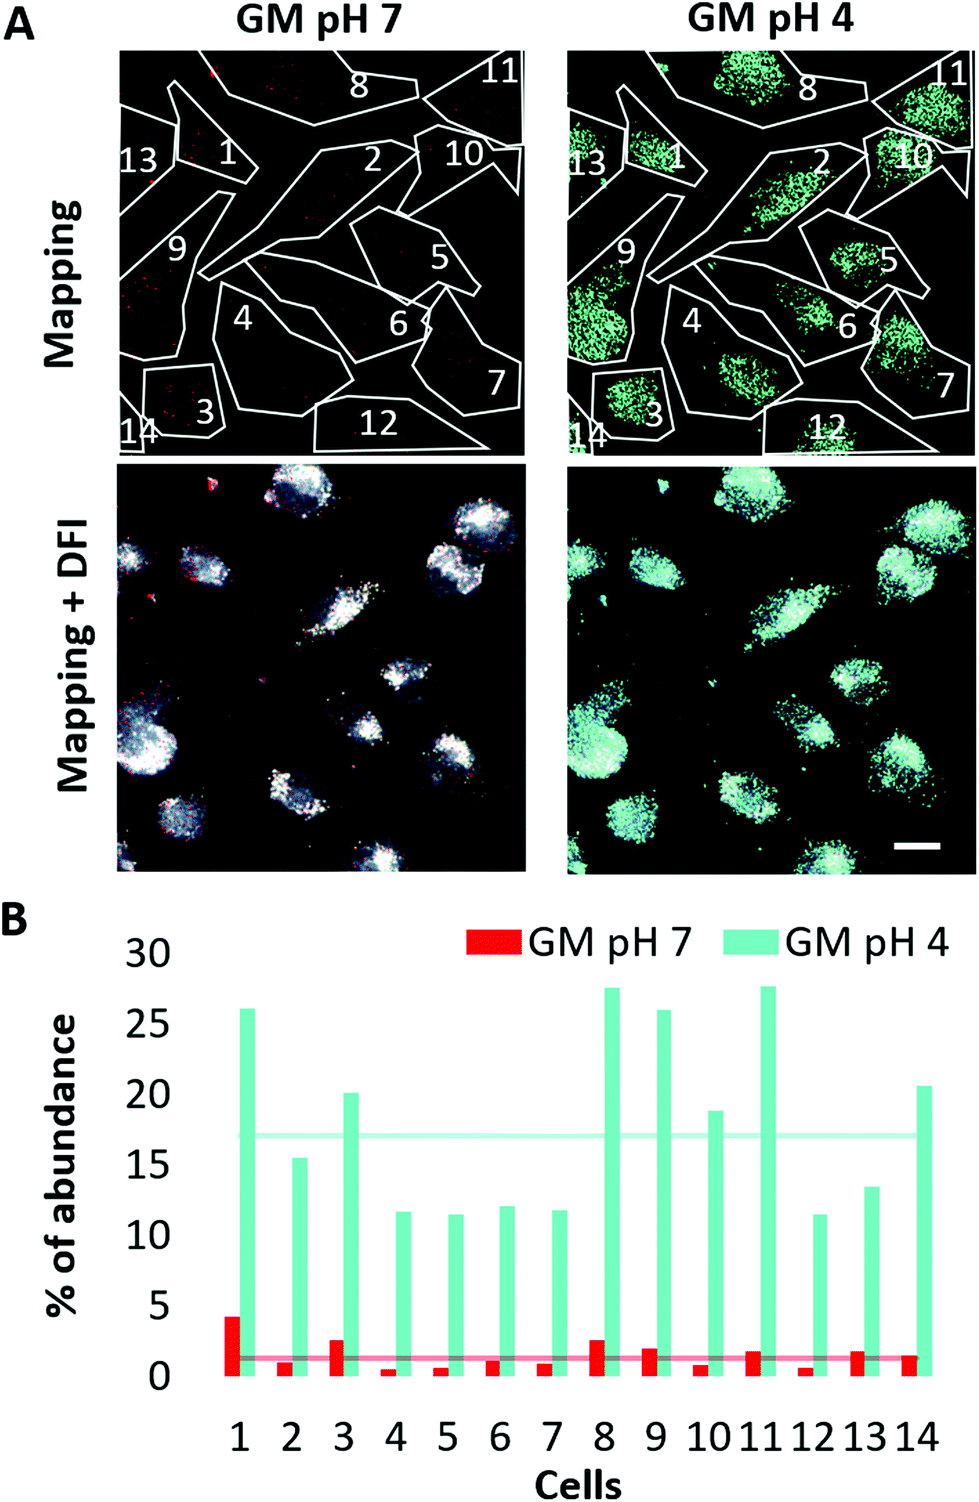 | ||
| Fig. 8 Relative abundance of polymer-coated Au/CuS NP pixels mapped along internalization. Based on the mapping results from Fig. 7 showing NPs inside the cells at pH 7 and 4, we calculated the relative abundance for each condition, distributed by cells. (A) The upper figures show the different cell ROIs (ROI 1–14). The lower images are the merged image of the pixels mapped inside the cells with the DFI. For each ROI, we quantified the total number of pixels (see the ESI, Section 6.2 Fig. S20†). (B) Graphical representation of the calculated relative abundance of pixels mapped per cell and cellular conditions. Scale bar: 10 μm. | ||
Conclusions
Biomedical nanomaterials are dynamic systems changing their physicochemical properties upon their interaction with the physiological milieu. Changes in these properties can induce a performance loss. Therefore, it is strictly necessary to elucidate the behavioral patterns of nanostructured materials in the physiological milieu and to correlate this with physicochemical parameters of the materials such as their geometry, size, composition, and charge. This is the only way to anticipate the cellular response, to control the interactions of the material with the physiological environment, and to manufacture robust nanomaterials maintaining their functionality.HEDFM provides semiquantitative information on how the NP spectra change in a physiological environment. HEDFM imaging provides diffuse reflectance spectra from light-scattering samples and, therefore, contributes to the scope of the NP-environment knowledge at different levels. These are: (i) NP–solvent interactions such as the effect of ionic strength, pH, protein corona and agglomeration state, (ii) NP–time interaction based on ageing and geometrical evolution, and (iii) NP–cell interaction focusing on internalization dynamics and cellular fate.
Our 25 nm polymer-coated Au/CuS NPs facilitate HEDFM imaging. Hyperspectral sensitivity provides detailed spectra compared to multispectral acquisition, emphasizing alterations in NPs. At each pixel, HEDFM collects information on how their spectral signature changes over the whole visible spectrum in different biological environments. We identified unique spectral signatures of polymer-coated Au/CuS NPs under the influence of individual biological parameters that are associated with changes in their morphology, thus, confirming that this methodology has enough sensitivity to accurately detect spectral shifts due to small changes in the biological environment.
Polymer-coated Au/CuS NPs are photothermal agents with improved biocompatibility. We combined HEDFM with CLSM to investigate the NP scenario after exposing TNBC cells to polymer-coated Au/CuS NPs for 3 hours. The NPs are internalized by the cells and accumulated intracellularly, specifically in the lysosomes. At that time and NP dose, no cellular toxicity was observed; therefore the cells were two-photon irradiated and successfully treated with PTT. Regardless of spectral deviations inside the cells, the performance was validated accurately. However long-term effects on the spectral profile of the NPs inside the cells are required to warranty a lack of dysfunctionality.
Thus, combining plasmonic NPs with HEDFM allows (i) evaluating correlations of nanomaterials spectral features in biological matrices and (ii) tracking the dynamic cellular process at the single-cell and single-NP levels but also collectively with the highest resolution (up to 20 nm). Within this work, the spectral change is directly correlated with the alteration of one individual environmental parameter (pH, polarity, protein corona, ionic strength, or time). The concomitant effect of several parameters, as occurring in most physiological fluids, will require further work acquiring the corresponding spectral libraries.
We can conclude that the spectral analysis provides the information of intracellular NP behavior to optimize its functionality for nanomedical applications.
Abbreviations
| 2PE | Two-photon excitation |
| Au | Gold |
| Au/CuS | Gold/copper sulfide |
| CLSM | Confocal laser scanning microscopy |
| CuS | Copper sulfide |
| DFI | Dark field image |
| GM | Complete cell growth medium |
| HCl | Hydrochloric acid |
| HDC | Hyperspectral data cube |
| HEDFM | Hyperspectral-enhanced dark field microscopy |
| HER2 | Human epidermal growth factor receptor 2 |
| HSI | Hyperspectral imaging system |
| ICP-MS | Inductive-coupled mass spectrometry |
| LDA | Laser Doppler anemometry |
| LSPR | Localized surface plasmon resonance |
| NIR | Near-infrared |
| NPs | Nanoparticles |
| PBS | Phosphate buffered saline |
| PMA | Poly(maleic-alt-anhydride) modified with dodecylamine |
| PPDT | Plasmonic photodynamic therapy |
| PPTT | Plasmonic photothermal therapy |
| PTT | Photothermal therapy |
| RI | Refractive index |
| ROI | Region of interest |
| SAM | Small angle mapper |
| SEM | Standard error of the mean |
| SL | Spectral library |
| TEM | Transmission electron microscopy |
| TNBC | Triple-negative breast cancer |
Author contributions
PZP: investigation, methodology, visualization, and writing – original draft. BP: investigation, visualization, and writing – original draft. DT: investigation and visualization. MGS: investigation. WJP: funding acquisition and writing – review and editing. PRG: conceptualization, funding acquisition, methodology, project administration, supervision, writing – original draft, and writing – review and editing.Conflicts of interest
The authors declare that they have no competing interests.Acknowledgements
PZP (BES-2015-075020 and MDM-2014-0370-04), BP (PID2019-111218RB-I00 and RyC-2017-23457), DT (FJCI-2014-22398) and PRG (RYC-2012-10059, MDM-2014-0370-04, CTQ2013-45433-P[FEDER], MAT2016-75362-C3-2-R, and AEI-SAF2015-73052-EXP, PID2019-106755RB-I00/AEI/10.13039/501100011033) acknowledge the Ministry of Science, Innovation and Universities (MICINN) for financial support. WJP was supported by the Cluster of Excellence ‘Advanced Imaging of Matter’ of the Deutsche Forschungsgemeinschaft (DFG) – EXC 2056 – project ID 390715994. BP was supported by the Xunta: Centro singular de investigación de Galicia accreditation 2019-2022, ED431G 2019/03 and the European Union (European Regional Development Fund – ERDF). PRG acknowledges AGAUR (2017 SGR 1054) for financial support.The authors of this article acknowledge Huang Wang, Wenhua Li, and Zhishan Bo for providing the Au/CuS nanoparticles.
References
- S. Marchesan and M. Prato, Nanomaterials for (Nano)medicine, ACS Med. Chem. Lett., 2013, 4, 147–149 CrossRef CAS PubMed.
- P. K. Jain, X. Huang, I. H. El-Sayed and M. A. El-Sayed, Noble Metals on the Nanoscale: Optical and Photothermal Properties and Some Applications in Imaging, Sensing, Biology, and Medicine, Acc. Chem. Res., 2008, 41, 1578–1586, DOI:10.1021/ar7002804.
- B. Pelaz, C. Alexiou, R. A. Alvarez-Puebla, F. Alves, A. M. Andrews and S. Ashraf, et al., Diverse Applications of Nanomedicine, ACS Nano, 2017, 11, 2313–2381 CrossRef CAS PubMed.
- A. Y. Rwei, W. Wang and D. S. Kohane, Photoresponsive nanoparticles for drug delivery, Nano Today, 2015, 10, 451–467, DOI:10.1016/j.nantod.2015.06.004.
- C. S. S. R. Kumar and F. Mohammad, Magnetic nanomaterials for hyperthermia-based therapy and controlled drug delivery, Adv. Drug Delivery Rev., 2011, 63, 789–808, DOI:10.1016/J.ADDR.2011.03.008.
- S. Mura, J. Nicolas and P. Couvreur, Stimuli-responsive nanocarriers for drug delivery, Nat. Mater., 2013, 12, 991–1003, DOI:10.1038/nmat3776.
- J. Beik, Z. Abed, F. S. Ghoreishi, S. Hosseini-Nami, S. Mehrzadi and A. Shakeri-Zadeh, et al., Nanotechnology in hyperthermia cancer therapy: From fundamental principles to advanced applications, J. Controlled Release, 2016, 235, 205–221, DOI:10.1016/J.JCONREL.2016.05.062.
- D. Jaque, L. Martínez Maestro, B. del Rosal, P. Haro-Gonzalez, A. Benayas and J. L. Plaza, et al., Nanoparticles for photothermal therapies, Nanoscale, 2014, 6, 9494–9530 RSC.
- Y. Bayazitoglu, S. Kheradmand and T. K. Tullius, An overview of nanoparticle assisted laser therapy, Int. J. Heat Mass Transfer, 2013, 67, 469–486, DOI:10.1016/j.ijheatmasstransfer.2013.08.018.
- P. Rivera-Gil, D. Hühn, L. L. Mercato, D. Sasse and W. J. Parak, Nanopharmacy: Inorganic nanoscale devices as vectors and active compounds, Pharmacol. Res., 2010, 62, 115–125 CrossRef CAS PubMed.
- P. Rivera-Gil, G. Oberdörster, A. Elder, V. Puntes and W. J. Parak, Correlating Physico-Chemical with Toxicological Properties of Nanoparticles: The Present and the Future, ACS Nano, 2010, 4, 5527–5531, DOI:10.1021/nn1025687.
- P. Rivera-Gil, D. Jimenez De Aberasturi, V. Wulf, B. Pelaz, P. del Pino and Y. Zhao, et al., The Challenge To Relate the Physicochemical Properties of Colloidal Nanoparticles to Their Cytotoxicity, Acc. Chem. Res., 2013, 46, 743–749, DOI:10.1021/ar300039j.
- S. Hua and S. Y. Wu, Editorial: Advances and Challenges in Nanomedicine, Front. Pharmacol., 2018, 9, 1397, DOI:10.3389/fphar.2018.01397.
- S. Hua, M. B. C. de Matos, J. M. Metselaar and G. Storm, Current trends and challenges in the clinical translation of nanoparticulate nanomedicines: Pathways for translational development and commercialization, Front. Pharmacol., 2018, 9, 790, DOI:10.3389/fphar.2018.00790.
- D. W. Grainger, Nanotoxicity assessment: all small talk?, Adv. Drug Delivery Rev., 2009, 61, 419–421 CrossRef CAS PubMed.
- P. Rivera-Gil, F. Yang, H. Thomas, L. Li, A. Terfort and W. J. Parak, Development of an assay based on cell counting with quantum dot labels for comparing cell adhesion within cocultures, Nano Today, 2011, 6, 20–27 CrossRef CAS.
- H. Herd, N. Daum, A. T. Jones, H. Huwer, H. Ghandehari and C. M. Lehr, Nanoparticle geometry and surface orientation influence mode of cellular uptake, ACS Nano, 2013, 7, 1961–1973 CrossRef CAS PubMed.
- X. Sun, M. Gamal, P. Nold, A. Said, I. Chakraborty and B. Pelaz, et al., Tracking stem cells and macrophages with gold and iron oxide nanoparticles – The choice of the best suited particles, Appl. Mater. Today, 2019, 15, 267–279 CrossRef.
- R. di Corato, F. Gazeau, C. le Visage, D. Fayol, P. Levitz and F. Lux, et al., High-resolution cellular MRI: Gadolinium and iron oxide nanoparticles for in-depth dual-cell imaging of engineered tissue constructs, ACS Nano, 2013, 7, 7500–7512, DOI:10.1021/nn401095p.
- M. Xu, M. G. Soliman, X. Sun, B. Pelaz, N. Feliu and W. J. Parak, et al., How Entanglement of Different Physicochemical Properties Complicates the Prediction of in Vitro and in Vivo Interactions of Gold Nanoparticles, ACS Nano, 2018, 12(10), 10104–10113 CrossRef CAS PubMed.
- D. Hühn, K. Kantner, C. Geidel, S. Brandholt, I. de Cock and S. J. H. Soenen, et al., Polymer-coated nanoparticles interacting with proteins and cells: Focusing on the sign of the net charge, ACS Nano, 2013, 7, 3253–3263, DOI:10.1021/nn3059295.
- S. Hua, M. B. C. de Matos, J. M. Metselaar and G. Storm, Current trends and challenges in the clinical translation of nanoparticulate nanomedicines: Pathways for translational development and commercialization, Front. Pharmacol., 2018, 9, 790 CrossRef PubMed.
- X. Huang, P. K. Jain, I. H. El-Sayed and M. A. El-Sayed, Plasmonic photothermal therapy (PPTT) using gold nanoparticles, Lasers Med. Sci., 2008, 23, 217–228 CrossRef PubMed.
- B. S. Hoener, S. R. Kirchner, T. S. Heiderscheit, S. S. E. Collins, W. S. Chang and S. Link, et al., Plasmonic Sensing and Control of Single-Nanoparticle Electrochemistry, Chem, 2018, 4, 1560–1585 CAS.
- S. Szunerits and R. Boukherroub, Sensing using localised surface plasmon resonance sensors, Chem. Commun., 2012, 48, 8999–9010 RSC.
- N. G. Khlebtsov and L. A. Dykman, Optical properties and biomedical applications of plasmonic nanoparticles, J. Quant. Spectrosc. Radiat. Transfer, 2010, 111, 1–35, DOI:10.1016/j.jqsrt.2009.07.012.
- M. Nazarenus, I. Abasolo, N. García-Aranda, V. Voccoli, J. Rejman and M. Cecchini, et al., Polymer Capsules as a Theranostic Tool for a Universal in Vitro Screening Assay - The Case of Lysosomal Storage Diseases, Part. Part. Syst. Charact., 2015, 32, 991–998 CrossRef CAS.
- L. Kastl, D. Sasse, V. Wulf, R. Hartmann, J. Mircheski and C. Ranke, et al., Multiple internalization pathways of polyelectrolyte multilayer capsules into mammalian cells, ACS Nano, 2013, 7, 6605–6618 CrossRef CAS PubMed.
- Y. Cui, X. Wang, W. Ren, J. Liu and J. Irudayaraj, Optical Clearing Delivers Ultrasensitive Hyperspectral Dark-Field Imaging for Single-Cell Evaluation, ACS Nano, 2016, 10, 3132–3143, DOI:10.1021/acsnano.6b00142.
- G. A. Roth, S. Tahiliani, N. M. Neu-Baker and S. A. Brenner, Hyperspectral microscopy as an analytical tool for nanomaterials, Wiley Interdiscip. Rev.: Nanomed. Nanobiotechnol., 2015, 7, 565–579, DOI:10.1002/wnan.1330.
- E. D. SoRelle, O. Liba, J. L. Campbell, R. Dalal, C. L. Zavaleta and A. de la Zerda, A hyperspectral method to assay the microphysiological fates of nanomaterials in histological samples, eLife, 2016, 5, e16352, DOI:10.7554/eLife.16352.
- A. L. Chen, Y. S. Hu, M. A. Jackson, A. Y. Lin, J. K. Young and R. J. Langsner, et al., Quantifying spectral changes experienced by plasmonic nanoparticles in a cellular environment to inform biomedical nanoparticle design, Nanoscale Res. Lett., 2014, 9, 454 CrossRef PubMed.
- P. Zamora-Perez, D. Tsoutsi, R. Xu and P. Rivera-Gil, Hyperspectral-Enhanced Dark Field Microscopy for Single and Collective Nanoparticle Characterization in Biological Environments, Materials, 2018, 11, 243, DOI:10.3390/ma11020243.
- L. J. Zhao, R. J. Yu, W. Ma, H. X. Han, H. Tian and R. C. Qian, et al., Sensitive detection of protein biomarkers using silver nanoparticles enhanced immunofluorescence assay, Theranostics, 2017, 7, 876–883 CrossRef CAS PubMed.
- C. G. England, J. S. Huang, K. T. James, G. Zhang, A. M. Gobin and H. B. Frieboes, Detection of Phosphatidylcholine-Coated Gold Nanoparticles in Orthotopic Pancreatic Adenocarcinoma using Hyperspectral Imaging, PLoS One, 2015, 10, e0129172, DOI:10.1371/journal.pone.0129172.
- S. S. More and R. Vince, Hyperspectral imaging signatures detect amyloidopathy in alzheimers mouse retina well before onset of cognitive decline, ACS Chem. Neurosci., 2015, 6, 306–315 CrossRef CAS PubMed.
- J. Hu, D. Romero Abujetas, D. Tsoutsi, L. Leggio, F. Rivero and E. Martín Rodríguez, et al., Invited Article: Experimental evaluation of gold nanoparticles as infrared scatterers for advanced cardiovascular optical imaging, APL Photonics, 2018, 3, 080803, DOI:10.1063/1.5027907.
- C. Yang, J. Uertz, D. Yohan and B. D. Chithrani, Peptide modified gold nanoparticles for improved cellular uptake, nuclear transport, and intracellular retention, Nanoscale, 2014, 6, 12026–12033 RSC.
- X. Wang, Y. Cui and J. Irudayaraj, Single-Cell Quantification of Cytosine Modifications by Hyperspectral Dark-Field Imaging, ACS Nano, 2015, 9, 11924–11932 CrossRef CAS PubMed.
- M. A. Vetten, N. Tlotleng, D. Tanner Rascher, A. Skepu, F. K. Keter and K. Boodhia, et al., Label-free in vitro toxicity and uptake assessment of citrate stabilised gold nanoparticles in three cell lines, Part. Fibre Toxicol., 2013, 10, 50, DOI:10.1186/1743-8977-10-50.
- J. Tian, W. Zhang, J. Gu, T. Deng and D. Zhang, Bioinspired Au-CuS coupled photothermal materials: Enhanced infrared absorption and photothermal conversion from butterfly wings, Nano Energy, 2015, 17, 52–62, DOI:10.1016/j.nanoen.2015.07.027.
- S. B. Lakshmanan, X. Zou, M. Hossu, L. Ma, C. Yang and W. Chen, Local Field Enhanced Au/CuS Nanocomposites as Efficient Photothermal Transducer Agents for Cancer Treatment, J. Biomed. Nanotechnol., 2012, 8, 883–890, DOI:10.1166/jbn.2012.1486.
- Y. Cao, S. Li, C. Chen, D. Wang, T. Wu and H. Dong, et al., Rattle-type Au@Cu2−xS hollow mesoporous nanocrystals with enhanced photothermal efficiency for intracellular oncogenic microRNA detection and chemo-photothermal therapy, Biomaterials, 2018, 158, 23–33 CrossRef CAS PubMed.
- J. Olesiak-Banska, M. Waszkielewicz, P. Obstarczyk and M. Samoc, Two-photon absorption and photoluminescence of colloidal gold nanoparticles and nanoclusters, Chem. Soc. Rev., 2019, 48, 4087–4117 RSC.
- Z. Huang, L. Kong, L. Gao, H. H. Zhang, J. X. Yang and L. Li, In vivo two-photon imaging/excited photothermal therapy strategy of a silver-nanohybrid, J. Mater. Chem. B, 2019, 7, 7377–7386 RSC.
- Q. Chen, J. Wen, H. Li, Y. Xu, F. Liu and S. Sun, Recent advances in different modal imaging-guided photothermal therapy, Biomaterials, 2016, 106, 144–166 CrossRef CAS PubMed.
- C. C. Huang and T. M. Liu, Controlled Au-Polymer Nanostructures for Multiphoton Imaging, Prodrug Delivery, and Chemo-Photothermal Therapy Platforms, ACS Appl. Mater. Interfaces, 2015, 7, 25259–25269 CrossRef CAS PubMed.
- M. A. Medina, G. Oza, A. Sharma, L. G. Arriaga, J. M. Hernández and V. M. Rotello, et al., Triple-Negative Breast Cancer: A Review of Conventional and Advanced Therapeutic Strategies, Int. J. Environ. Res. Public Health, 2020, 17, 2078, DOI:10.3390/ijerph17062078.
- V. K. Gadi and N. E. Davidson, Practical Approach to Triple-Negative Breast Cancer, J. Oncol. Pract., 2017, 13, 293–300 CrossRef PubMed.
- J. L. da Silva, N. C. Cardoso Nunes, P. Izetti, G. G. de Mesquita and A. C. de Melo, Triple negative breast cancer: A thorough review of biomarkers, Crit. Rev. Oncol. Hematol., 2020, 145, 102855 CrossRef PubMed.
- A. O. Govorov and H. H. Richardson, Generating heat with metal nanoparticles, Nano Today, 2007, 2, 30–38, DOI:10.1016/S1748-0132(07)70017-8.
- G. Hegyi, G. P. Szigeti and A. Szász, Hyperthermia versus Oncothermia: Cellular Effects in Complementary Cancer Therapy, Evidence-Based Complementary Altern. Med., 2013, 2013, 672873, DOI:10.1155/2013/672873.
- M. Hurwitz and P. Stauffer, Hyperthermia, Radiation and Chemotherapy: The Role of Heat in Multidisciplinary Cancer Care, Semin. Oncol., 2014, 41, 714–729, DOI:10.1053/J.SEMINONCOL.2014.09.014.
- R. D. Issels, Hyperthermia adds to chemotherapy, Eur. J. Cancer, 2008, 44, 2546–2554, DOI:10.1016/J.EJCA.2008.07.038.
- M. H. Falk and R. D. Issels, Hyperthermia in oncology, Int. J. Hyperthermia, 2001, 17, 1–18, DOI:10.1080/02656730118511.
- J. P. Islamian, M. Hatamian and M. R. Rashidi, Nanoparticles promise new methods to boost oncology outcomes in breast cancer, Asian Pac. J. Cancer Prev., 2015, 16, 1683–1686 CrossRef PubMed . Accessed 30 Mar 2016: http://www.ncbi.nlm.nih.gov/pubmed/25773810.
- R. L. Atkinson, M. Zhang, P. Diagaradjane, S. Peddibhotla, A. Contreras and S. G. Hilsenbeck, et al., Thermal enhancement with optically activated gold nanoshells sensitizes breast cancer stem cells to radiation therapy, Sci. Transl. Med., 2010, 2, 55ra79–55ra79 Search PubMed.
- P. Wust, B. Hildebrandt, G. Sreenivasa, B. Rau, J. Gellermann and H. Riess, et al., Hyperthermia in combined treatment of cancer, Lancet Oncol., 2002, 3, 487–497, DOI:10.1016/S1470-2045(02)00818-5.
- D. K. Chatterjee, P. Diagaradjane and S. Krishnan, Nanoparticle-mediated hyperthermia in cancer therapy, Ther. Delivery, 2011, 2, 1001–1014, DOI:10.4155/tde.11.72.
- L. Zou, H. Wang, B. He, L. Zeng, T. Tan and H. Cao, et al., Current Approaches of Photothermal Therapy in Treating Cancer Metastasis with Nanotherapeutics, Theranostics, 2016, 6, 762–772, DOI:10.7150/thno.14988.
- Z. Sun, Z. Yang, J. Zhou, M. H. Yeung, W. Ni and H. Wu, et al., A General Approach to the Synthesis of Gold-Metal Sulfide Core-Shell and Heterostructures, Angew. Chem., Int. Ed., 2009, 48, 2881–2885, DOI:10.1002/anie.200806082.
- W. Li, R. Zamani, P. Rivera-Gil, B. Pelaz, M. Ibáñez and D. Cadavid, et al., CuTe Nanocrystals: Shape and Size Control, Plasmonic Properties, and Use as SERS Probes and Photothermal Agents, J. Am. Chem. Soc., 2013, 135, 7098–7101, DOI:10.1021/ja401428e.
- J. Hühn, C. Carrillo-Carrion, M. G. Soliman, C. Pfeiffer, D. Valdeperez and A. Masood, et al., Selected Standard Protocols for the Synthesis, Phase Transfer, and Characterization of Inorganic Colloidal Nanoparticles, Chem. Mater., 2017, 29, 399–461, DOI:10.1021/acs.chemmater.6b04738.
- M. G. Soliman, B. Pelaz, W. J. Parak and P. del Pino, Phase Transfer and Polymer Coating Methods toward Improving the Stability of Metallic Nanoparticles for Biological Applications, Chem. Mater., 2015, 27, 990–997, DOI:10.1021/cm5043167.
- M. K. Park, C. H. Lee and H. Lee, Mouse models of breast cancer in preclinical research, Lab. Anim. Res., 2018, 34, 160 CrossRef PubMed.
- J. Schindelin, I. Arganda-Carreras, E. Frise, V. Kaynig, M. Longair and T. Pietzsch, et al., Fiji: an open-source platform for biological-image analysis, Nat. Methods, 2012, 9, 676–682, DOI:10.1038/nmeth.2019.
- S. Goel, F. Chen and W. Cai, Synthesis and Biomedical Applications of Copper Sulfide Nanoparticles: From Sensors to Theranostics, Small, 2014, 10, 631–645, DOI:10.1002/smll.201301174.
- X. Huang, W. Zhang, G. Guan, G. Song, R. Zou and J. Hu, Design and Functionalization of the NIR-Responsive Photothermal Semiconductor Nanomaterials for Cancer Theranostics, Acc. Chem. Res., 2017, 50, 2529–2538 CrossRef CAS PubMed.
- D. M. Schaadt, B. Feng and E. T. Yu, Enhanced semiconductor optical absorption via surface plasmon excitation in metal nanoparticles, Appl. Phys. Lett., 2005, 86, 063106, DOI:10.1063/1.1855423.
- Y. Li, W. Lu, Q. Huang, C. Li and W. Chen, Copper sulfide nanoparticles for photothermal ablation of tumor cells, Nanomedicine, 2010, 5, 1161–1171 CrossRef CAS PubMed.
- C. Leng, X. Zhang, F. Xu, Y. Yuan, H. Pei and Z. Sun, et al., Engineering Gold Nanorod-Copper Sulfide Heterostructures with Enhanced Photothermal Conversion Efficiency and Photostability, Small, 2018, 14, 1703077, DOI:10.1002/smll.201703077.
- A. O. Govorov, G. W. Bryant, W. Zhang, T. Skeini, J. Lee and N. A. Kotov, et al., Exciton−Plasmon Interaction and Hybrid Excitons in Semiconductor−Metal Nanoparticle Assemblies, 2006. DOI:10.1021/NL0602140.
- W. Gao, Y. Sun, M. Cai, Y. Zhao, W. Cao and Z. Liu, et al., Copper sulfide nanoparticles as a photothermal switch for TRPV1 signaling to attenuate atherosclerosis, Nat. Commun., 2018, 9, 1–10 CrossRef PubMed.
- M. G. Soliman, B. Pelaz, W. J. Parak and P. del Pino, Phase transfer and polymer coating methods toward improving the stability of metallic nanoparticles for biological applications, Chem. Mater., 2015, 27, 990–997 CrossRef CAS.
- T. Pellegrino, R. A. Sperling, A. P. Alivisatos and W. J. Parak, Gel Electrophoresis of Gold-DNA Nanoconjugates, J. Biomed. Biotechnol., 2007, 2007, 26796, DOI:10.1155/2007/26796.
- T. Wagner, H. G. Lipinski and M. Wiemann, Dark field nanoparticle tracking analysis for size characterization of plasmonic and non-plasmonic particles, J. Nanopart. Res., 2014, 16, 1–10 CrossRef PubMed.
- D. Boyer, P. Tamarat, A. Maali, B. Lounis and M. Orrit, Photothermal imaging of nanometer-sized metal particles among scatterers, Science, 2002, 297, 1160–1163 CrossRef CAS PubMed.
- N. R. Datta, S. G. Ordóñez, U. S. Gaipl, M. M. Paulides, H. Crezee and J. Gellermann, et al., Local hyperthermia combined with radiotherapy and-/or chemotherapy: Recent advances and promises for the future, Cancer Treat. Rev., 2015, 41, 742–753, DOI:10.1016/J.CTRV.2015.05.009.
- N. D. Donahue, H. Acar and S. Wilhelm, Concepts of nanoparticle cellular uptake, intracellular trafficking, and kinetics in nanomedicine, Adv. Drug Delivery Rev., 2019, 143, 68–96 CrossRef CAS PubMed.
- P. Foroozandeh and A. A. Aziz, Insight into Cellular Uptake and Intracellular Trafficking of Nanoparticles, Nanoscale Res. Lett., 2018, 13, 1–12 CrossRef CAS PubMed.
- I. Canton and G. Battaglia, Endocytosis at the nanoscale, Chem. Soc. Rev., 2012, 41, 2718–2739 RSC.
- P. Rivera-Gil, M. Nazarenus, S. Ashraf and W. J. Parak, PH-sensitive capsules as intracellular optical reporters for monitoring lysosomal pH changes upon stimulation, Small, 2012, 8, 943–948 CrossRef CAS PubMed.
- M. García-Algar, D. Tsoutsi, M. Sanles-Sobrido, A. Cabot, V. Izquierdo-Roca and P. Rivera-Gil, Subcellular Optical pH Nanoscale Sensor, ChemistrySelect, 2017, 2, 8115–8121, DOI:10.1002/slct.201701087.
- P. Saftig and J. Klumperman, Lysosome biogenesis and lysosomal membrane proteins: Trafficking meets function, Nat. Rev. Mol. Cell Biol., 2009, 10, 623–635 CrossRef CAS PubMed.
- M. de Luca, M. M. Ferraro, R. Hartmann, P. Rivera-Gil, A. Klingl and M. Nazarenus, et al., Advances in Use of Capsule-Based Fluorescent Sensors for Measuring Acidification of Endocytic Compartments in Cells with Altered Expression of V-ATPase Subunit V1G1, ACS Appl. Mater. Interfaces, 2015, 7, 15052–15060, DOI:10.1021/acsami.5b04375.
- N. Q. Zhou, L. J. Tian, Y. C. Wang, D. B. Li, P. P. Li and X. Zhang, et al., Extracellular biosynthesis of copper sulfide nanoparticles by Shewanella oneidensis MR-1 as a photothermal agent, Enzyme Microb. Technol., 2016, 95, 230–235 CrossRef CAS PubMed.
- S. Wang, A. Riedinger, H. Li, C. Fu, H. Liu and L. Li, et al., Plasmonic Copper Sulfide Nanocrystals Exhibiting Near-Infrared Photothermal and Photodynamic Therapeutic Effects, 2015. DOI:10.1021/nn506687t.
- J. T. Buchman, N. V. Hudson-Smith, K. M. Landy and C. L. Haynes, Understanding Nanoparticle Toxicity Mechanisms to Inform Redesign Strategies to Reduce Environmental Impact, Acc. Chem. Res., 2019, 52, 1632–1642 CrossRef CAS PubMed.
- M. N. Hang, I. L. Gunsolus, H. Wayland, E. S. Melby, A. C. Mensch and K. R. Hurley, et al., Impact of Nanoscale Lithium Nickel Manganese Cobalt Oxide (NMC) on the Bacterium Shewanella oneidensis MR-1, Chem. Mater., 2016, 28, 1092–1100 CrossRef CAS.
- R. di Corato, D. Palumberi, R. Marotta, M. Scotto, S. Carregal-Romero and P. Rivera-Gil, et al., Magnetic nanobeads decorated with silver nanoparticles as cytotoxic agents and photothermal probes, Small, 2012, 8, 2731–2742 CrossRef CAS PubMed.
- A. Espinosa, R. di Corato, J. Kolosnjaj-Tabi, P. Flaud, T. Pellegrino and C. Wilhelm, Duality of Iron Oxide Nanoparticles in Cancer Therapy: Amplification of Heating Efficiency by Magnetic Hyperthermia and Photothermal Bimodal Treatment, ACS Nano, 2016, 10, 2436–2446 CrossRef CAS PubMed.
- Y. Lai, L. Dong, H. Zhou, B. Yan, Y. Chen and Y. Cai, et al., Coexposed nanoparticulate Ag alleviates the acute toxicity induced by ionic Ag+ in vivo, Sci. Total Environ., 2020, 723, 138050 CrossRef CAS PubMed.
- C. Mao, Y. Xiang, X. Liu, Y. Zheng, K. W. K. Yeung and Z. Cui, et al., Local Photothermal/Photodynamic Synergistic Therapy by Disrupting Bacterial Membrane to Accelerate Reactive Oxygen Species Permeation and Protein Leakage, ACS Appl. Mater. Interfaces, 2019, 11, 17902–17914 CrossRef CAS PubMed.
- L. Guo, I. Panderi, D. D. Yan, K. Szulak, Y. Li and Y. T. Chen, et al., A comparative study of hollow copper sulfide nanoparticles and hollow gold nanospheres on degradability and toxicity, ACS Nano, 2013, 7, 8780–8793 CrossRef CAS PubMed.
- F. Y. Leung, Trace elements in parenteral micronutrition, Clin. Biochem., 1995, 28, 561–566 CrossRef CAS PubMed.
- W. Feng, W. Nie, Y. Cheng, X. Zhou, L. Chen and K. Qiu, et al., In vitro and in vivo toxicity studies of copper sulfide nanoplates for potential photothermal applications, Nanomedicine, 2015, 11, 901–912 CrossRef CAS PubMed.
- F. Helmchen and W. Denk, Deep tissue two-photon microscopy, Nat. Methods, 2005, 2, 932–940 CrossRef CAS PubMed.
- B. G. Wang, K. König and K. J. Halbhuber, Two-photon microscopy of deep intravital tissues and its merits in clinical research, J. Microsc., 2010, 238, 1–20 CrossRef CAS PubMed.
- S. W. Perry, R. M. Burke and E. B. Brown, Two-photon and second harmonic microscopy in clinical and translational cancer research, Ann. Biomed. Eng., 2012, 40, 277–291 CrossRef PubMed.
- P. Y. Liu, L. K. Chin, W. Ser, H. F. Chen, C. M. Hsieh and C. H. Lee, et al., Cell refractive index for cell biology and disease diagnosis: Past, present and future, Lab Chip, 2016, 16, 634–644 RSC.
- X. J. Liang, A. Q. Liu, C. S. Lim, T. C. Ayi and P. H. Yap, Determining refractive index of single living cell using an integrated microchip, Sens. Actuators, A, 2007, 133, 349–354 CrossRef CAS.
- C. Pfeiffer, C. Rehbock, D. Hühn, C. Carrillo-Carrion, D. J. de Aberasturi and V. Merk, et al., Interaction of colloidal nanoparticles with their local environment: The (ionic) nanoenvironment around nanoparticles is different from bulk and determines the physico-chemical properties of the nanoparticles, J. R. Soc., Interface, 2014, 11(96), 20130931 CrossRef PubMed.
- X. Zhang, M. R. Servos and J. Liu, Ultrahigh nanoparticle stability against salt, pH, and solvent with retained surface accessibility via depletion stabilization, J. Am. Chem. Soc., 2012, 134, 9910–9913 CrossRef CAS PubMed.
- T. L. Moore, L. Rodriguez-Lorenzo, V. Hirsch, S. Balog, D. Urban and C. Jud, et al., Nanoparticle colloidal stability in cell culture media and impact on cellular interactions, Chem. Soc. Rev., 2015, 44, 6287–6305 RSC.
- M. P. Monopoli, D. Walczyk, A. Campbell, G. Elia, I. Lynch and F. Baldelli Bombelli, et al., Physical-Chemical aspects of protein corona: Relevance to in vitro and in vivo biological impacts of nanoparticles, J. Am. Chem. Soc., 2011, 133, 2525–2534 CrossRef CAS PubMed.
- I. Lynch and K. A. Dawson, Protein-nanoparticle interactions, Nano Today, 2008, 3, 40–47 CrossRef CAS.
- C. C. Fleischer and C. K. Payne, Nanoparticle-cell interactions: Molecular structure of the protein corona and cellular outcomes, Acc. Chem. Res., 2014, 47, 2651–2659 CrossRef CAS PubMed.
- S. Tenzer, D. Docter, J. Kuharev, A. Musyanovych, V. Fetz and R. Hecht, et al., Rapid formation of plasma protein corona critically affects nanoparticle pathophysiology, Nat. Nanotechnol., 2013, 8, 772–781 CrossRef CAS PubMed.
- T. G. Iversen, T. Skotland and K. Sandvig, Endocytosis and intracellular transport of nanoparticles: Present knowledge and need for future studies, Nano Today, 2011, 6, 176–185 CrossRef CAS.
- H. T. Phan and A. J. Haes, What Does Nanoparticle Stability Mean?, J. Phys. Chem. C, 2019, 123, 16495–16507 CrossRef CAS PubMed.
- C. D. Walkey, J. B. Olsen, H. Guo, A. Emili and W. C. W. Chan, Nanoparticle size and surface chemistry determine serum protein adsorption and macrophage uptake, J. Am. Chem. Soc., 2012, 134, 2139–2147 CrossRef CAS PubMed.
- I. Lynch, T. Cedervall, M. Lundqvist, C. Cabaleiro-Lago, S. Linse and K. A. Dawson, The nanoparticle-protein complex as a biological entity; a complex fluids and surface science challenge for the 21st century, Adv. Colloid Interface Sci., 2007, 134–135, 167–174 CrossRef CAS PubMed.
- S. V. Jenkins, H. Qu, T. Mudalige, T. M. Ingle, R. Wang and F. Wang, et al., Rapid determination of plasmonic nanoparticle agglomeration status in blood, Biomaterials, 2015, 51, 226–237, DOI:10.1016/j.biomaterials.2015.01.072.
- J. Comenge, O. Fragueiro, J. Sharkey, A. Taylor, M. Held and N. C. Burton, et al., Preventing Plasmon Coupling between Gold Nanorods Improves the Sensitivity of Photoacoustic Detection of Labeled Stem Cells in Vivo, ACS Nano, 2016, 10, 7106–7116 CrossRef CAS PubMed.
- P. Nielsen, D. Alloyeau, F. Gazeau, R. H. Stauber, W. J. Parak and N. Feliu, et al., Chem Soc Rev In vivo degeneration and the fate of inorganic nanoparticles, Chem. Soc. Rev., 2016, 45, 2440–2457 RSC . Accessed 29 Mar 2017: http://www.rsc.org/chemsocrev.
- N. Feliu, D. Docter, M. Heine, P. del Pino, S. Ashraf and J. Kolosnjaj-Tabi, et al., In vivo degeneration and the fate of inorganic nanoparticles, Chem. Soc. Rev., 2016, 45, 2440–2457 RSC.
- C. Loo, A. Lowery, N. Halas, J. West and R. Drezek, Immunotargeted nanoshells for integrated cancer imaging and therapy, Nano Lett., 2005, 5, 709–711 CrossRef CAS PubMed.
- Y. Li, C. Jing, L. Zhang and Y. T. Long, Resonance scattering particles as biological nanosensors in vitro and in vivo, Chem. Soc. Rev., 2012, 41, 632–642 RSC.
- J. H. Shannahan, H. Sowrirajan, I. Persaud, R. Podila and J. M. Brown, Impact of Silver and Iron Nanoparticle Exposure on Cholesterol Uptake by Macrophages, J. Nanomater., 2015, 2015, 127235 Search PubMed.
- W. Zhang, Y. Ji, J. Meng, X. Wu and H. Xu, Probing the Behaviors of Gold Nanorods in Metastatic Breast Cancer Cells Based on UV-vis-NIR Absorption Spectroscopy, PLoS One, 2012, 7, e31957, DOI:10.1371/journal.pone.0031957.
- A. C. Curry, M. Crow and A. Wax, Molecular imaging of epidermal growth factor receptor in live cells with refractive index sensitivity using dark-field microspectroscopy and immunotargeted nanoparticles, J. Biomed. Opt., 2008, 13, 014022, DOI:10.1117/1.2837450.
- E. Casals, E. Gonzalez and V. F. Puntes, Reactivity of inorganic nanoparticles in biological environments: insights into nanotoxicity mechanisms, J. Phys. D: Appl. Phys., 2012, 45, 443001, DOI:10.1088/0022-3727/45/44/443001.
- N. di Marzo, E. Chisci and R. Giovannoni, The Role of Hydrogen Peroxide in Redox-Dependent Signaling: Homeostatic and Pathological Responses in Mammalian Cells, Cells, 2018, 7, 156 CrossRef CAS PubMed.
- L. A. Dykman and N. G. Khlebtsov, Uptake of Engineered Gold Nanoparticles into Mammalian Cells, Chem. Rev., 2014, 114, 1258–1288, DOI:10.1021/cr300441a.
- W. Zhang, Y. Ji, X. Wu and H. Xu, Trafficking of gold nanorods in breast cancer cells: Uptake, lysosome maturation, and elimination, ACS Appl. Mater. Interfaces, 2013, 5, 9856–9865 CrossRef CAS PubMed.
Footnote |
| † Electronic supplementary information (ESI) available: Additional experimental data and the Method section. See DOI: 10.1039/d0nr08256b |
| This journal is © The Royal Society of Chemistry 2021 |