 Open Access Article
The role of grain boundary character in solute segregation and thermal stability of nanocrystalline Pt–Au†
Christopher M.
Barr
a,
Stephen M.
Foiles
a,
Malek
Alkayyali
b,
Yasir
Mahmood
b,
Patrick M.
Price
a,
David P.
Adams
a,
Brad L.
Boyce
 a,
Fadi
Abdeljawad
 *bc and
Khalid
Hattar
*a
aMaterial, Physical, and Chemical Sciences Center, Sandia National Laboratories, Albuquerque, New Mexico 87185, USA
bDepartment of Mechanical Engineering, Clemson University, Clemson, South Carolina 29634, USA. E-mail: fabdelj@clemson.edu
cDepartment of Materials Science and Engineering, Clemson University, Clemson, South Carolina 29634, USA
First published on 25th January 2021
Abstract
Nanocrystalline (NC) metals suffer from an intrinsic thermal instability; their crystalline grains undergo rapid coarsening during processing treatments or under service conditions. Grain boundary (GB) solute segregation has been proposed to mitigate grain growth and thermally stabilize the grain structures of NC metals. However, the role of GB character in solute segregation and thermal stability of NC metals remains poorly understood. Herein, we employ high resolution microscopy techniques, atomistic simulations, and theoretical analysis to investigate and characterize the impact of GB character on segregation behavior and thermal stability in a model NC Pt–Au alloy. High resolution electron microscopy along with X-ray energy dispersive spectroscopy and automated crystallographic orientation mapping is used to obtain spatially correlated Pt crystal orientation, GB misorientation, and Au solute concentration data. Atomistic simulations of polycrystalline Pt–Au systems are used to reveal the plethora of GB segregation profiles as a function of GB misorientation and the corresponding impact on grain growth processes. With the aid of theoretical models of interface segregation, the experimental data for GB concentration profiles are used to extract GB segregation energies, which are then used to elucidate the impact of GB character on solute drag effects. Our results highlight the paramount role of GB character in solute segregation behavior. In broad terms, our approach provides future avenues to employ GB segregation as a microstructure design strategy to develop NC metallic alloys with tailored microstructures.
A. Introduction
Nearly all structural and functional materials are polycrystalline systems; their microstructures are comprised of differently oriented crystalline grains that are joined at grain boundaries (GBs). The GB structure and network topology plays a critical role in controlling many materials properties and processes, including microstructural evolution,1 mechanical behavior,2 and degradation mechanisms.3 Owing to their small crystal size and high density of GBs, nanocrystalline (NC) metals exhibit unique combinations of properties and functionalities that are not commonly found in their coarse-grained counterparts.2,4 On the other hand, however, NC metals suffer from a microstructural instability that considerably hinders their deployment in many engineering applications.5,6 The increased interfacial contribution to the free energy of NC metals makes them susceptible to rampant grain coarsening and concomitant evolution of their crystal-size dependent properties.7,8 The ability to mitigate grain growth in NC materials during processing or under service conditions would enable a myriad of applications ranging from structural and aerospace to energy and electronics.4,9–11In recent years, GB segregation engineering12 has been proposed as a design strategy to purposefully dope or enrich GBs with elemental species in order to tailor various interface properties. Enrichment of solutes at GBs has been found to alter many properties of polycrystalline metals, including mechanical strength,13 fracture,14 wear resistance,11 and transport.15 The role of GB segregation in grain growth kinetics of NC alloys is of particular interest. Numerous experimental studies have demonstrated enhanced thermal stability in binary NC alloys, including W–Ti,16 Pd–Zr,17 Pt–Au,18 Y–Fe,19 Cu-based,20,21 Fe-based,22–25 and Ni-based.26–28 The preferential segregation of solutes to GBs can affect grain growth processes in two main ways.18,29 The first is a thermodynamic effect that is described by the Gibbs adsorption equation. The segregation of an alloying element to a GB when the chemical potential is increased at a constant temperature and pressure leads to a reduction in the GB energy, and thus the driving force for grain coarsening.30–32 The second is a kinetic mechanism, termed solute drag.33,34 Segregated solute atoms will attempt to remain within the migrating GB due to the strong solute atom–GB interactions. As a result, the migrating GB has to drag solute atoms and can only move as fast as the diffusing solutes. In addition to these two mechanisms, if a precipitate is formed by the solute, then the so-called Zener pinning35 can also serve to mitigate grain growth. Experimentally, both kinetic and thermodynamic routes act in conjunction, with the relevant role of each depending upon the details of the interactions of solute atoms with GBs, temperature, and solute diffusivity.
While the use of GB solute segregation to mitigate grain growth in NC metals has been the subject of active research, most existing treatments invoke the isotropy assumption in GB segregation behavior,30,32 as the dependence of segregation energy on the GB macroscopic geometric degrees of freedom (i.e., three for misorientation and two for plane normal36) is largely unknown. However, advances in scientific computing and high-resolution experimental techniques have made it possible to investigate in a quantitative manner the anisotropic behavior in many GB properties, including energy,37 mobility,38 diffusion,39 and very recently solute segregation energetics.40–48 In one of the earlier studies, Seki et al.40 examined Au segregation to [001] twist GBs in Pt using Monte Carlo simulations, and quantified GB concentration profiles as a function of twist angle. Very recently, high throughput atomistic calculations were used to examine the segregation of various elemental species to a wide range of GB types42 or to establish GB segregation distributions for specific NC microstructures.43 Studies employing high-resolution microscopy18,49 and atom probe tomography41,46,47 were used to reveal the anisotropy in solute segregation as a function of GB character. While the aforementioned studies have demonstrated that the use of a single segregation energy value to describe solute–GB interactions is an oversimplification, they do not quantify the impact of segregation anisotropy on grain growth processes, nor do they explore the role of segregation anisotropy in the kinetic mechanism (i.e., dynamic solute drag) of NC thermal stability. As suggested by solute drag models,33,34 solute segregation effectively alters the GB mobility; therefore, segregation anisotropy results in a distribution of mobilities of doped GBs in a NC microstructure. The existence of distributions in GB migration rates was found to lead to modifications of texture and microstructure and, as a result, materials properties.50–53 Therefore, variations in segregation energy as a function of GB character have to be incorporated in materials design and discovery efforts in order for GB segregation to be used as a strategy to develop thermally stable NC materials with tailored microstructures.42
Herein, we explore GB solute segregation behavior as a function of GB character after elevated temperature anneals in a model Pt–Au alloy. Undesirable impurity element segregation has often complicated our ability to deconvolute both routes of thermal stability in NC binary alloys.25,54,55 The use of the noble Pt–Au system minimizes several practical complexities, such as the presence of oxides, that can potentially confound experimental observations.18 In this work, high-resolution microscopy and atomistic simulations were used to reveal and quantify anisotropic Au segregation to Pt GBs. Theoretical calculations using the experimentally-obtained GB concentration profiles were then used to elucidate the dependence of GB segregation energies and solute drag forces on GB misorientation.
B. Methods
Experimental methods
Pt and Pt–10 at% Au (Pt–10Au) thin films with a nominal thickness of 40 nm were magnetron sputtered onto optically polished salt substrates. Sputter deposition involved a Unifilm PVD300 system having a base pressure of 5 × 10⁻⁷ Torr. Deposition utilized ultrahigh purity Ar which was controlled at 10 mTorr throughout film growth. Films were subsequently floated off the substrates onto TEM Mo mesh grids and annealed in a custom high vacuum furnace at 500 °C or 700 °C for 30 minutes at a base pressure of 5 × 10⁻⁵ Torr. Automated crystal orientation mapping (ACOM) using precession electron diffraction (PED) was completed on the 500 °C (∼0.3Tm) and 700 °C (∼0.46Tm), where Tm is the melting temperature, annealed Pt and Pt–10Au samples in a JEOL 2100 TEM with a 2.5 nm step size and 0.375° precession angle. Orientation maps were post-processed and analyzed in EDAX OIM® 8.1 software using a single pass grain dilation protocol (3° grain angle criterion). Boundaries were classified as high angle GB (HAGBs) (≥15° misorientation) and low angle GBs (LAGBs) (≥5°, <15° misorientation), and ∑3 twin GBs were classified following the Brandon criteria.56 Grain size was calculated as an effective grain diameter following ASTM standards where the standard deviation was calculated as the square root of the variance of the mean. Characterization of GB solute segregation in Pt–10Au was performed in a FEI Titan aberration-corrected scanning/transmission electron microscope (STEM) with a 4 detector X-ray energy dispersive spectroscopy (EDS) system. Sequential STEM-EDS and ACOM data were collected to spatially correlate the localized solute segregation and GB misorientation. The Cliff-Lorimer methodology57 was used to quantify and convert X-ray intensity to atomic concentration in the binary alloy. Under the deposition conditions, the 40 nm-thick Pt–Au films tended to grow in a columnar manner, providing one grain through thickness and GBs that were perpendicular to the plane of the film (‘edge-on’). GBs that were exclusively edge-on to the electron beam with both grains in similar diffraction contrast were quantified in this study.Computational methods
Atomistic simulations employing a recently developed Embedded Atom Method (EAM) interatomic potential for the Pt–Au system58 were used to elucidate the impact of anisotropic GB solute segregation on the thermal stability and solute partitioning in NC Pt–Au alloys, and reveal preferential sites for Au segregation within the GB regions. The process of generating the atomistic systems is as follows: a polycrystalline atomistic system with a wide range of GB types was generated using the technique outlined in ref. 59, which employs microstructures generated from phase field or Potts models. Then, the pixelated representation was used to construct periodic atomistic thin films with columnar grains, and these grains were assigned random orientations about their common 〈111〉 axis, which was aligned with the film out-of-plane axis. The overall size of the atomistic systems was ≈1570 Å × 790 Å for the in-plane film dimensions and ≈30 Å for the out-of-plane thickness, resulting in a total number of atoms of approximately 2.1 million. Once generated, the atomistic systems were heated to 500 °C over 50 ps and Au atoms with a nominal composition of 10 at% were randomly assigned. The above-mentioned approach of generating the atomistic systems reproduces properties such as triple-junction angles much better than may be achieved by the commonly used Voronoi construction.60 Further, the NC atomistic systems were intended to be representative of the temperature, Au composition, texture, and grain-size of the experimental microstructures employed in this study.After the initial construction, the hybrid Monte Carlo (MC)-molecular dynamics (MD) scheme by Foiles61 and Sadigh et al.62 was used to equilibrate structural aspects and compositional degrees of freedom of the atomistic systems. With such an approach, an MC simulation step was performed with conserved atomic swaps, in which two atoms are randomly selected and if they were different chemical species, their chemical identities were swapped. The swap was then accepted with a Boltzmann probability based on the energy change at the desired temperature. This MC simulation samples the equilibrium canonical ensemble in a closed system with a fixed number of atoms for each species. In this work, each MC-MD cycle included 107 MC steps followed by a 50 ps MD simulation at the desired temperature using a Nosé-Hoover thermostat63 leading to a trajectory in phase space that is consistent with the canonical NVT ensemble. The use of 50 ps of MD after each MC cycle allows for local structural relaxations after swapping the chemical identity of pairs of atoms during MC.58 The MC-MD cycle was repeated until the total simulation time was 20 ns. While the 20 ns MD and 30-minute experimental anneals cannot be compared in a one-to-one manner due to the disparity in time scales between these two approaches, our goal was to show that both the experimental studies and atomistic simulations exhibit similar trends in terms of enhanced thermal stability and sluggish grain growth. All atomistic simulations were performed using LAMMPS64 and an in-house MC code,40,61 and visualizations were generated using Ovito.65 The common neighbor analysis (CNA) metric,66 polyhedral template matching (PTM),67 and dislocation extraction algorithm (DXA)68 were used to identify the local structural environment for each atom (FCC, BCC, HCP, etc.) and reveal materials defects, such as GBs and dislocation lines.
C. Results and discussion
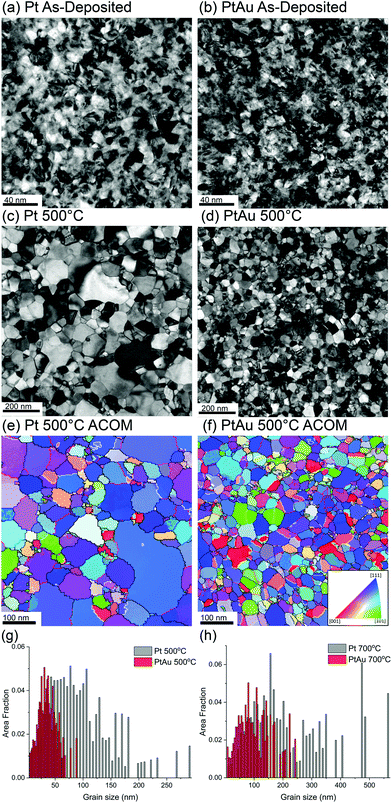
We start by investigating the microstructural evolution of the experimental NC systems. Fig. 1 depicts variations in thermal stability and grain growth kinetics between Pt and Pt–10Au systems. Fig. 1(a)–(d) shows representative bright-field TEM images for pure Pt and Pt–10Au microstructures in the as-deposited and after a 30-minute thermal anneal at 500 °C. The average grain size in pure Pt has grown from 15 ± 5 nm to 99 ± 58 nm (i.e., an increase of 560%), while the Pt–10Au one has only grown from 14 ± 7 nm to 36 ± 17 nm after the 500 °C 30-minute anneal. Representative inverse pole figure (IPF) colored orientation maps for the 500 °C 30-minute anneal condition for Pt and Pt–10Au are shown in Fig. 1(e) and (f). In the IPF colored orientation maps, GBs are overlaid where boundaries labeled in black, red, and white denote HAGBs, LAGBs, and ∑3 twin, respectively. The grain size distributions for the 500 °C and 700 °C 30-minute annealed conditions are shown in Fig. 1(g) and (h), respectively. In both the 500 °C and 700 °C grain size distributions, Pt grains show a positively skewed multimodal distribution with a large grain size spread while Pt–10Au has a considerably smaller average grain size in both conditions. The GB character distribution for the Pt and Pt–10Au NC systems after the 500 °C anneal condition is shown in Table 1. The Pt–10Au is observed to have over a three-fold increase in twin boundary length fraction compared to pure Pt while both materials systems have a relatively high length fraction of LAGBs between 7 and 10%. ACOM data provide the opportunity to examine the orientation texture of the films. In this case, an expected (111) fiber texture developed in the Pt and Pt–10Au free standing films after annealing at both 500 °C and 700 °C as indicated by the strong single 〈111〉 peak in the (111) pole figure plot shown in ESI Fig. 1.†| HAGB (%) | LAGB (%) | ∑3 twin (%) | |
|---|---|---|---|
| Pt 500 °C | 85.0 | 10.3 | 4.8 |
| Pt–10Au 500 °C | 76.1 | 7.1 | 16.7 |
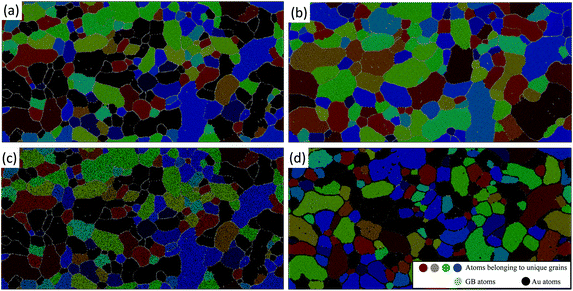
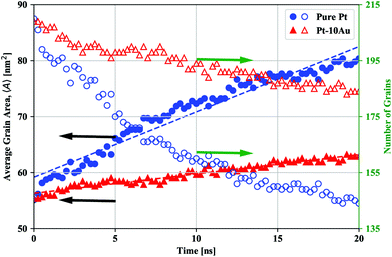
The experimental trends for grain growth kinetics have also been observed in the atomistic simulations. Fig. 2 shows snapshots of the simulated grain structures for the Pt [Fig. 2(a) and (b)] and Pt–10Au [Fig. 2(c) and (d)] systems in the initial state [Fig. 2(a) and (c)] and after 20 ns of thermal anneal at 500 °C [Fig. 2(b) and (d)]. A grain labeling algorithm implemented in Ovito65 was used to segment and cluster the atomistic systems based on grain orientations, where atoms in each crystal were assigned a unique color. GB and Au atoms were colored in gray and black, respectively. It can be seen that the grains in the pure Pt system grew at a faster rate than those in the Pt–10Au one. Further, as can be seen from Fig. 2(d), Au strongly segregated to Pt GBs, which resulted in sluggish grain growth kinetics in the Pt–10Au system (see ESI† for a video of the microstructural evolution). The trends observed in Fig. 2 were quantified by tracking the temporal evolution of both the average grain area 〈A〉 and number of crystalline grains and the results are shown in Fig. 3. The dashed lines are linear fits to the data using 〈A〉 − 〈A〉o = ![[k with combining macron]](https://www.rsc.org/images/entities/i_char_006b_0304.gif) t, where 〈A〉o is the average grain area in the initial state (t = 0) and
t, where 〈A〉o is the average grain area in the initial state (t = 0) and ![[k with combining macron]](https://www.rsc.org/images/entities/i_char_006b_0304.gif) is a parameter that encompasses several materials properties. It can be seen from Fig. 3 that the pure Pt system is characterized by rapid grain coarsening and concomitant decrease in the number of grains, which was nearly halved after 20 ns of thermal anneal at 500 °C. The Pt–10Au system on the other hand exhibits sluggish growth rates due to the strong Au segregation to Pt GBs. In our atomistic simulations, the fits yielded
is a parameter that encompasses several materials properties. It can be seen from Fig. 3 that the pure Pt system is characterized by rapid grain coarsening and concomitant decrease in the number of grains, which was nearly halved after 20 ns of thermal anneal at 500 °C. The Pt–10Au system on the other hand exhibits sluggish growth rates due to the strong Au segregation to Pt GBs. In our atomistic simulations, the fits yielded ![[k with combining macron]](https://www.rsc.org/images/entities/i_char_006b_0304.gif) = 0.60 and 0.16 nm2 ns−1 for the pure Pt and Pt–10Au systems, respectively, which indicates a three-fold reduction in growth rates for the Pt–10Au system. Here, we emphasize that one needs to simulate many NC systems with a larger number of grains and various initial grain structures in order to sample all the possible NC configurations and arrive at a dynamical scaling law for the average grain area of doped systems. Nevertheless, by using the linear fit for the average grain area, our goal is to provide a rough estimate of the enhancement in thermal stability due to GB segregation. For the 30-minute thermal anneal of the Pt–10Au system at 700 °C, the average grain size was 103 ± 57 nm compared to 36 ± 17 nm for the anneal at 500 °C, refer to Fig. 1(g) and (h). This demonstrates that several factors influencing NC thermal stability, such as Pt–Au solubility and configuration entropy contribution, segregation energy, GB mobility, and solute diffusivity, are sensitively dependent on temperature.18
= 0.60 and 0.16 nm2 ns−1 for the pure Pt and Pt–10Au systems, respectively, which indicates a three-fold reduction in growth rates for the Pt–10Au system. Here, we emphasize that one needs to simulate many NC systems with a larger number of grains and various initial grain structures in order to sample all the possible NC configurations and arrive at a dynamical scaling law for the average grain area of doped systems. Nevertheless, by using the linear fit for the average grain area, our goal is to provide a rough estimate of the enhancement in thermal stability due to GB segregation. For the 30-minute thermal anneal of the Pt–10Au system at 700 °C, the average grain size was 103 ± 57 nm compared to 36 ± 17 nm for the anneal at 500 °C, refer to Fig. 1(g) and (h). This demonstrates that several factors influencing NC thermal stability, such as Pt–Au solubility and configuration entropy contribution, segregation energy, GB mobility, and solute diffusivity, are sensitively dependent on temperature.18
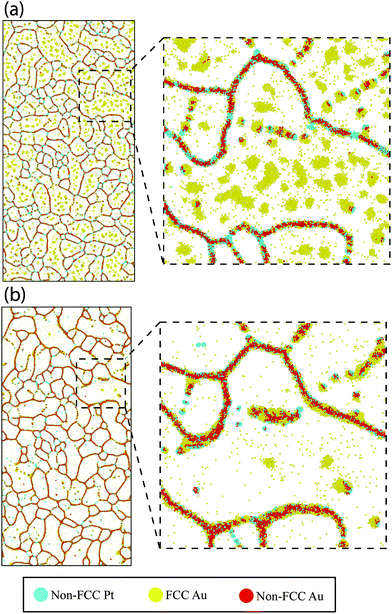
Next, we explore the chemical distribution and solute partitioning in the Pt–10Au system. Fig. 4(a) and (b) shows representative Pt and Au EDS intensity maps for the 500 °C 30-minute anneal condition, where a non-uniform distribution of Au within individual grains is observed. The non-uniform Au distribution within the grain interior is attributed to Au segregation in the immediate vicinity of the GBs and the associated formation of local Au depleted zones; this is further quantified in Fig. 4(c), which shows a line scan over two grains. The line profile indicates both Au depleted zones adjacent to the GBs with an Au concentration nominally below 10 at% and Au enriched zones in the center of the grains nominally above 10 at%. The variation in depth and width of the Au depleted zones adjacent to GBs is an indication of heterogeneous levels of GB Au concentration. Further, a recent study by O'Brien et al.58 demonstrated the existence of a GB phase transformation in Pt–Au, where low and high solute content regions exist within the GB plane. The experimental trends depicted in Fig. 4 were also observed in the atomistic simulations. Fig. 5 shows snapshots of the atomistic Pt–10Au system after 0.25 ns [Fig. 5(a)] and 20 ns [Fig. 5(b)] of thermal anneal at 500 °C using hybrid MC-MD. The insets show close-up views of a region encompassing several Pt grains. In Fig. 5, FCC Pt atoms were removed for a better visualization of the structures and non-FCC Pt (i.e., GBs) ones were colored in turquoise. Gold and red denote FCC (i.e., in the bulk grains) and non-FCC (i.e., in the GB regions) Au atoms, respectively. In the early stage of thermal anneal, both Au phase separation in the form of nanoclusters in Pt grains [cf. Fig. 5(a)] and Au segregation to Pt GBs were observed. This demonstrates competing effects between GB segregation and bulk phase separation, as the Pt–Au alloy is immiscible at this annealing temperature and nominal concentration.69 In a phase field study, Abdeljawad et al.70 showed that solute partitioning in NC binary alloys is highly dependent on the relative strengths of GB segregation and bulk heat of mixing energies. Murdoch and Schuh71 derived analytical expressions combining GB segregation and heat of mixing energies in order to obtain nanostructure stability and solute distribution maps.
 | ||
| Fig. 4 At a temperature of 500 °C, (a) and (b) Pt and Au X-ray intensity maps where dashed box in (b) indicates the location of the Au concentration line scan shown in (c). | ||
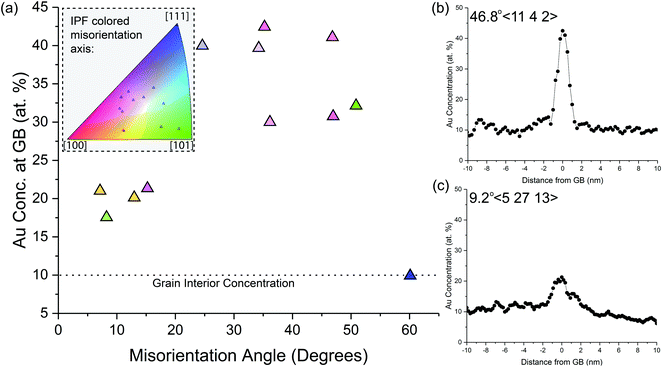
To quantify the level of Au segregation to Pt GBs and its dependence on the GB geometric degrees of freedom, Fig. 6 shows the experimentally-observed GB Au concentration as a function of GB misorientation angle. The location of the misorientation axis for each GB is provided in the inset inverse pole figure. Three global trends of Au segregation levels can be observed in the plot: (1) HAGBs have Au segregation between 30 and 43 at%; (2) LAGBs show Au enrichment between 17 and 22 at%; and (3) coherent ∑3 GBs have no detectable Au segregation above the nominal alloy concentration. For example, Fig. 6(b) and (c) shows characteristic Au concentration line profiles for a HAGB and LAGB, respectively. There was no observable trend between Au segregation levels and the misorientation axis (full GB misorientation data point is shown in Fig. 6(a) inset). The high variation in Au enrichment within the random HAGBs without an apparent trend in misorientation angle could indicate the importance of describing the full macroscopic (i.e., plane normal) and microscopic degrees of freedom defining the GB.
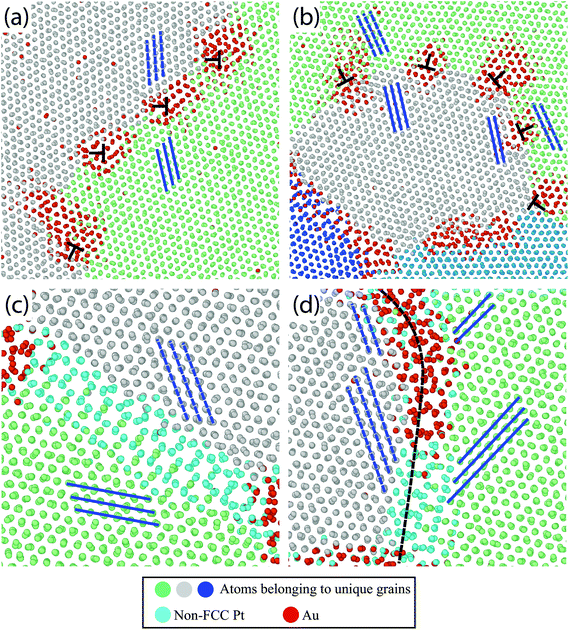
To demonstrate the plethora of Au segregation profiles present in the Pt–10Au system, Fig. 7 shows snapshots of the atomistic system depicting Au segregation to several Pt GBs after 0.25 ns [Fig. 7(a) and (b)] and 20 ns [Fig. 7(c) and (d)] of thermal anneal at 500 °C using hybrid MC-MD. Pt FCC atoms in each crystal were assigned a unique color (grey, green, and blue) and non-FCC Pt (i.e., GBs) and Au atoms were colored in turquoise and red, respectively. The blue lines were drawn to guide the eye to grain orientations. For the LAGBs shown in Fig. 7(a) and (b), it can be seen that Au segregates strongly to the dislocations, identified in Ovito using DXA, that make up these GBs; an effect that bears resemblance to the Cottrell atmosphere.72 In contrast, Fig. 7(c) shows a symmetric GB, where it can be clearly seen that this boundary does not favor Au segregation. Further, Fig. 7(d) shows a segment of a curved GB (i.e., fixed misorientation but varying plane normal) demonstrating the strong dependency of Au segregation on the GB plane normal. Visual inspection shows no Au segregation to the symmetric segment of this GB while strong Au segregation was observed for the asymmetric part. The experimental observations [Fig. 4 and 6] and atomistic simulation results [Fig. 5 and 7] highlight that not only the misorientation angle, but also the additional GB geometric degrees of freedom, such as plane normal, influence Au segregation. For example, recent studies73–75 have shown GB faceting instabilities, in which a macroscopically flat GB breaks into nanoscale facets, and that solute segregation influences this GB faceting behavior.76
We now shift our attention to extracting GB segregation energies from the experimental concentration profiles. This GB thermodynamic data serve as input parameters for meso-scale models of GB solute segregation and grain growth kinetics in NC alloys. With the aid of the regular solution approximation, the GB and bulk grain chemical free energies are described as
fi = GAuic + GPti (1 − c) + RT[c![[thin space (1/6-em)]](https://www.rsc.org/images/entities/char_2009.gif) ln ln![[thin space (1/6-em)]](https://www.rsc.org/images/entities/char_2009.gif) c + (1 − c) ln(1 − c)] + Ωic(1 − c), i = gb, b c + (1 − c) ln(1 − c)] + Ωic(1 − c), i = gb, b | (1) |
 | (2) |
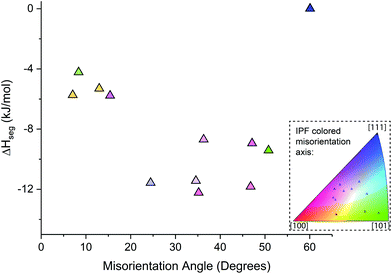
The high degree of heterogenous Au segregation as a function of the misorientation angle and axis shown in Fig. 8 reveals the important impact of GB character and distribution in NC thermal stability. There has been limited exploration of heterogenous solute segregation in NC alloys due to the challenging nature to determine the local GB character. Herbig et al.81 quantified C segregation in a nanocrystalline cold-drawn pearlite steel utilizing a correlative ACOM-TEM and atom probe tomography method. Analogous to the Pt–Au result, similar increase in segregation is observed between LAGB and HAGBs with specific outliers in the HAGB associated with special GBs. In a similar fashion, Zhou et al.45 examined solute segregation in a binary Fe–8%Cr alloy where similar trends between LAGB and HAGB were observed. Recent studies have shown that the propensity for solute segregation is also influenced by the local GB structure, which in turn affects processes such as GB structural transitions.76,82,83
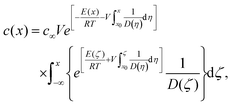
The anisotropy in GB segregation also plays a key role in dynamic solute drag and the kinetic mechanism of thermal stability in NC alloys; an effect that has been largely overlooked in the NC literature. For a migrating GB with a velocity V, Cahn's solute drag model33 predicts a GB concentration profile given by (see ESI† for details on the derivation)
 | (3) |
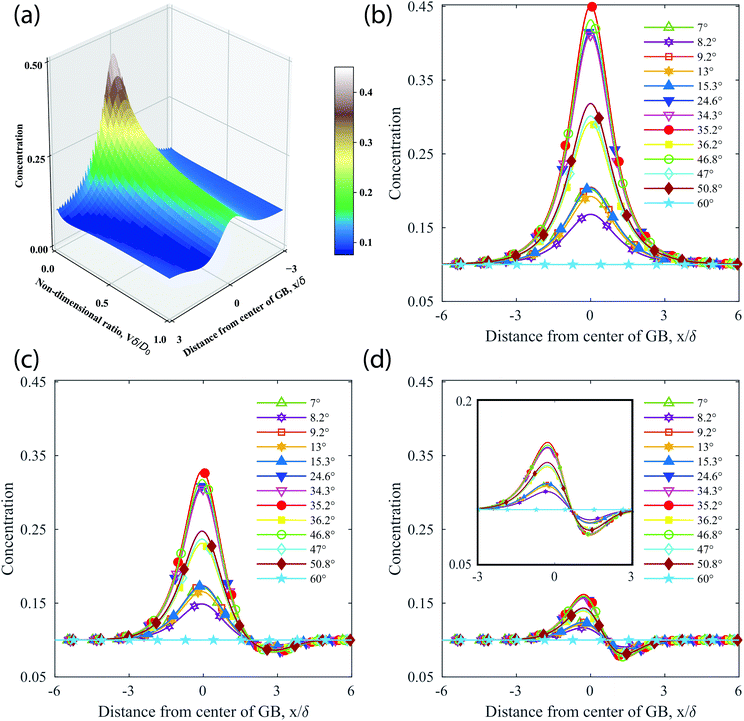 | ||
| Fig. 9 Theoretical analysis of GB concentrations as a function of the misorientation angle using eqn (3). (a) For the GB given by a misorienation angle 35.2°, a surface plot depicting the boundary concentration as a function of distance from the GB x/δ and non-dimensional interface velocity Vδ/Do. (b)–(d) Concentration profiles for all experimentally characterized GBs for Vδ/Do values of (b) 0.0, (c) 0.1, and (d) 1.0. The inset in (d) is a close-up view of the concentration profile depicting the asymmetry about the GB center at x/δ = 0. | ||
Finally, the drag force Pdrag to the migration of doped GBs is given by33
 | (4) |
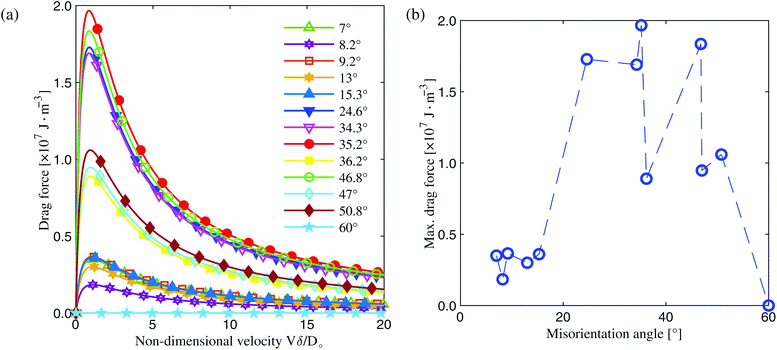 | ||
| Fig. 10 (a) Using eqn (4), solute drag force as a function of the non-dimensional interface velocity Vδ/Do for all GBs explored in this work. (b) The max drag force as a function of GB misorientation, where the dashed blue line is drawn to guide the eye. The max drag force is defined as the peak point in the force–Vδ/Do curves in (a). | ||
Our results highlight the need to take into account variations in GB solute segregation as a function of GB character and its role in grain growth kinetics. Previous studies1,52,53 have indicated that in pure systems, both GB mobility and energy anisotropy greatly influence grain coarsening kinetics. The results reported in this work show that in solute segregating metallic alloys, both the GB segregation energy and the ratio Vδ/Do play a critical role in controlling solute drag effects, and that the drag force is greatly influenced by GB misorientation, at least for the GBs explored in this work. Combining both the knowledge of GB character distributions and associated correlations with the level of solute (i.e., GB chemical states) points to a path forward for atomic scale design and engineering of metallic alloys with tailored microstructures by controlling the network and density of solute rich or solute depleted GBs.
D. Conclusions
In this work, experimental high-resolution microscopy and automated crystal orientation mapping studies were combined with atomistic simulations and theoretical calculations to quantify GB solute segregation and its dependency on GB misorientation in a model NC Pt–Au system. It was found, using both experimental and computational studies, that GB misorientation greatly influences Au segregation to Pt GBs in a Pt–10Au alloy. GB concentration profiles and resultant segregation energies varied by up to a factor of 3 as a function of GB misorientation with the coherent twin GB exhibiting no Au segregation. For the experimentally characterized GBs in our work, theoretical solute drag analysis showed that the drag force for GB motion varied by an order of magnitude as a function of GB misorientation. Further, it was determined that the GB segregation energy alone does not uniquely determine the operating state of a migrating doped GB, as the solute drag force is a highly sensitive function of the ratio of GB velocity to solute diffusivity. Broadly speaking, our approach provides future avenues to use experimentally-obtained GB segregation data in theoretical and computational models in order to quantify the role of GB character in segregation behavior and solute drag effects.Conflicts of interest
There are no conflicts to declare.Acknowledgements
C. M. B., D. P. A., B. L. B., S. M. F., and K. H. were fully supported by the DOE Office of Basic Energy Science, Materials Science and Engineering Division. This work was performed, in part, at the Center for Integrated Nanotechnologies, an Office of Science User Facility operated for the U.S. Department of Energy (DOE) Office of Science. F. A., M. A. and Y. M. would like to acknowledge financial support from the U.S. Army Research Office through the Young Investigator Program Award (award #: W911NF-20-2-0122). Sandia National Laboratories is a multimission laboratory managed and operated by National Technology & Engineering Solutions of Sandia, LLC, a wholly owned subsidiary of Honeywell International, Inc., for the U.S. DOE's National Nuclear Security Administration under contract DE-NA-0003525. The views expressed in the article do not necessarily represent the views of the U.S. DOE or the United States Government.References
- E. A. Holm and S. M. Foiles, Science, 2010, 328, 1138 CrossRef CAS.
- N. Wang, Z. Wang, K. T. Aust and U. Erb, Acta Metall. Mater., 1995, 43, 519 CrossRef CAS.
- V. Y. Gertsman and S. M. Bruemmer, Acta Mater., 2001, 49, 1589 CrossRef CAS.
- M. A. Meyers, A. Mishra and D. J. Benson, Prog. Mater. Sci., 2006, 51, 427 CrossRef CAS.
- R. A. Andrievski, J. Mater., Sci., 2014, 49, 1449 CrossRef CAS.
- G. Wilde and H. Rösner, J. Mater. Sci., 2007, 42, 1772 CrossRef CAS.
- M. Saber, C. C. Koch and R. O. Scattergood, Mater. Res. Lett., 2015, 3, 65 CrossRef.
- M. Saber, H. Kotan, C. Koch and R. O. Scattergood, J. Appl. Phys., 2013, 113, 063515 CrossRef.
- J. R. Weertman, Science, 2012, 337, 921 CrossRef CAS.
- H. Gleiter, Acta Mater., 2000, 48, 1 CrossRef CAS.
- J. F. Curry, T. F. Babuska, T. A. Furnish, P. Lu, D. P. Adams, A. B. Kustas, B. L. Nation, M. T. Dugger, M. Chandross, B. G. Clark, B. L. Boyce, C. A. Schuh and N. Argibay, Adv. Mater., 2018, 30, 1802026 CrossRef.
- D. Raabe, M. Herbig, S. Sandlöbes, Y. Li, D. Tytko, M. Kuzmina, D. Ponge and P.-P. Choi, Curr. Opin. Solid State Mater. Sci., 2014, 18, 253 CrossRef CAS.
- V. Yamakov, D. Wolf, S. R. Phillpot and H. Gleiter, Acta Mater., 2003, 51, 4135 CrossRef CAS.
- O. Dmitrieva, D. Ponge, G. Inden, J. Millán, P. Choi, J. Sietsma and D. Raabe, Acta Mater., 2011, 59, 364 CrossRef CAS.
- M. R. S. Soares, C. A. R. Costa, E. M. Lanzoni, J. Bettini, C. A. O. Ramirez, F. L. Souza, E. Longo and E. R. Leite, Adv. Electron. Mater., 2019, 5, 1900065 CrossRef.
- T. Chookajorn, H. A. Murdoch and C. A. Schuh, Science, 2012, 337, 951 CrossRef CAS.
- B. K. VanLeeuwen, K. A. Darling, C. C. Koch, R. O. Scattergood and B. G. Butler, Acta Mater., 2010, 58, 4292 CrossRef CAS.
- P. Lu, F. Abdeljawad, M. Rodriguez, M. Chandross, D. P. Adams, B. L. Boyce, B. G. Clark and N. Argibay, Materialia, 2019, 6, 100298 CrossRef.
- J. Weissmüller, W. Krauss, T. Haubold, R. Birringer and H. Gleiter, Nanostruct. Mater., 1992, 1, 439 CrossRef.
- T. Frolov, K. A. Darling, L. J. Kecskes and Y. Mishin, Acta Mater., 2012, 60, 2158 CrossRef CAS.
- M. A. Atwater, D. Roy, K. A. Darling, B. G. Butler, R. O. Scattergood and C. Koch, Mater. Sci. Eng., A, 2012, 558, 226 CrossRef CAS.
- K. Darling, R. Chan, P. Wong, J. Semones, R. Scattergood and C. Koch, Scr. Mater., 2008, 59, 530 CrossRef CAS.
- M. Saber, H. Kotan, C. C. Koch and R. O. Scattergood, Mater. Sci. Eng., A, 2012, 556, 664 CrossRef CAS.
- K. A. Darling, B. VanLeeuwen, J. Semones, C. Koch, R. Scattergood, L. Kecskes and S. Mathaudhu, Mater. Sci. Eng., A, 2011, 528, 4365 CrossRef.
- B. G. Clark, K. Hattar, M. T. Marshall, T. Chookajorn, B. L. Boyce and C. A. Schuh, JOM, 2016, 68, 1625 CrossRef CAS.
- B. Färber, E. Cadel, A. Menand, G. Schmitz and R. Kirchheim, Acta Mater., 2000, 48, 789 CrossRef.
- A. Detor and C. Schuh, Acta Mater., 2007, 55, 4221 CrossRef CAS.
- K. A. Darling, L. J. Kecskes, M. Atwater, J. Semones, R. O. Scattergood and C. Koch, J. Mater. Res., 2013, 28, 1813 CrossRef CAS.
- C. Koch, R. Scattergood, M. Saber and H. Kotan, J. Mater. Res., 2013, 28, 1785 CrossRef CAS.
- J. Weissmüller, Nanostruct. Mater., 1993, 3, 261 CrossRef.
- J. Weissmüller, J. Mater. Res., 1994, 9, 4 CrossRef.
- J. Trelewicz and C. Schuh, Phys. Rev. B: Condens. Matter Mater. Phys., 2009, 79, 94112 CrossRef.
- J. W. Cahn, Acta Metall., 1962, 10, 789 CrossRef CAS.
- M. Hillert and B. Sundman, Acta Metall., 1976, 24, 731 CrossRef CAS.
- M. Hillert, Acta Metall., 1988, 36, 3177 CrossRef CAS.
- D. Rowenhorst, A. D. Rollett, G. S. Rohrer, M. Groeber, M. Jackson, P. J. Konijnenberg and M. De Graef, Modell. Simul. Mater. Sci. Eng., 2015, 23, 083501 CrossRef.
- D. Olmsted, S. M. Foiles and E. A. Holm, Acta Mater., 2009, 57, 3694 CrossRef CAS.
- D. Olmsted, E. Holm and S. M. Foiles, Acta Mater., 2009, 57, 3704 CrossRef CAS.
- Y. Mishin and C. Herzig, Mater. Sci. Eng., A, 1999, 260, 55 CrossRef.
- A. Seki, D. Seidman, Y. Oh and S. M. Foiles, Acta Metall. Mater., 1991, 39, 3167 CrossRef CAS.
- A. Gupta, X. Zhou, G. B. Thompson and G. J. Tucker, Acta Mater., 2020, 190, 113 CrossRef CAS.
- L. Huber, R. Hadian, B. Grabowski and J. Neugebauer, npj Comput. Mater., 2018, 4, 64 CrossRef.
- M. Wagih and C. A. Schuh, Acta Mater., 2019, 181, 228 CrossRef CAS.
- P. Wynblatt and Z. Shi, J. Mater. Sci., 2005, 40, 2765 CrossRef CAS.
- X. Zhou, X. Yu, T. Kaub, R. L. Martens and G. B. Thompson, Sci. Rep., 2016, 6, 34642 CrossRef CAS.
- A. Stoffers, O. Cojocaru-Mirédin, W. Seifert, S. Zaefferer, S. Riepe and D. Raabe, Prog. Photovoltaics Res. Appl., 2015, 23, 1742 CrossRef CAS.
- S. Mandal, K. G. Pradeep, S. Zaefferer and D. Raabe, Scr. Mater., 2014, 81, 16 CrossRef CAS.
- D. N. Seidman, Annu. Rev. Mater. Res., 2002, 32, 235 CrossRef CAS.
- J. F. Nie, Y. M. Zhu, J. Z. Liu and X. Y. Fang, Science, 2013, 340, 957 CrossRef CAS.
- A. D. Rollett, D. J. Srolovitz and M. P. Anderson, Acta Metall., 1989, 37, 1227 CrossRef CAS.
- G. S. Grest, D. J. Srolovitz and M. P. Anderson, Acta Metall., 1985, 33, 509 CrossRef CAS.
- A. Kazaryan, Y. Wang, S. A. Dregia and B. R. Patton, Acta Mater., 2002, 50, 2491 CrossRef CAS.
- M. Upmanyu, G. N. Hassold, A. Kazaryan, E. A. Holm, Y. Wang, B. Patton and D. J. Srolovitz, Interface Sci., 2002, 10, 201 CrossRef.
- H. A. Atwater, C. V. Thompson and H. I. Smith, Phys. Rev. Lett., 1988, 60, 112 CrossRef CAS.
- M. R. He, S. K. Samudrala, G. Kim, P. J. Felfer, A. J. Breen, J. M. Cairney and D. S. Gianola, Nat. Commun., 2016, 7, 1 Search PubMed.
- D. G. Brandon, Acta Metall., 1966, 14, 1479 CrossRef CAS.
- C. B. Carter and D. B. Williams, Transmission Electron Microscopy: Diffraction, Imaging, and Spectrometry, Springer International Publishing, 2016 Search PubMed.
- C. J. O'Brien, C. M. Barr, P. M. Price, K. Hattar and S. M. Foiles, J. Mater. Sci., 2018, 53, 2911 CrossRef.
- J. Gruber, H. Lim, F. Abdeljawad, S. Foiles and G. J. Tucker, Comput. Mater. Sci., 2017, 128, 29 CrossRef CAS.
- G. J. Tucker and S. M. Foiles, Mater. Sci. Eng., A, 2013, 571, 207 CrossRef CAS.
- S. M. Foiles, Phys. Rev. B: Condens. Matter Mater. Phys., 1985, 32, 7685 CrossRef CAS.
- B. Sadigh, P. Erhart, A. Stukowski, A. Caro, E. Martinez and L. Zepeda-Ruiz, Phys. Rev. B: Condens. Matter Mater. Phys., 2012, 85, 184203 CrossRef.
- W. Shinoda, M. Shiga and M. Mikami, Phys. Rev. B: Condens. Matter Mater. Phys., 2004, 69, 134103 CrossRef.
- S. Plimpton, J. Comput. Phys., 1995, 117, 1 CrossRef CAS.
- A. Stukowski, Model. Simul. Mater. Sci. Eng., 2010, 18, 015012 CrossRef.
- J. D. Honeycutt and H. C. Andersen, J. Phys. Chem., 1987, 91, 4950 CrossRef CAS.
- P. M. Larsen, S. Schmidt and J. Schiøtz, Model. Simul. Mater. Sci. Eng., 2016, 24, 055007 CrossRef.
- A. Stukowski, V. V. Bulatov and A. Arsenlis, Model. Simul. Mater. Sci. Eng., 2012, 20, 085007 CrossRef.
- H. Okamoto and T. B. Massalski, Bull. Alloy Phase Diagrams, 1985, 6, 46 CrossRef CAS.
- F. Abdeljawad, P. Lu, N. Argibay, B. G. Clark, B. L. Boyce and S. M. Foiles, Acta Mater., 2017, 126, 528–539 CrossRef CAS.
- H. Murdoch and C. Schuh, Acta Mater., 2013, 61, 2121 CrossRef CAS.
- Y. Mishin and J. W. Cahn, Acta Mater., 2016, 117, 197 CrossRef CAS.
- F. Abdeljawad, D. L. Medlin, J. A. Zimmerman, K. Hattar and S. M. Foiles, J. Appl. Phys., 2016, 119, 235306 CrossRef.
- F. Abdeljawad, S. M. Foiles, A. P. Moore, A. R. Hinkle, C. M. Barr, N. M. Heckman, K. Hattar and B. L. Boyce, Acta Mater., 2018, 158, 440 CrossRef CAS.
- J. C. Hamilton, D. Siegel, I. Daruka and F. Léonard, Phys. Rev. Lett., 2003, 90, 246102 CrossRef CAS.
- N. J. Peter, T. Frolov, M. J. Duarte, R. Hadian, C. Ophus, C. Kirchlechner, C. H. Liebscher and G. Dehm, Phys. Rev. Lett., 2018, 121, 255502 CrossRef CAS.
- P. Lejček, Grain Boundary Segregation in Metals, Springer, 2010 Search PubMed.
- D. McLEan, Grain Boundaries in Metals, Oxford Clarendon Press, 1957 Search PubMed.
- E. D. Hondros and M. P. Seah, Metall. Trans. A, 1977, 8, 1363 CrossRef.
- P. Lejček and S. Hofmann, Crit. Rev. Solid State Mater. Sci., 1995, 20, 1 CrossRef.
- M. Herbig, D. Raabe, Y. J. Li, P. Choi, S. Zaefferer and S. Goto, Phys. Rev. Lett., 2013, 112, 126103 CrossRef.
- T. Frolov, M. Asta and Y. Mishin, Phys. Rev. B: Condens. Matter Mater. Phys., 2015, 92, 020103 CrossRef.
- T. Meiners, T. Frolov, R. E. Rudd, G. Dehm and C. H. Liebscher, Nature, 2020, 579, 375 CrossRef CAS.
Footnote |
| † Electronic supplementary information (ESI) available. See DOI: 10.1039/D0NR07180C |
| This journal is © The Royal Society of Chemistry 2021 |

