
 Open Access Article
 This Open Access Article is licensed under a Creative Commons Attribution-Non Commercial 3.0 Unported Licence
A universal signature in the melting of metallic nanoparticles†
Laia
Delgado-Callico‡
 ,
Kevin
Rossi‡§
,
Raphael
Pinto-Miles
,
Pascal
Salzbrenner¶
and
Francesca
Baletto
*
,
Kevin
Rossi‡§
,
Raphael
Pinto-Miles
,
Pascal
Salzbrenner¶
and
Francesca
Baletto
*
Department of Physics, King's College London, Strand, London WC2R 2LS, UK. E-mail: francesca.baletto@kcl.ac.uk
First published on 17th December 2020
Abstract
Predicting when phase changes occur in nanoparticles is fundamental for designing the next generation of devices suitable for catalysis, biomedicine, optics, chemical sensing and electronic circuits. The estimate of the temperature at which metallic nanoparticles become liquid is, however, a challenge and a standard definition is still missing. We discover a universal feature in the distribution of the atomic-pair distances that distinguishes the melting transition of monometallic nanoparticles. We analyse the solid–liquid change of several late-transition metals nanoparticles, i.e. Ni, Cu, Pd, Ag, Au and Pt, through classical molecular dynamics. We consider various initial shapes from 146 to 976 atoms, corresponding to the 1.5–4.1 nm size range, placing the nanoparticles in either a vacuum or embedded in a homogeneous environment, simulated by an implicit force-field. Regardless of the material, its initial shape, size and environment, the second peak in the pair-distance distribution function, expected at the bulk lattice distance, disappears when the nanoparticle melts. As the pair-distance distribution is a measurable quantity, the proposed criterion holds for both numerical and experimental investigations. For a more straightforward calculus of the melting temperature, we demonstrate that the cross-entropy between a reference solid pair-distance distribution function and the one of nanoparticles at increasing temperatures present a quasi-first order transition at the phase-change temperature.
1. Introduction
The novelty of nanotechnology stems from the unique physical and chemical properties of its building blocks, known as nanoparticles (NPs). Nanoparticles differ from both their atomic and bulk counterparts because of their large surface-to-volume ratio and of the coexistence of different isomers. At first thought, there is an expectation that the NP physical properties will show a smooth dependence with the size and shape of the NP itself.1 During the last century, Pavlov's suggestion2 of a linear depression of the melting point with the inverse of the NP diameter has been confirmed in several experiments.3 Nevertheless, deviations from this general trend occur, especially in NP of small sizes. As well-known examples, the melting temperature of Na NPs shows large fluctuations with NP-size4 while for Ga or Sn nanoparticles melting points can also exceed the bulk limit.5–7 Furthermore, the thermal stability of nanoparticles plays an important role in the applications derived from their physical and chemical properties – these range from catalysis and sintering to biomedicine, optics to chemical sensing, electronic circuits to energy storage.8–14 Therefore, Lord Kelvin's question “Does the melting temperature of a small particle depend on its size?”15 is still very actual.Several theoretical,16–18 numerical19–27 and experimental investigations3–6,28–33 have thus succeeded one another to capture the complexity inherent to the phase changes in nanosized systems. To answer Lord Kelvin's question in full detail, we need to find measurable and computable physical quantities which probe when a solid–liquid (and vice versa) phase change takes place. Different experimental techniques such as electron diffraction,28,29 mass spectrometry,30 calorimetry31,34 and optical spectroscopy35–38 relate the change of some physical quantities, i.e. optical/mass spectra or diffusion cross-sections, to a phase change in the nanoparticle. The direct analysis of the caloric and heat capacity curves is also a traditional tool to detect phase changes.19,23,24,39–42 Indeed, solid–solid and solid–liquid transitions are characterised by peaks in the heat capacity vs. temperature curve.43,44
Molecular dynamics simulations can provide insights into the appearance of kinetics factors during phase transitions. For example, it has been demonstrated that the hysteresis of the melting- and the freezing-points of a metallic nanoparticle (MNP) is due to differences inherent to the mechanisms through which solid–liquid and solid–solid changes take place.24,39,40 Similarly, it was shown that the melting might proceed in a multi-step fashion, i.e. from surface to the core, in sufficiently large spherical nanoparticles. In addition, there is evidence that the environment surrounding the MNP affects its thermodynamical stability, resulting, for example, in a pronounced smoothness of the caloric curve.45
Looking at differences in the structure of solid and liquid nanoparticles is also a robust method to detect phase changes both experimentally and numerically. Recently, van Teijlingen et al.32 reported transmission electron microscopy measurements which show a surge of at least 4.3% in the averaged diameter of spherical-like MNPs at the melting. Nonetheless, Kovar's group, employing the same technique, reported a shrinkage of Ag-nanoparticles during their melting.46
Numerically, the comparison of the relative abundances of atoms displaying a specific and well defined local arrangement40,47–49 is an efficient way to discriminate phase changes with respect to solid-to-solid transitions. Another popular method is based on probing the root mean bond fluctuations per each atom, where a system is defined as melted if the average bond fluctuations are above a certain threshold, i.e. the Lindemann's criterion.50–52 Besides all the studies performed, the quest to identify a universal signature that marks a phase change of nanoparticles and, at the same time, is common to both numerical simulations and experiments is still open and motivates our investigation.
Here, we demonstrate how to distinguish the solid–liquid phase change of metallic nanoparticles on the basis of their pair-distance distribution function (PDDF). The PDDF can be measured as the Fourier transform of an X-ray diffraction spectra. With an atomic resolution from a few Å up to several nanometers,53,54 it is a powerful method to detect amorphous,55 and crystalline nanomaterials.56–58 It provides structural insights of the nearest coordination environment and the appearance of long-range order or local disorder.59–61 The PDDF peaks can be associated to specific pairs of atoms, up to the third neighbour, even in nanoparticles of less than 2 nm.62 It is important to note that the PDDF analysis can be carried out for MNPs smaller than 5 nm, with a resolution often not accessible to other techniques.61,62
We observe that the second peak of the PDDF of a variety of noble and quasi-noble MNPs disappears at the temperature where the potential energy presents a quasi-first order phase transition, and where the heat capacity vs. temperature curve presents its maximum peak – i.e. the melting temperature. We validated this observation by sampling the structural evolution of MNPs with sizes in the 1.5–4.1 nm range, either in vacuum or surrounded by a homogeneous interacting environment, at various temperatures. We consistently observe the disappearance of the second peak in the PDDF in correspondence with the NP melting. Therefore, we consider this occurrence as a universal signature of phase change in metallic nanoparticles. To quantitatively support this observation, we compare it with standard descriptors. We further show the correlation between the nanoparticle caloric curve and the temperature-dependent relative cross-entropy of the pair-distance distribution function between a “cold” and a “hot” reference structure. Finally, we probe the influence of an interacting environment surrounding the nanoparticles, confirming that our characterisation method is as robust in a liquid-type environment as in vacuo.
2. Simulation methods
For a comprehensive structural characterisation of transition metal nanoparticles we focus on a wide set of nanoparticles of diverse elements (Ni, Cu, Pd, Ag, Au and Pt), sizes (1.5–4.1 nm), and initial shapes (Fig. S1† provides the correspondence between number of atoms, diameter and initial shape). To simulate phase changes in metallic nanoparticles we concatenate canonical molecular dynamics runs where the temperature of the system is increased by ΔT every Δτ time. The ratio ΔT/Δτ tunes the heating rate, hence determining the kinetics of the solid–liquid phase change.40,63 Our choice is a rate of 5 K ns−1, with ΔT = 25 K and Δτ = 5 ns. As shown in our previous work, this choice of heating rate can lead to an underestimate of the melting temperature by up to 25 K.40 In the ESI (Fig. S29†), we discuss the effect of the heating rate. We demonstrate for a few cases that our conclusions hold independently of the heating rate. Nevertheless, we stress that the aim of this work is to show that there exists a unique, simple and measurable feature to identify the solid–liquid transition in monometallic nanoparticles.We use a Velocity–Verlet algorithm to evolve Newton's equation of motion, and we apply an Andersen thermostat to mimic the interaction of the MNP with a stochastic bath. The initial and final temperatures depend on each nanosystem, and are adjusted such that the solid–liquid transition is clearly mapped while carrying out the simulations in an affordable time. We model metal–metal interactions according to the second-moment approximation of the tight-binding64 model, whose parametrisations for the metals considered here are reported elsewhere.65 To model the interaction of a MNP with a non-inert, homogeneous environment, EM–Ei, we adhere to the formalism introduced by Cortes-Huerto and coworkers.45 Here, EM–Ei is calculated as a function of the number of absent bonds of surface atoms, with respect to their positioning in the bulk, CNopen = CNbulk − CNi, weighted by two free parameters ε (in eV) and ρ (dimensionless):
| EM–Ei = −εCNρopen. | (1) |
We fix CNbulk equal to 12 since we consider only metals with a FCC packing in the bulk. CNi is calculated analytically as in ref. 66.
In this framework, the nature of the interaction between the atoms at the surface and the environment is encoded in the ρ parameter. It takes a value of 1 for pairwise interaction, <1 for covalent-like interactions, and >1 for strongly interacting environments. The ε parameter tunes the interaction strength instead. Different ρ and ε parameters set the ratio between the surface energies of low Miller-index terminations, thus introducing a parameter to favour one architecture over another one. We employ the following (ρ, ε) sets: (1, 0.02 eV), (1, 0.04 eV), (1, 0.08 eV), (1.5, 0.02 eV), (1.5, 0.04 eV) and (2, 0.02 eV). While these parameters do not explicitly refer to any specific type of chemical and/or condition, we note that the metal-environment model for Au nanoparticles employing parameters (1.5, 0.04 eV) and (2.0, 0.02 eV) was found to qualitatively match structural trends for the interaction of Au NP with a solution of cetyltrimethylammonium bromide with silver ions.67
3. Energy and characterisation methods
To analyse within a coherent framework the energetic trends found for nanoparticles of different size and composition we monitor their excess energy Δ:65| Δ = (Etot − NEcoh)/N2/3, | (2) |
To characterise the nanoparticles structural evolution when subject to heating up to melting and beyond, we monitor the distribution of the distances between each pair of atoms therein, i.e. their PDDF:
 | (3) |
Numerically, the resolution of the PDDF is dictated by the choice of the binning distance, which determines if two atoms are allocated into different bins (i.e. the width of the δ function in eqn (3)). This choice needs to balance between a too high resolution – where each distance might be present a single time, hence resulting in a PDDF that yields no useful information – and a too low one – where different neighbour shells are projected onto the same distance width, resulting in a too coarse description of the system.
We chose a bin width of 0.05 Å. Taking half of the distance between the first and second nearest neighbour as the largest distance bin width is, in principle, a proper choice for distinguishing nearest neighbours peaks in solids. We note that given enough statistics any smaller bin width would be a suitable choice too. The characterisation of the PDDF evolution in our sampled configurations is also valid upon the choice of a bin width of at least 0.005 Å. Fig. S2–S4 and S28† depict paradigmatic examples of such analysis for both solid and melted Pt nanoparticles of 201 atoms.
To ease the characterisation of the PDDF profile evolution at different temperatures, we estimate the Kullback–Leibler divergence,68 using the PDDF up to the second neighbour distance, between a reference temperature (from now on denominated as “cold”, c) and a higher temperature (from now on labelled as “hot”, h). Commonly used in information theory, the Kullback–Leibler divergence (KL(h|c)) – also known as cross-entropy – establishes a quantification of the amount of information lost when a function c is used to approximate another function h. It takes values of 0 if h and c are equal and increases the more they differ. For a discrete distribution, it is calculated as:
 | (4) |
During the dynamical evolution, we store instantaneous atomic positions, system excess energy, and temperature every 10 ps. For a rigorous investigation we analyze results averaged from eight independent simulations.
We average the instantaneous excess energies of all the configurations in the same NVT ensemble and calculate the standard deviation from the average excess energy. Similarly, for each configuration we first calculate the corresponding PDDF. Afterwards, we estimate an average PDDF for each temperature by summing the instantaneous PDDF therein, normalized by the number of configurations.
4. Results
A representative array of PDDFs for metallic nanoparticles of different sizes, shapes and compositions is reported in Fig. 1. The two panels refer to two different temperatures, namely “cold” (left panel) and “hot” (right panel). The reported PDDFs are averaged over eight independent simulations employing the same starting configuration but different initial velocities (yet coherent with the initial NVT ensemble of choice). We note that the PDDF first peak falls close to, but is less than, the expected value of the nearest neighbours distance of a FCC √2/2 of the bulk lattice constant.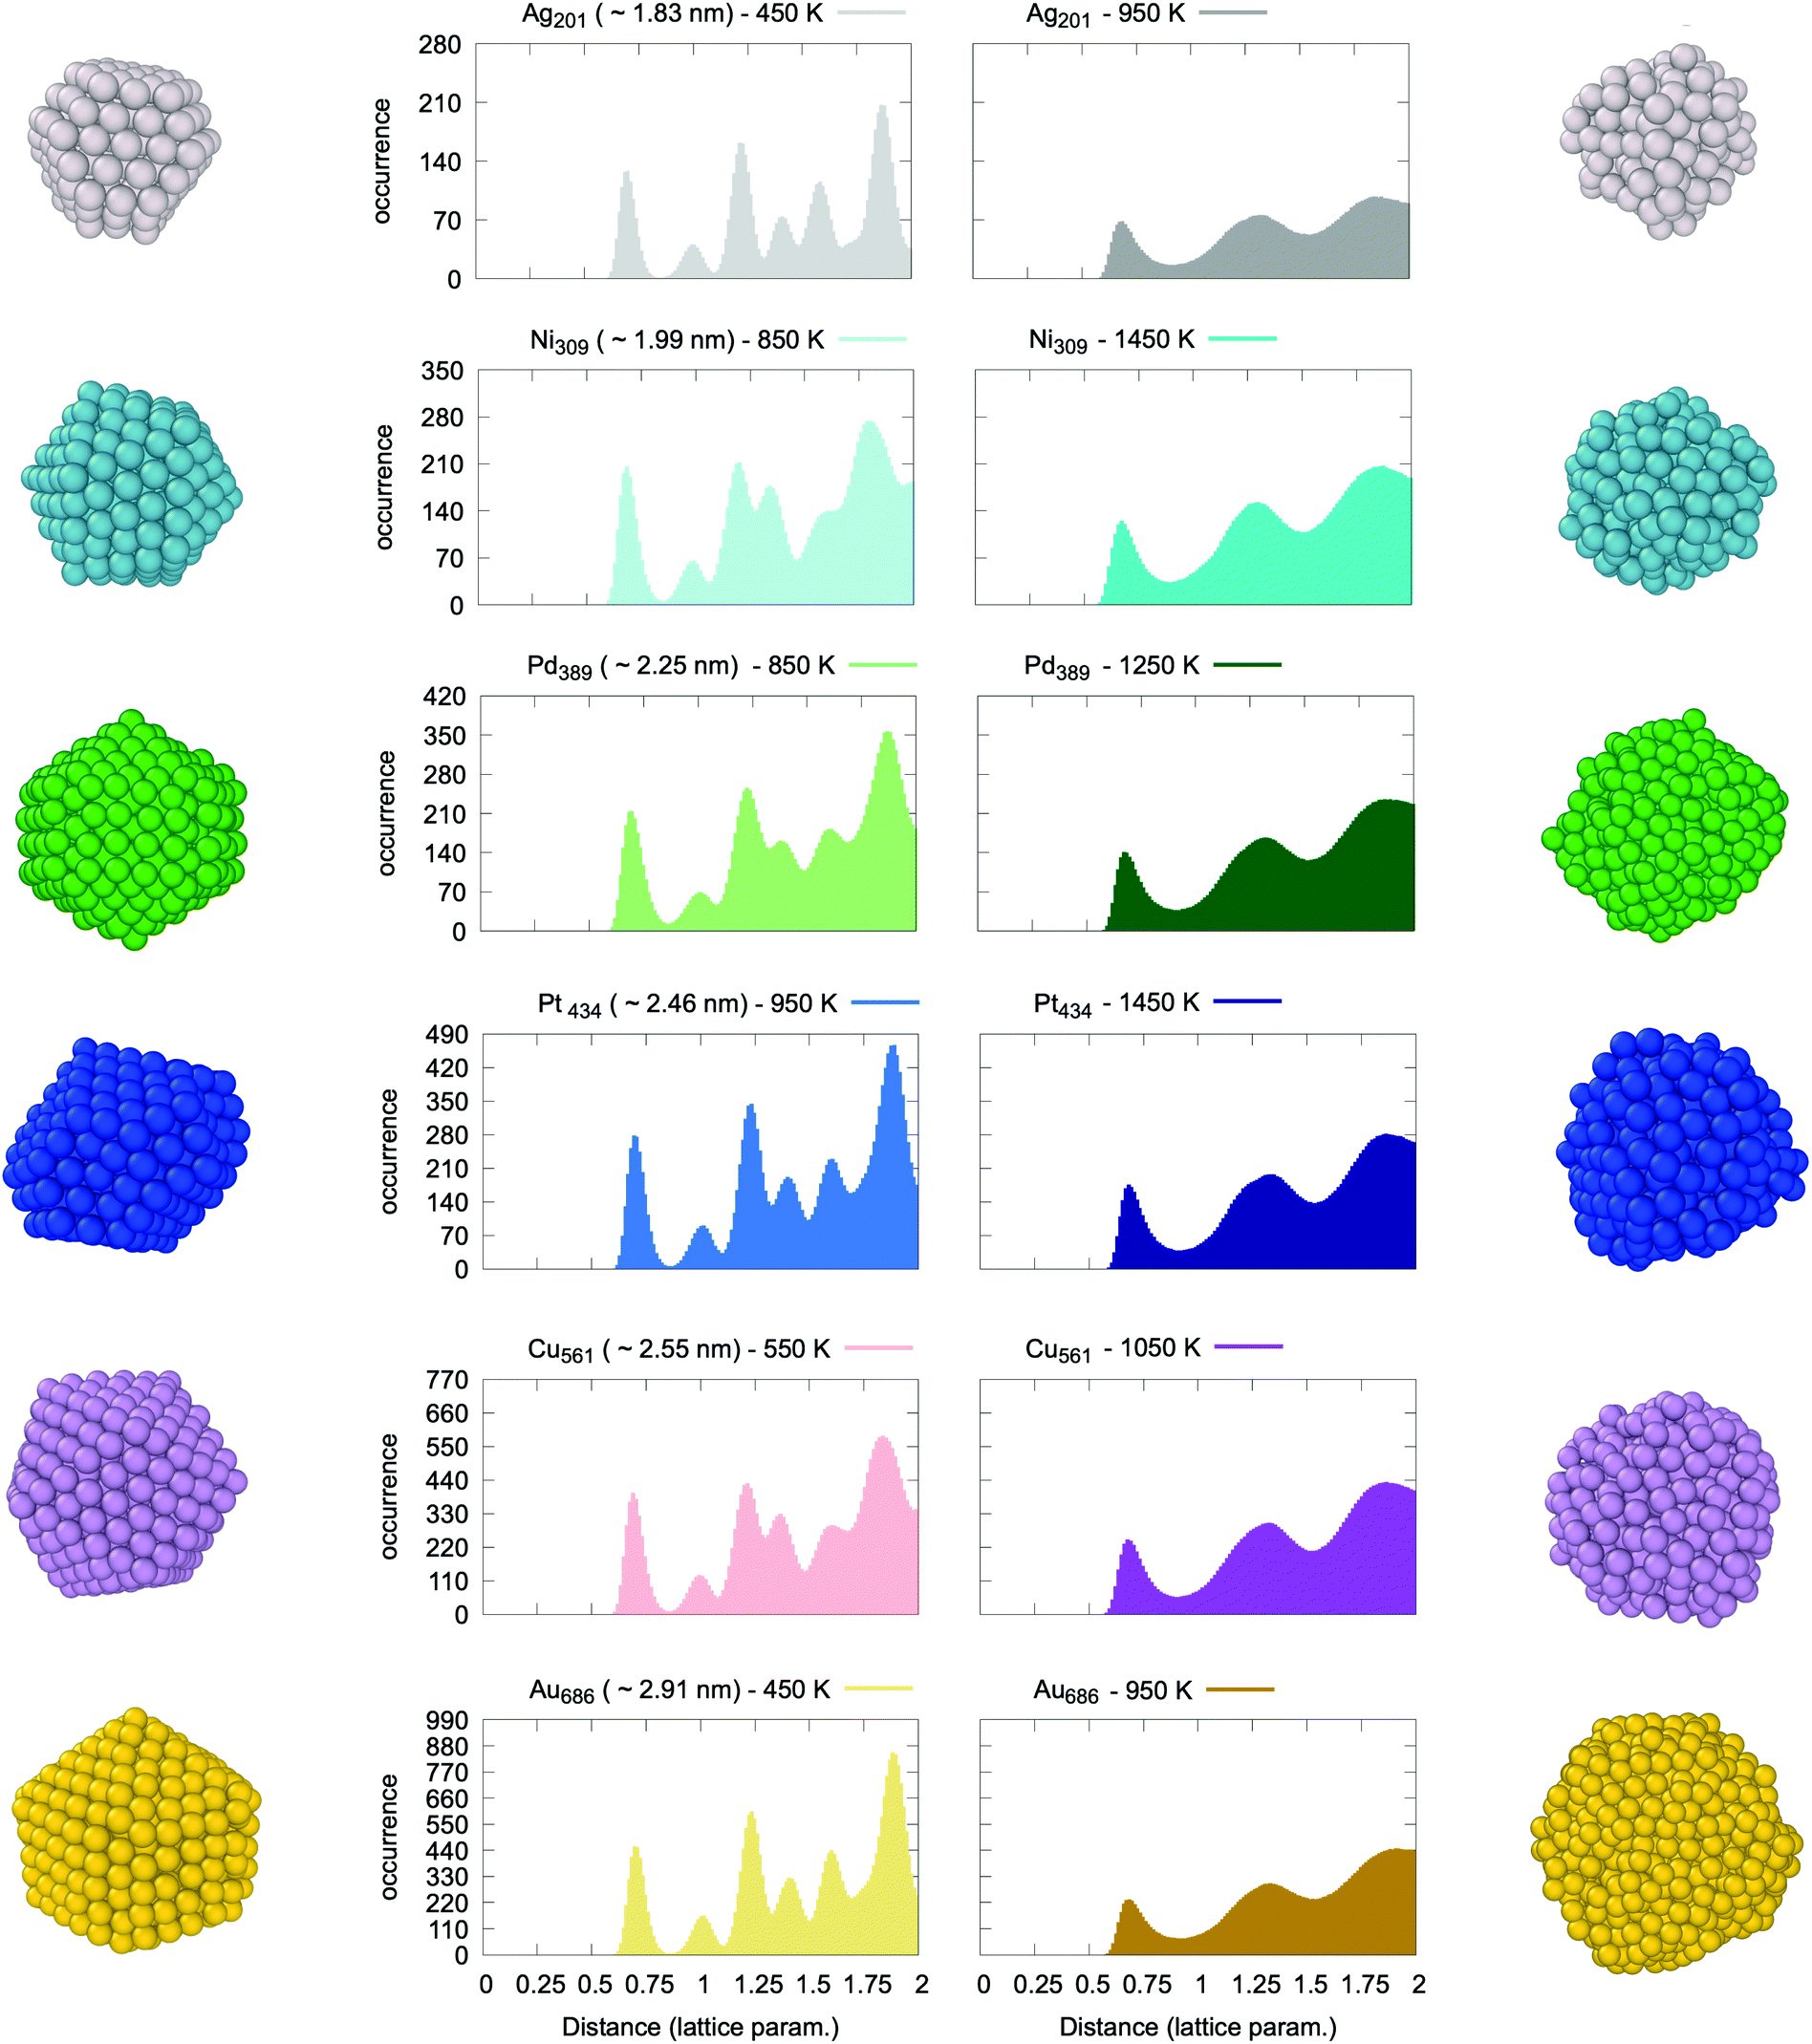 | ||
| Fig. 1 Central panels display the average pair-distance distribution function of MNPs: for each temperature, we average over the instantaneous PDDF of the configuration sampled during the corresponding time interval (5 ns). Colours identify the different metals from top to bottom: Ag (grey), Ni (cyan), Pd (green), Pt (blue), Cu (purple), Au (yellow). Light colours on the left panel correspond to solid structure (“cold”) while dark colours to the liquid phase (“hot”) on the right panel. We also show snapshots of each configuration sampled at “cold” (left) and “hot” (right) temperatures. | ||
At “cold” temperatures, the second peak of the PDDF is instead close to the bulk lattice constant. The other peaks of the PDDF depend on the specific NP geometry and size. In the case of liquid droplets (“hot” temperature) depicted in the right panel of Fig. 1, we systematically observe the absence of a peak from the PDDF at the bulk lattice distance. We also note that the longest pair-distance increases with temperature when the initial system displays an isotropic/spherical-like shape (e.g. icosahedra, truncated octahedra) (see Fig. S7–S26†). Nevertheless, this is not the case for MNPs which display an anisotropic shape (e.g. octahedra and nanorods) as discussed in section 3 of the ESI (Fig. S5 and S6†), in agreement with experiments.32,46 Anisotropic shapes are expected to undergo structural rearrangements before melting, but this tendency depends on the heating rate and the nanoparticle size. While this is a topic of great interest,69,70 we believe that future dedicated studies will be better suited to discuss it in more detail.
Following a careful assessment of the temperature-evolution of the position of the PDDF peaks, we note that the second peak – at the 2nd nearest-neighbour distance (or bulk lattice in FCC metals) – systematically and gradually diminishes in intensity at increasing temperatures (see Fig. S7–S26†). Fig. 2 reports the paradigmatic example of the temperature dependent evolution of the PDDF in a Ag nanoparticle of 201 atoms (1.8 nm diameter), the peak at around 4.08 Å is clear at 625 K, whilst it becomes a shoulder of the third neighbours’ peak around 675 K and vanishes above this temperature. The latter corresponds to the melting temperature, Tm, obtained from the caloric curve analysis – the temperature where the average excess energy has the largest standard deviation – and where the heat capacity has its maximum. Our melting temperature estimate is in agreement with previous numerical reports, employing a second-moment tight binding approximation to model the interatomic interactions on Ag nanoparticles of similar size.71,72 Few are the experimental reports instead available in the literature to our knowledge. A study suggested a lower melting temperature, however, it is worth noting that the studied nanoparticles were embedded in a thin film and curvature effects were invoked to explain a lower melting point.46
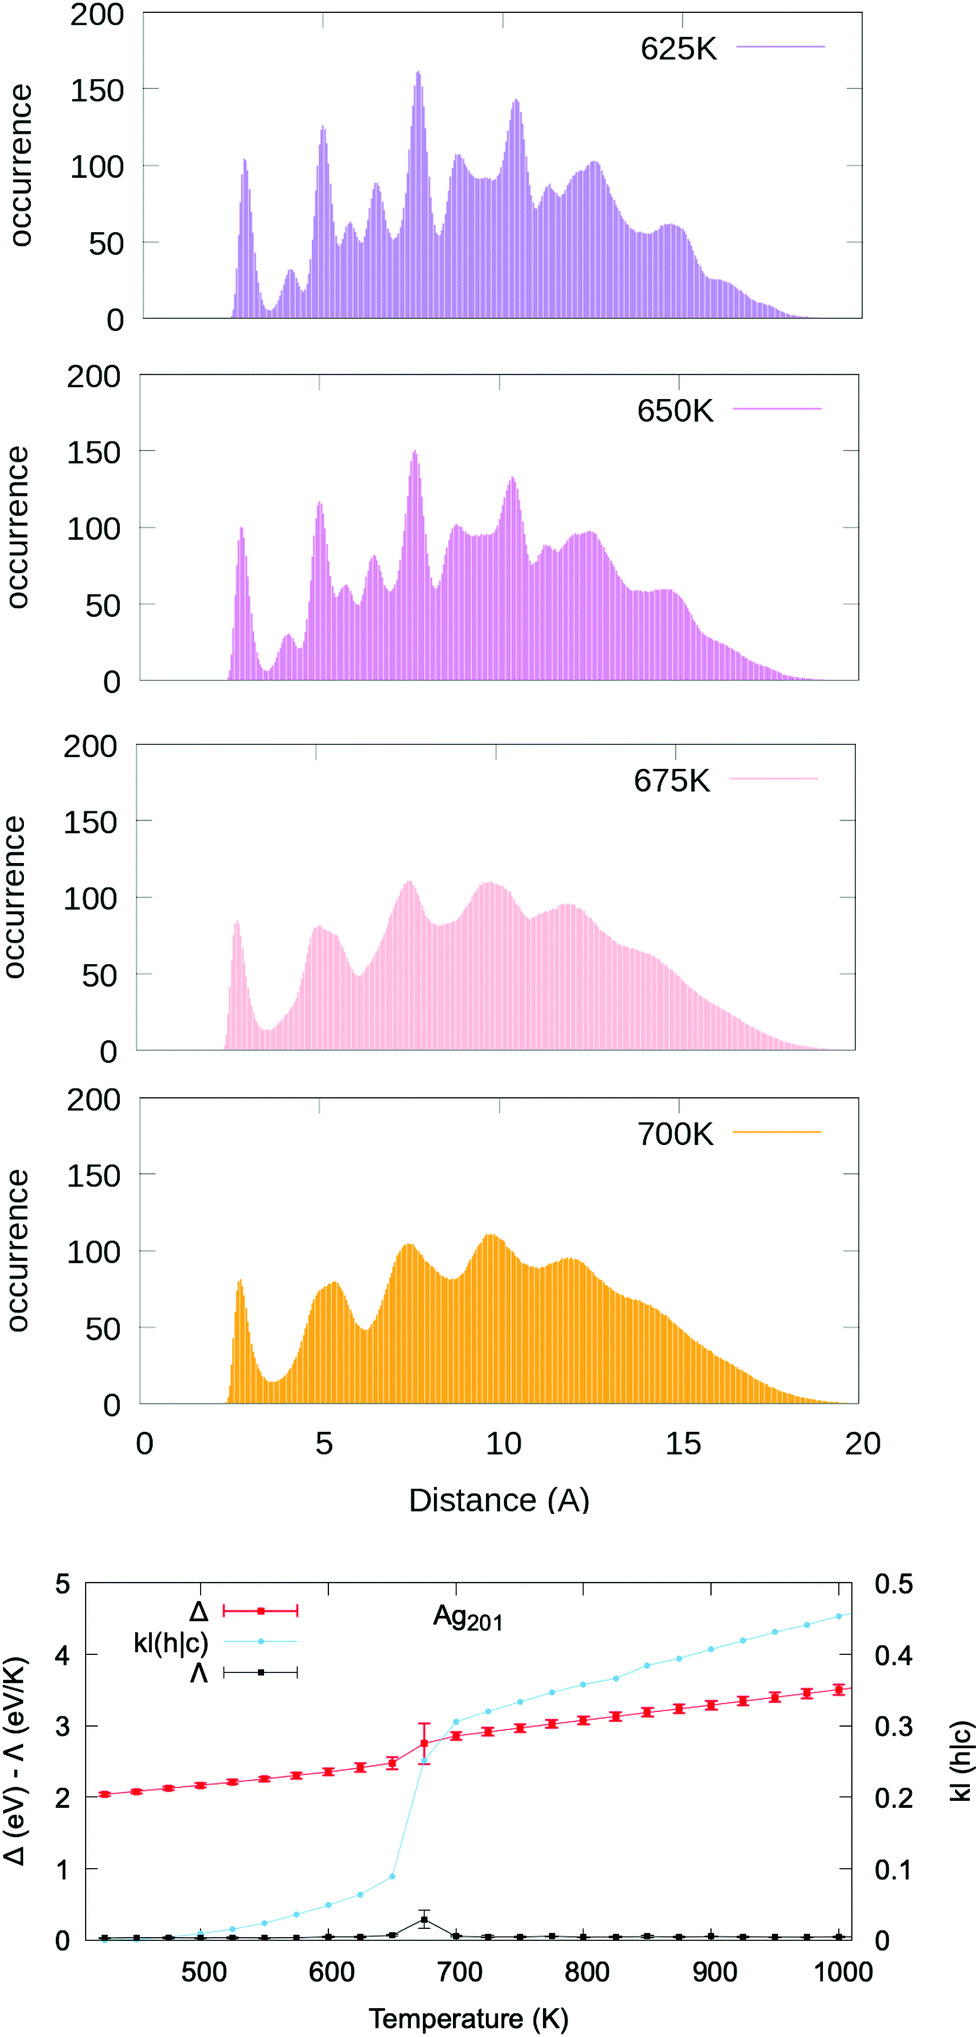 | ||
| Fig. 2 The upper panels show the average PDDF for Ag201 (∼1.8 nm) taken at different temperatures. Above 675 K, the second peak has disappeared, whilst there is just a shoulder visible at ∼4.08 Å at 675 K. The bottom panel reports the caloric curve (red squares), heat capacity (black circles) and KL(h|c) (blue circles) temperature dependence for a Ag nanoparticle of 201 atoms. Lines act as a guide to the eye. A quasi-first order transition occurs at 675 K. | ||
Hence, we deem the absence of a peak at the 2nd nearest-neighbours distance in the MNP pair-distance distribution function to be a universal fingerprint for the solid–liquid transition. To support this claim we contrasted the temperature-evolution of the position of the second peak of the PDDF against the caloric curve in all the systems under consideration. The same trend is verified in all systems, independently of the initial size or shape of the nanoparticle. In turn, our finding establishes a fundamental relationship between the structure and the phase of a MNP. Further, it enables the identification of the MNP phase from its pair distance distribution function, an accurate and well-defined quantity, accessible to both experimental and theoretical investigations.
Because of the temperature-driven changes in the PDDF of a MNP, its profile at high temperatures cannot be deduced from the one calculated at colder temperatures (and vice versa, but to a lesser extent). In other words, the peaks of the “hot temperature” profile are wide and smooth, in contrast with the sharp peaks characteristic of the “cold temperature” distribution. When looking at the excess energy Δ, heat capacity Λ, and the KL(h|c) vs. temperature curves (lower panel of Fig. 2), they all show a discontinuity at the phase change temperature. A positive correlation between Δ and KL(h|c) is not limited to the phase coexistence region, but also to the solid and liquid phases.
We verify that the choice of any “cold” reference structure at temperatures below the melting transition does not affect the existence of a quasi-first order transition in the KL(h|c) vs. temperature plot, as depicted in Fig. S27.† Moreover, we show that our conclusions hold also for a slower heating rate and in the presence of solid–solid rearrangements occurring before the solid–liquid phase change (Fig. S29†). Preliminary results on the KL robustness against the occurrence of structural rearrangements further show that the choice of limiting the cross-entropy calculation to the 2nd nearest neighbours is beneficial, with KL calculated for the full PDDF being instead less resilient (Fig. S29†).
We show in Fig. 3 that the correlation between the excess energy Δ, the heat capacity Λ and the KL(h|c) as a function of temperature remains true across a representative set of systems with different size, initial shape, and composition. The comparison of the excess energy and the PDDF cross-entropy curve vs. temperature for all the considered systems is provided in Fig. S30–S41.† In each case, the KL-PDDF analysis can be applied to probe solid–liquid phase transitions in metallic nanoparticles.
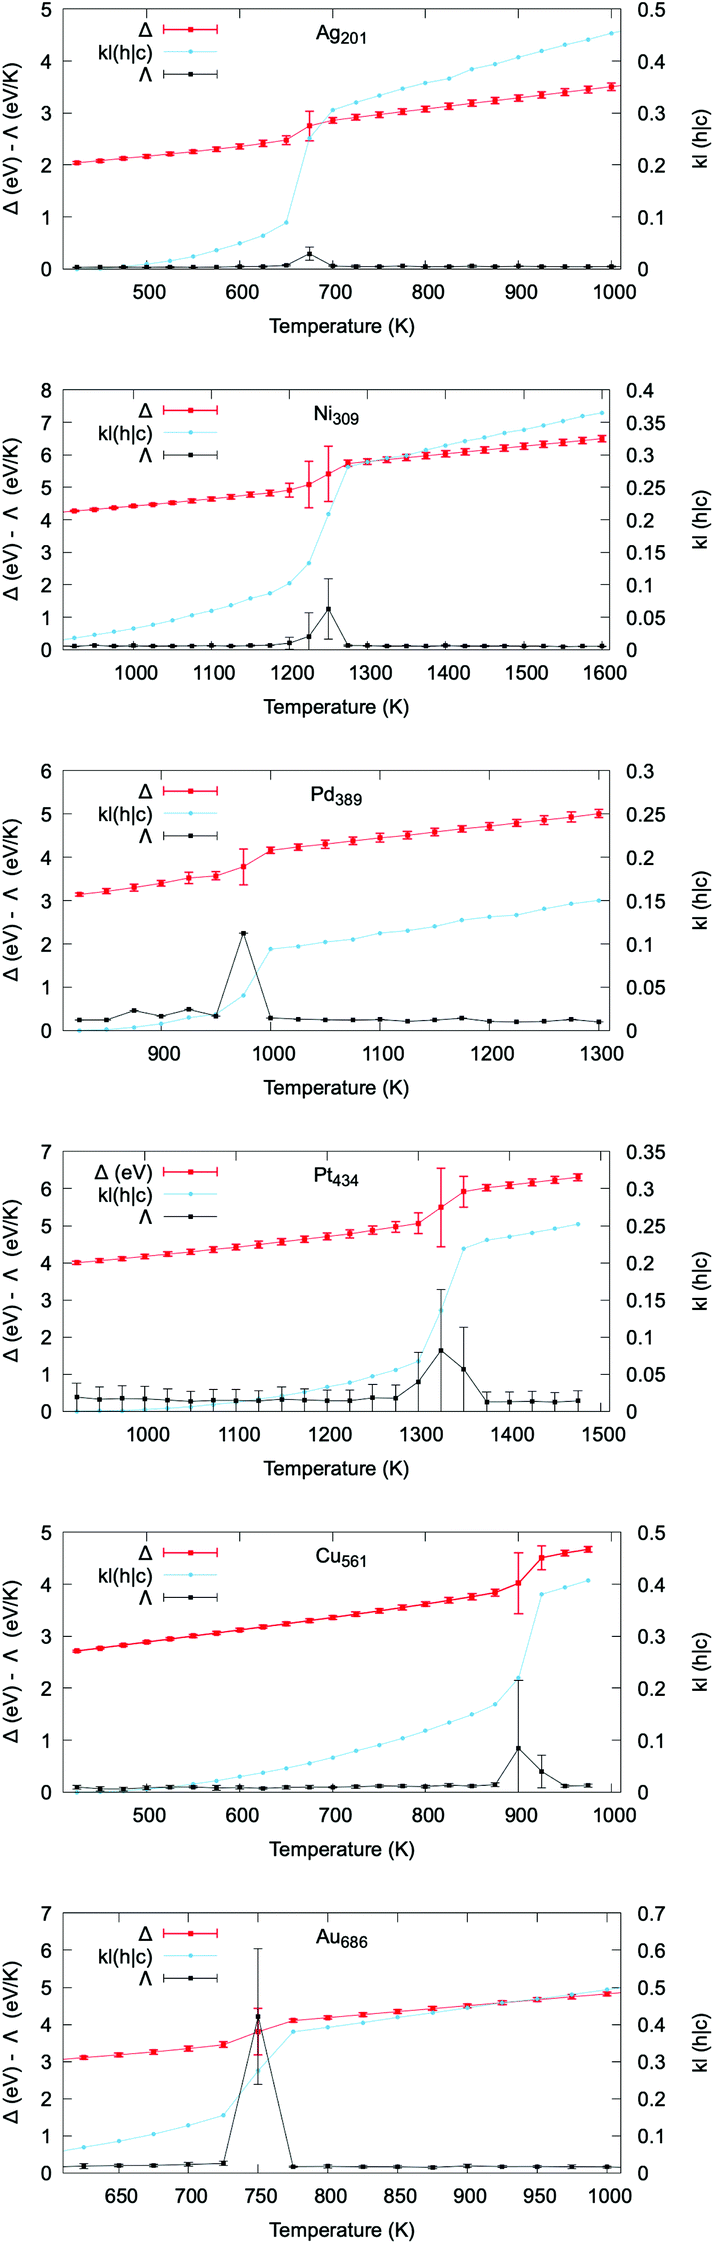 | ||
| Fig. 3 Caloric curve (red squares), heat capacity (black circles) and KL(h|c) (blue circles) dependence with respect to temperature in an array of systems of different size, composition, and initial structure. Both Δ and KL display a quasi-first order transition at the melting, whilst Λ displays a maximum. | ||
In Fig. 4 we graphically highlight the 1-to-1 correspondence between the melting temperature estimated from the caloric curve and from the KL(h|c) plots. The Tm from the caloric curve is taken at the temperature where Δ has the largest standard deviation. The Tm from the KL(h|c) evolution is instead estimated as the temperature where the KL value differs most from the immediately preceding and sub-sequent temperatures. For reference, Table S1† includes all melting temperatures obtained from both methods. Previous numerical studies51,71,73–75 have qualitatively discussed the temperature dependence of the PDDF profile. However, the signature of the PDDF-peak at the bulk lattice distance disappearing when the melting occurs was not previously recognised, nor the correlation between the second-nearest-neighbour PDDF cross-entropy with the caloric or heat capacity curves.
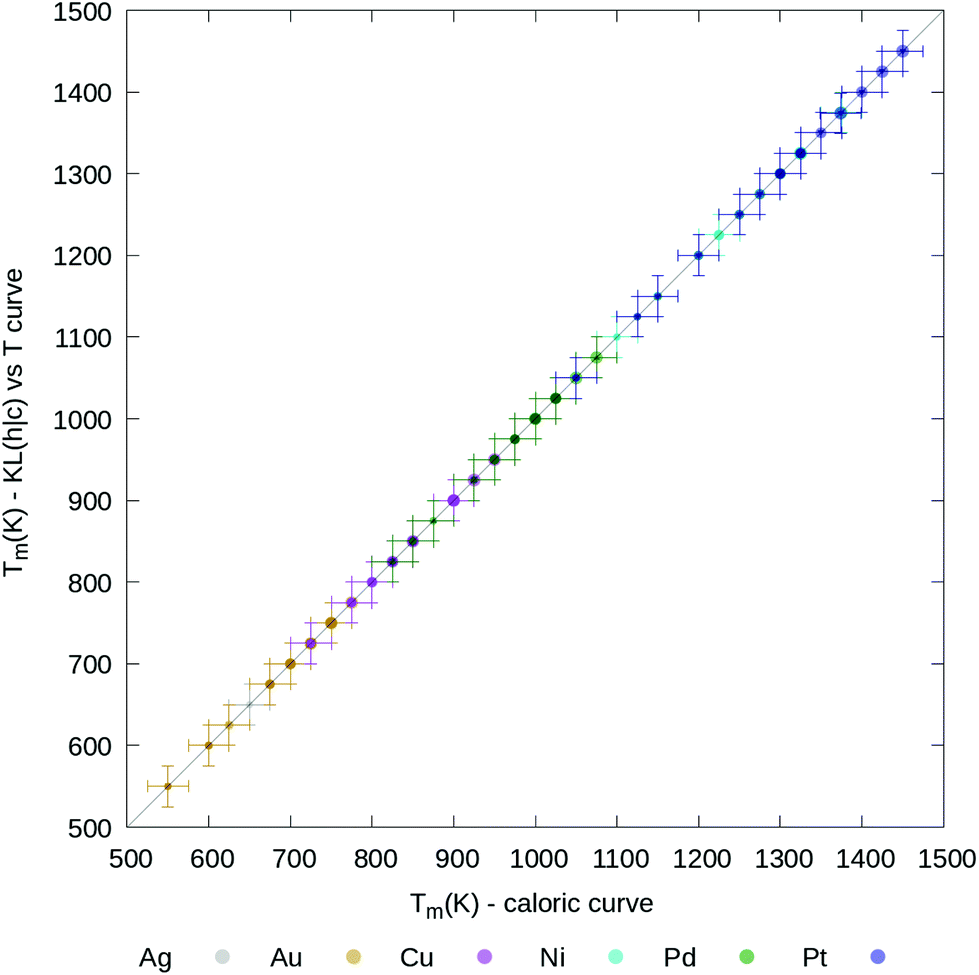 | ||
| Fig. 4 Parity plot between melting temperature, Tm, estimated from the caloric curves (x axis) or the KL (h|c) curves (y axis). Different system compositions are colour coded according to the legend, while the point size is proportional to the cubic root of the nanoparticle size. The error bars are taken to be as ΔT (25 K). A table with all melting temperatures is provided in the ESI.† | ||
As a final case study, we demonstrate the strength of the PDDF analysis for the characterisation of the solid–liquid phase change of MNPs surrounded by an interacting environment. This matter is of great potential significance for rationalizing thermal stability of nanoparticles embedded in, e.g. thin films, ligands, polymers and solutions.34,46,76–80
In particular, we discuss again the case of Ag201 now embedded into a strongly interacting environment, modelled according to the Huerto-Cortes’ formalism. We set p and ε to 1.5 and 0.04 eV per atom, respectively. While there is no explicit experimental comparison for the selected case, we remark that the chosen parameters enable to reproduce qualitatively the asymmetric growth of Au nanoparticles in a solution.67
The PDDF averaged over four independent melting simulations starting from a truncated octahedron and employing a heating rate of 50 K ns−1 with Δτ = 0.5 ns are plotted at different temperatures in the top panels of Fig. 5. The bottom panel of Fig. 5 compares the Δ, KL(h|c) and heat capacity curves versus temperature. While neither the caloric curve nor the heat capacity present any clear transition, the melting transition at 575–600 K is evident from the drastic change in the KL(h|c). Indeed, the second peak of the PDDF at “hot” temperatures has disappeared, in contrast with the peak at “cold” temperatures.
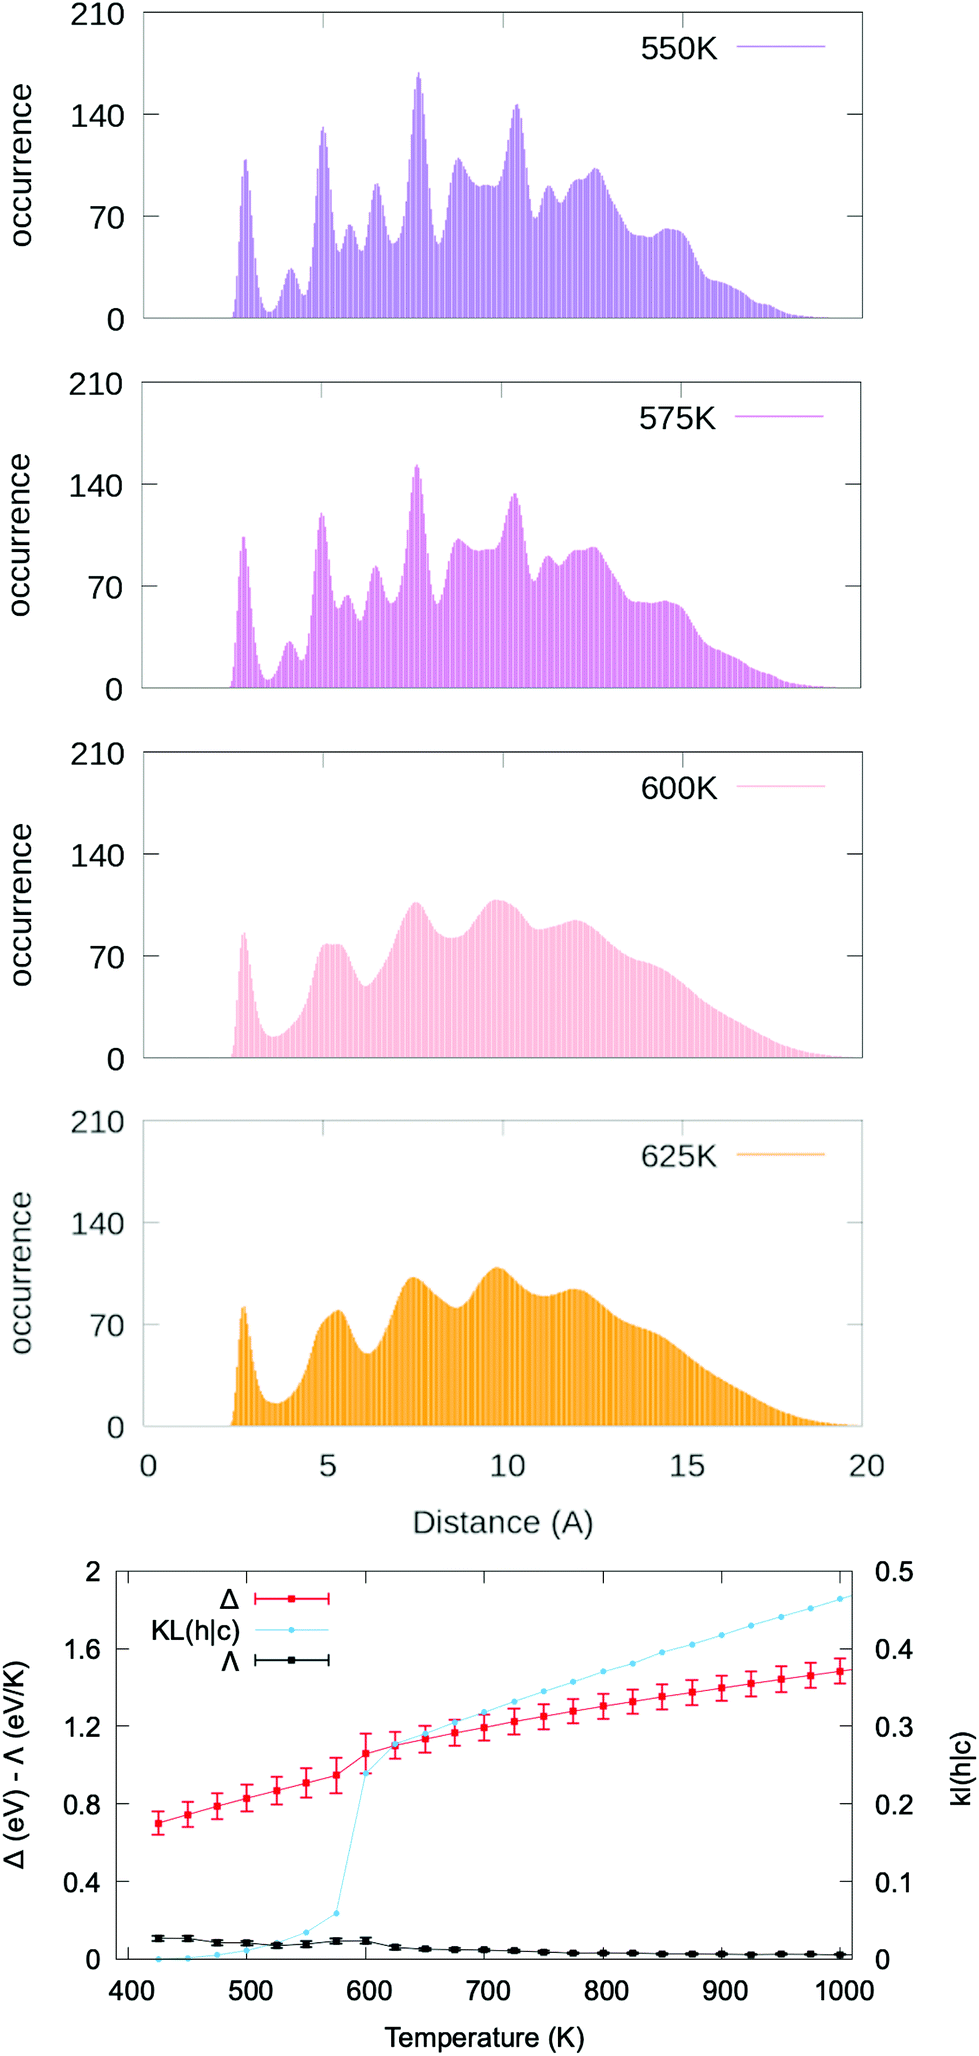 | ||
| Fig. 5 The upper panels show the average PDDF for Ag201 (∼1.8 nm) embedded in a strongly interacting environment (p = 1.5, ε = 0.04 eV per atom) at different temperatures. Note the disappearance of the second peak of the PDDF for temperatures above 600 K. The lower panel shows caloric curve (red squares), heat capacity (black circles) and KL(h|c) temperature dependence (blue circles), lines act as a guide to the eye. A quasi-first order transition in the KL(h|c) curve at 625 K signals the nanoparticle melting, yet this is less evident from the caloric and heat capacity curves. | ||
This example showcases several observations relative to the melting of a nanoparticle in a strongly interacting environment, namely the decrease of the melting temperature and an increased complexity in interpreting the heat capacity curve. We note that the observed melting temperature is much lower (melting temperature is 675 K in vacuum and 600 K with environment) with stronger metal–environment interaction determining lower melting temperatures, suggesting that recorded differences between models and experiments46 might be due to the presence of a strongly interacting environment. Further examples of MNPs embedded in different environment conditions are shown in Fig. S42–S47.† A deeper analysis of the effect of the environment on the melting temperature is, however, out of the aim of this paper, which focuses on identifying a general method to address the phase change at the nanoscale. Our findings on MNPs embedded into a strongly interacting environment corroborate the strength and applicability of the melting characterisation signature here discussed.
5. Conclusion
Based on a systematic investigation of the solid–liquid phase change in metallic nanoparticles, we propose a signature to determine the melting transition. We focus on the pair-distance distribution function (PDDF), an experimentally measurable quantity. The disappearance of the PDDF second peak, whose distance corresponds to the bulk lattice, identifies the melting temperature. Such signature is accurate for metallic nanoparticles regardless of their shape, size, chemical composition and the environment that surrounds them. Furthermore, we show that the relative cross-entropy of the PDDF up to the second nearest-neighbour of “cold” and “hot” configurations displays a quasi-first order transition at the melting temperature, providing a quantitative description of the melting transition alternative to caloric curves. To validate the proposed signature, we compare the melting temperature obtained from the caloric curve and the heat capacity with the one from the cross-entropy. They show a perfect agreement. We confirm the strong dependence of the PDDF peaks on the system temperature. This opens new experimental routes to measure the phase change temperature, as an alternative to calorimetry. The criterion proposed here is particularly advantageous for systems whose heat capacity vs. temperature curves are of difficult interpretation, as it is the case of nanoparticles embedded in a strongly interacting environment.Conflicts of interest
There are no conflicts to declare.Acknowledgements
LDC is supported by King's College London through the NMS Faculty Studentship Scheme. FB thanks the “Towards an Understanding of Catalysis on Nanoalloys” (TOUCAN) EPSRC Critical Mass Grant (EP/J010812/1) as does KR (ER/M506357/1). RPM and FB thank the EPSRC impact acceleration IAA award grant reference number EP/R511559/1. PS was supported by a King's College Undergraduate Research Fellowship (KURF-2019). All the authors are grateful to the Royal Society (RG 120207), to the UK Materials and Molecular Modelling Hub for computational resources, which is partially funded by EPSRC (EP/P020194/1 and EP/T022213/1). The authors acknowledge the use of the research computing facilities Rosalind and Gravity (https://rosalind.kcl.ac.uk), and the IT support offered by the NMS Faculty at the King's College London.References
- G. Guisbiers, Adv. Phys.: X, 2019, 4, 1668299 CAS
.
- P. N. Pawlow, Z. Phys. Chem., 1909, 65, 545–548 CAS
- M. Schmidt and H. Haberland, C. R. Phys., 2002, 3, 327–340 CrossRef CAS
- R. Kusche, T. Hippler, M. Schmidt, B. von Issendorff and H. Haberland, Eur. Phys. J. D, 1999, 9, 1–4 CAS
- A. Shvartsburg and M. Jarrold, Phys. Rev. Lett., 2000, 82, 2530 CrossRef
- G. Breaux, D. Hillman, C. Neal, R. Benirschke and M. Jarrold, J. Am. Chem. Soc., 2004, 126, 8628–8629 CrossRef CAS
- K. G. Steenbergen and N. Gaston, Nano Lett., 2016, 16, 21 CrossRef CAS
- H. Yu, Y. Peng, Y. Yang and Z.-Y. Li, npj Comput. Mater., 2019, 5, 45 CrossRef
- K. V. Ivanov, S. V. Fortuna, T. A. Kalashnikova and E. A. Glazkova, Adv. Eng. Mater., 2019, 21, 1701135 CrossRef
- Z. Li and K. S. Suslick, Angew. Chem., Int. Ed., 2019, 58, 14193–14196 CrossRef CAS
- W. Zhou, X. Gao, D. Liu and X. Chen, Chem. Rev., 2015, 115, 10575–10636 CrossRef CAS
- Y. Yan, S. C. Warren, P. Fuller and B. A. Grzybowski, Nat. Nanotechnol., 2016, 11, 603–608 CrossRef CAS
- D. Jin, J. Yu, K. Yuan and L. Zhang, ACS Nano, 2019, 13, 5999–6007 CrossRef CAS
-
F. Baletto, C. R. Miranda, V. A. Rigo and K. Rossi, Nanoalloys, Elsevier, Oxford, 2nd edn, 2020, pp. 347–380 Search PubMed
- W. Thomson, Philos. Mag., 1871, 42, 448–452 Search PubMed
- C. Tsallis, J. Stat. Phys., 1988, 52, 479–487 CrossRef
- T. L. Hill, J. Chem. Phys., 1962, 36, 3182 CrossRef CAS
- T. L. Hill, Nano Lett., 2001, 1, 111–112 CrossRef CAS
- Z. H. Li and D. G. Truhlar, J. Am. Chem. Soc., 2008, 130, 12698–12711 CrossRef CAS
- M. Kateb, M. Azadeh, P. Marashi and S. Ingvarsson, J. Nanopart. Res., 2018, 20, 251 CrossRef
- H. Li, P. D. Han, X. B. Zhang and M. Li, Mater. Chem. Phys., 2013, 137, 1007–1011 CrossRef CAS
- W. Qi, Acc. Chem. Res., 2016, 49, 1587–1595 CrossRef CAS
- F. Calvo, Phys. Chem. Chem. Phys., 2015, 17, 27922–27939 RSC
- M. Hou, Phys. Chem. Chem. Phys., 2017, 19, 5994–6005 RSC
- A. Aguado and M. F. Jarrold, Annu. Rev. Phys. Chem., 2011, 62, 151–172 CrossRef CAS
- J. M. Vásquez-Pérez, G. U. Gamboa, D. Mejía-Rodríguez, A. Alvarez-Ibarra, G. Geudtner, P. Calaminici and A. M. Köster, J. Phys. Chem. Lett., 2015, 6, 4646–4652 CrossRef
- H. Arslan and M. H. Güven, New J. Phys., 2005, 7, 60 CrossRef
- M. Takagi, J. Phys. Soc. Jpn., 1954, 9, 359 CrossRef
- P. Buffat and J. Borel, Phys. Rev. A, 1976, 13, 2287–2298 CrossRef CAS
- T. Martin, Phys. Rep., 1996, 273, 199–241 CrossRef CAS
- M. Schmidt, R. Kusche, B. von Issendorff and H. Haberland, Nature, 1998, 393, 238–240 CrossRef CAS
- A. van Teijlingen, S. A. Davis and S. R. Hall, Nanoscale Adv., 2020, 2, 2347–2351 RSC
-
H. Haberland, Atomic clusters and nanoparticles. Agregats atomiques et nanoparticules. Les Houches - Ecole d'Ete de Physique Theorique, Springer, Berlin, Heidelberg, 2001, vol. 73 Search PubMed
- S. L. Lai, J. Y. Guo, V. Petrova, G. Ramanath and L. H. Allen, Phys. Rev. Lett., 1996, 77, 99–102 CrossRef CAS
- J. Bosiger and S. Leutwyler, Phys. Rev. Lett., 1987, 59, 1895–1898 CrossRef
- U. Even, N. Ben-Horin and J. Jortner, Phys. Rev. Lett., 1989, 62, 140–143 CrossRef CAS
- U. Buck and I. Ettischer, J. Chem. Phys., 1994, 100, 6974 CrossRef CAS
- T. Ellert, M. Schmidt, T. Schmitt, C. Reiners and H. Haberland, Phys. Rev. Lett., 1995, 75, 1731–1734 CrossRef
- L. Pavan, F. Baletto and R. Novakovic, Phys. Chem. Chem. Phys., 2015, 17, 28364–28371 RSC
- K. Rossi, L. B. Partay, G. Csanyi and F. Baletto, Sci. Rep., 2018, 8, 9150 CrossRef CAS
- C. Mottet, J. Goniakowski, F. Baletto, R. Ferrando and G. Treglia, Phase Transitions, 2004, 77, 101–113 CrossRef CAS
- F. Chirot, P. Feiden, S. Zamith, P. Labastie and J.-M. L'Hermite, J. Chem. Phys., 2008, 129, 164514 CrossRef
- R. M. Lynden-Bell and D. J. Wales, J. Chem. Phys., 1994, 101, 1460–1476 CrossRef CAS
- D. J. Wales, Phys. Rev. E, 2017, 95, 030105 CrossRef
- R. Cortes-Huerto, J. Goniakowski and C. Noguera, J. Chem. Phys., 2013, 138, 244706 CrossRef
- M. Asoro, D. Kovar, J. Damiano and P. Ferreira, Microsc. Microanal., 2010, 16, 1802–1803 CrossRef CAS
- J. D. Honeycutt and H. C. Andersen, J. Phys. Chem., 1987, 91, 4950–4963 CrossRef CAS
- P. Steinhardt, D. Nelson and M. Ronchetti, Phys. Rev. B: Condens. Matter Mater. Phys., 1983, 28, 784–805 CrossRef CAS
- F. Baletto and R. Ferrando, Rev. Mod. Phys., 2005, 77, 371–423 CrossRef CAS
- F. Lindemann, Z. Phys., 1910, 11, 609 CAS
- T. Liang, D. Zhou, Z. Wu and P. Shi, Nanotechnology, 2017, 28, 485704 CrossRef
- X. Wang, X. Wang, M. Liu and Y. Wang, Chem. Phys., 2019, 527, 110459 CrossRef CAS
-
Underneath the Bragg Peaks, Structural Analysis of Complex Materials, ed. T. Egami and S. J. Billinge, Pergamon, 2003, vol. 7, pp. 219–245 Search PubMed
- B. Hall, J. Appl. Phys., 2000, 87, 1666–1675 CrossRef CAS
- A. Wright, Glass Phys. Chem., 1998, 24, 148–179 CAS
- P. Juhás, D. Cherba, P. Duxbury, W. Punch and S. Billinge, Nature, 2006, 440, 655–658 CrossRef
- H. Zhang, B. Gilbert, F. Huang and J. F. Banfield, Nature, 2003, 424, 1025–1029 CrossRef CAS
- B. Ingham, Crystallogr. Rev., 2015, 21, 229–303 CrossRef
- M. A. Newton, K. W. Chapman, D. Thompsett and P. J. Chupas, J. Am. Chem. Soc., 2012, 134, 5036–5039 CrossRef CAS
- B. S. Clausen and J. K. Nørskov, Top. Catal., 2000, 10, 221–230 CrossRef CAS
- S. Banerjee, C.-H. Liu, J. D. Lee, A. Kovyakh, V. Grasmik, O. Prymak, C. Koenigsmann, H. Liu, L. Wang, A. M. M. Abeykoon, S. S. Wong, M. Epple, C. B. Murray and S. J. L. Billinge, J. Phys. Chem. C, 2018, 122, 29498–29506 CrossRef CAS
- R. B. Neder and V. I. Korsunskiy, J. Phys.: Condens. Matter, 2005, 17, S125–S134 CrossRef CAS
- J. Chen, X. Fan, J. Liu, C. Gu, Y. Shi, D. J. Singh and W. Zheng, J. Phys. Chem. C, 2020, 124, 7414–7420 CrossRef CAS
- V. Rosato, M. Guillope and B. Legrand, Philos. Mag. A, 1989, 59, 321–336 CrossRef
- F. Baletto, C. Mottet and R. Ferrando, Chem. Phys. Lett., 2002, 354, 82–87 CrossRef CAS
- K. Rossi and F. Baletto, Phys. Chem. Chem. Phys., 2017, 19, 11057–11063 RSC
- Z. C. Canbek, R. Cortes-Huerto, F. Testard, O. Spalla, S. Moldovan, O. Ersen, A. Wisnet, G. Wang, J. Goniakowski, C. Noguera and N. Menguy, Cryst. Growth Des., 2015, 15, 3637–3644 CrossRef CAS
- S. Kullback and R. A. Leibler, Ann. Math. Stat., 1951, 22, 79–86 CrossRef
- Y. Li, Z. Jiang, X.-M. Lin, H. Wen, D. A. Walko, S. A. Deshmukh, R. Subbaraman, S. K. R. S. Sankaranarayanan, S. K. Gray and P. Ho, Sci. Rep., 2015, 5, 8146 CrossRef CAS
- Z. Zhang, X. Meng, H. Lu and M. Li, Phys. Chem. Chem. Phys., 2020, 22, 14210–14215 RSC
- A. L. Gould, K. Rossi, C. R. A. Catlow, F. Baletto and A. J. Logsdail, J. Phys. Chem. Lett., 2016, 7, 4414–4419 CrossRef CAS
- S. L. Gafner, D. A. Bashkova and Y. Y. Gafner, IOP Conf. Ser.: Mater. Sci. Eng., 2018, 447, 012056 Search PubMed
- J. Sun, P. Liu, M. Wang and J. Liu, Sci. Rep., 2020, 10, 3408 CrossRef CAS
- L. Van Sang, V. Van Hoang and N. T. Thuy Hang, Eur. Phys. J. D, 2013, 67, 64 CrossRef
- J. Weinreich, A. Römer, M. L. Paleico and J. Behler, J. Phys. Chem. C, 2020, 124, 12682–12695 CrossRef CAS
- R. Zirbs, A. Lassenberger, I. Vonderhaid, S. Kurzhals and E. Reimhult, Nanoscale, 2015, 7, 11216–11225 RSC
- M. Yarema, M. Wörle, M. D. Rossell, R. Erni, R. Caputo, L. Protesescu, K. V. Kravchyk, D. N. Dirin, K. Lienau, F. Von Rohr, A. Schilling, M. Nachtegaal and M. V. Kovalenko, J. Am. Chem. Soc., 2014, 136, 12422–12430 CrossRef CAS
- A. Heuer-Jungemann, N. Feliu, I. Bakaimi, M. Hamaly, A. Alkilany, I. Chakraborty, A. Masood, M. F. Casula, A. Kostopoulou, E. Oh, K. Susumu, M. H. Stewart, I. L. Medintz, E. Stratakis, W. J. Parak and A. G. Kanaras, Chem. Rev., 2019, 119, 4819–4880 CrossRef CAS
- Y. Kamikoriyama, H. Imamura, A. Muramatsu and K. Kanie, Sci. Rep., 2019, 9, 899 CrossRef
- Y. Lin, Y. Liu, J. Genzer and M. D. Dickey, Chem. Sci., 2017, 8, 3832–3837 RSC
Footnotes |
| † Electronic supplementary information (ESI) available: Nanomorphology description, benchmarks on PDDF and KL(h|c) calculation, average PDDF evolution with time for the systems under consideration, caloric curves vs. KL(h|c)temperature evolution, caloric curves vs. KL(h|c) temperature evolution for systems of 201 atoms, embedded in a strongly interacting environment. See DOI: 10.1039/D0NR06850K |
| ‡ These authors contributed equally to this work. |
| § Present address: Laboratory of Nanochemistry, Institute of Chemistry and Chemical Engineering, Ecole Polytechnique Fédérale de Lausanne, Lausanne, 1015, CH. |
| ¶ Present address: University of Cambridge, Centre for Scientific Computing, Cavendish Laboratory, 19 J J Thomson Avenue, Cambridge CB3 0HE, UK. |
| This journal is © The Royal Society of Chemistry 2021 |