 Open Access Article
Creative Commons Attribution 3.0 Unported Licence
Symmetric and asymmetric epitaxial growth of metals (Ag, Pd, and Pt) onto Au nanotriangles: effects of reductants and plasmonic properties†
Xiaobin
Xie
 *,
Marijn A.
van Huis
 and
Alfons
van Blaaderen
*
Soft Condensed Matter, Debye Institute for Nanomaterials Science, Utrecht University, Princetonplein 5, 3584 CC Utrecht, The Netherlands. E-mail: xb.xie@hotmail.com; A.vanBlaaderen@uu.nl
First published on 12th January 2021
Abstract
The surface plasmon resonance of noble metals can be tuned by morphology and composition, offering interesting opportunities for applications in biomedicine, optoelectronics, photocatalysis, photovoltaics, and sensing. Here, we present the results of the symmetrical and asymmetrical overgrowth of metals (Ag, Pd, and Pt) onto triangular Au nanoplates using L-ascorbic acid (AA) and/or salicylic acid (SA) as reductants. By varying the reaction conditions, various types of Au nanotriangle-metal (Au NT-M) hetero-nanostructures were easily prepared. The plasmonic properties of as-synthesized nanoparticles were investigated by a combination of optical absorbance measurements and Finite-Difference Time-Domain (FDTD) simulations. We show that specific use of these reductants enables controlled growth of different metals on Au NTs, yielding different morphologies and allowing manipulation and tuning of the plasmonic properties of bimetallic Au NT-M (Ag, Pd, and Pt) structures.
Introduction
Gold based binary noble metal nanoparticles (BNMNPs) have attracted great interest due to their promising applications in various fields, including electronic devices,1 catalysis,2,3 energy conversion,4,5 biological medicine,6,7 sensing and detection.8–11 In the course of decades, a wide variety of BNMNP structures, like core–shell, alloyed, Janus, yolk–shell and other complex morphologies have been successfully synthesized.8,12–16 Particularly nano-structures based on plate-like Au nanoparticles are increasingly drawing attention, because of their special morphology and highly tunable properties.17 The localized surface plasmon resonances (LSPRs) of Au nanotriangle (Au NT) based BNMNPs depend on their size, composition, and structure.18 Furthermore, manipulating the spatial distribution of a second metal on Au NTs allows fine-tuning the plasmonic and chemical properties of these BNMNPs for instance for enhanced photocatalysis2 and Raman scattering.19,20Great progress was made in the wet chemical synthesis of BNMNPs for realizing applications utilizing the plasmonic properties.8 Most of these reports focused on the synthesis of regular core–shell NPs. Recently, the plasmonic properties of asymmetrically composed Au based bi- and higher-metallic type NPs have been the focus of much attention.8,21 For instance, Liang et al.22 reported that control can be obtained over the symmetry of hybrid Au nanorods (NRs) for achieving tunable optical properties. A ligand-mediated selective deposition of noble metals at Au nanoplates and NRs was developed by the Millston group.23 In another paper on Pt-decorated Au prisms it was shown that the Au plasmon modes are changed by the location of the Pt particle, which influences the energy transfer between Pt and the Au prisms.24 Although the rapid development of this field provides us with a multitude of methods for synthesis and with insights into the relationship between the symmetry and optical property of BNMBPs, more studies are required to achieve a better understanding of the (asymmetric) growth of a second metal.
In many aqueous phase syntheses of BNMNPs, L-ascorbic acid (AA) is used as reductant because of several reasons. First, its moderate reaction activity for various noble metals, in particularly for Au, Ag, Pd, and Pt precursors at room temperature, makes it suitable for the controlled synthesis of various metallic nanomaterials. Moreover, the reaction rate between AA and noble metal precursors can be easily manipulated by changing the reaction temperature, the reactants’ concentration, and the pH value of the growth solution. Finally, it is a low priced and readily available chemical. Nevertheless, its reaction rate for reducing some precursors, like AgNO3, is still relatively fast which makes it less easy to control the reaction. In this case, salicylic acid (SA) also is an easily available chemical like AA, but the reaction rate between SA and noble metal precursors is even slower than AA at similar reaction conditions. Besides, SA has been reported as additional chemical that works with AA together enabling a morphology-controlled synthesis of Au nanorods (Au NRs)25 and Au NRs-Pd bimetallic NPs.26 The use of SA as the only reductant for controlling the morphology of bimetallic NPs has thus far hardly been reported.
In the present work, we systematically investigate the roles that AA and SA play in the synthesis of Au NTs based BNMNPs under similar reaction conditions. As expected, the slower reaction rate between SA and the precursors of the metals used has a strong impact on the final shapes of the products. Second, SA showed a fascinating ability for precisely controlling the atomic layers of Pd and sizes of Pt clusters grown onto the Au NTs. Using AA and/or SA also allowed manipulating the symmetrical and/or asymmetrical growth of noble metals onto Au NTs. The various morphologies that were experimentally obtained for the Au–M heterogeneous nanocrystals are schematically shown in Scheme 1 and will be discussed in detail below. Furthermore, the surface plasmonic properties of all as-prepared Au NTs based BNMNPs were characterized in detail by combining far-field UV-Vis spectroscopy and finite-difference time-domain (FDTD) simulations. In Scheme 1 we schematically describe the differences as observed by use of the two reductants in the bi-metallic overgrowths on Au NTs that were compared in this study and how they differently affected particle morphologies. This scheme further acts as guide for the structure of the paper and acts also as guide how the differences in the morphologies affected experimentally determined and simulated plasmonic responses of the bi-metallic particles made.
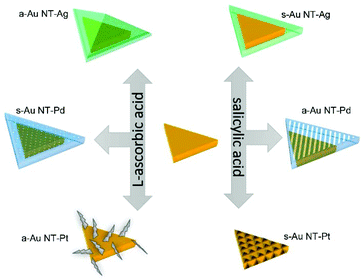 | ||
| Scheme 1 Schematic diagram showing the differences between Au NT@M (Ag, Pd, and Pt) nanostructures synthesized using either AA or SA. | ||
Results and discussion
The Au NTs were synthesized according to a previous report17 with modifications. In Fig. 1, the scanning transmission electron microscopy (STEM) images clearly show the triangular platelet-shape of the Au NTs where the edge length is about 67 nm and the thickness is about 22 nm. The main localized surface plasmon resonance (LSPR) band of the Au NTs was located at 660 nm (Fig. 1e). Using the as-synthesized Au NTs as seeds, we performed experiments on the overgrowth of Ag, Pd, and Pt on these plate-like Au nanocrystals using AA and/or SA as reductants, respectively.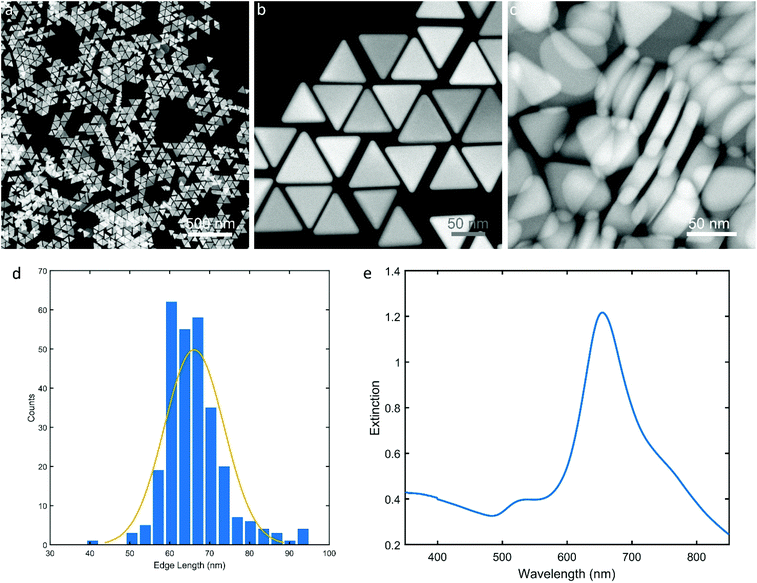 | ||
| Fig. 1 Scanning transmission electron microscopy (STEM) images (a, b, & c) of Au nanotriangles (Au NTs); (d) histogram of edge length of Au NTs; (e) UV-Vis spectrum of Au NTs. | ||
Au NT-Ag NPs
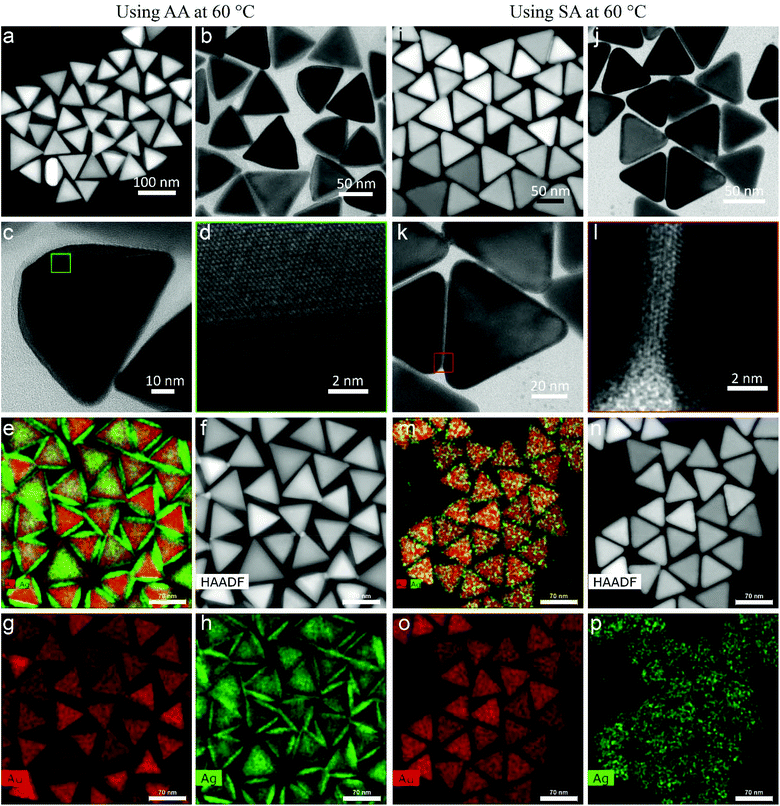
The morphologies of Au NT-Ag NPs are shown in Fig. 2. For the case that AA was used as reductant, asymmetrical Au NT-Ag (a-Au NT-Ag) NPs were found. Fig. 2a shows a scanning transmission electron microscopy – high angle annular dark field (STEM-HAADF) image, where the dominant type of contrast is Z (atomic number) contrast whereby heavier elements appear brighter than lighter elements. Fig. 2a shows the brighter Au core at the center, and the Ag shell is visible as a darker layer outside the triangular Au core as the atomic number of Au is higher than that of Ag. In contrast, in the bright-field transmission electron microscopy (TEM) image of Fig. 2b, the Au core appears darker and Ag less dark because of the higher scattering cross-section of Au with respect to that of Ag. Moreover, Fig. 2c demonstrates that Ag grows asymmetrically onto the top and bottom crystal facets of the Au NTs. With an asymmetric growth we mean that the second metal does not deposit with the same thickness everywhere on the Au NT. The high-resolution TEM image (Fig. 2d) indicates that face-centered cubic (fcc) Ag grows epitaxially on the fcc Au NTs. The STEM energy dispersive X-ray spectrometry (STEM-EDS) chemical maps show clearly the Au NT-Ag core–shell structures and the asymmetrical distribution of the Ag shell on the Au NT (Fig. 2e–h). When SA was used as the reducing agent, few Ag atomic layers grew symmetrically onto each Au NT, which can be recognized in both the (S)TEM and HRTEM images (Fig. 2i–l). The EDS maps further revealed the symmetrical distribution of the Ag layers present on the Au NTs (expressed as s-Au NT-Ag NPs, Fig. 2m–p).Fig. S1† shows that changing the reaction temperature between 20 and 60 °C hardly had any influence on the final shape in both the AA and the SA case (Fig. S2†). With a decreasing concentration of AgNO3 used for the synthesis, the Ag shell of Au NT-Ag NPs became thinner for those experiments using AA (Fig. S3†), while the Ag shell thickness remained the same when using SA (Fig. S4†), due to the secondary nucleation of Ag at high concentration of AgNO3. The above results indicate that AA is more suitable for the morphology-controlled synthesis of Au NT-Ag bimetallic NPs.
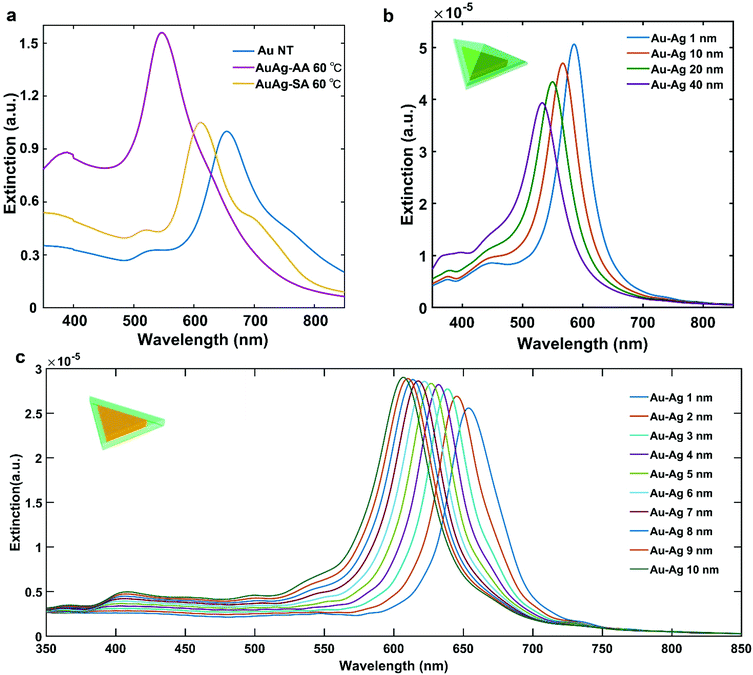
The plasmonic properties of the Au NT-Ag NPs were investigated by measuring extinction spectra of as-synthesized BNMNPs with a UV-Vis spectrophotometer in combination with finite-difference time-domain (FDTD) simulations of the extinction cross-sections of the Au–M NPs. As shown in Fig. 3a, the main LSPR band of both the a-Au NT-Ag NPs (λLSPR = 545 nm) and s-Au NT-Ag NPs (λLSPR = 620 nm) shows a blue-shift compared to the LSPR of Au NTs (λLSPR = 660 nm). To reveal the plasmonic properties of the Au NT-Ag NPs with different types of Ag shells, we measured the LSPR of Au NT-Ag NPs with various thicknesses of Ag shells. Fig. S5a† indicates that the LSPR band of a-Au NT-Ag NPs emerged as a blue shift in the range of 50 to 115 nm when the thickness of the Ag shell was tuned from 10 to 20 nm. To further clarify the relationship between the blueshifts of the LSPR and the thickness of the Ag shell, a series of FDTD simulations were carried out. The FDTD simulations on the Au NT-Ag NPs with an asymmetrical Ag shell with thicknesses varying from 1 nm to 40 nm (Fig. 3b), show good agreement in that a thicker Ag shell leads to a larger blue shift of the main LSPR band. We also performed FDTD simulations on Au NT-Ag NPs with a symmetrical Ag shell with thicknesses from 1 nm to 10 nm. Their LSPR bands, like in the asymmetrical Ag shell cases, show a similar blue shift with increasing thickness of the Ag shell (Fig. 3c). In agreement with this finding, the similar LSPR bands of Au NT-Ag NPs synthesized at different temperatures also confirm that changing the reaction temperature from 60 to 20 °C hardly influenced the morphology of the Au NT-Ag NPs (Fig. S5c & d†).
Au NT-Pd NPs
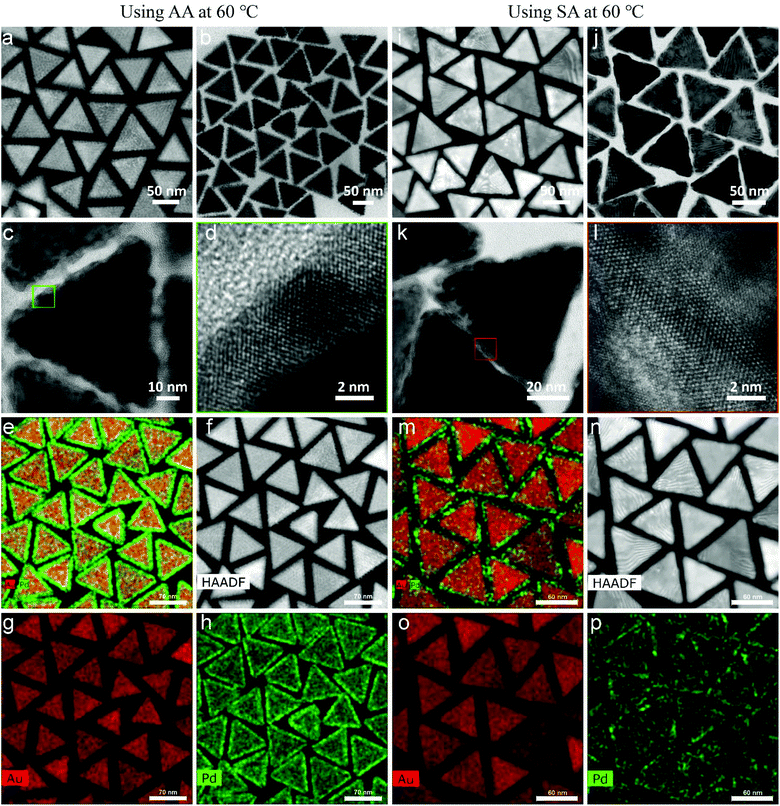
The morphologies of the Au NT-Pd NPs are shown in Fig. 4. A 4 nm Pd shell symmetrically covered each Au NT and emerged as a rough spiky covering when AA was used, while a smoother Pd shell unevenly grew onto the Au particle when SA was used. More precisely, the Pd atoms accumulated more at the tips and edges of the triangle (Fig. 4i–k). The HRTEM images (Fig. 4d and l) demonstrate that the Pd shells grew epitaxially onto the Au NTs both when using AA and SA. In addition, the STEM-EDS maps also confirmed that a more symmetrical Pd shell was formed on Au NT when using AA, and that a more asymmetric shell was formed when AA was replaced by SA for the Pd growth (Fig. 4e–h and m–p). The STEM images in panels f, i, and n of Fig. 4 display moiré fringes which are caused by a moderate lattice mismatch (∼5.0%) between the fcc lattice Au and that of fcc Pd, which therefore mostly grew epitaxially, but not completely.The thickness of the Pd shell was tuned between 10 nm and 2 nm by changing the concentration of Na2PdCl4 or Au NTs when AA was used for the growth (Fig. S6 & S7†). Similar experiments were conducted using SA replacing AA, upon which the Pd shell became more uneven as the concentration of Na2PdCl4 used for the reaction from 150 μM to 50 μM. This change in morphologies is revealed by the STEM images and STEM-EDS maps shown in Fig. 5. The Pd shell became thinner at the edges, top, and bottom face of the Au NTs, but still had a similar size on part of the vertices.
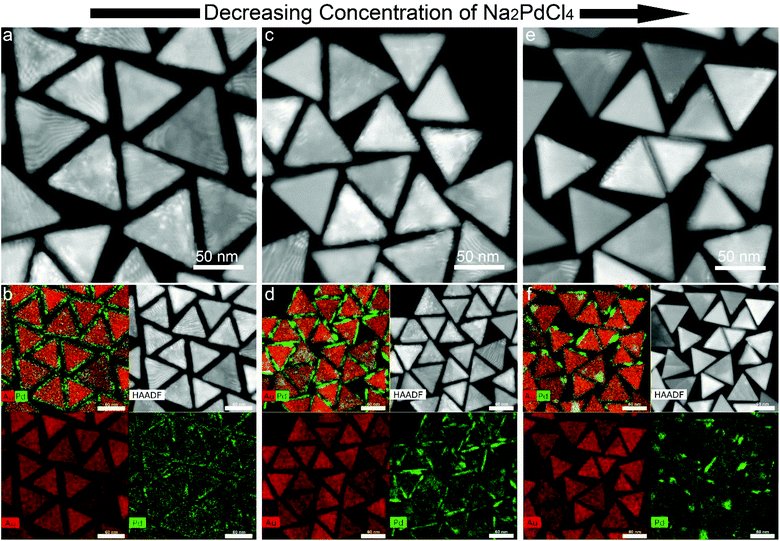 | ||
| Fig. 5 Morphology evolution of Au NT-Pd NPs synthesized using SA as reductant when changing the concentration of Na2PdCl4. | ||
When changing the reaction temperature from 60 to 20 °C, the Pd shells showed no difference in both shape and thickness when AA was used (Fig. S8†). On the contrary, SA was used as reductant, the Pd shell became thinner and more even as the temperature decreased (Fig. S9, S10, & S11†). Besides, as shown in Fig. S12,† polycrystalline Pd was also found at a reaction temperature of 20 °C. The main reason is that the reaction rate between SA and Na2PdCl4 slows down as the temperature decreases.
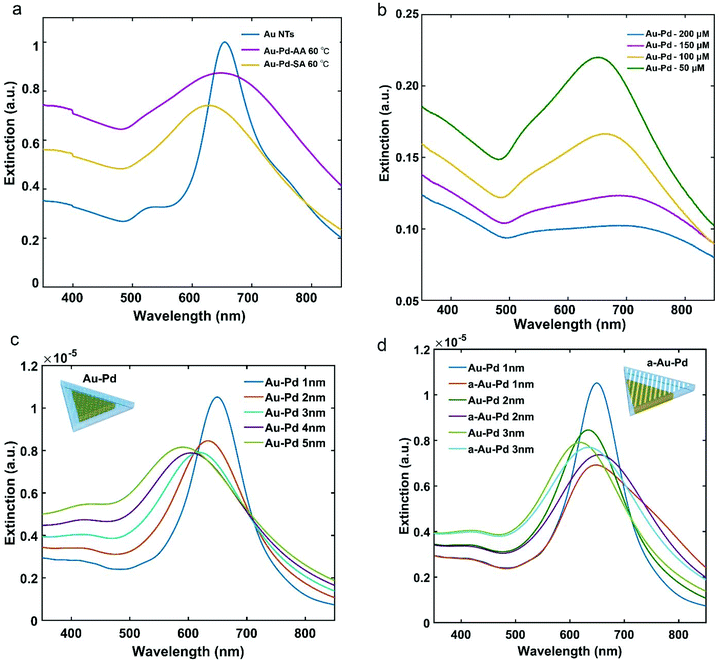
Fig. 6a shows the extinction spectra of the a-Au NT-Pd NPs and s-Au NT-Pd NPs presented in Fig. 4. Compared to the Au NTs, the main LSPR band of both of the Au NT-Pd NPs became broader and showed a slight blue-shift. To clarify how the Pd thickness influenced the plasmon peaks, we further measured the extinction spectra of Au NT-Pd with a shell thicknesses from 2 nm to 10 nm. As shown in Fig. 6b and Fig. S13a,† the main LSPR band of the Au NT-Pd NPs became broader, and the intensity became weaker when the Pd shells were thicker. The same measurements were performed on the a-Au NT-Pd NPs, and a similar trend was found (Fig. S13b†), which means that the LSPR band of the Au NT-Pd NPs mainly depends on the thickness of Pd shell. Moreover, the FDTD simulations of Au NTs-Pd with a thickness of the Pd shell ranging from 1 nm to 5 nm show good agreement as the plasmon peak decayed as the thickness of Pd shell increases (Fig. 6c). To simulate the extinction spectrum of a-Au NT-Pd NPs, we created a model shown as the inserted model in Fig. 6d. Comparing such a rough particle to particles with the same Pd thickness, the LSPR band of a-Au NT-Pd is wider and shows a prominent tail at the high wavelength side of the peak (Fig. 6d). These results show good agreement with the experimental measurements (Fig. S13b†).
Au NT-Pt NPs
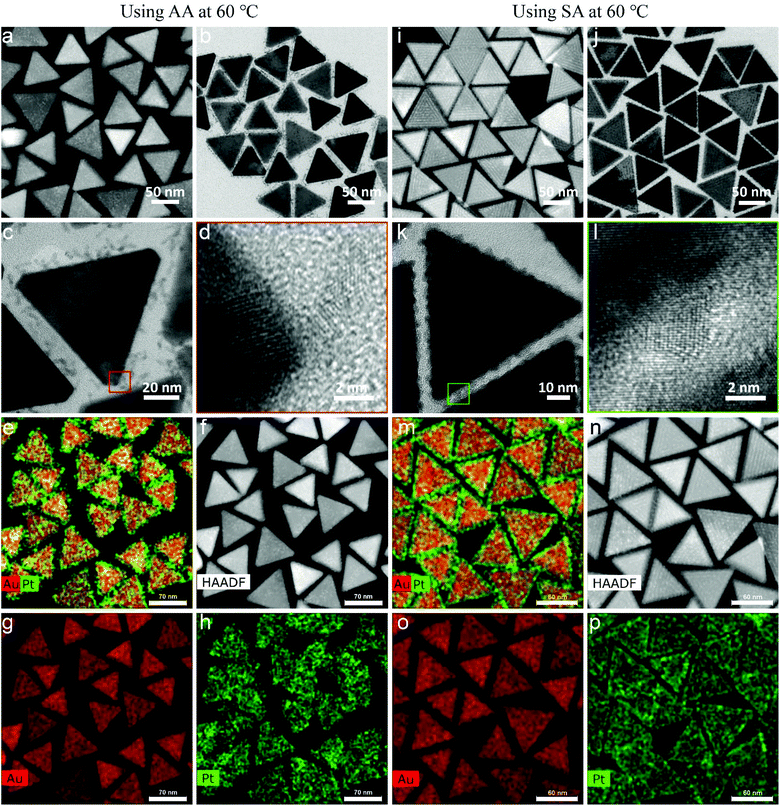
Fig. 7a–c show the typical morphology of Au NT-Pt NPs when using AA as reductant at a reaction temperature of 60 °C. The Pt grew into an irregular dendritic structure and randomly decorates the Au NTs surface (expressed as a-Au NT-Pt NPs). The diameter of the Pt irregular dendritic structures was about 1 nm, and the length distribution varied from 5 nm to 7 nm (Fig. 7c and d). For the case of using SA, small Pt NPs with a diameter of about 2 nm were present on the surface of the Au NTs and mutually aligned, forming triangular patterns on the (111) surface, and lines on the edge sides (Fig. 7i–k). Moreover, the HRTEM images indicate that the Pt grew epitaxially along the crystal orientations of the Au NT (Fig. 7d and k), and the EDS maps further confirm the Pt irregular dendritic structures and small Pt NPs on the Au NT (Fig. 7e–h and m–p).To further elucidate how the reaction conditions influence the shape of the Au NT-Pt NPs, two reaction parameters were analyzed: the concentration of Pt precursor (K2PtCl4) and reaction temperature. In agreement with our expectation, both sizes of the Pt irregular dendritic structures and Pt islands on the Au NT reduced when the concentration of K2PtCl4 for the reaction was decreased from 150 μM to 50 μM (Fig. 8 and Fig. S14†). Next, we performed syntheses by keeping the concentration of solution and reaction time constant but changed the temperature from 60 °C to 20 °C. The size and density of the Pt irregular dendritic structures and Pt islands dramatically decreased upon lowering the reaction temperature from 60 °C to 40 °C and 20 °C in both cases of using AA and SA (Fig. S15, S16, & S17†). There are two possible reasons for this phenomenon. First, the reaction rate slows down as the temperature decreases. Second, the solubility of the [PtCl4]2−-cetyltrimethyl-ammonium ion ([PtCl4]2−CTA+2) complex decreased upon lowering the temperature. It was reported that the formation of a [PtCl4]2−CTA+2 complex impedes the reduction of the Pt precursor,27 which is confirmed as well by our observation that the transparent solution became turbid at 20 °C.
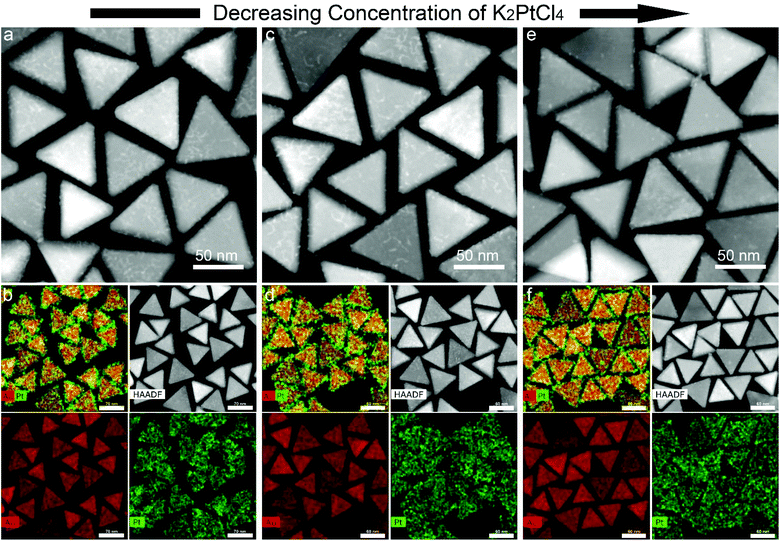 | ||
| Fig. 8 Morphology evolution of Au NT-Pt NPs synthesized using AA as reductant when changing the concentration of K2PtCl4. | ||
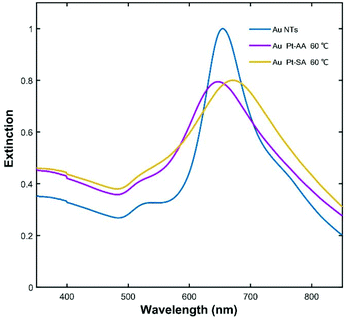
Fig. 9 shows the extinction spectra of the Au NT-Pt NPs presented in Fig. 7 and the starting Au NTs. The LSPR of the Au NT-Pt NPs broadened and there was a slight blue-shift for the a-Au NT-Pt NPs and a red-shift for the s-Au NT-Pt NPs. The blue-shift was possibly due to a mild etching of the Au NTs during the reaction which is visible in the (S)TEM images in Fig. 7, and the slight red-shift is because of the growth of the Pt islands onto the whole Au NT. The finding of the LSRP bands of the Au NT-Pt NPs with smaller Pt irregular dendritic structures and/or Pt islands supports this explanation. From Fig. 8, it becomes clear that the etching of the Au NTs substrates was almost the same, but the Pt irregular dendritic structures became smaller with decreasing the concentration of K2PtCl4. As shown in Fig. S18a,† the LSPR band position of those particles with larger Pt IDSs was closer to the band position of the original Au NTs. In contrast, growth of smaller Pt islands on Au NTs reduced the redshifts of the LSPR peaks (Fig. S18b†). The damping of Au NT LSPR after Pt deposition is dependent on the Pt density and thickness on Au NTs, where an increase of the Pt density and thickness both lead to broadening of the extinction spectra (Fig. S18c & d†). The damping effect caused by Pt growth is due to the dielectric effects and/or charge transfer between the Au and Pt.
The overall formation process of the nanostructures is governed by three consecutive steps; (1) reactions between reductants and metal precursors, (2) initial deposition of metal atoms and clusters onto the Au surfaces, and (3) kinetic factors determining the final morphology, which we are discussing below in this order.
The reaction mechanism
The chemical reactions between reductants and metal precursors are given by:28| 2Ag+ + C6H8O6 → 2Ag + C6H6O6 + 2H+ |
| 2Ag+ + C7H6O3 → 2Ag + C7H4O3 + 2H+ |
The total number of hydroxyl groups that serve as the reacting group and take part in the reactions with metal precursors in AA is four, which is larger than that in SA where it is one (Scheme S1†). In addition, due to the ortho-effect of multiple hydroxyl groups in AA and the inactivation of carboxyl in SA, the reactivity of the hydroxyls of AA is higher than the reactivity of the same group in SA. This causes the reaction rates between AA and the metals precursors to be higher than those between SA and the precursors. The concentration of AA and SA used for most of the experiments was 1000 μM and 1800 μM, respectively. Both concentrations were much higher than the concentrations of metals precursors. A set of experiments were conducted using 900 μM SA for synthesising Au NT-M (Ag, Pd, Pt). Compared to the cases of using 1800 μM SA, the morphologies of the resulting nanoparticles showed no differences (Fig. S19†), which implies that the shapes of the Au NT-M (Ag, Pd, Pt) bi-metallic particles would not be affected by changing the concentration of SA in the range between 900 μM to 1800 μM.
Growth modes of the second metal
According to crystal growth theory, the growth mode is mainly determined by surface energies and the lattice mismatch between the substrate metal and the metals grown on top of the substrate metals. In general, three types of growth modes can be distinguished for the gas phase deposition onto a hetero-substrate: the layer by layer growth mode (Frank van der Merwe mode, F–M), the island growth mode (Volmer Weber mode, V–W), and an intermediate growth mode (Stranski Krastanow mode, S–K).29–31 For the core shell NPs, an equation based on the surface free energies of the core and shell metal, and their interface free energies, is used for estimating which growth process follows which of these growth modes.| Δγn = γSn + γin − γCn |
In the metallic core–shell NPs system, Δγn is the difference in surface energy between n atomic layers of shell and the core metal. γSn, γin, and γCn are the surface free energies of the shell, core–shell interface, and the core metal, respectively. The F–M growth mode is in the regime where: (i) Δγn ≤ 0, (ii) γSn < γCn, and (iii) γin is small. If (ii) and/or (iii) are not fulfilled, then S–K mode directs the growth. Lastly, the V–W mode dominates when Δγn > 0.31
Considering the results of our experiments, those cases where the second metal grew continuous smooth shells on the Au NT cores, like in the case of Ag, can be characterized as F–M growth, while those cases where discontinuous shells, e.g. in the case of Pt, were found, can be considered to have grown via the V–W mode. For the case of Pd, both kinds of shells were observed and have been reported before.16,29,32,33 From the point of view of thermodynamics, the bonding energy between Pd growing onto Pd is lower than that between Au and Pd, which allows continuous Pd shell growth onto the Au core. On the other hand, a discontinuous shell can also form via manipulating kinetic factors, e.g. reductants and/or Pd precursors.
The morphologies of the metal shells
The morphologies of the core–shell NMNPs are the result of complicated interactions influenced by several factors, such as metal types, metal precursors, reductants, and surfactants (also called ligands), and can be classified into either thermodynamically or kinetically controlled factors.33 The key morphology of Au NT-M was summarized and shown in Scheme 1. As discussed above, the reaction rates between AA and the metal precursors are faster than those when SA is used as the reductant for the same reaction conditions. Thus, a kinetically controlled product is easier to obtain when AA is used in a synthesis. In this regard, Ag was found to deposit asymmetrically onto the Au NTs, and Pd, Pt grow into dendritic shells when AA was used as the reductant. In addition, when AA was used, the thickness of the Ag/Pd shells and the Pt irregular dendritic structures was easily tuned by controlling the concentration of the metal precursors (Fig. S3, S6,† & Fig. 8). A similar trend was found for Pd and Pt, but not for Ag, when SA was used (Fig. 5, S14 & S4†).As shown in Fig. 6, the density of Pt irregular dendritic structures was lower than the Pt islands on the Au NTs. The possible reason is that the size of the SA molecule is smaller and the molecular structure is planar, which makes it easier to pass the CTAC double layers and reach the Au NT surface.26 Moreover, the concentration of SA used for the experiments was much higher than the concentration of the metal precursors, and SA played a role as co-surfactant in the metals growth as well. The role of co-surfactant of SA was also reported previously in the synthesis of Au nanorods.25,34 For the larger AA molecule, it is more difficult to pass the CTAC double layers, and thus, the number of growth sites on Au NT surface was smaller. It was also observed in previous reports,23,35,36 that the Pt islands grew into patterns on the Au NTs due to the adsorption of CTAC molecules on the Au NT surface and the geometry of the Au NTs.
Furthermore, temperature plays an important role in controlling the morphology of Au NT-M (Pd, Pt) nanoparticles. For instance, it can affect the reaction rate of AA, SA, and metal precursors. In this respect, SA was affected more than AA and resulted in the shape of both Au NT-Pd and Au NT-Pt being significant changed when the temperature was decreased to 40 °C and 20 °C (Fig. S9–12 and S17†). Second, in the case of Pt growth, temperature could affect the solubility of the [PtCl4]2−CTA+2 complex and then influence the reduction of the Pt precursor, which was found when AA and/or SA were used (Fig. S15 & S17†). Overall, temperature is an essential factor to take into account in the morphology-controlled synthesis of Au NT-M, in particular when using SA as reductant.
Overall, the deposition of Ag, Pd, and Pt onto Au NTs was initially affected by thermodynamical factors yielding different growth modes, in which Ag follows F–M growth, while Pd and Pt grow via V–W mode. Subsequently, kinetical factors influenced the further growth and the final morphology of the Au NT-M nanoparticles. In this regard, the reactivity of AA and SA, which is determined by their molecular structure, influenced the symmetric and/or asymmetric growth of metals onto Au NTs, where the reactivity of SA is lower than that of AA, resulting in the reactions of SA with metals precursors to be more sensitive to the reaction temperature. Although SA showed less control over the shape of Au NT-Ag, by using it, asymmetric Au NT-Pd and Au NT-Pt nanostructures with a nice patterning on the Au NTs surfaces were obtained, which showcases its great potential for synthesizing metals nanocrystals.
Conclusions
In summary, SA and AA were used as a reductant for growth of metals (Ag, Pd, and Pt) onto Au NTs. By carefully controlling the experimental conditions, both AA and SA show versatile capabilities for the morphology-controlled synthesis of Au NT-M (Ag, Pd, and Pt). The shell thickness of the overgrowth metals (Ag, Pd, and Pt) was easily tuned via changing the concentration of the metal precursors when AA was used. On the other hand, due to the lower reactivity in comparison to AA, using SA allowed less control over the morphology of Au–Ag NPs but this reductant was found to be effective for manipulating Pd and Pt structures growing onto Au NTs. Furthermore, the reaction temperature was found to have a stronger effect on the Au NT-M morphology when SA was used. Apart from being a reductant, SA also worked as a co-surfactant for the growth of the second metals. The LSPR of BNMNPs depended on the type of second metal, the metal shell thickness, and the location of the metal overgrowth. Our investigation opens new possibilities for controlled growth of second metals onto Au seeds and stimulates the future study of developing SA and even other new reductants for synthesizing heterogeneous metal nanocrystals exhibiting enhanced optical properties.Experimental
Synthetic procedures of Au NT@M (Ag, Pd, Pt)
More details of experimental section, e.g. Chemicals, Characterization, and FDTD simulations, can be found in ESI.†
Conflicts of interest
There are no conflicts to declare.Acknowledgements
We thank Dr Wiebke Albrecht and Tom Welling for help with FDTD simulations. X. X. and A. v. B. acknowledge financial support from EU H2020-MSCA-ITN-2015 project ‘MULTIMAT’ (project number: 676045). M. A. v. H. funding by the European Research Council through an ERC Consolidator Grant (Grant No. 683076).References
- C. Tan, J. Chen, X.-J. Wu and H. Zhang, Nat. Rev. Mater., 2018, 3, 17089 CrossRef CAS.
- Z. Lou, M. Fujitsuka and T. Majima, ACS Nano, 2016, 10, 6299–6305 CrossRef CAS.
- C. W. Yang, K. Chanda, P. H. Lin, Y. N. Wang, C. W. Liao and M. H. Huang, J. Am. Chem. Soc., 2011, 133, 19993–20000 CrossRef CAS.
- H. Huang, L. Zhang, Z. Lv, R. Long, C. Zhang, Y. Lin, K. Wei, C. Wang, L. Chen, Z. Y. Li, Q. Zhang, Y. Luo and Y. Xiong, J. Am. Chem. Soc., 2016, 138, 6822–6828 CrossRef CAS.
- T. Sheng, Y. F. Xu, Y. X. Jiang, L. Huang, N. Tian, Z. Y. Zhou, I. Broadwell and S. G. Sun, Acc. Chem. Res., 2016, 49, 2569–2577 CrossRef CAS.
- M. Chen, S. Tang, Z. Guo, X. Wang, S. Mo, X. Huang, G. Liu and N. Zheng, Adv. Mater., 2014, 26, 8210–8216 CrossRef CAS.
- G. Bodelon, V. Montes-Garcia, V. Lopez-Puente, E. H. Hill, C. Hamon, M. N. Sanz-Ortiz, S. Rodal-Cedeira, C. Costas, S. Celiksoy, I. Perez-Juste, L. Scarabelli, A. La Porta, J. Perez-Juste, I. Pastoriza-Santos and L. M. Liz-Marzan, Nat. Mater., 2016, 15, 1203–1211 CrossRef CAS.
- M. B. Cortie and A. M. McDonagh, Chem. Rev., 2011, 111, 3713–3735 CrossRef CAS.
- L. Polavarapu, D. Zanaga, T. Altantzis, S. Rodal-Cedeira, I. Pastoriza-Santos, J. Perez-Juste, S. Bals and L. M. Liz-Marzan, J. Am. Chem. Soc., 2016, 138, 11453–11456 CrossRef CAS.
- K.-K. Liu, S. Tadepalli, G. Kumari, P. Banerjee, L. Tian, P. K. Jain and S. Singamaneni, J. Phys. Chem. C, 2016, 120, 16899–16906 CrossRef CAS.
- K. A. Willets, A. J. Wilson, V. Sundaresan and P. B. Joshi, Chem. Rev., 2017, 117(11), 7538–7582 CrossRef CAS.
- Y. Bai, C. Gao and Y. Yin, Nanoscale, 2017, 9, 14875–14880 RSC.
- L. Zhang, T. Liu, K. Liu, L. Han, Y. Yin and C. Gao, Nano Lett., 2015, 15, 4448–4454 CrossRef CAS.
- C. Chen, Y. Kang, Z. Huo, Z. Zhu, W. Huang, H. L. Xin, J. D. Snyder, D. Li, J. A. Herron, M. Mavrikakis, M. Chi, K. L. More, Y. Li, N. M. Markovic, G. A. Somorjai, P. Yang and V. R. Stamenkovic, Science, 2014, 343, 1339–1343 CrossRef CAS.
- M. Hajfathalian, K. D. Gilroy, S. D. Golze, A. Yaghoubzade, E. Menumerov, R. A. Hughes and S. Neretina, ACS Nano, 2016, 10, 6354–6362 CrossRef CAS.
- K. D. Gilroy, A. Ruditskiy, H. C. Peng, D. Qin and Y. Xia, Chem. Rev., 2016, 116, 10414–10472 CrossRef CAS.
- L. Scarabelli, M. Coronado-Puchau, J. J. Giner-Casares, J. Langer and L. M. Liz-Marzán, ACS Nano, 2014, 8, 5833–5842 CrossRef CAS.
- X. Xie, G. Gao, S. Kang, T. Shibayama, Y. Lei, D. Gao and L. Cai, Adv. Mater., 2015, 27, 5573–5577 CrossRef CAS.
- Y. Xie, G. M. Pan, Y. Y. Li, K. Chen, Y. J. Lin, L. Zhou and Q. Q. Wang, Nanoscale, 2018, 10, 1279–1285 RSC.
- M. Ha, J. H. Kim, M. You, Q. Li, C. Fan and J. M. Nam, Chem. Rev., 2019, 119, 12208–12278 CrossRef CAS.
- C. Charnay, A. Lee, S.-Q. Man, C. E. Moran, C. Radloff, R. K. Bradley and N. J. Halas, J. Phys. Chem. B, 2003, 107, 7327–7333 CrossRef CAS.
- S. Liang, X. L. Liu, Y. Z. Yang, Y. L. Wang, J. H. Wang, Z. J. Yang, L. B. Wang, S. F. Jia, X. F. Yu, L. Zhou, J. B. Wang, J. Zeng, Q. Q. Wang and Z. Zhang, Nano Lett., 2012, 12, 5281–5286 CrossRef CAS.
- P. J. Straney, N. A. Diemler, A. M. Smith, Z. E. Eddinger, M. S. Gilliam and J. E. Millstone, Langmuir, 2018, 34, 1084–1091 CrossRef CAS.
- S. Griffin, N. P. Montoni, G. Li, P. J. Straney, J. E. Millstone, D. J. Masiello and J. P. Camden, J. Phys. Chem. Lett., 2016, 7, 3825–3832 CrossRef CAS.
- X. Ye, L. Jin, H. Caglayan, J. Chen, G. Xing, C. Zheng, V. Doan-Nguyen, Y. Kang, N. Engheta, C. R. Kagan and C. B. Murray, ACS Nano, 2012, 6(3), 2840–2817 CrossRef.
- N. Ortiz, S. J. Hong, F. Fonseca, Y. Liu and G. Wang, J. Phys. Chem. C, 2017, 121, 1876–1883 CrossRef CAS.
- L. Guo, L.-B. Huang, W.-J. Jiang, Z.-D. Wei, L.-J. Wan and J.-S. Hu, J. Mater. Chem. A, 2017, 5, 9014–9021 RSC.
- J. A. Edgar, A. M. McDonagh and M. B. Cortie, ACS Nano, 2012, 6, 1116–1125 CrossRef CAS.
- F.-R. Fan, D.-Y. Liu, Y.-F. Wu, S. Duan, Z.-X. Xie, Z.-Y. Jiang and Z.-Q. Tian, J. Am. Chem. Soc., 2008, 130, 6949–6951 CrossRef CAS.
- L. Carbone and P. D. Cozzoli, Nano Today, 2010, 5, 449–493 CrossRef CAS.
- E. Bauer and J. H. van der Merwe, Phys. Rev. B: Condens. Matter Mater. Phys., 1986, 33, 3657–3671 CrossRef CAS.
- X. Xie, G. Gao, S. Kang, Y. Lei, Z. Pan, T. Shibayama and L. Cai, Nanotechnology, 2017, 28, 245602 CrossRef.
- S. F. Tan, G. Bisht, U. Anand, M. Bosman, X. E. Yong and U. Mirsaidov, J. Am. Chem. Soc., 2018, 140, 11680–11685 CrossRef CAS.
- L. Scarabelli, M. Grzelczak and L. M. Liz-Marzán, Chem. Mater., 2013, 25, 4232–4238 CrossRef CAS.
- P. J. Straney, L. E. Marbella, C. M. Andolina, N. T. Nuhfer and J. E. Millstone, J. Am. Chem. Soc., 2014, 136, 7873–7876 CrossRef CAS.
- R. K. Leary, A. Kumar, P. J. Straney, S. M. Collins, S. Yazdi, R. E. Dunin-Borkowski, P. A. Midgley, J. E. Millstone and E. Ringe, J. Phys. Chem. C, 2016, 120, 20843–20851 CrossRef CAS.
Footnote |
| † Electronic supplementary information (ESI) available. See DOI: 10.1039/d0nr06789j |
| This journal is © The Royal Society of Chemistry 2021 |

