
 Open Access Article
 This Open Access Article is licensed under a
 Creative Commons Attribution 3.0 Unported Licence
Friction between soft contacts at nanoscale on uncoated and protein-coated surfaces†
Evangelos
Liamas
 a,
Simon D.
Connell
*b,
Morfo
Zembyla
a,
Rammile
Ettelaie
a and
Anwesha
Sarkar
*a
a,
Simon D.
Connell
*b,
Morfo
Zembyla
a,
Rammile
Ettelaie
a and
Anwesha
Sarkar
*a
aFood Colloids and Bioprocessing Group, School of Food Science and Nutrition, University of Leeds, UK. E-mail: A.Sarkar@leeds.ac.uk
bMolecular and Nanoscale Physics Group, School of Physics and Astronomy, University of Leeds, UK. E-mail: S.D.A.Connell@leeds.ac.uk
First published on 21st December 2020
Abstract
The understanding of friction on soft sliding biological surfaces at the nanoscale is poorly understood as hard interfaces are frequently used as model systems. Herein, we studied the influence of elastic modulus on the frictional properties of model surfaces at the nanoscale for the first time. We prepared model silicone-based elastomer surfaces with tuneable modulus ranging from hundreds of kPa to a few MPa, similar to those found in real biological surfaces, and employed atomic force microscopy to characterize their modulus, adhesion, and surface morphology. Consequently, we used friction force microscopy to investigate nanoscale friction in hard–soft and soft–soft contacts using spherical colloidal probes covered by adsorbed protein films. Unprecedented results from this study reveal that modulus of a surface can have a significant impact on the frictional properties of protein-coated surfaces with higher deformability leading to lower contact pressure and, consequently, decreased friction. These important results pave the way forward for designing new functional surfaces for serving as models of appropriate deformability to replicate the mechanical properties of the biological structures and processes for accurate friction measurements at nanoscale.
1. Introduction
A plethora of soft sliding interfaces exist in the human body as well as in technological applications where low friction is often a requirement to ensure proper functioning. However, due to a variety of reasons, large frictional forces may develop that can have serious implications from irritation to severe pain in cases such as arthritis or xerostomia.1–5 There have been several studies regarding friction on biological surfaces at the macroscale such as in synovial joints,6–9 the oral cavity,4,10,11 the eyes,12,13 or the skin.14,15 Although these studies provide a great deal of knowledge regarding the frictional properties of these systems, it is necessary to realize that friction at a smaller scale can differ significantly from the macroscale.16 Particularly at the nanoscale, the interface can shift from multi-asperity to single asperity contact, while adhesion between interfaces plays a major role in friction.With the development of techniques that measure friction at the nanoscale such as friction force microscopy (FFM), a technique based on atomic force microscopy (AFM), we can achieve a more relevant insight on biotribological mechanisms that otherwise is not possible with macroscale techniques. For instance, due to the very low sliding speeds and small contact areas at nanoscale, frictional contact is likely to be in the boundary regime and the effect of hydrodynamic film lubrication observed with other techniques can be ignored. Nanomechanical characterization offers powerful insights into the mechanisms of articular cartilage lubrication showcasing the impact of boundary lubricants.17 In another study, it was reported that friction on murine cartilage is attributed mainly to interfacial shear, while inelastic deformation, ploughing, and surface collision had a limited contribution.18 Other studies focused on the lubricating properties of proteins and hyaluronic acid found in synovial fluid highlighting the importance of their synergistic action that enhances the attachment of proteins and mediates friction at articular cartilage interfaces, while it also reduces the wear by shielding the surfaces from direct damage more effectively.19,20 Similarly, a study focusing on the lubrication of the oral cavity reported the excellent lubricating properties of human saliva, as well as the synergistic lubrication properties of mucins and other low molecular weight salivary proteins.21
While the above studies provide a great deal of insight on the nanotribological properties of the systems under focus, the materials used in these studies were often hard or relatively hard when compared to actual biological surfaces, which tend to have Young's moduli ranging between a few tens of kPa to a few tens of MPa.22 For instance, articular cartilage has an elastic modulus of a few MPa,23 while tongue has a modulus of a few kPa.24 Consequently, using hard surfaces to study friction of soft biological surfaces tend to overlook the important role of deformability on the frictional properties of biological surfaces producing results that may differ from reality and impede our understanding of friction in soft–soft contact systems.
The differences in frictional properties in hard–hard versus hard–soft or soft–soft contacts could arise due to deformation and adhesion forces changing the contact area, smoothing surface nanometric roughness, or due to molecular arrangement effects such as dissipation, entanglement or rapid adsorption/desorption. Another factor that needs to be considered is that biological surfaces are often coated with a proteinaceous film that mediates friction and, thus, the mechanical properties as well as the surface chemistry of the model surface can have a great impact in dictating the adhesion and friction of proteins on those surfaces. For instance, Majd et al. used a silica colloidal probe to study the role of hydrophobicity on the adsorption of synovial fluid proteins using self-assembled monolayers (SAMs), polycarbonate urethane (PCU) and modified with C18 chains PCU (mPCU) surfaces. They reported that while SAMs, PCU, and mPCU were all hydrophobic, the lubricating properties of the proteins were different on these surfaces, which could be attributed to surface softness. Consequently, by using soft model surfaces to study friction at the nanoscale, we can understand how the elasticity of the underlying surface affects the frictional properties of these soft surfaces which are generally coated with protein layers in nature.
Polydimethylsiloxane (PDMS) is an elastomer that has been used widely in order to replicate biological systems.25–28 However, commercially available PDMS has a modulus of approximately 2 MPa, which is still high compared to the modulus of most biological surfaces.24 Several studies have reported that the modulus of PDMS can be adjusted by altering the ratio of crosslinking.29–34 However, as the ratio of crosslinking agent is reduced, the amount of un-crosslinked PDMS molecules is increased. Consequently, free molecules of silicone oils can migrate to the surface and cause various problems, such as increased adhesion between PDMS and substrate,35 or formation of a phase-separated liquid meniscus.36,37 Therefore, an alternative approach of preparing soft model systems to mimic biological surfaces is required in order to study the impact of elastic modulus on frictional forces at nanoscale.
Herein, we employed friction force microscopy to examine how the nanotribological properties of a model biological surface coated with proteins are affected by deformability of the surface. More specifically, we manufactured spherical PDMS colloid-probes for FFM, and used a protocol that allows tuning of PDMS surfaces from MPa to the kPa range, successfully replicating the elastic modulus of biological surfaces. We characterised the surfaces and highlight the key factors that can affect the measurements at nanoscale clearly differentiating hard–soft from soft–soft contacts. Subsequently, we measured friction and demonstrated that on bare PDMS surfaces friction is well described by single asperity models. In contrast, friction on protein-coated surfaces can be described by macroscopic models (Amonton's law) depending upon the protein type. We selected negatively charged β-lactoglobulin (β-lg) and positively charged lactoferrin (LF), both of which are globular proteins that are components of whey protein, in order to coat the PDMS surfaces and screen the large adhesion between PDMS–PDMS surfaces. We found that the protein coated surfaces revealed significant differences in their lubricating properties associated with the protein affinity towards the surface. More importantly, we report a clear dependency of friction on the Young's modulus of the substrate. To date, this is the first study that sheds light on the impact of elasticity on the frictional properties of protein-coated soft surfaces, which is anticipated to have an impact on designing new functional model surfaces for studying soft–soft contact friction in nanoscale for various biophysical and technological applications.
2. Results and discussion
Characteristics of the fabricated PDMS substrates with varying deformability
In order to study the impact of elastic modulus on the frictional properties of soft surfaces, silicone elastomers of different modulus were prepared by mixing two commercially available products, Sylgard®184 and Sylgard®527 (see Experimental section for further details). The elastomers were mixed in different ratios and their mechanical properties were determined using AFM force spectroscopy. Using a hard borosilicate glass (BSG) colloidal probe, the sample was indented and force–distance (F–d) curves were acquired in the presence of buffer at pH 6.8. The retracting F–d curves (Fig. S1a, ESI†) revealed adhesion between the BSG probe and the PDMS surfaces ranging between 30 and 50 nN, increasing steadily with decreasing elastic modulus (Fig. S2a, ESI†). Adhesion values were extracted from the retracting F–d curves following application of a 40 nN normal force on all PDMS samples, leading to deeper indentation and creation of a larger interface on softer surfaces, resulting in a larger “pull-off” force. Adhesion forces on soft surfaces can also be a function of retraction speed due to the relaxation time of the viscoelastic material, so differences in adhesion at different moduli could also be attributed to differences in relaxation.38–40 All of the modulus measurements were carried out at a tip velocity of 5 μm s−1, and while a lower separating speed would allow more time for the PDMS samples to relax and reduce differences in adhesion, the constant speed of 5 μm s−1 was chosen in order to match the sliding speed during friction experiments and allow the same duration of time for possible relaxation of stress in PDMS samples.Due to the observed adhesion and low modulus the retracting F–d curves were fitted with the Johnson–Kendall–Roberts (JKR) contact mechanics model (see Experimental section) to calculate the Young's modulus (E) of the PDMS samples.16 The JKR model in particular accounts for changes in contact area due to deformation and adhesion. As can be seen in the resulting Young's modulus versus indentation graph in Fig. 1a, the modulus increases with increasing indentation depth, especially for the samples with the higher elastic modulus, until it eventually reaches a plateau. It is also observed that the higher the elastic modulus, the larger the indentation needed to reach a plateau. In the range of modulus studied here, the plateau is reached at an indentation depth larger than 80 nm even for the highest modulus surface.
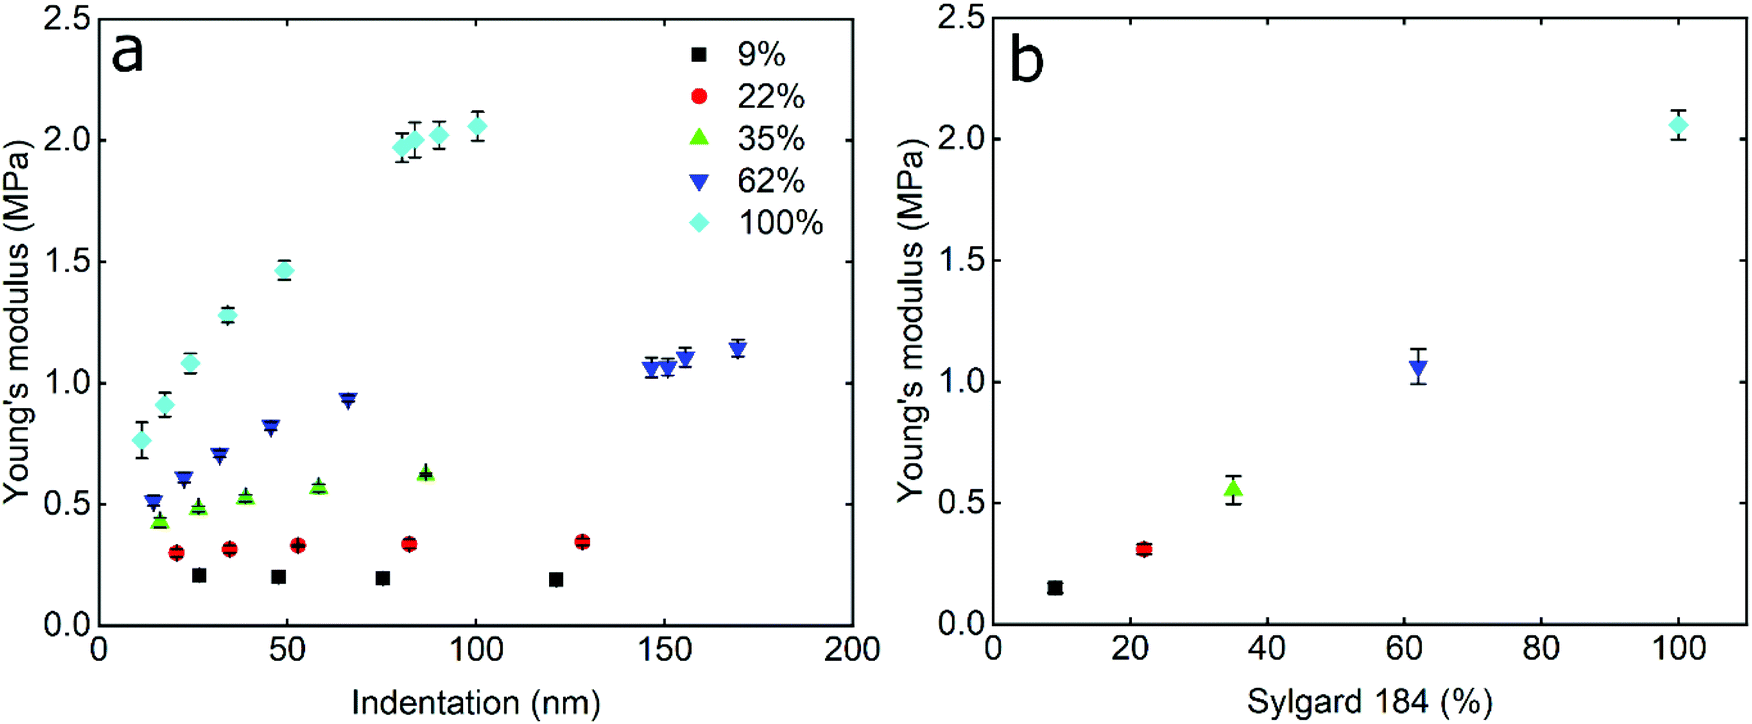 | ||
| Fig. 1 Determination of elasticity of the PDMS substrates. The Young's modulus was determined by means of AFM using a hard borosilicate glass (BSG) sphere with a radius of approximately 2.5 μm and fitted with a JKR model. (a) The data points (n = 50, mean ± SD) represent the Young's modulus of different PDMS surfaces as a function of indentation depths. (b) The data points represent the Young's modulus (n = 50, mean ± SD) of different PDMS substrates, taken from the plateau region of modulus versus indentation curve, as a function of Sylgard®184 percentage (%). The colours correspond to the weight percentage of Sylgard®184 over the total combined weight of Sylgard®184 and Sylgard®527. All samples differ significantly (p < 0.05) according to Tukey's test. | ||
This behaviour has been observed previously in many polymeric systems, with the surface (ranging from 50 nm up to 1 μm depending on material) exhibiting different mechanical properties to the bulk, including elastic and loss modulii, surface thermal properties, and hardness. This is likely attributed to ordering and confinement effects, as well as parameters such as surface roughness at the interface.41,42 At the plateau, the mean elastic modulus was approximately 150 kPa, 300 kPa, 550 kPa, 1 MPa, and 2 MPa, for the PDMS samples containing 9%, 22%, 35%, 62%, and 100% Sylgard®184, respectively (Fig. 1b).
The elastic modulus values of the stiffer samples acquired at the plateau are in close agreement with the values reported at the macroscale by Palchesko et al.43 However, the PDMS sample with 9% Sylgard®184 reveals slightly higher elastic modulus (150 kPa) as compared to the value reported at macroscale (50 kPa). Such differences in the Young's modulus of PDMS between macro- and nano-scales can be attributed not only to the adhesion detected at micro and nanoscale and ignored in macroscale compression tests, but also to measuring materials with elastic modulus lower than 1 MPa since they are not sensitive enough.44 From here on, the fabricated PDMS substrates are named with their respective Young's modulus i.e. 150 kPa, 300 kPa, 550 kPa, 1 MPa, and 2 MPa.
Friction is a systems property, thus varies with many factors, with two of the most important being surface roughness and surface chemistry, particularly the degree of hydrophilicity. Therefore, in order to interpret the data, it was necessary to take account of these effects using AFM topographic imaging and contact angle measurements on the different PDMS surfaces (Fig. 2). Fig. 2a–e show the topography of the PDMS surfaces with varying modulus, revealing an intricate porous network that is similar for all samples, although it is clear that the resolution progressively degrades as the modulus drops into the kPa range, presumably due to increasing deformability. The calculated root mean square (RMS) roughness was approximately 4 nm for the samples irrespective of the elasticity (Fig. 2f). Furthermore, the PDMS surfaces had similar hydrophobicity, measured at approximately 117 ± 3° (Fig. 2g), which is in agreement with previously reported values.45 In summary, the surface roughness and hydrophobicity were very similar across the surfaces being studied, and can be ruled out as factors affecting friction.
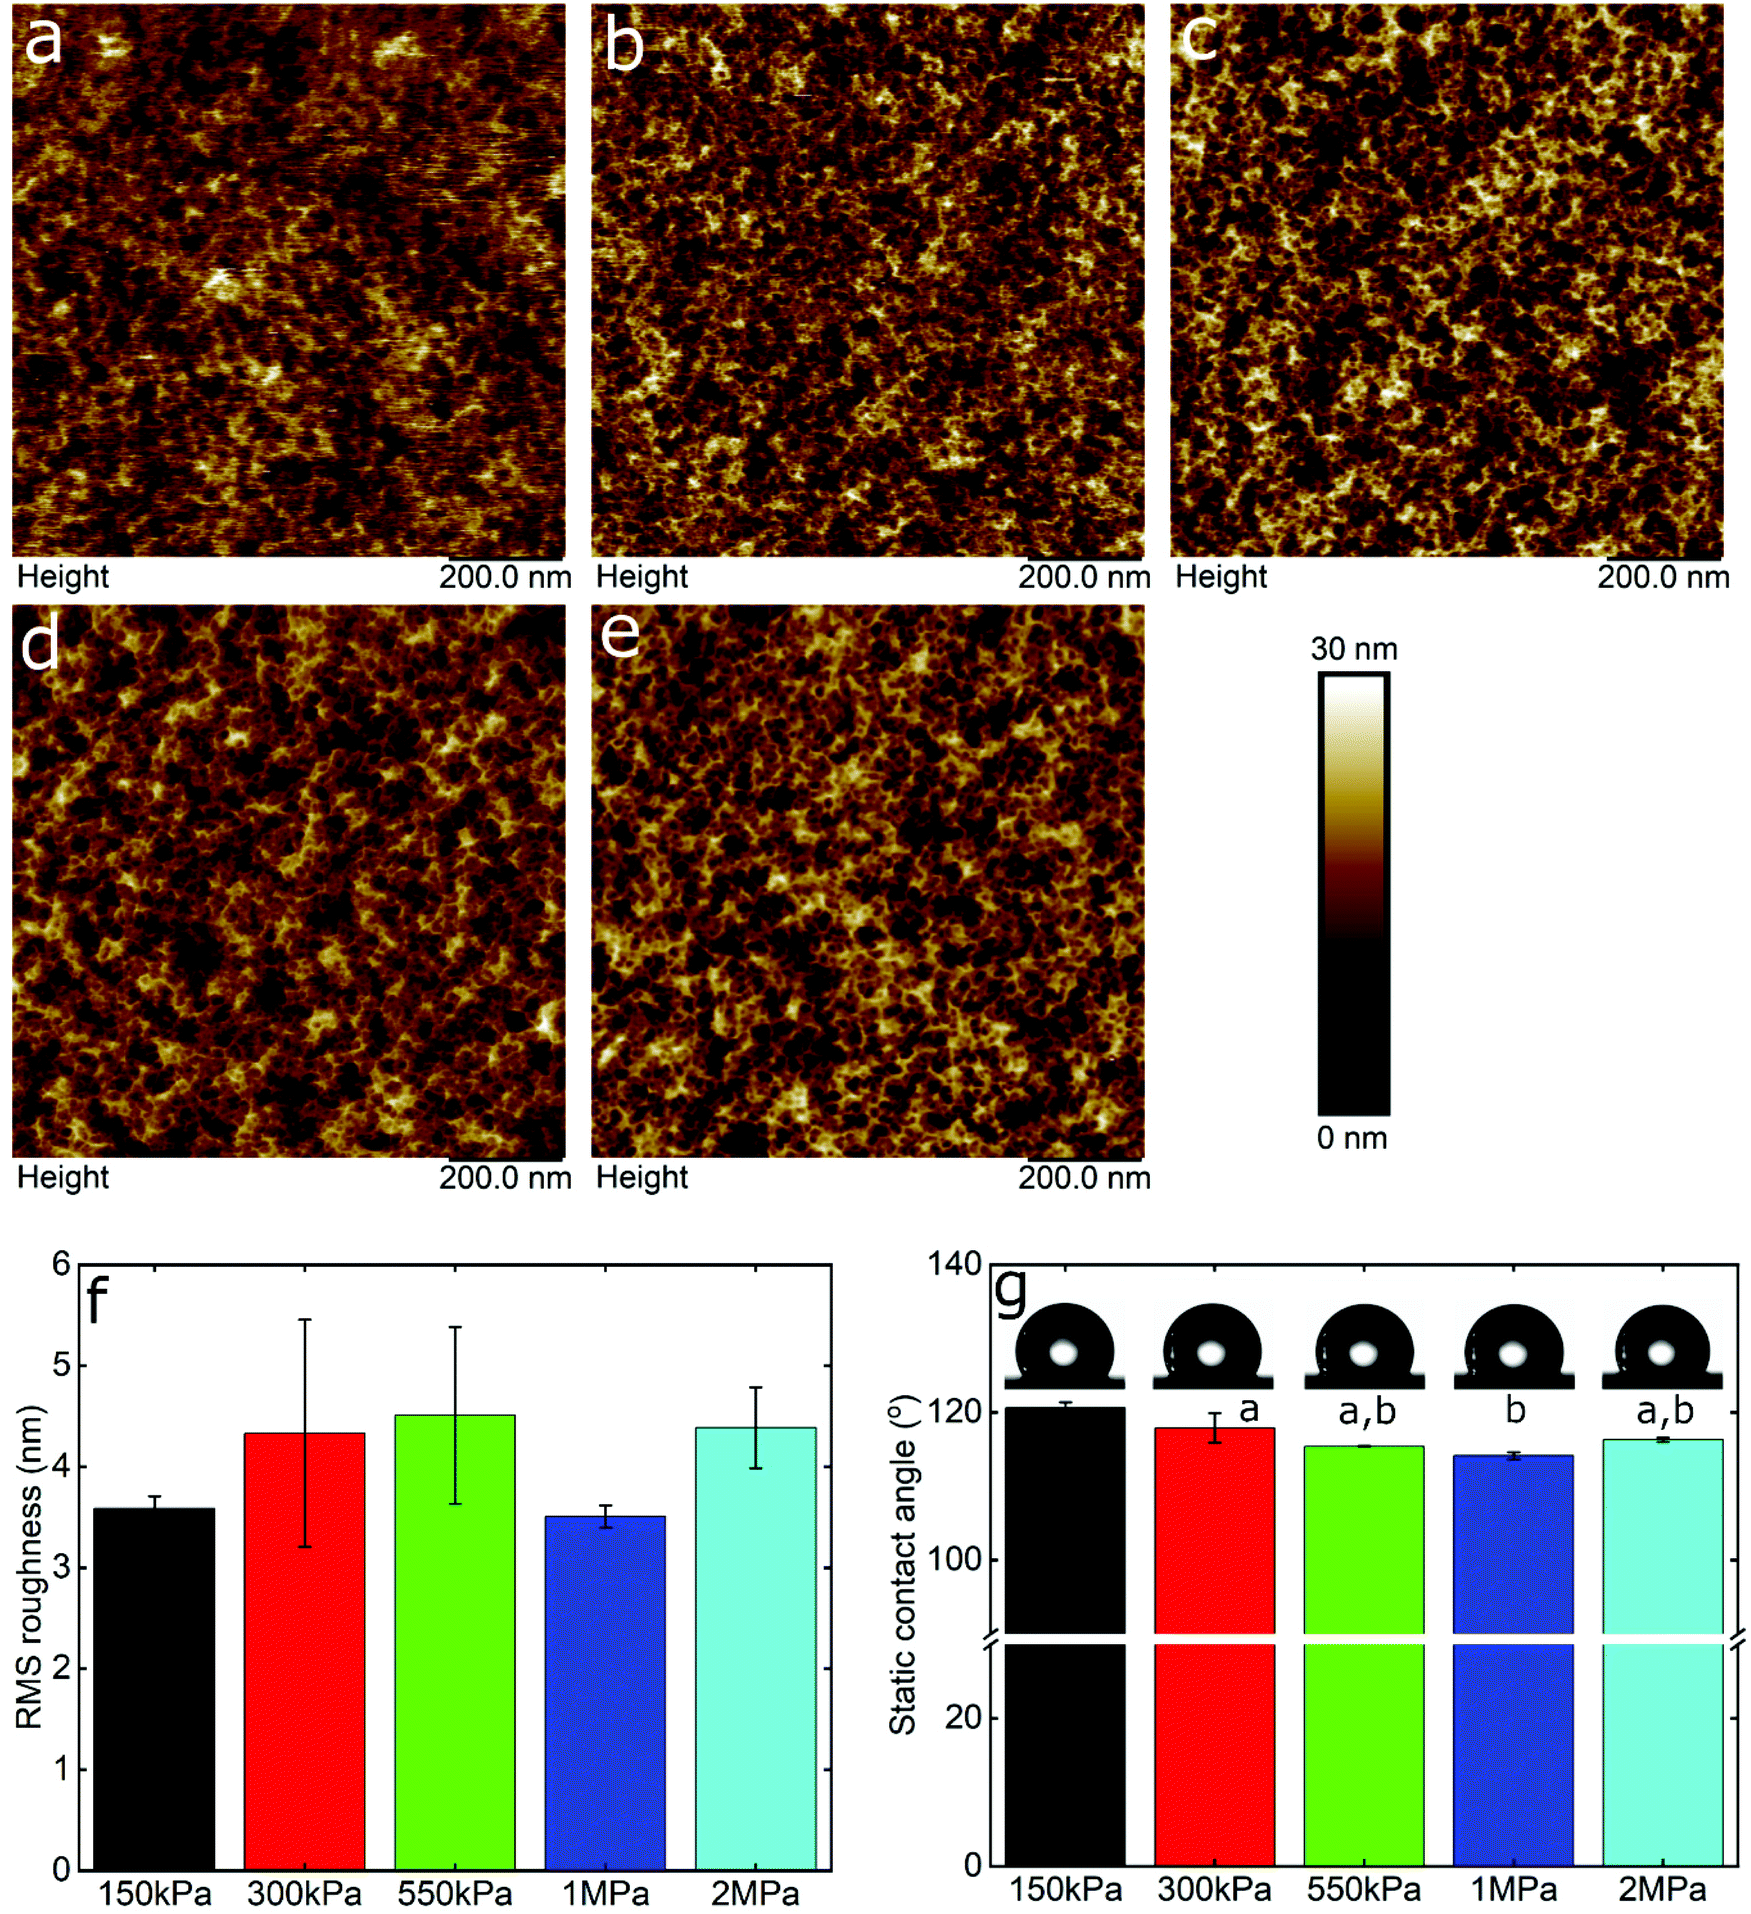 | ||
| Fig. 2 Surface morphology and hydrophilicity of PDMS substrates. Topographic images of PDMS substrates with elastic modulus of 150 kPa (a), 350 kPa (b), 550 kPa (c), 1 MPa (d), and 2 MPa (e). The images were acquired by means of AFM. (f) The bar chart represents the RMS roughness (n = 3, mean ± SD) of PDMS substrates with different elastic modulus. No significant differences (p > 0.05) were obtained in RMS roughness values between the samples according to Tukey's test. (g) The bar chart represents the static contact angle (n = 3, mean ± SD) of PDMS surfaces with different elastic modulus, as well as images of the corresponding water droplets, acquired by a drop tensiometer. Samples with the same letter do not differ significantly (p > 0.05) in static contact angle values according to Tukey's test. | ||
Frictional force at the nanoscale for hard–soft (BSG–PDMS) contact
Frictional force as a function of applied load for a hydrophilic BSG colloidal probe sliding on PDMS surfaces in buffer, lactoferrin (LF), and β-lactoglobulin (β-lg) are shown in Fig. 3a, c, and e, respectively, while the interfacial shear stress as a function of contact pressure for the same systems are shown in Fig. 3b, d, and f. The interfacial shear stress (τ) is the friction (Ff) normalised to JKR contact area (A) at every given load, τ = Ff/A. It is seen that in buffer solution (without proteins), the friction measurements do not have a linear dependence on the applied load (Fig. 3a) as it would if this case was falling under Amonton's law. Instead, friction increases sub-linearly in relation to the applied load that could indicate a single asperity contact. A positive friction force at zero load is also observed due to the presence of strong adhesive forces between all PDMS surfaces and the BSG probe. Consequently, to identify if friction between BSG probe and PDMS in buffer solution is described best with a DMT or JKR model, or falls somewhere between the two models, the data were fitted with a general transition equation (GTE), also known as Carpick–Ogletree–Salmeron (COS) approximation (eqn (1)):46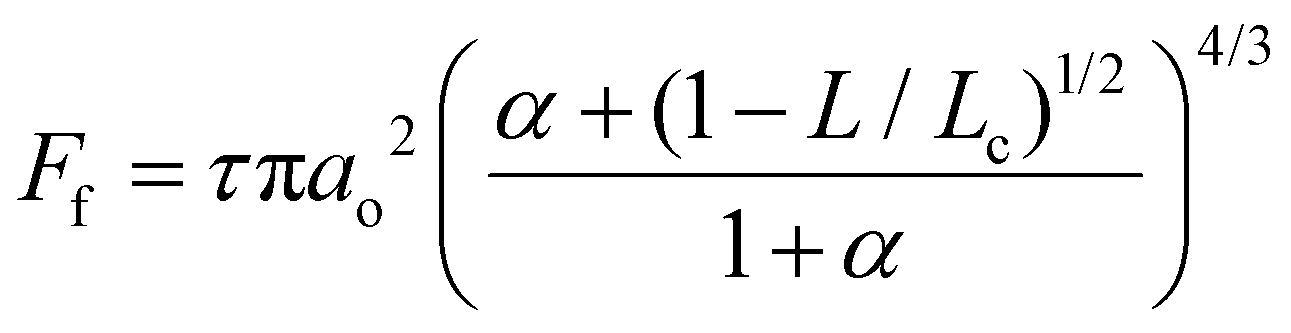 | (1) |
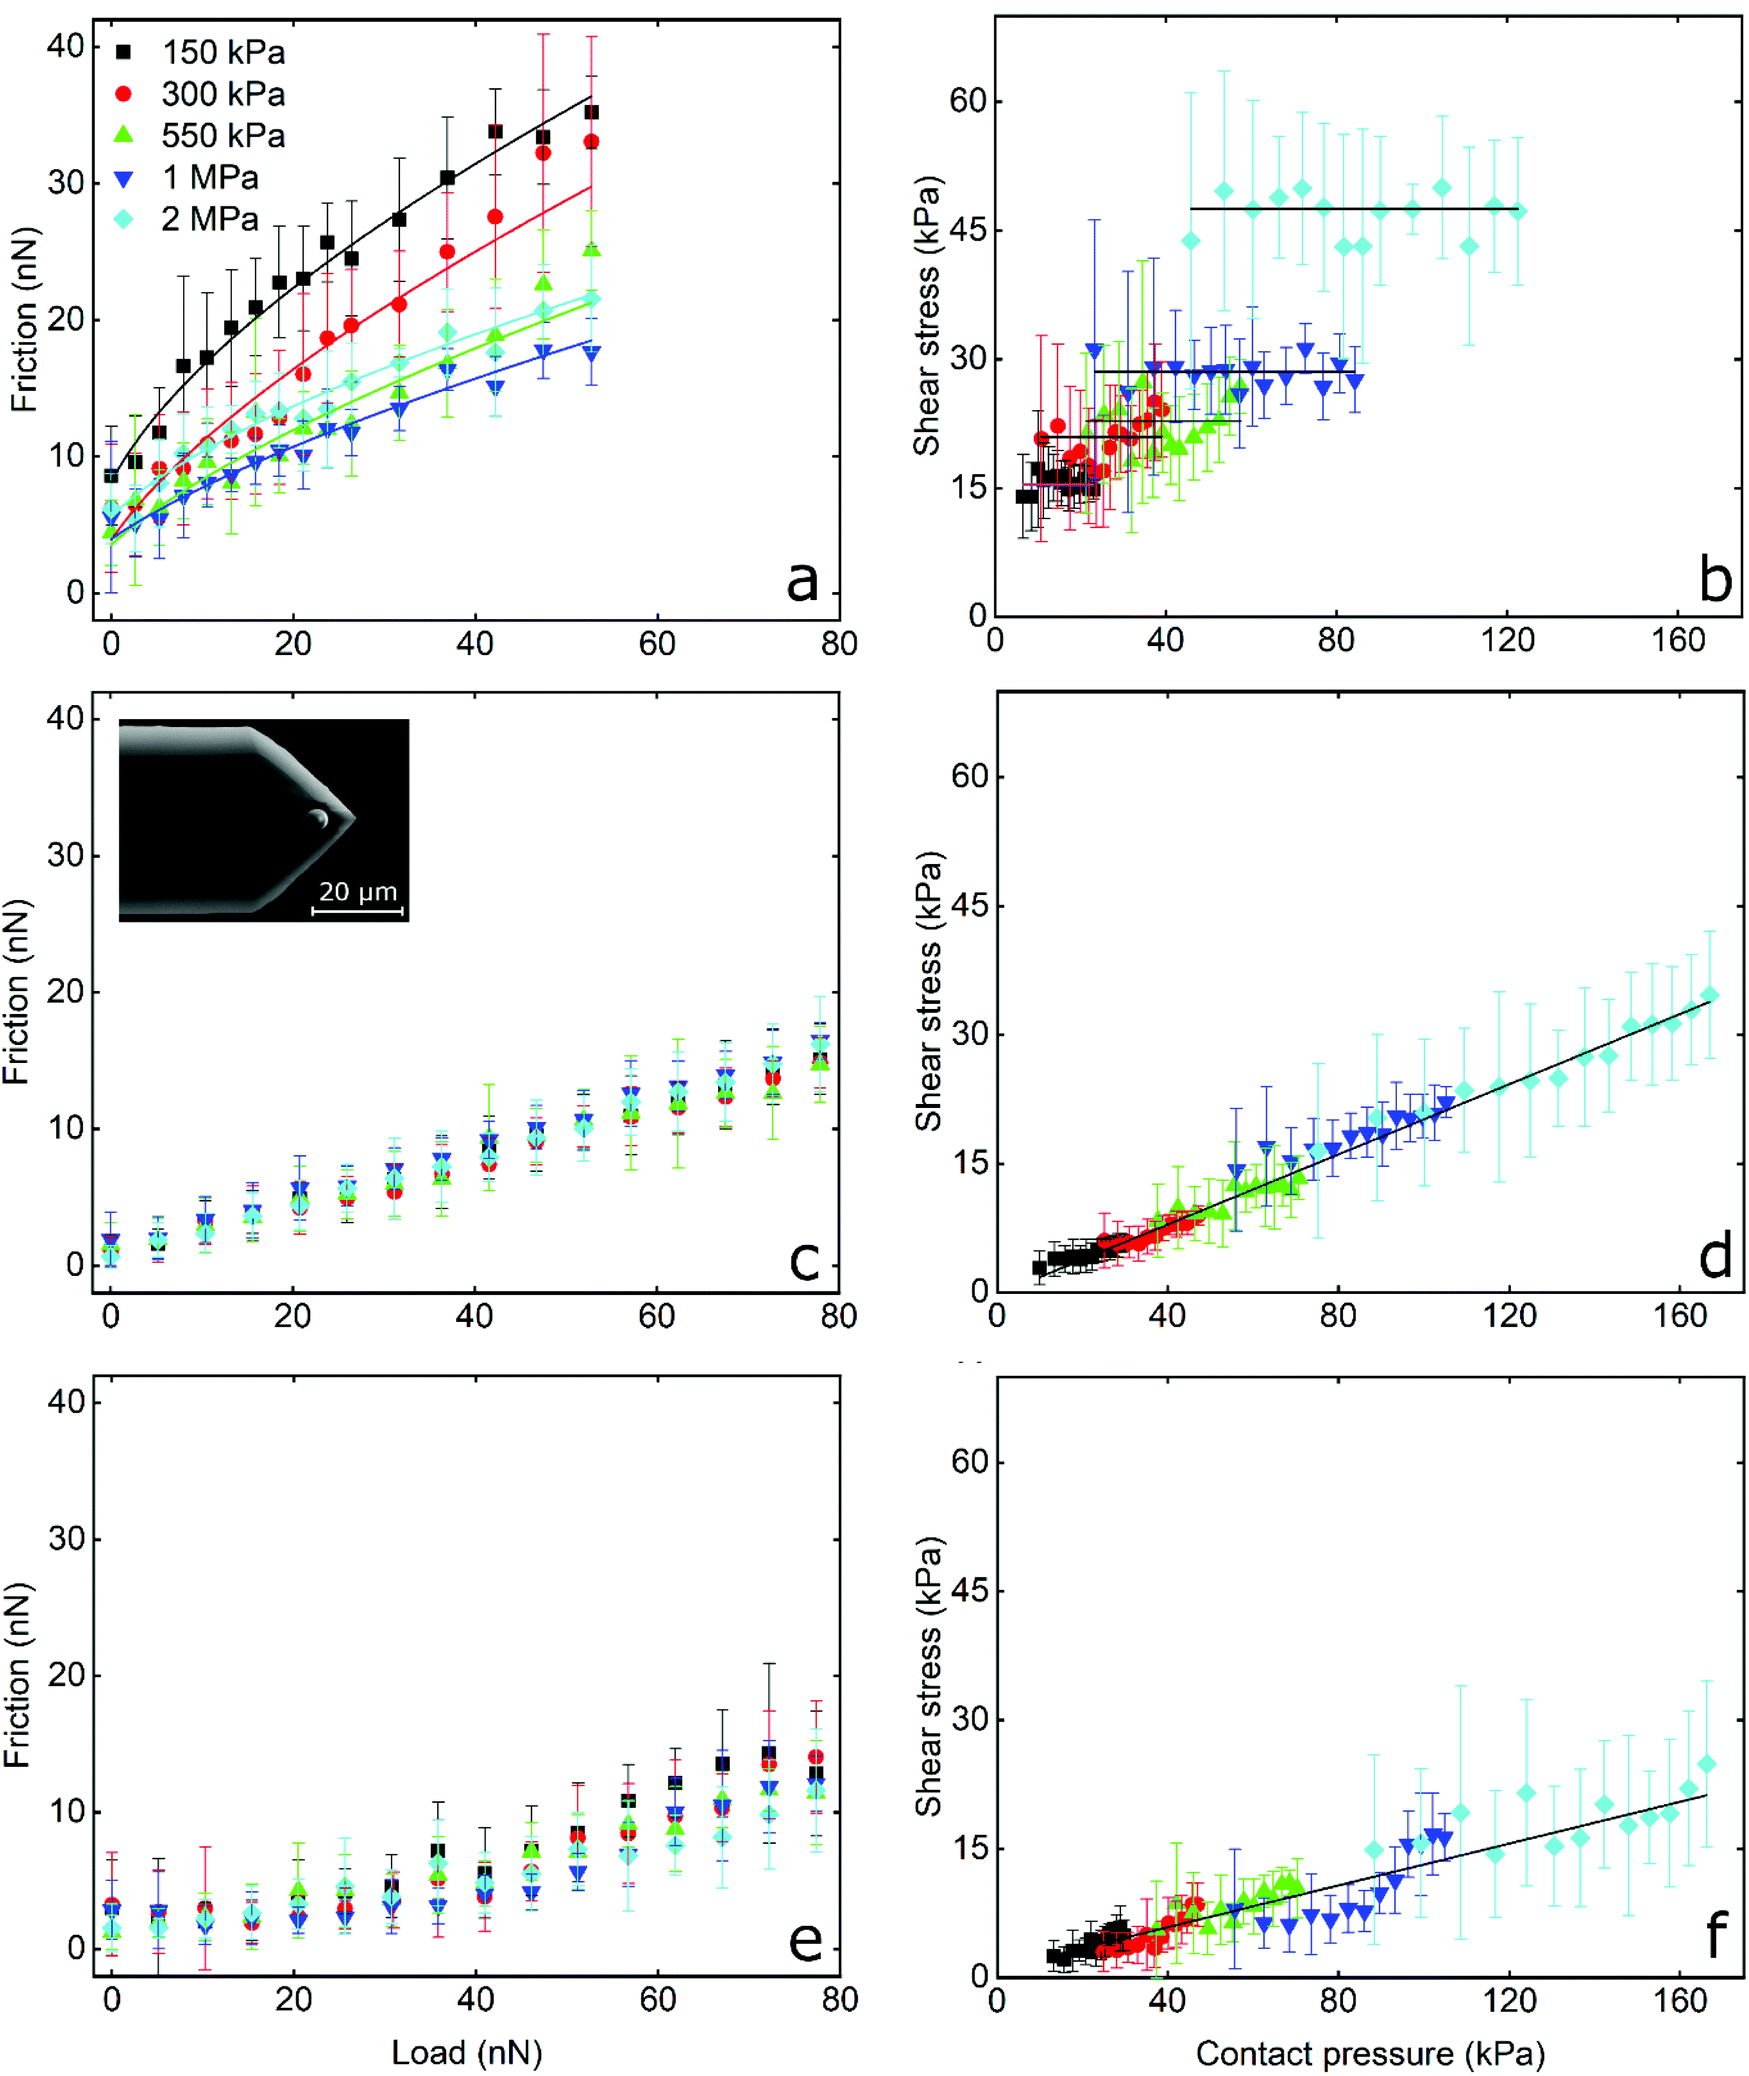 | ||
| Fig. 3 Determination of friction acquired by a hard probe. The measurements were acquired by friction force microscopy, using a hard borosilicate glass (BSG) probe (inset showing the SEM image) sliding over PDMS substrates with different moduli in presence of buffer (a and b), lactoferrin (LF) (c and d), and β-lactoglobulin (β-lg) (e and f) solutions. (a, c and e) The data points (n = 3, mean ± SD) represent friction force as a function of normal load. (b, d and e) The data points (n = 3, mean ± SD) represent interfacial shear strength as a function of mean contact pressure. The colours correspond to the Young's modulus of the PDMS substrates. | ||
| 150 kPa | 300 kPa | 550 kPa | 1 MPa | 2 MPa | |
|---|---|---|---|---|---|
| τπao2 = F0, from fit (nN) | 8.2 | 3.9 | 3.6 | 4.0 | 5.6 |
| L c, from fit (nN) | −2.1a | −2.7a | −3.9a | −5.8a | −2.7a |
| a o, (nm) | 397.9 | 215.8 | 200.3 | 188.3 | 182.2 |
| τ, (kPa) | 16.4b | 26.7b,c | 28.2c | 35.7c | 53.5 |
As seen, the returned “pull-off” values from the fitting do not differ significantly between different samples (p > 0.05) but are significantly lower as compared to the values acquired from F–d curves (Fig. S2b, ESI†). As discussed earlier, the increased values recorded during F–d curves are probably a consequence of the separation speed that was selected to match the sliding speed.
Before continuing with a detailed analysis of friction mechanisms, we must be certain that our assumption of being in the boundary regime is correct, as this soft-contact AFM–FFM experiment is many orders of magnitude away from macro-scale measurements. Firstly, the approach by Esfahanian and Hamrock47 (and more recently by Marx et al.48) was used to determine the full film liquid lubrication regime. This method takes into account the reduced radius (R′), reduced modulus (E′), load (W, in the range 1 nN to 200 nN), mean sliding velocity (u, 0.5–200 μm s−1), lubricant viscosity (water, η = 8.9 × 10⁻⁴ Pa s) and lubricant pressure–viscosity coefficient (water, λ = 0.713 GPa−1 or 7.13 × 10⁻¹⁰ Pa−1) calculated by fitting the Barus equation: ηP = ηoeλP to a plot of viscosity vs. pressure, where ηo is the viscosity under standard conditions. From these are calculated the dimensionless speed (U* = uη/E′R′), load (W* = W/E′R′2) and material (G* = λE′) parameters, and in turn the dimensionless elasticity (ge = W*8/3/U*2) and viscosity (gv = G*W*3/U*2) parameters are plotted. This indicated that the lubricating film thickness is given by Hc = 5.08ge0.67 (a simplified version of Hamrock's expression which neglects the ellipticity parameter because the contacts are spherical), and that if the lubricating film was thick enough then the experiment would fall under soft-elastohydrodynamic lubrication (EHL), also termed Isoviscous Elastic (IE).48 A plot of the film thickness versus load for the various experimental conditions is shown in Fig. S3 (ESI†), showing that under all circumstances during this set of experiments the theoretical film thickness is <0.25 nm, the approximate diameter of a water molecule, and at least an order of magnitude less than the surface roughness. Although roughness under load is uncertain due to deformation (which is much larger than the roughness, see Fig. 5), it is clear that this experiment lies in the boundary lubrication regime.
The interfacial shear stress values extracted from the GTE fitting (eqn (1), see Table 1) range between 16 kPa for the 150 kPa PDMS to 53 kPa for the 2 MPa PDMS sample. In addition, the interfacial shear stress for the BSG probe versus PDMS sample in buffer was also calculated as τ = Ff/A, using the measured friction forces and the contact area calculated with the JKR model (eqn (2), Experimental section), and was plotted as a function of mean contact pressure (Fig. 3). As expected, the shear stress values are similar to the values extracted from the GTE model (Table 1), while they are independent from the contact pressure, which reveals a proportionality of the friction force to contact area.49 In essence, the friction force increases linearly with contact area, which is a characteristic of single asperity contact. Consequently, the sublinear relationship observed in Fig. 3a and the independence of shear stress on contact pressure (Fig. 3b) strongly suggest that the BSG colloidal probe squeezes out the asperities on the PDMS sample and is well described by a single asperity model. Further calculations with the JKR model revealed that PDMS deformation ranges from 5 nm at low normal loads against the 2 MPa surfaces to 200 nm at high loads against the 150 kPa surfaces, confirming that the deformation is enough to crush any nanometre range surface asperities (Fig. 5b) and is larger than the asperities on the surface of the BSG colloidal probe (Fig. S4†) that has a RMS roughness equal to 1.74 nm.
The frictional behaviour of BSG colloidal probe sliding on PDMS surfaces in protein solutions shows different characteristics. In the presence of LF, friction increases linearly with increasing load as shown in Fig. 3c. The friction coefficient (μ), as calculated from the slope of the friction force versus normal load measurements since Ff = μL, is independent of modulus and approximately 0.20 for all surfaces without any significant differences (p > 0.05) between surfaces. A linear dependence of the interfacial shear stress on contact pressure (contact area and contact pressure were calculated using a JKR model, see Experimental section) is also observed in Fig. 3d. There, the shear stress at low contact pressure is approximately 3 kPa and increases linearly to 35 kPa at the maximum contact pressure of approximately 160 kPa, while shear stress increases with elastic modulus due to the decreasing deformation and resultant smaller contact area between the BSG colloidal probe and PDMS surface. This linear dependence of interfacial shear stress on contact pressure is due to the proportionality of friction force on normal load as seen in Fig. 3c.49,50 In other words, since friction depends linearly on normal load, shear stress will also depend linearly on contact pressure. It can also be seen that adsorption of LF on PDMS surfaces screens interactions with the BSG probe and reduces adhesion to approximately 0.35 nN as compared to 35 nN observed on bare PDMS surfaces (Fig. S2b, ESI†).
A slightly different behaviour is observed in the presence of β-lg. In Fig. 3e it can be seen that initially friction is increasing slowly with the load, revealing a friction coefficient of approximately 0.05 for all surfaces without significant differences (p > 0.05). However, for loads higher than around 30 nN, the friction as a function of load is increasing at a higher rate, showing a friction coefficient of approximately 0.20 for all surfaces (p > 0.05). The interfacial shear stress in Fig. 3f ranges from approximately 3 kPa for softer surfaces to 21 kPa on stiffer PDMS surfaces, a significantly lower shear stress for a given contact pressure than LF. Similar to LF, adsorption of β-lg on PDMS screens the interaction with the BSG probe and reduces adhesion to 0.35 nN, thus showing no significant differences with LF (p > 0.05). This behaviour of β-lg coated PDMS, showing different friction coefficients at low and high loads, can be attributed to the adsorption properties of the protein film, which is discussed later with experiments using quartz crystal microbalance with dissipation (QCM-D), AFM imaging and self-consistent field theory (SCF) calculations.
In summary, friction between the BSG colloidal probe and bare PDMS surfaces exhibit high adhesion and friction proportional to contact area that is indicative of single asperity contact. Soft nanoscale asperities on the PDMS surface have been flattened. In contrast, protein-coated surfaces lower the adhesion and friction (with β-lg having better lubricating properties than LF), and exhibiting a linear relationship between friction and load suggestive of multi-asperity contact, the same as macroscopic models (Amonton's law).
Frictional force at nanoscale for soft–soft (PDMS–PDMS) contact
Having established the frictional properties between a hard BSG colloidal probe and PDMS samples with varying moduli, the next step was to design a soft PDMS colloidal probe (inset Fig. 4c). The Young's modulus of the probe was chosen to remain fixed at 2 MPa and we only varied the modulus of the PDMS sample as discussed previously. Initially, F–d curves (Fig. S1a, ESI†) were obtained between PDMS probe and PDMS samples in presence of buffer to determine the adhesive interactions. However, the adhesion between hydrophobic PDMS probe and PDMS samples was in the order of several hundreds of nN, and although stiffer cantilevers were used for PDMS colloidal probe (k = 0.9 N m−1), the adhesive forces were still too large to measure since they were saturating the photodetector. Consequently, performing friction measurements in the absence of protein films was not feasible. Even if stiffer cantilevers were used, the adhesive forces would still cause very large deformations on the PDMS probes and, thus, would damage the surfaces. Also, other factors, such as ploughing, could not be discounted in such scenarios.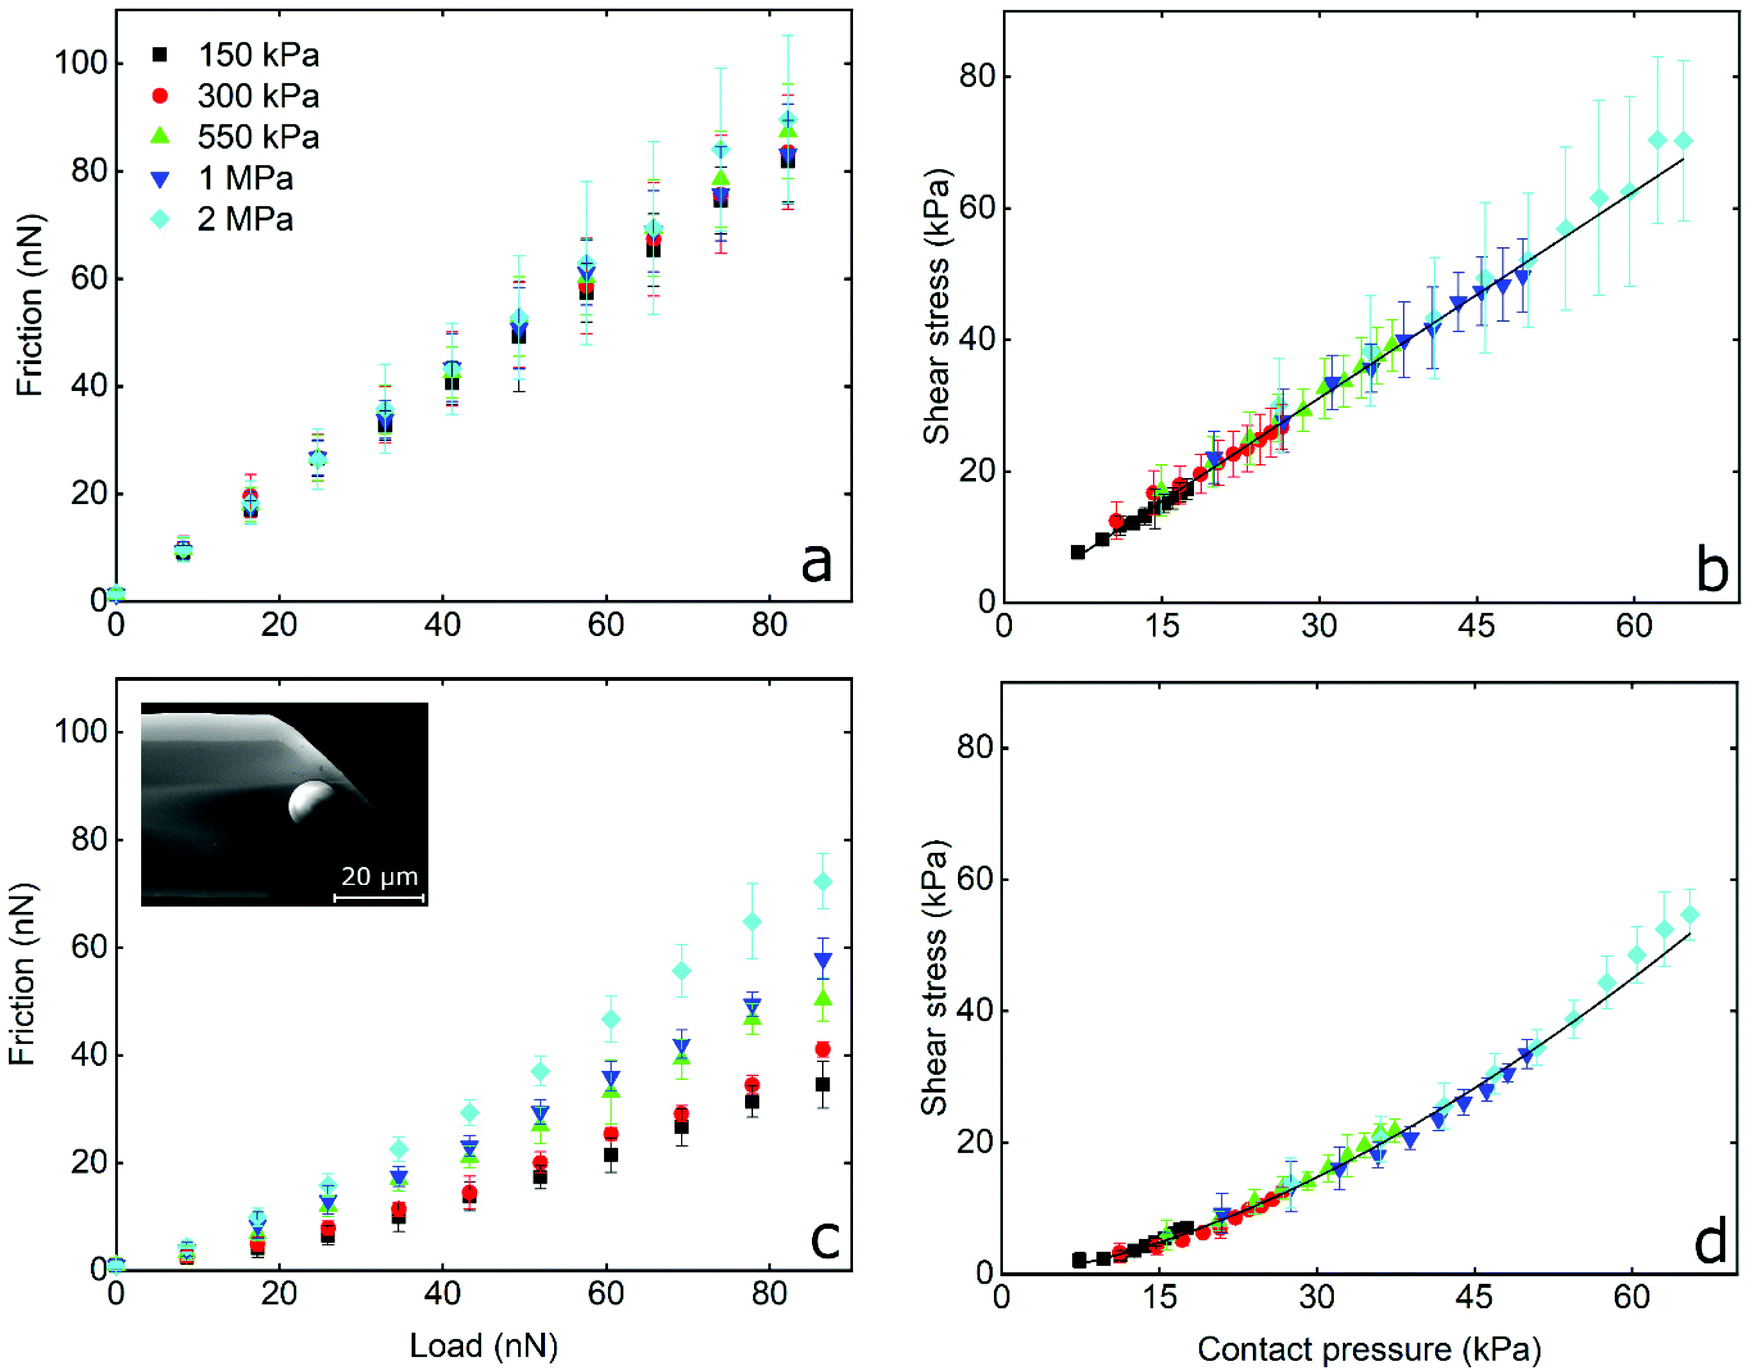 | ||
| Fig. 4 Determination of friction acquired by a soft probe. The measurements were acquired by friction force microscopy, using a PDMS colloidal probe (inset showing the SEM image) sliding over PDMS substrates with different modulus in presence of lactoferrin (LF) (a and b) and β-lactoglobulin (β-lg) (c and d) solutions. (a and c) The data points (n = 3, mean ± SD) represent friction as a function of normal load. (b and d) The data points (n = 3, mean ± SD) represent interfacial shear strength as a function of mean contact pressure. The colours correspond to the Young's modulus of the PDMS substrates. | ||
It is also worth noting that hydrophilization of the PDMS surfaces with UV/ozone was attempted in order to reduce adhesion.51–53 This method creates a thin silicon-oxide rich film on top of PDMS that renders it hydrophilic.54,55 While macroscale techniques are insensitive to the changes in its mechanical properties,45 at the nanoscale, addition of this hard surface film significantly increased elastic modulus, and the modulus also varied with a greater sensitivity to indentation depth, overshadowing the difference in modulus of the underlying PDMS substrates (150 kPa to 2 MPa) as seen in Fig. S5 (ESI†).
Therefore, the PDMS surfaces were coated with LF or β-lg that resulted in the adhesive forces to be decreased dramatically to approximately 0.35 and 0.15 nN, respectively. These are similar to the values recorded for the BSG probe (Fig. S2b, ESI†). This is reasonable considering that both colloidal probes and PDMS samples are coated with proteins and the adhesive forces are determined by the nature of the interacting surfaces, i.e. between the adsorbed proteins.
The frictional forces as a function of applied load, and the interfacial shear stress as a function of contact pressure, for PDMS colloidal probe sliding on PDMS samples in the presence of LF and β-lg solutions are shown in Fig. 4a, b and c, d, respectively. In LF, friction increases linearly with increasing load, while the friction coefficient (calculated from the slope) is independent from the Young's modulus of the PDMS sample and has a value of approximately 1 for all surfaces without significant differences between samples (p > 0.05). This is five times higher as compared to the friction coefficient observed on the hard BSG probe (Fig. 3c). It can also be seen in Fig. 4b that interfacial shear stress increases linearly with increasing contact pressure, and ranges from approximately 10 kPa for the softer surfaces (150 kPa) to around 80 kPa for the stiffer PDMS ones (2 MPa). Similar behaviour was observed with the BSG probe (Fig. 3d) and is correlated to the linear dependence of friction on the load as explained earlier.
On the other hand, friction on β-lg coated PDMS–PDMS contact reveals a different behaviour to that of LF. As seen in Fig. 4c, friction force in presence of β-lg is lower than LF, and does not increase linearly with load, appearing to follow an exponential increase. A similar behaviour is observed in Fig. 4d where the interfacial shear stress follows a similar exponential rise upon increasing of contact pressure. At the lowest contact pressure, the shear stress on β-lg is approximately three times smaller than on LF. As contact pressure increases, the shear stress rises more quickly until the rate of increase matches that of LF. Furthermore, the elastic modulus has a clear impact on the observed friction forces as they increase with increasing elastic modulus. This can be better visualised in Fig. S6 (ESI†) where the friction coefficient (calculated by the tangent of the curve in Fig. 4c at every point) is plotted as a function of contact pressure. As can be seen, the friction coefficient starts from approximately 0.2 at low contact pressures and increases to approximately 1.0 at higher values. More importantly, there is a clear dependency of friction coefficient on elastic modulus, with the higher moduli exhibiting higher friction coefficient.
To sum up, not only do LF and β-lg have different lubricating properties, but they were also affected both by the hydrophilicity and stiffness of the colloidal probe, as well as the elastic modulus of the underlying substrate. In the presence of LF, for both BSG and PDMS colloidal probes, the friction increased linearly with load and is not affected by the Young's modulus of the PDMS sample (Fig. 3c, d and 4a, b). There is also a linear dependency of shear stress on contact pressure. For a BSG probe in the presence of β-lg, a reduced friction coefficient is observed at low loads. This gradually increases at higher loads, while the friction is not affected by the elastic modulus of the PDMS sample. In contrast, in the case of the PDMS colloidal probe with β-lg, there is a clear dependency of friction on the Young's modulus, where a higher modulus results in a higher friction force that increases exponentially with the load. Consequently, the friction coefficient increases with a larger contact pressure; at low contact pressure μ is similar to the values observed at BSG colloidal probe in both proteins, while at higher pressure μ is 5 times higher and similar to the value observed for the PDMS colloidal probe in the case of the LF system. Furthermore, the shear stress increases exponentially with increasing contact pressure for β-lg, as opposed to the linear increase observed for LF.
Comparing hard–soft versus soft–soft contact
To understand the differences between hard BSG and soft PDMS probes, it is useful to examine their interfacial contact area, the pressure distribution, and the deformation induced, as presented in Fig. 5. The calculations were performed using the JKR model (see Experimental section) using the load, adhesion, probe radius, and elastic modulus of the probe/sample system in LF solution replicating the experimental conditions in this study.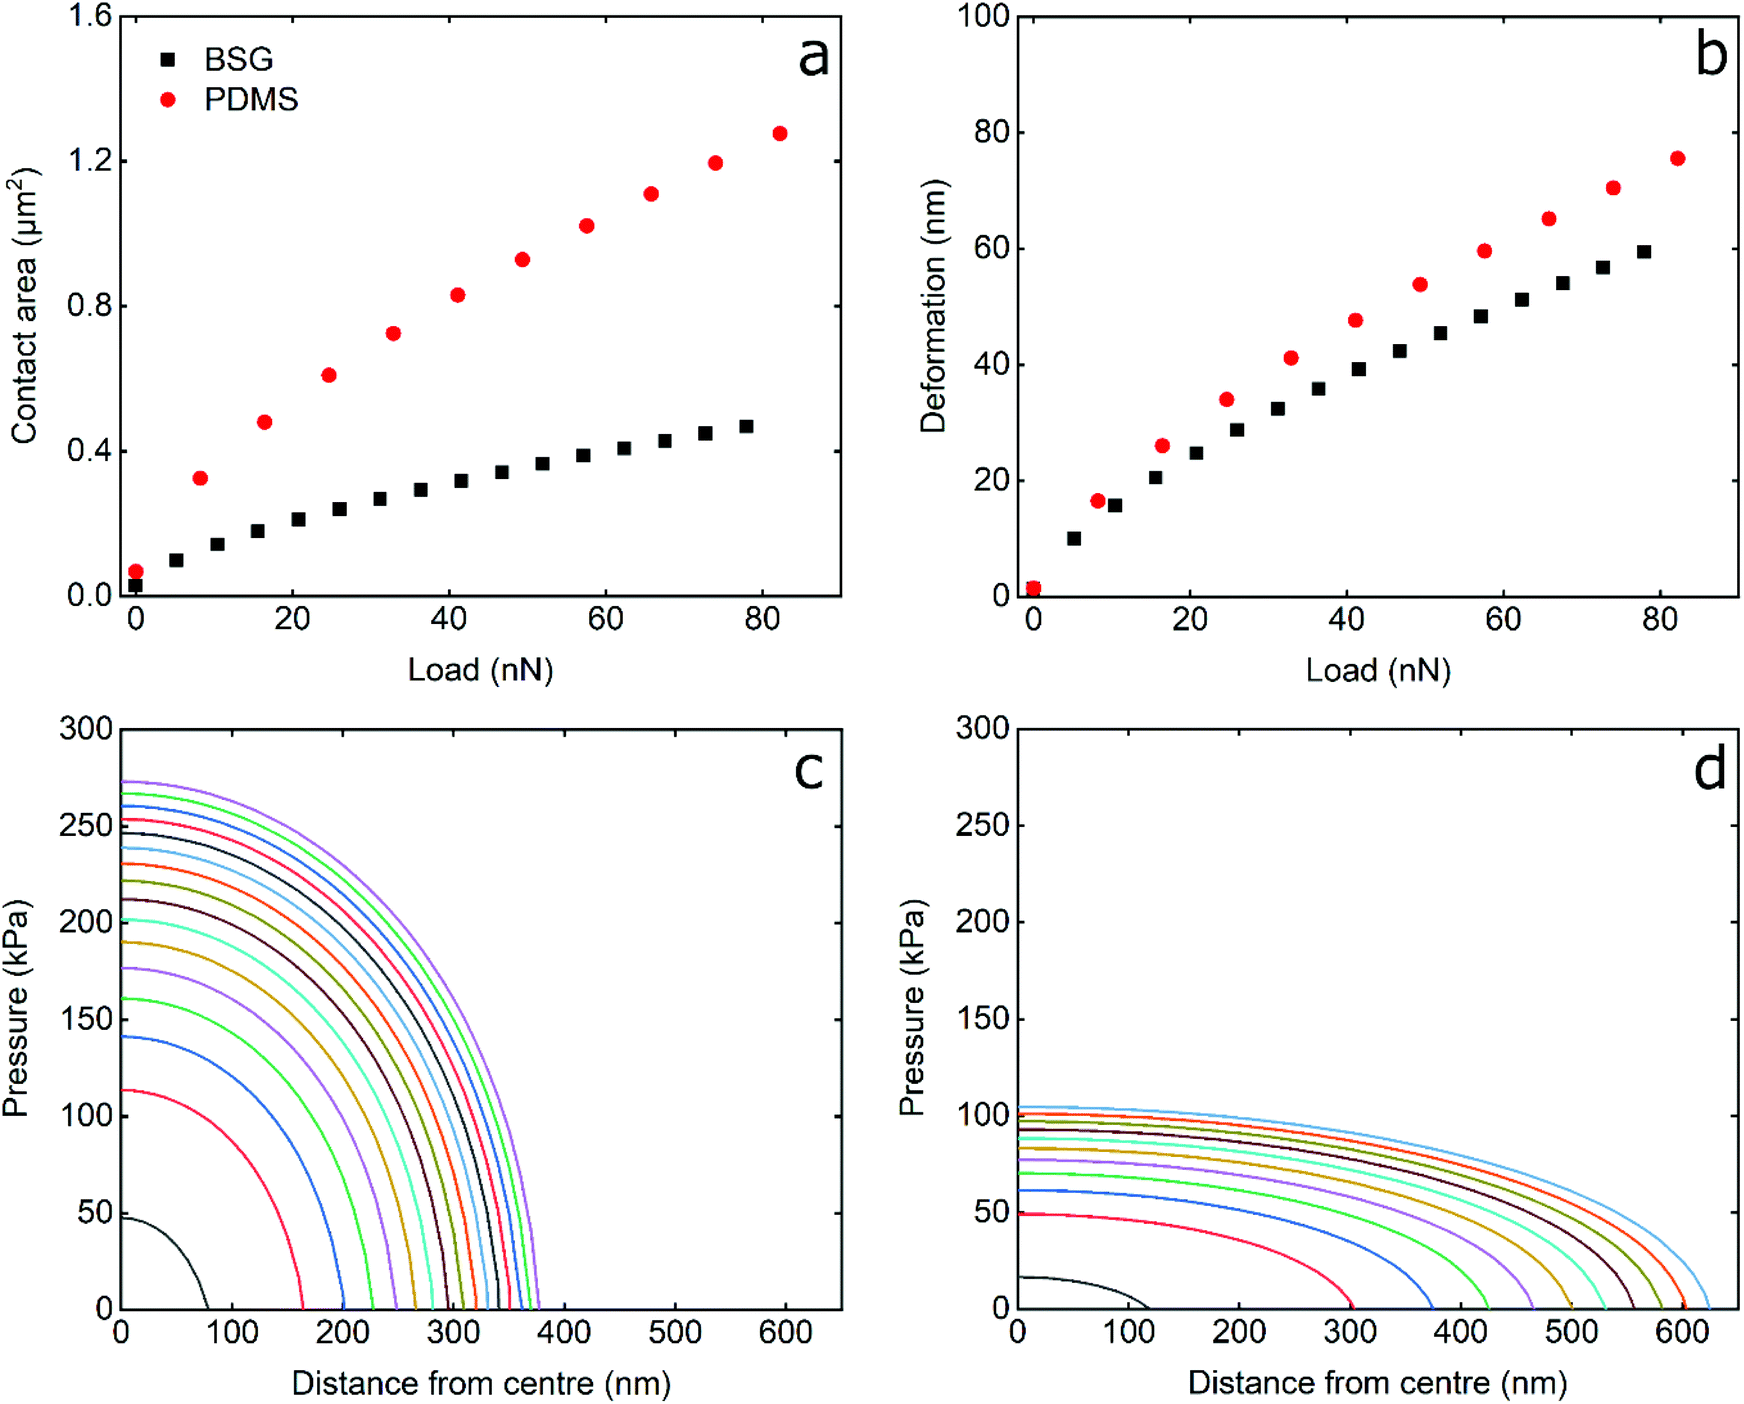 | ||
| Fig. 5 Contact area, deformation, and pressure distribution in hard–soft versus soft–soft contacts. (a) The data points represent the dependence of contact area on normal load. (b) The data points represent the dependence of deformation on normal load. (c) The data lines represent the pressure distribution as applied by a borosilicate (BSG) probe on a PDMS surface. The normal load is ranging from 0 nN (black line) to 80 nN (purple line) with 5 nN increments. (d) The data lines represent the pressure distribution as applied by a PDMS probe on a PDMS surface. The normal load is ranging from 0 nN (black line) to 80 nN (blue line) with 8 nN increments. All calculations were performed using the JKR model, using the data acquired for the indentation of the BSG (radius ≈ 2.5 μm) and PDMS (radius ≈ 5 μm) probes against lactoferrin (LF)-coated PDMS surfaces with elastic modulus of 2 MPa. | ||
As seen in Fig. 5a and b, the contact area and deformation increase with load as L2/3 a consequence of the JKR model. The contact area between the BSG probe and PDMS surface is smaller than that of the PDMS probe, as a result of the different elastic modulus; the hard BSG probe does not deform and, thus, results in decreased contact area. Similarly, the deformation induced on the PDMS sample by the BSG probe is smaller than that of PDMS, although the presented deformation corresponds to the combined deformation (PDMS probe and sample) as opposed to that of BSG probe that corresponds to the deformation of the PDMS sample only. The differences in contact area and deformation are not only a result of the modulus, but are partially attributed to the contact radius of the probes (2.5 μm and 5 μm for the BSG and PDMS probes, respectively). For a more direct comparison of the effect of hard–soft vs. soft–soft contact, additional calculations with identical probe radius and adhesion of BSG and PDMS probes are presented in Fig. S7, ESI.†
Comparison of Fig. 6 and S6,† indicate that the larger radius of the PDMS probe results in increased contact area and reduced deformation. However, the contact area and deformation induced by the BSG probe are still smaller than that of PDMS probe even for same size probes. However, as stated above, the deformation value is the combined deformation of both probe and surface. This explains the counter-intuitive result that the deformation is lower with the hard BSG probe, where one might suppose it would penetrate more deeply for a given load. If the soft–soft deformation is approximately halved (as both probe and surface have the same modulus) to account for just surface deformation, then the BSG probe does indeed deform the surface to a greater degree.
 | ||
| Fig. 6 Characterisation of the absorbed protein films. Topographic images of PDMS surfaces with Young's modulus of 2 MPa in buffer (a and b), lactoferrin (LF) (c and d), and β-lactoglobulin (β-lg) (e and f) solutions. The images were acquired by AFM in two different magnifications, while the scale bars indicate the height of the features. Adsorption of hydrated layers of β-lg and LF on PDMS surfaces was acquired by quartz crystal microbalance with dissipation (QCM-D). (g) The curves (n = 3, mean ± SD) represent the shift of the protein film thickness as a function of time. (h) The curves (n = 3, mean ± SD) represent the dissipation shift (ΔD) over frequency shift (Δf) as a function of time, which is an indication of the viscoelastic properties of the adsorbed protein film. Protein solution is injected at time point P, and at B the surface is washed with a fresh buffer solution. | ||
The pressure distribution induced by the BSG and PDMS probes is presented in Fig. 5c and d. It can be seen that PDMS probe occupies a larger area than BSG probe, as was also discussed earlier in Fig. 5a. Furthermore, the BSG probe exhibits an increased maximum pressure at the centre of contact, almost threefold higher than that of the PDMS probe. Additionally, the pressure is distributed more evenly from the PDMS probe due to its deformability. As explained above, the differences in pressure distribution are partially due to the different radius of the probes used. To compensate for this, theoretical calculations with same size BSG and PDMS probe are shown in Fig. S7, ESI.† It can be seen that a 50% reduction in the radius of PDMS probe almost doubles its maximum contact pressure, although the decrease in contact radius is much smaller. Still, the maximum contact pressure induced by BSG probe is almost double than that of a same size PDMS probe, as a result of deformability, with the contact pressure distributing more evenly in the latter. Considering the above, it can be expected that, assuming similar loads and similar surface chemistry, softer probes will result both in reduced disturbance to the adsorbed protein layer, as well as decreased damage to the PDMS sample.
Role of protein film in the frictional dissipation
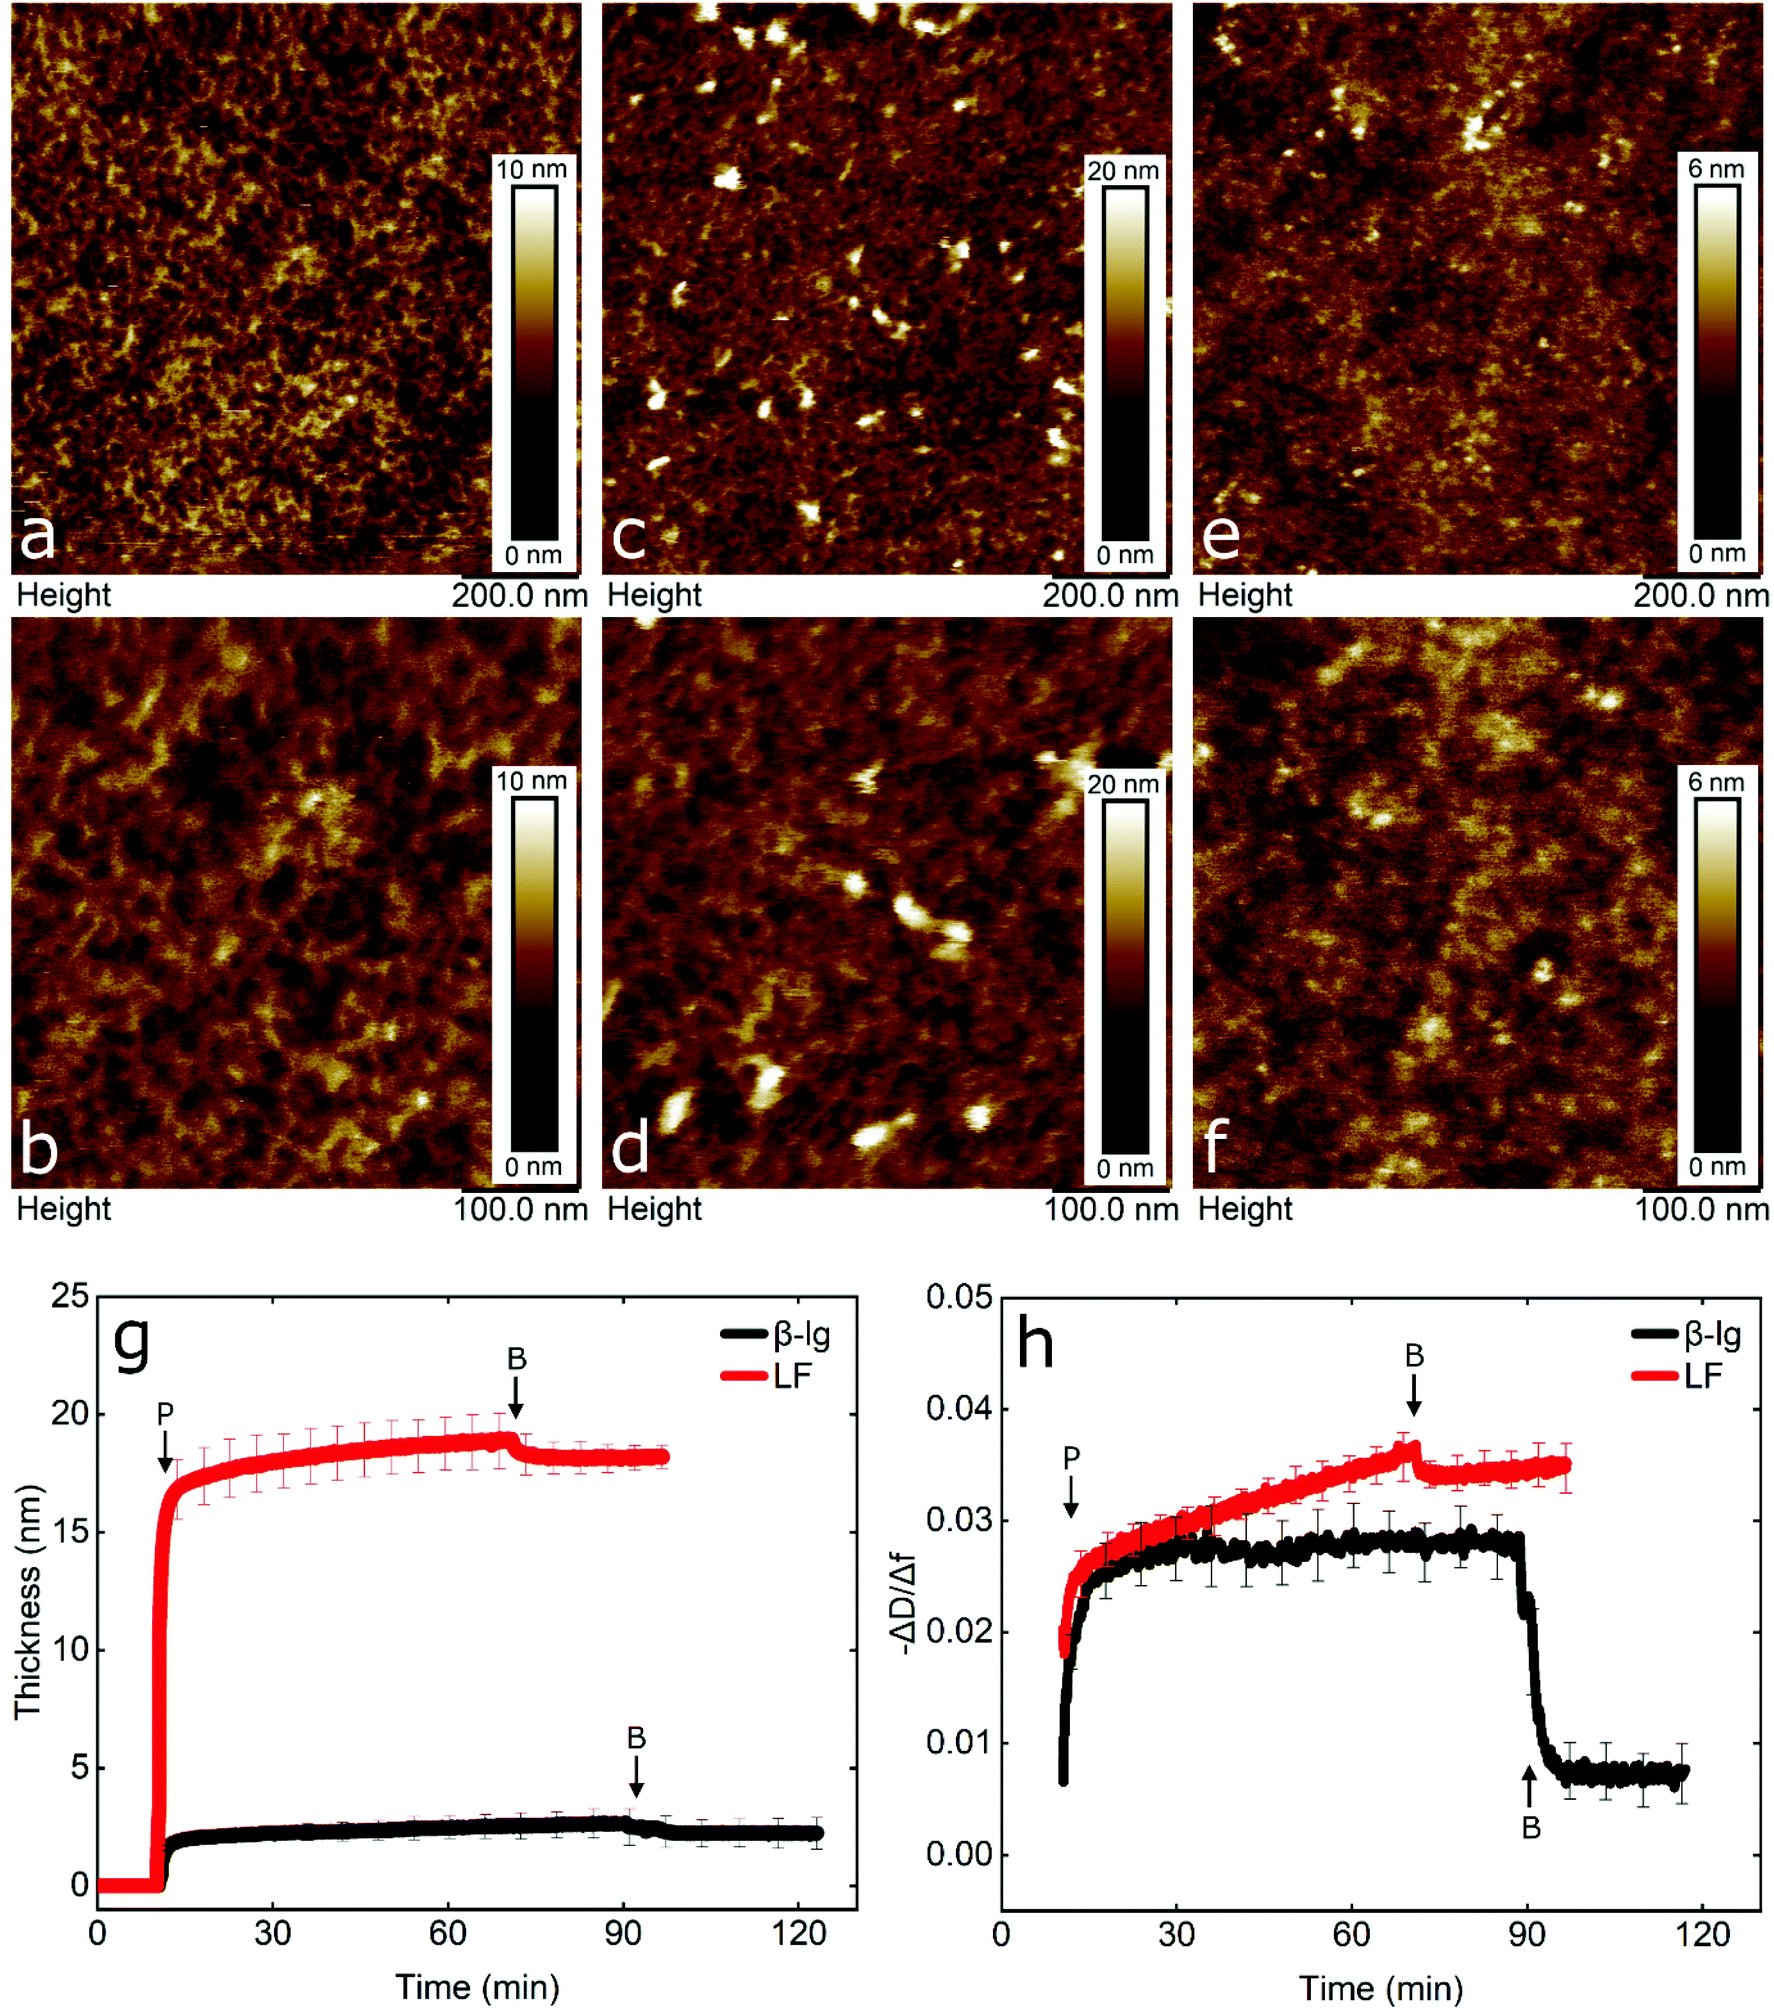
To gain an insight into the nanotribological mechanism and the different results obtained between LF and β-lg, the protein films adsorbed at the PDMS surface were visualized by AFM and the real-time adsorption behaviour was monitored using quartz crystal microbalance with dissipation (QCM-D). In addition, self-consistent field (SCF) theory was also used to predict differences in segment density profiles between LF and β-lg interfacial films adsorbing onto the hydrophobic surfaces, such as on PDMS. Topographic images of PDMS surfaces in buffer, LF, and β-lg are shown in Fig. 6a, b, c, d, and e, f, respectively. Comparison of LF-coated PDMS with bare PDMS samples reveals that LF forms large islands of aggregated protein that have a mean height and a mean diameter of approximately 7 nm and 22 nm, respectively (Fig. S8, ESI†). The rest of the surface appears minimally covered with LF as it shows similar features as the bare PDMS surface. Lactoferrin has a tendency to aggregate that is driven by its molecular structure and charge distribution on its surface, since it resembles a dipole, with a negative patch on one side and a positive on the other end.56 Furthermore, its surface is highly hydrophilic with very few hydrophobic residues exposed on its surface (Fig. S9, ESI†). Considering the above, protein–protein interaction is larger than protein–surface and as such lactoferrin prefers to form aggregates than adsorbing on the surface, as was shown with the AFM images.In contrast, small globular structures with mean dimensions equal to 11.2 ± 2.2 nm wide and 1.8 ± 0.2 nm tall are present on the β-lg-coated PDMS samples, which appear to uniformly coat the PDMS surface as the nano-porous network characteristics of the underlying PDMS surface are no longer visible. The size of the globular structures is in agreement with the dimensions of β-lg on hydrophobic (methyl-terminated) SAMs surfaces.57 In contrast to LF, the surface charge of β-lg is more evenly distributed on its surface, although there is still a small negative patch.73 However, looking at the hydrophobicity, β-lg has a large hydrophobic patch on one side that could lead to strong adsorption on the PDMS surface (Fig. S10, ESI†). As such, it appears that protein–surface interaction is favoured over protein–protein ones that leads β-lg to evenly coat the PDMS surface than forming aggregates as was the case with LF. Analysis of the surfaces revealed RMS roughness for bare PDMS, β-lg, and LF-coated surfaces were equal to 0.88, 0.63, and 1.38 nm, respectively. However, this value for LF does not consider the large aggregates, since a threshold height was set in order to exclude them. As seen, the roughness has increased on the LF-coated surface compared to bare PDMS one, while it has decreased in the case of β-lg-coated surfaces. Further analysis regarding the Rz value, which is the average height difference between the peaks and valleys, reveals values equal to 1.15, 1.05, and 1.54 nm for bare PDMS, β-lg, and LF-coated surfaces, respectively. Considering the above, it appears that LF forms a discontinuous film of protein islands on the PDMS surfaces. In contrast, β-lg forms a continuous film on the PDMS surface that evens out the morphological features of the underlying PDMS substrate.
In order to obtain more information about the mass and viscoelastic nature of the adsorbed protein films, QCM-D was used to measure the real-time frequency and dissipation shifts of PDMS-coated quartz sensors. (Fig. S11, ESI†). The data were fitted with the viscoelastic Voigt model to acquire the thickness of the adsorbed protein film.58 As seen in Fig. 6g, β-lg forms a film with thickness of approximately 3 nm on the PDMS surface, while lactoferrin forms a much thicker film of approximately 18 nm.
Furthermore, the adsorption rate until the adsorbed protein mass reaches half of its final value was 1.37 mg m−2 min−1 for β-lg and 22.57 mg m−2 min−1 for LF, revealing a much faster adsorption rate for LF. In order to compare the viscoelastic properties of the adsorbed films, the dissipation shift over the frequency shift (−ΔD/Δf) was calculated. A lower value is associated with a more rigid adsorbed film and a higher value with a more viscous or weakly absorbed film which dissipates the oscillatory energy more efficiently.21 As seen in Fig. 6h, following rinsing with buffer, β-lg forms a more rigid film as compared to a highly viscous LF film.
Comparison of QCM-D and AFM reveals that although LF-coated PDMS samples are not uniformly coated, a large number of protein molecules and aggregates that are very hydrated are adsorbed on the surface (as shown in Fig. 6c and d), which explains the high frequency shift observed (Fig. S11, ESI†). On the other hand, β-lg forms a uniform rigid layer on the surface that is quite thin and compact (as shown in Fig. 6e and f). Calculations using self-consistent field (SCF) theory showed that LF and β-lg have different affinity towards hydrophobic surfaces, such as the PDMS in this case. As seen in Fig. S12 (ESI†), a large fraction of the LF molecules in the adsorbed layer are still present 6 nm above the PDMS surface. Such an extended adsorbed film agrees well with the deep and highly viscous LF layer observed in QCM-D results. In contrast, β-lg molecules show a higher affinity towards the hydrophobic surface and prefer to lie much flatter at such interfaces, closer to the surface (see Fig. S12, ESI†). This gives rise to a denser but thinner surface layer as compared to LF, and therefore a more rigid, less viscoelastic layer. This is exactly as is found in QCM-D and AFM measurements here. Considering the above, it is worth noting that due to the different amounts of hydrated mass between the proteins in the surface layer, QCM-D overestimates the amount of adsorbed LF on the PDMS surfaces, which is a behaviour that has also been reported previously.59,60
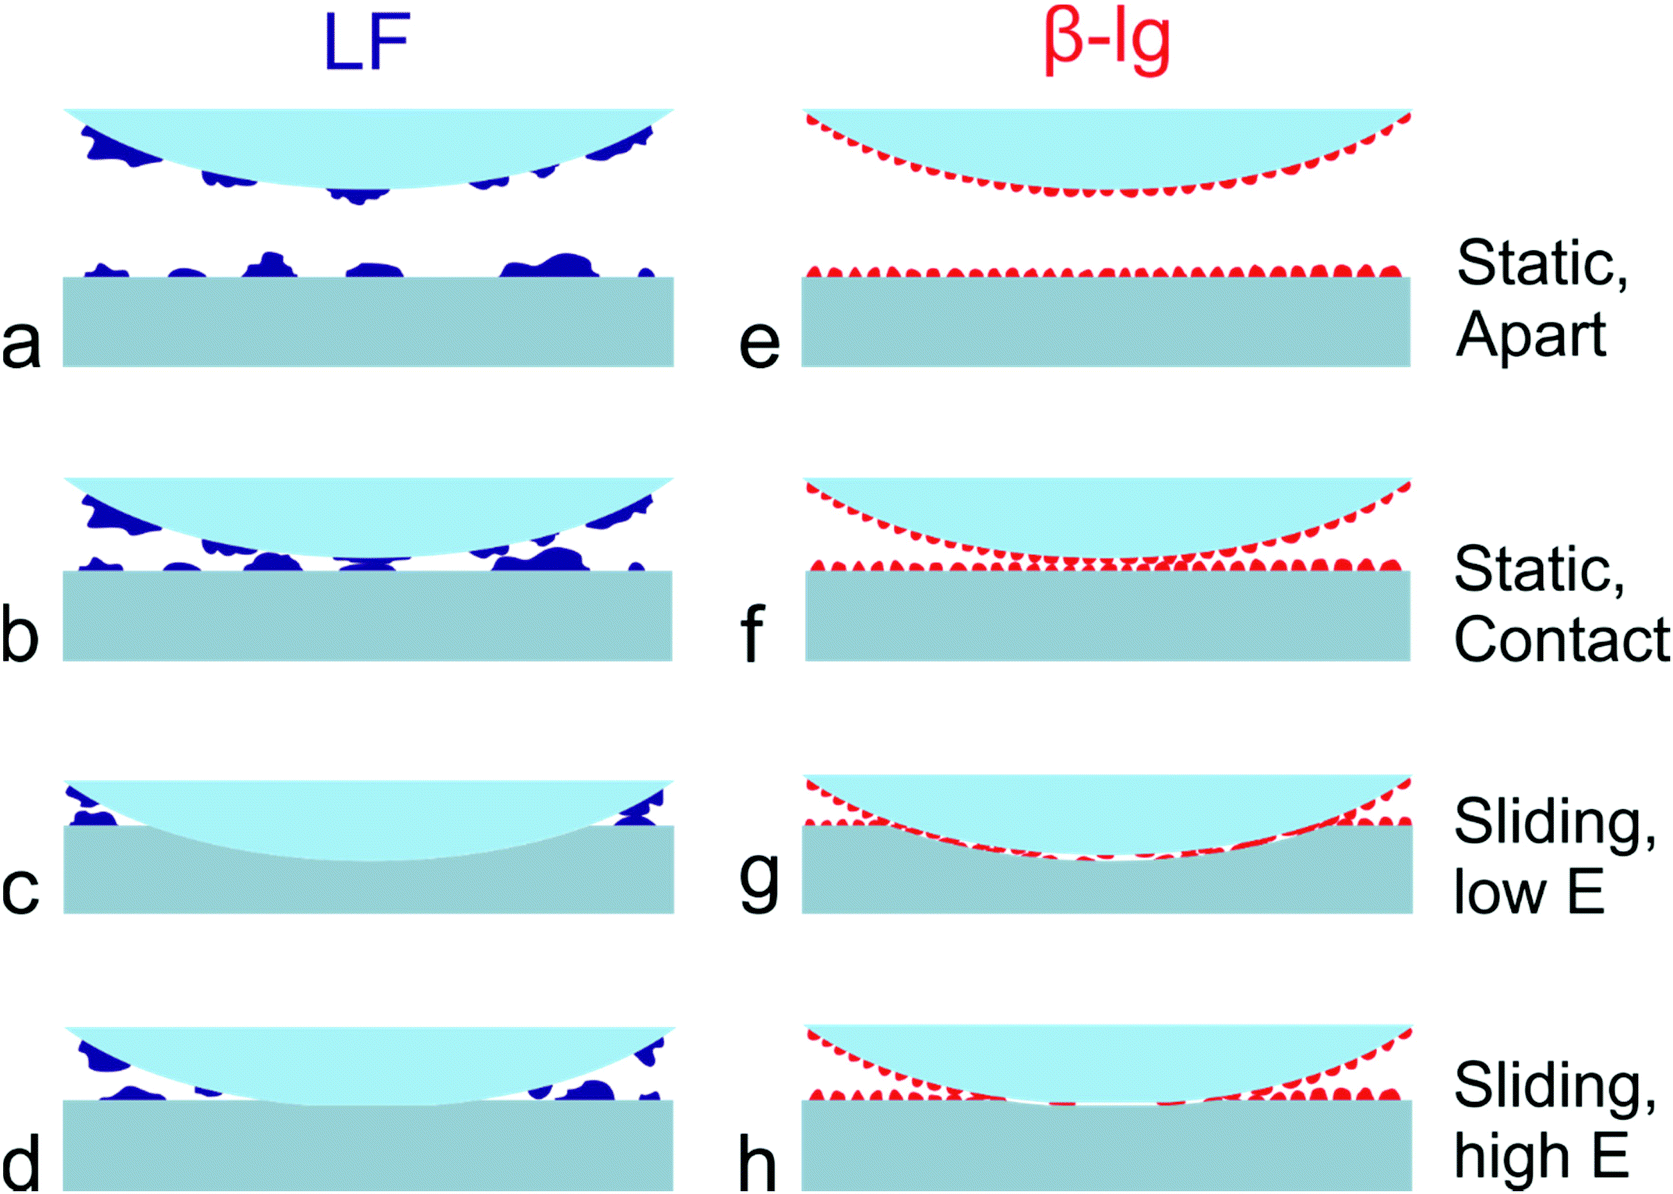 | ||
| Fig. 7 Schematic representation of the adsorbed lactoferrin (LF) and β-lactoglobulin (β-lg) layers. The figure illustrates LF (a–d, blue colour) and β-lg (e–h, red colour) adsorbed onto PDMS colloidal probe and substrate when they are apart (a and e), in contact before sliding (b and f), during sliding on soft substrate (c and g), and during sliding on the stiff substrate (d and h). During adsorption onto PDMS substrate, LF forms large aggregates due to favourable intermolecular interactions (LF–LF) as opposed to LF-PDMS, resulting in exposed PDMS regions (a). In contrast, β-lg favours adsorption onto PDMS and forms a uniform thin layer (e). When the PDMS colloidal probe and the substrate come in contact, as in cases of force–distance curves, both proteins can effectively screen PDMS–PDMS interaction (b and f) and reveal low adhesion. However, during sliding, LF is easily removed from the interface resulting in PDMS-PDMS interaction and increased friction, both on soft (c) and stiff (d) surfaces. Consequently, friction is independent of Young's (E) modulus. In contrast, β-lg remains at the interface during sliding resulting in decreased friction and requires higher contact pressures for their removal. On soft surfaces (g), due to the deformability of the surface, β-lg can remain at the interface for higher loads as compared to stiffer surfaces (h) where the normal load is distributed over a smaller contact area resulting in higher contact pressure that facilitates removal of protein from the interface. | ||
A schematic representation of a proposed mechanism of lubrication is given in Fig. 7. As shown, LF forms a non-uniform layer on PDMS surfaces that contains large protein aggregates and areas of non-coated PDMS substrate (Fig. 7a). As a result, considering that the PDMS colloidal probe is coated with a similar layer of protein, the adsorbed LF film can effectively screen the adhesive interactions between colloidal probe and sample (Fig. 7b). The relatively large protein islands act as nano-asperities, leading to the multi-asperity contact behaviour, as normally observed at the macroscale according to Amonton's law, where the asperities deform and bring more direct contact to the protein, and due to deformation greater numbers of protein asperities are brought into contact. However, once sliding starts, adsorbed LF can be easily removed from the interface due to its lower affinity towards PDMS and its less compact isolated mound morphology. It thus progressively exhibits higher friction with load, and higher friction overall as compared to β-lg (Fig. 7c and d). In contrast, β-lg forms a uniform thin and smooth layer on PDMS surfaces that also effectively screens the adhesive interactions between PDMS surfaces (Fig. 7e and f). Furthermore, in this case the protein film is strongly adsorbed on the PDMS surfaces and therefore remains at the interface at higher loads than LF (Fig. 7g and h). The flatter response of friction to load at lower loads is likely attributed to the reduced roughness of the smoother β-lg film. However, as the load increases, the frictional forces developed at the interface eventually result in the removal of the adsorbed β-lg film, which in turn begins to expose the underlying PDMS surface and increases the friction coefficient (Fig. 4c). Substrates with lower Young's modulus can withstand higher normal loads before the removal of β-lg, since the normal load is distributed over a larger area resulting in lower contact pressure (Fig. 7g and h). It can be concluded that the dependence of friction on Young's modulus (friction increases with increased modulus) is a consequence of both the physical properties and morphology of the protein film, which in turn result from its chemical nature and affinity for the surface, and removal of the protein from the interface.
3. Conclusion
In this study, we utilised friction force microscopy to study the impact of elastic modulus on the frictional properties of soft surfaces coated with protein films at the nanoscale. Initially, we built model silicone-based elastomer surfaces with tuneable elasticity (ranging from 150 kPa to 2 MPa) that can be used as model systems in the nanoscale to replicate biointerfaces such as those found in the oral cavity or the synovial joints. The PDMS surfaces exhibited an intricate polymer network with similar surface roughness and hydrophilicity irrespective of differences in elasticity. Characterisation with AFM using colloidal probe revealed different elastic modulus on the first few nm of the surfaces that is associated with surface phenomena. This highlighted the importance of reaching a certain indentation limit that is dependent on the elastic modulus of the surface in order to acquire values in agreement with those obtained using macroscale-based techniques.Friction experiments between BSG colloidal probe and bare PDMS surfaces revealed a sublinear dependency of friction force on normal load, indicating a single asperity contact due to squeezing of asperities found on PDMS surfaces. In contrast, friction on protein-coated PDMS surfaces behave as multi-asperity contacts that can be described by macroscopic theories (Amonton's law), albeit at the nanoscale. Adsorption of lactoferrin and β-lactoglobulin on PDMS surfaces can effectively screen the adhesive interactions between the colloidal probe and the sample. This reduces the friction significantly, with β-lactoglobulin having slightly better lubricating properties.
Friction measurements with hydrophobic PDMS colloidal probes were different than those found with hydrophilic BSG ones and were greatly affected by the properties of the protein films adsorbed on soft surfaces. Lactoferrin forms a non-uniform film on the PDMS surface, consisting of protein molecules and large protein aggregates, with large areas of PDMS minimally coated or remaining bare. The protein aggregates explain the multi-asperity contact behaviour. Consequently, while LF screens adhesion between the probe and the sample, its lubricating properties are poor due to the low affinity towards the surface, leading to the relatively easy removal of the adsorbed LF film from the PDMS–PDMS interface, once the sliding motion starts. In contrast, β-lactoglobulin forms a uniform, compact and relatively smooth layer on the PDMS surface that not only can screen the adhesive forces, but due to its increased affinity towards PDMS, it can continue to remain on the PDMS–PDMS interface and reduce friction. Consequently, it exhibits a lower friction at lower pressures, as compared to LF, which can be partially attributed to a smoother surface. Eventually, increased contact pressure will start to cause dehydration and desorption of protein from the probe–sample interface, increasing the hydrophobic interactions and then exposing the PDMS surface underneath, leading to increased friction. The fact that this behaviour is not observed when using BSG probes is attributed to their reduced interaction both with the protein film as well with the PDMS surface due to its more hydrophilic nature as opposed to the hydrophobic PDMS probe. Consequently, the shear stress is significantly lower than that of PDMS probes, which results in reduced removal of protein from the PDMS surface. Surfaces with lower elastic modulus can withstand higher normal loads before the removal of β-lg films, resulting from the distribution of the load over a larger contact area. Consequently, this leads to a clear dependency of friction coefficient on the elastic modulus of the sample. Furthermore, since PDMS probes are softer than BSG probes and distribute the load over a larger contact area, they should exhibit lower friction. The fact that this is not the case here is due to different chemical properties of the probes (hydrophobic PDMS versus hydrophilic BSG), that outweighs the distribution of load over an increased contact area.
To our knowledge this is the first study at the nanoscale level with well-defined soft colloidal probes and surfaces of variable and controllable modulus, demonstrating the significant role played by Young's modulus of a protein-coated surface in affecting its frictional properties. The work highlights the importance of selecting model systems that closely match the mechanical properties and chemical properties of the biological systems of interest, and applying the correct contact mechanics (in this case JKR) if truly meaningful results are to be generated from such model studies. It also reveals the complex interplay of multiple factors governing friction between soft interfaces: adhesion governing the contact area in soft contact; the modulus of each surface governing deformation and again the contact area and pressure; the load applied; the nanoscale morphology of the surface, or of any adsorbed film which controls the contact mechanics and determines single or multi-asperity contact; the chemical affinity of the adsorbed proteins for the surface, which controls the morphology and robustness of the film, and the chemical nature of the two surface in terms of hydrophillicy/hydrophobicity.
4. Experimental section
Materials
Polydimethylsiloxane (PDMS) with different elastic modulus (Sylgard®184 and Sylgard®527) were purchased from Farnell, UK. Hydrogen peroxide (H2O2) solution (30% wt%) was purchased from Sigma-Aldrich Company Ltd, UK. Hellmanex™ III cleaning solution, sodium dodecyl sulphate (SDS), ammonia (NH3) solution (25%), sodium chloride (NaCl), HEPES (4-(2-hydroxyethyl)-1-piperazineethanesulfonic acid), borosilicate glass (BSG) particles (9000 series, 5 μm diameter), toluene, ethanol absolute, and isopropanol were purchased from Fisher Scientific, UK. Sulphuric acid (H2SO4) was purchased from VWR International Ltd, UK. Atomic force microscopy (AFM) cantilevers (HQ:CSC37/tipless/Cr–Au) were purchased from Windsor Scientific Ltd, UK. Silicon wafers were purchased from Agar Scientific Ltd, UK. Silicon-coated QCM sensors (QSX-303, 5 MHz) were purchased from Biolin Scientific, UK. Araldite 2-part epoxy adhesive was purchased from RS Components Ltd, UK. Lactoferrin (LF) and β-lactoglobulin (β-lg) were purchased from Ingredia (France) and Sigma-Aldrich Company Ltd (UK), respectively, and were used without any further purification. Buffer solution of 10 mM 4-(2-hydroxyethyl)-1-piperazineethanesulfonic acid (HEPES) and 10 mM NaCl, adjusted at pH 6.8, was used to prepare 1 mg mL−1 protein solutions. Milli-Q water (resistivity of 18 MΩ cm by Milli-Q apparatus, Millipore Corp., USA) was used for the preparation of 10 mM NaCl HEPES buffer.PDMS substrate preparation
Thin and ultrathin films of PDMS were prepared on silicon wafers and silicon-coated QCM-D crystals, respectively. To achieve different degrees of deformability, silicone elastomers Sylgard®184 and Sylgard®527 were used that have a Young's modulus of approximately 2 MPa and 10 kPa, respectively.43 For the preparation of PDMS-coated silicon substrates, Sylgard®184 was mixed (10![[thin space (1/6-em)]](https://www.rsc.org/images/entities/char_2009.gif) :1 w/w base to curing agent) using a planetary mixer (Thinky ARE-250, Intertronics, UK) for 60 s at 2000 rpm, followed by degassing for 90 s at 2200 rpm. Sylgard®527 was mixed (1:1 w/w Part A to Part B) using a planetary mixer for 60 s at 2000 rpm followed by degassing for 90 s at 2200 rpm. Subsequently, the above products were mixed (Sylgard®184:Sylgard®527) in different ratios (pure Sylgard®184 (100%), 62:38 (62%), 35:65 (35%), 22:78 (22%), and 9:91 (9%)), using the planetary mixer for 60 s at 2000 rpm followed by degassing for 90 s at 2200 rpm, to create PDMS substrates with different elastic modulus.43 A spin-coater (Laurell technologies corporation, USA) was used to produce films (thickness ≈ 20 μm) of the above elastomer mixtures on the silicon substrates.61 A droplet of 100 μL of the desired elastomer prepared using the afore-mentioned procedure was placed on a static silicon substrate and was rotated for 30 s at 4000 rpm, with an acceleration of 2000 rpm per s. The PDMS-coated substrate was then placed on a hot plate at 80 °C for 30 min, followed by curing in a vacuum oven at 80 °C for 24 h.62 The prepared PDMS-coated substrates were then immersed in toluene for 24 h to remove the uncured PDMS, followed by 12 h storage in the vacuum oven at 80 °C to remove the toluene. For the preparation of the PDMS-coated QCM-D sensors, Sylgard®184 (10:1 w/w base to curing agent) was dissolved in toluene to prepare a 10 wt% stock solution and was stirred for 24 hours. The resulted solution was diluted in toluene to prepare a 0.5 wt% stock solution and was stirred for 24 h. Subsequently, a spin-coater was used to coat the QCM-D crystals with a PDMS film of approximately 10 nm thickness.63 A droplet of 100 μL of the 0.5 wt% PDMS solution was placed on a static silicon-coated quartz crystal, and was rotated for 30 s at 5000 rpm, with an acceleration of 2500 rpm per s. The PDMS-coated QCM-D crystals were then placed on a hot plate at 80 °C for 30 min, followed by curing in a vacuum oven at 80 °C for 24 h.
:1 w/w base to curing agent) using a planetary mixer (Thinky ARE-250, Intertronics, UK) for 60 s at 2000 rpm, followed by degassing for 90 s at 2200 rpm. Sylgard®527 was mixed (1:1 w/w Part A to Part B) using a planetary mixer for 60 s at 2000 rpm followed by degassing for 90 s at 2200 rpm. Subsequently, the above products were mixed (Sylgard®184:Sylgard®527) in different ratios (pure Sylgard®184 (100%), 62:38 (62%), 35:65 (35%), 22:78 (22%), and 9:91 (9%)), using the planetary mixer for 60 s at 2000 rpm followed by degassing for 90 s at 2200 rpm, to create PDMS substrates with different elastic modulus.43 A spin-coater (Laurell technologies corporation, USA) was used to produce films (thickness ≈ 20 μm) of the above elastomer mixtures on the silicon substrates.61 A droplet of 100 μL of the desired elastomer prepared using the afore-mentioned procedure was placed on a static silicon substrate and was rotated for 30 s at 4000 rpm, with an acceleration of 2000 rpm per s. The PDMS-coated substrate was then placed on a hot plate at 80 °C for 30 min, followed by curing in a vacuum oven at 80 °C for 24 h.62 The prepared PDMS-coated substrates were then immersed in toluene for 24 h to remove the uncured PDMS, followed by 12 h storage in the vacuum oven at 80 °C to remove the toluene. For the preparation of the PDMS-coated QCM-D sensors, Sylgard®184 (10:1 w/w base to curing agent) was dissolved in toluene to prepare a 10 wt% stock solution and was stirred for 24 hours. The resulted solution was diluted in toluene to prepare a 0.5 wt% stock solution and was stirred for 24 h. Subsequently, a spin-coater was used to coat the QCM-D crystals with a PDMS film of approximately 10 nm thickness.63 A droplet of 100 μL of the 0.5 wt% PDMS solution was placed on a static silicon-coated quartz crystal, and was rotated for 30 s at 5000 rpm, with an acceleration of 2500 rpm per s. The PDMS-coated QCM-D crystals were then placed on a hot plate at 80 °C for 30 min, followed by curing in a vacuum oven at 80 °C for 24 h.
Prior to use, all PDMS-coated substrates were cleaned by immersion in toluene for 30 s, followed by immersion for 30 s in isopropanol, MilliQ water for 5 min, followed by drying with pure nitrogen gas, and allowing any remaining solvent to evaporate for at least 1 h in an open container in a fume hood.
Fabrication of PDMS microspheres
Spherical PDMS microspheres with Young's modulus of 2 MPa and diameter ≈ 5 μm (Fig. S13, ESI†) were prepared following a procedure developed by Yin et al.64 In brief, PDMS Sylgard®184 base and curing agent were mixed thoroughly at a 10:1 (w/w) ratio, and were degassed for 30 min. Subsequently, 0.6 g of the above mixture were added to 30 mL of 15 wt% polyvinyl alcohol (PVA) aqueous solution to create a PDMS-in-PVA emulsion droplets, and was stirred for 12 h in room temperature, followed by 12 h storage at 80 °C. The resulting PDMS microparticles were centrifuged at 3000 rpm and washed several times with MilliQ water.
Fabrication of AFM colloidal probes
Rectangular tipless cantilevers (MikroMasch, HQ:CSC37/tipless/Cr–Au) with a spring constant that is ranging between 0.3 and 0.8 N m−1 were used for the fabrication of colloidal probes. Initially, the precise values of the normal spring constant were determined using thermal tuning provided by Nanoscope software v9. Subsequently, spherical borosilicate glass (diameter ≈ 5 μm) and PDMS (diameter ≈ 10 μm) colloidal particles were attached on the end of the cantilevers using a 2-part epoxy glue.Scanning electron microscopy
Scanning electron microscopy images of the colloidal probe cantilevers were captured using an EVO MA15 scanning electron microscope (Carl Zeiss, Jena Germany). Prior to imaging, the colloidal probes were mounted on 12.0 mm diameter stubs. Subsequent analysis of the images was performed to acquire the precise dimensions of the cantilever's length and width, as well as the diameter of the attached particles.Atomic force microscopy (AFM)
All AFM measurements were acquired using a Bruker Multimode 8 AFM (USA) equipped with a Bruker Nanoscope V controller. The normal sensitivity and the spring constant were calibrated as detailed by Hutter and Bechhoefe.65 The length and width of cantilever, as well as the probe radius, were measured using SEM. In order to reduce experimental error, the thickness was calculated using the dimension acquired by SEM and beam mechanics model.66 Beam mechanics was also used to calculate the lateral spring constant, and the lateral sensitivity of the cantilevers, in order to acquire the lateral force conversion factor. Force spectroscopy and friction force microscopy were performed in a liquid cell that was loaded as follows; approximately 200 μL of the desired protein solution was deposited on the PDMS sample and was let to adsorb for an hour. Subsequently, to remove non-adsorbed protein molecules that could adsorb on the cantilever and interfere with the laser signal, the protein solution was exchanged with buffer using two pipettes, ensuring that the sample remained hydrated at all times. Finally, the samples were transferred to the AFM for measurements.Force spectroscopy
Force spectroscopy was performed on PDMS samples to calculate the Young's modulus of the samples as well as the adhesion developed between colloidal probes and samples. The Young's modulus of PDMS substrates was measured in buffer, using BSG colloidal probes, while the adhesion was measured both in buffer and protein solutions, using BSG or PDMS probes. For both measurements, a total of 25 force distance (F–d) curves were acquired over a 5 by 5 grid (1 μm step size), using ramp rate of 5 μm s−1. For the measurements of Young's modulus, the trigger force ranged between 2 and 40 nN, while for the adhesion measurements the trigger force was 40 nN. Having established the dependence of modulus on indentation, a 40 nN trigger force was selected to measure the elastic modulus at the plateau region. The adhesion was measured directly from the retracting part of the curve (Fig. S1a, ESI†) using Bruker Nanoscope Analysis v1.9. The retracting part of the F–d curve was also fitted with a JKR model, since PDMS is a soft and deformable material with high adhesion, to calculate the Young's modulus using Bruker Nanoscope Analysis v1.9. The JKR equation calculates the contact area (A) using eqn (2):16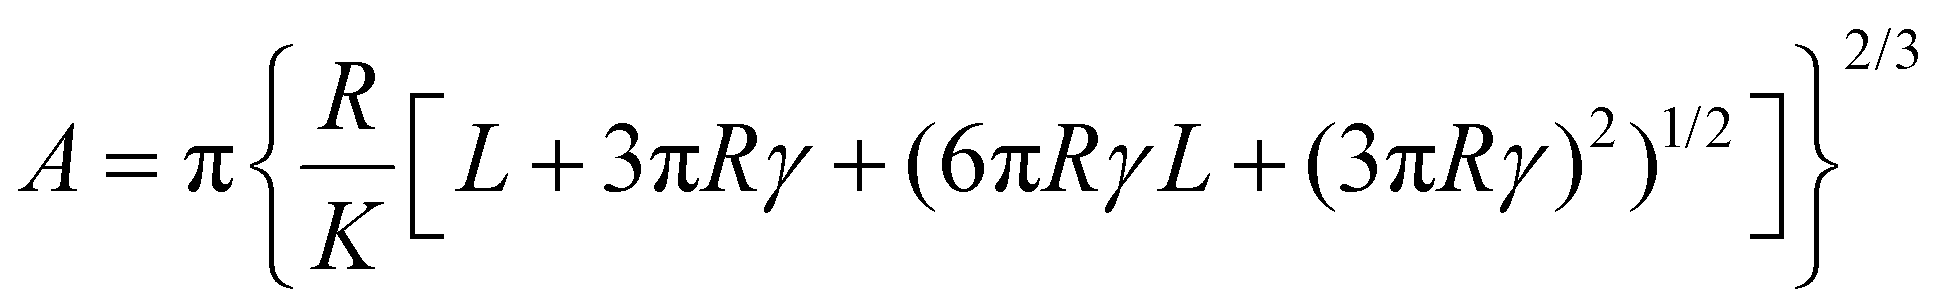 | (2) |
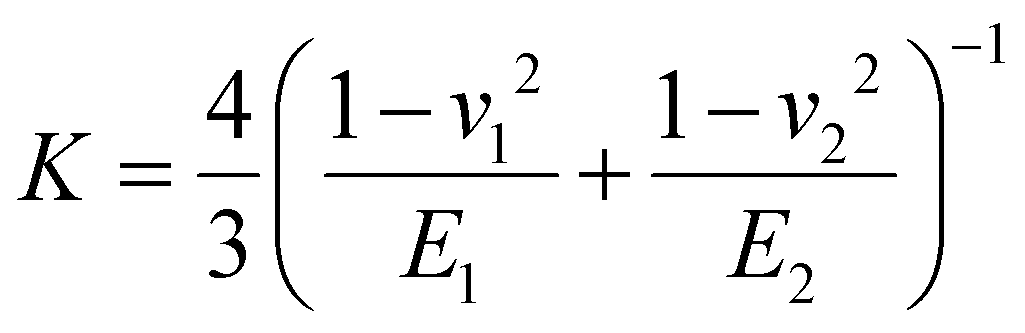 (E1, E2 and v1, v2 are the elastic modulus and Poisson's ratio of the sphere and the sample, respectively), L is the normal load, and γ is the work of adhesion given by γ = 2Lad/3πR (Lad is the maximum adhesion force). The software uses all the points on the retracting part of the curves from the max adhesion until the maximum indentation force to determine the Young's modulus.67 Subsequent calculations of the Maugis parameter revealed values ≫5, which is the upper limit of Maugis parameter, confirming a pure JKR interaction. A total of 75 F–d curves from 3 different samples were used for the calculation of the adhesion and Young's modulus.
Friction force microscopy (FFM)
Frictional forces were calculated from the so-called friction loops (Fig. S1b, ESI†), by recording the lateral voltage signal of the cantilever as the cantilever slides over the substrate, that are equal to half the difference between the average lateral voltage values obtained during the forward and reverse scan direction.68,69 The raw data acquired by Nanoscope were extracted and processed using custom scripts developed in MATLAB (MathWorks). The raw voltage was converted to friction force using lateral force conversion factor acquired from beam mechanics as discussed in the section above. FFM was performed both in buffer and protein solutions, using BSG or PDMS probes. The friction was measured over a range of increasing applied loads, ranging from 0 to 90 nN, while scan size of 5 μm and sliding speed of 5 μm s−1 were used in all measurements. The distance between consecutive scan lines was 500 nm (10 scanning lines over 5 μm distance) to ensure that the colloidal probe was rubbing against a fresh surface (protein-coated or not, depending on the medium) every time and ensure steady conditions. Similarly, each scan to acquire the load versus friction force points was taken on a new area to ensure protein coverage. For all systems, both in buffer and in protein solutions, the mean contact pressure was used as calculated with eqn (3):| PMean = (L + Lad)/A | (3) |
AFM imaging
Topographic images were acquired by PeakForce Tapping™ (PFT) imaging technique, developed by Bruker, which performs continuous F–d curves at frequencies between 0.25–8 kHz. Consequently, it can provide direct force control and avoid damage arising from lateral forces. Imaging was performed at room temperature, both in ambient environment using ScanAsyst-Air cantilevers (Bruker, USA), as well as in liquid environment using a fused silica liquid cell loaded with buffer solution and ScanAsyst-Fluid + cantilevers (Bruker, USA). In both cases, the PeakForce setpoint was set at 50 pN, the tapping frequency was 4 kHz, while the scanning rate was 1 Hz. Images were acquired with 512 pixel resolution and were subjected to 1st order flattening to remove tilt and offset of each line, while the RMS roughness were calculated using Bruker Nanoscope Analysis v1.9.Quartz crystal microbalance with dissipation (QCM-D)
A quartz crystal microbalance with dissipation monitoring (QCM-D, E4 system, Q-sense, Sweden) was used to measure real-time adsorption of lactoferrin (LF) and β-lactoglobulin (β-lg) on the PDMS-coated surfaces. A peristaltic pump (Ismatec, Germany) was used to inject the buffer and protein solutions into the QCM-D chamber, using a flow of 100 μL min−1 at 25 °C. Initially, buffer solution was injected into the QCM-D chamber until a stable frequency and dissipation baseline was achieved. Subsequently, protein solution (1 mg mL−1) was inserted in the chamber and was left to adsorb until it reached a steady state. Finally, in order to remove weakly adsorbed protein molecules, buffer solution was inserted and allowed to circulate for at least 30 min. All sensors were used only once to ensure the cleanliness of the PDMS surfaces.Frequency and dissipation data were collected by Qsoft software (Q-Sense, Sweden) and were analysed by Dfind (Q-Sense, Sweden). Subsequently, the 3rd to 11th overtones were fitted using a Voigt “Smartfit” model for viscoelastic films provided by Dfind to obtain the film thickness.58 For clarity purposes, only the 5th overtone of the frequency and dissipation is illustrated in the Fig. S11, ESI.†
Contact angle measurements
An OCA25 drop tensiometer (DataPhysics Instruments, Germany) was used to measure the static water contact angle on the prepared PDMS surfaces by means of sessile drop technique. Approximately 5 μL droplet of MilliQ water was deposited on the PDMS surfaces and the average contact angle value from the left and right side of the droplet was measured using the SCA 20 software (DataPhysics Instruments, Germany). Each measurement was performed three times to ensure the reproducibility of the results.SCF calculations
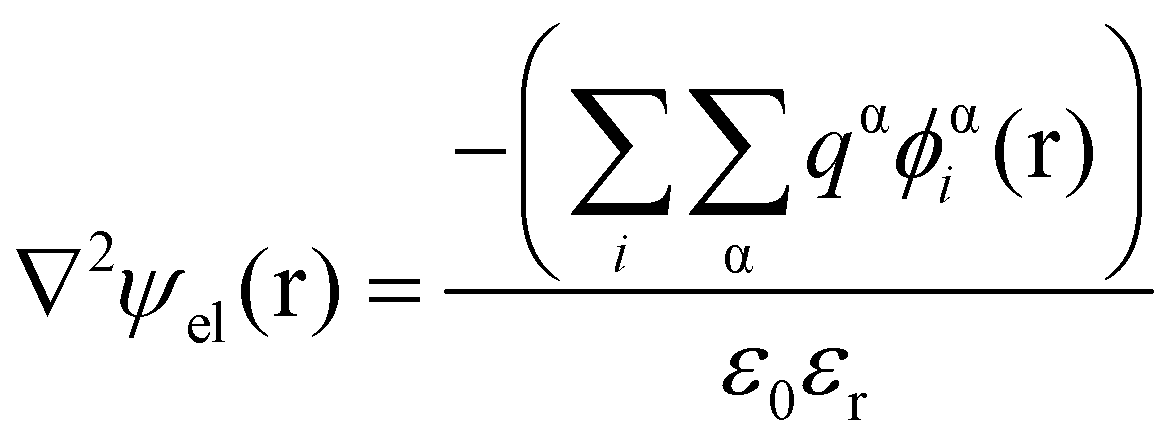
Theoretical studies of adsorbed polymeric interfacial layers, through the use of the well-known Scheutjens–Fleer self-consistent-field (SCF) calculations, was employed to compare the likely amount of adsorbed β-lg and LF.21,70–72 An essential feature of these calculations is that the interactions felt by any monomer unit with its neighbouring residues, solvent molecules or ions, are introduced as a set of effective fields at each position. For monomer residues of type α, this effective field at position r can be expressed as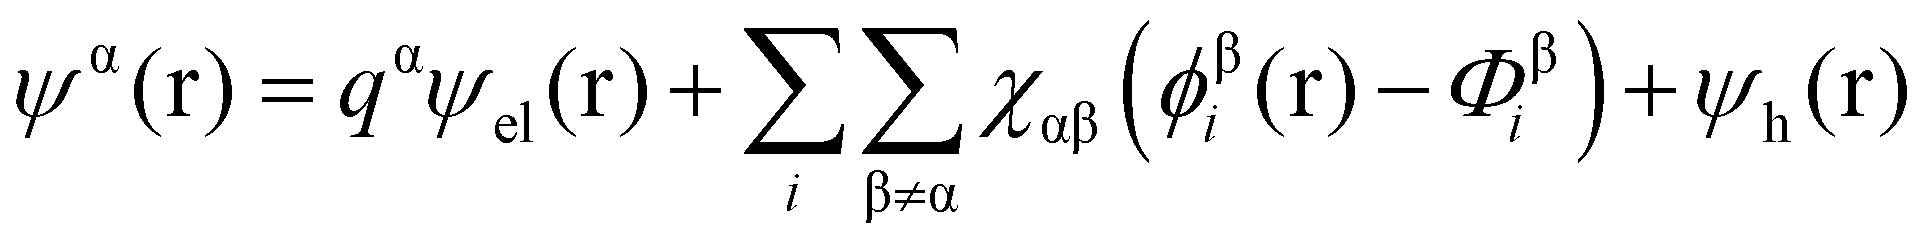 | (4) |
 | (5) |
In eqn (5), ε0εr is the permittivity of the solvent (i.e. water here). The second term in the eqn (4) account for the short-range interactions, such as hydrophobic, hydrogen bonding, or any other nearest neighbour interactions between two different sets of monomers. In our calculations, the overall strength of such interactions is characterised by a set of Flory–Huggins parameters {χαβ}. Typically, the values of these parameters are of the order of a few kBT, where kB is the Boltzmann constant and T the temperature (in degree Kelvins). Positive values for χαβ reflect the fact that residues α and β tend to avoid each other, whereas a negative value is indicative of favourable interactions between the two. The field due to such short-range interactions, felt by a monomer of type α at position r, will of course depend on the set of densities {φβi(r)} of all other species, β, belonging to all the different chains, i, around that position. The final term in eqn (4) is a hard core potential, enforcing the incompressibility of the system, which is simply expressed as
 | (6) |
The hard core potential acts equally on all monomers (including solvent molecules or any free ions), irrespective of their type. Through an appropriate statistical mechanics averaging process, usually required to be carried out numerically, the variation of volume fractions {ϕαι(r)} can be evaluated.71,72 The resulting volume fractions are then used to calculate a new set of fields using eqn (4). The processes is repeated many times until convergence is obtained, whereby no further changes in the values of fields or volume fractions, with further iterations, occurs.
Our models for LF and β-lg, consist of trains of monomer residues reflecting the number of residues (704 for LF and 176 for β-lg), electric charge (where present) and the hydrophobic/polar nature of the amino acids that make up each protein, in accordance to their primary structures. These were obtained from UniProt Protein Data Bank (http://www.uniprot.org). However, in order to avoid a proliferation of χ parameters arising between 20 or so different amino acids, we group the monomer residues with alike properties into a single set. Thus, for example, we place all hydrophobic amino acids into one group. Similarly, all polar but none charged residues are placed into another group and assigned the same parameters. Final groups consist of charged monomers lumped into several sets according to the proximity of their pKa values to each other. In addition to amino acids, we also include ions such as Na+, Cl−, etc., so that total volume fraction for all the species in each lattice layer adds up to equal 1. The space between the planar surfaces was divided into equidistant layers with lattice layer thickness set at a0 = 3 Å (nominal size of a peptide bond). Segment density profiles were compared for each of LF and β-lg proteins, in a gap of 10 nm between two parallel surfaces, as well as when the two surfaces are far enough to be considered as isolated from each other.
Statistical analysis
Significant differences between samples were determined using one-way ANOVA with post-hoc Tukey's multiple comparison test using SPSS software (IBM, SPSS statistics) and 95% level of confidence.Conflicts of interest
The authors declare no conflict of interest.Acknowledgements
This study has received funding from the European Research Council (ERC) under the European Union's Horizon 2020 research and innovation program (grant agreement no. 757993). A. S. and S. D. C. designed the research, experimental protocol and supervised the project. E. L. performed the nanoscale experiments and did data analysis with theoretical interpretation by S. D. C. M. Z. performed the QCM-D experiments. E. L. organized the protein bank data and R. E. designed the SCF numerical simulations, ran the analysis and interpreted the theoretical data. E. L. wrote the manuscript with inputs from all authors. A. S. and S. D. C. had primary responsibility for final content; and all authors read, edited and approved the final manuscript.References
- B. G. Cooper, B. Catalina, A. Nazarian, B. D. Snyder and M. W. Grinstaff, Biomaterials, 2018, 181, 210–226 CrossRef CAS.
- P. A. Dieppe and L. S. Lohmander, Lancet, 2005, 365, 965–973 CrossRef CAS.
- A. Mann and B. Tighe, Exp. Eye Res., 2013, 117, 88–98 CrossRef CAS.
- A. Sarkar, E. Andablo-Reyes, M. Bryant, D. Dowson and A. Neville, Curr. Opin. Colloid Interface Sci., 2019, 39, 61–75 CrossRef CAS.
- J. A. Ship, S. R. Pillemer and B. J. Baum, J. Am. Geriatr. Soc., 2002, 50, 535–543 CrossRef.
- G. A. Ateshian, J. Biomech., 2009, 42, 1163–1176 CrossRef.
- T. A. Schmidt, N. S. Gastelum, Q. T. Nguyen, B. L. Schumacher and R. L. Sah, Arthritis Rheum., 2007, 56, 882–891 CrossRef CAS.
- G. D. Jay, J. R. Torres, D. K. Rhee, H. J. Helminen, M. M. Hytinnen, C. J. Cha, K. Elsaid, K. S. Kim, Y. Cui and M. L. Warman, Arthritis Rheum., 2007, 56, 3662–3669 CrossRef CAS.
- L. McCann, E. Ingham, Z. Jin and J. Fisher, Osteoarthritis Cartilage, 2009, 17, 995–1000 CrossRef CAS.
- J. F. Prinz, R. A. de Wijk and L. Huntjens, Food Hydrocolloids, 2007, 21, 402–408 CrossRef CAS.
- H. Ranc, C. Servais, P. F. Chauvy, S. Debaud and S. Mischler, Tribol. Int., 2006, 39, 1518–1526 CrossRef CAS.
- O. Sterner, C. Karageorgaki, M. Zürcher, S. Zürcher, C. W. Scales, Z. Fadli, N. D. Spencer and S. G. P. Tosatti, ACS Appl. Mater. Interfaces, 2017, 9, 20150–20160 CrossRef CAS.
- T. Wilson, R. Aeschlimann, S. Tosatti, Y. Toubouti, J. Kakkassery and K. Osborn Lorenz, Cornea, 2015, 34, 1179–1185 CrossRef.
- S. Derler and L. Gerhardt, Tribol. Lett., 2011, 45, 1–27 CrossRef.
- L. Skedung, K. Danerlöv, U. Olofsson, C. Michael Johannesson, M. Aikala, J. Kettle, M. Arvidsson, B. Berglund and M. W. Rutland, Tribol. Int., 2011, 44, 505–512 CrossRef.
- E. Liamas, S. D. Connell, S. N. Ramakrishna and A. Sarkar, Nanoscale, 2020, 12, 2292–2308 RSC.
- S. Park, K. D. Costa and G. A. Ateshian, J. Biomech., 2004, 37, 1679–1687 CrossRef.
- J. M. Coles, J. J. Blum, G. D. Jay, E. M. Darling, F. Guilak and S. Zauscher, J. Biomech., 2008, 41, 541–548 CrossRef.
- A. Raj, M. Wang, C. Liu, L. Ali, N. G. Karlsson, P. M. Claesson and A. Dėdinaitė, J. Colloid Interface Sci., 2017, 495, 200–206 CrossRef CAS.
- D. P. Chang, N. I. Abu-Lail, J. M. Coles, F. Guilak, G. D. Jay and S. Zauscher, Soft Matter, 2009, 5, 3438–3445 RSC.
- F. Xu, E. Liamas, M. Bryant, A. F. Adedeji, E. Andablo-Reyes, M. Castronovo, R. Ettelaie, T. V. J. Charpentier and A. Sarkar, Adv. Mater. Interfaces, 2020, 7, 1901549 CrossRef.
- R. Akhtar, M. J. Sherratt, J. K. Cruickshank and B. Derby, Mater. Today, 2011, 14, 96–105 CrossRef CAS.
- J. Töyräs, T. Lyyra-Laitinen, M. Niinimäki, R. Lindgren, M. T. Nieminen, I. Kiviranta and J. S. Jurvelin, J. Biomech., 2001, 34, 251–256 CrossRef.
- A. C. Noel and D. L. Hu, J. Exp. Biol., 2018, 221, jeb176289 CrossRef.
- M. C. Bélanger and Y. Marois, J. Biomed. Mater. Res., 2001, 58, 467–477 CrossRef.
- P. J. Wipff, H. Majd, C. Acharya, L. Buscemi, J. J. Meister and B. Hinz, Biomaterials, 2009, 30, 1781–1789 CrossRef CAS.
- H. Zhang and M. Chiao, J. Med. Biol. Eng., 2015, 35, 143–155 CrossRef.
- A. Gokaltun, M. L. Yarmush, A. Asatekin and O. B. Usta, Technology, 2017, 5, 1–12 CrossRef.
- J. N. Lee, X. Jiang, D. Ryan and G. M. Whitesides, Langmuir, 2004, 20, 11684–11691 CrossRef CAS.
- J. T. Pham, L. Xue, A. Del Campo and M. Salierno, Acta Biomater., 2016, 38, 106–115 CrossRef CAS.
- B. Cortese, G. Gigli and M. Riehle, Adv. Funct. Mater., 2009, 19, 2961–2968 CrossRef CAS.
- G. Bartalena, Y. Loosli, T. Zambelli and J. G. Snedeker, Soft Matter, 2012, 8, 673–681 RSC.
- A. S. Cruz-Félix, A. Santiago-Alvarado, J. Márquez-García and J. González-García, Heliyon, 2019, 5, e03064 CrossRef.
- F. Pan, S. Altenried, M. Liu, D. Hegemann, E. Bülbül, J. Moeller, W. W. Schmahl, K. Maniura-Weber and Q. Ren, Mater. Horiz., 2020, 7, 93–103 RSC.
- B. Lorenz, B. A. Krick, N. Mulakaluri, M. Smolyakova, S. Dieluweit, W. G. Sawyer and B. N. Persson, J. Phys.: Condens. Matter, 2013, 25, 225004 CrossRef CAS.
- J. T. Pham, F. Schellenberger, M. Kappl and H.-J. Butt, Phys. Rev. Mater., 2017, 1, 015602 CrossRef.
- K. E. Jensen, R. Sarfati, R. W. Style, R. Boltyanskiy, A. Chakrabarti, M. K. Chaudhury and E. R. Dufresne, Proc. Natl. Acad. Sci. U. S. A., 2015, 112, 14490–14494 CrossRef CAS.
- K. R. Shull, Mater. Sci. Eng., R, 2002, 36, 1–45 CrossRef.
- R. Buzio, A. Bosca, S. Krol, D. Marchetto, S. Valeri and U. Valbusa, Langmuir, 2007, 23, 9293–9302 CrossRef CAS.
- D. Maugis and M. Barquins, J. Phys. D: Appl. Phys., 1978, 11, 1989–2023 CrossRef.
- S. Huth, S. Sindt and C. Selhuber-Unkel, PLoS One, 2019, 14, e0220281 CrossRef CAS.
- R. Mincheva and J.-M. Raquez, in Surface modification of polymers: methods and applications, ed. J. Pinson and D. Thiry, Wiley, 2020, pp. 1–30, DOI:10.1002/9783527819249.ch1.
- R. N. Palchesko, L. Zhang, Y. Sun and A. W. Feinberg, PLoS One, 2012, 7, e51499 CrossRef CAS.
- A. Sharfeddin, A. A. Volinsky, G. Mohan and N. D. Gallant, J. Appl. Polym. Sci., 2015, 132, 42680 CrossRef.
- A. Sarkar, F. Kanti, A. Gulotta, B. S. Murray and S. Zhang, Langmuir, 2017, 33, 14699–14708 CrossRef CAS.
- R. W. Carpick, D. F. Ogletree and M. Salmeron, J. Colloid Interface Sci., 1999, 211, 395–400 CrossRef CAS.
- M. Esfahanian and B. J. Hamrock, Tribol. Trans., 1991, 34, 628–632 CrossRef CAS.
- N. Marx, J. Guegan and H. A. Spikes, Tribol. Int., 2016, 99, 267–277 CrossRef CAS.
- O. Piétrement and M. Troyon, Langmuir, 2001, 17, 6540–6546 CrossRef.
- D. H. Gracias and G. A. Somorjai, Macromolecules, 1998, 31, 1269–1276 CrossRef CAS.
- K. Ma, J. Rivera, G. J. Hirasaki and S. L. Biswal, J. Colloid Interface Sci., 2011, 363, 371–378 CrossRef CAS.
- K. Efimenko, W. E. Wallace and J. Genzer, J. Colloid Interface Sci., 2002, 254, 306–315 CrossRef CAS.
- Y. Berdichevsky, J. Khandurina, A. Guttman and Y. H. Lo, Sens. Actuators, B, 2004, 97, 402–408 CrossRef CAS.
- Y.-J. Fu, H.-z. Qui, K.-S. Liao, S. J. Lue, C.-C. Hu, K.-R. Lee and J.-Y. Lai, Langmuir, 2010, 26, 4392–4399 CrossRef CAS.
- J. Song, D. Tranchida and G. J. Vancso, Macromolecules, 2008, 41, 6757–6762 CrossRef CAS.
- H. M. Baker and E. N. Baker, Biochem. Cell Biol., 2012, 90, 320–328 CrossRef CAS.
- L. Pérez-Fuentes, C. Drummond, J. Faraudo and D. Bastos-González, Materials, 2017, 10, 893 CrossRef.
- M. V. Voinova, M. Rodahl, M. Jonson and B. Kasemo, Phys. Scr., 1999, 59, 391–396 CrossRef CAS.
- F. Höök, J. Vörös, M. Rodahl, R. Kurrat, P. Böni, J. J. Ramsden, M. Textor, N. D. Spencer, P. Tengvall, J. Gold and B. Kasemo, Colloids Surf., B, 2002, 24, 155–170 CrossRef.
- J. J. R. Stålgren, J. Eriksson and K. Boschkova, J. Colloid Interface Sci., 2002, 253, 190–195 CrossRef.
- J. H. Koschwanez, R. H. Carlson and D. R. Meldrum, PLoS One, 2009, 4, e4572 CrossRef.
- S. P. Wang, A. Kallur and A. Goshu, Proc. SPIE, 2011, 79350M Search PubMed.
- M. Bračič, T. Mohan, R. Kargl, T. Griesser, S. Hribernik, S. Köstler, K. Stana-Kleinschek and L. Fras-Zemljič, RSC Adv., 2014, 4, 11955–11961 RSC.
- J. Yin, X. Han, Y. Cao and C. Lu, Sci. Rep., 2014, 4, 5710 CrossRef.
- J. L. Hutter and J. Bechhoefer, Rev. Sci. Instrum., 1993, 64, 1868–1873 CrossRef CAS.
- W. Liu, K. Bonin and M. Guthold, Rev. Sci. Instrum., 2007, 78, 063707 CrossRef.
- D. M. Ebenstein and K. J. Wahl, J. Colloid Interface Sci., 2006, 298, 652–662 CrossRef CAS.
- C. M. Mate, IBM J. Res. Dev., 1995, 39, 617–627 CAS.
- R. W. Carpick and M. Salmeron, Chem. Rev., 1997, 97, 1163–1194 CrossRef CAS.
- R. Ettelaie, E. Dickinson and L. Pugnaloni, J. Phys.: Condens. Matter, 2014, 26, 464109 CrossRef.
- E. Dickinson, V. J. Pinfield, D. S. Horne and F. A. M. Leermakers, J. Chem. Soc., Faraday Trans., 1997, 93, 1785–1790 RSC.
- J. M. H. M. Scheutjens and G. J. Fleer, J. Phys. Chem., 1980, 84, 178–190 CrossRef CAS.
- L. Anghel, A. Rogachev and A. Kuklin, Eur. Biophys. J., 2019, 48, 285–295 CrossRef CAS.
Footnote |
| † Electronic supplementary information (ESI) available. See DOI: 10.1039/d0nr06527g. Raw dataset is avaiable at University of Leeds Data Repository: https://doi.org/10.5518/943 |
| This journal is © The Royal Society of Chemistry 2021 |