 Open Access Article
Synthesis and theoretical calculations of metal-antibiotic chelation with thiamphenicol: in vitro DNA and HSA binding, molecular docking, and cytotoxicity studies†
Abeer A.
Sharfalddin
 a,
Abdul-Hamid
Emwas
b,
Mariusz
Jaremko
 c and
Mostafa A.
Hussien
 *ad
*ad
aDepartment of Chemistry, Faculty of Science, King Abdulaziz University, P. O. Box 80203, Jeddah 21589, Saudi Arabia
bKing Abdullah University of Science and Technology (KAUST), Thuwal, 23955-6900, Saudi Arabia
cKing Abdullah University of Science and Technology (KAUST), Biological and Environmental Science and Engineering (BESE), Thuwal, 23955-6900, Saudi Arabia
dDepartment of Chemistry, Faculty of Science, Port Said University, Port Said, 42521, Egypt
First published on 12th May 2021
Abstract
Thiamphenicol (TM) is an antimicrobial drug and a methyl-sulfonyl analogue of chloramphenicol. New metal complexes of TM with Zn(II), Cu(II), Ni(II), Co(II) and Fe(II) were synthesized and characterized using elemental analyses, infrared (IR) and proton nuclear magnetic resonance spectroscopy (1H-NMR), magnetic susceptibility, electron paramagnetic resonance (EPR) spectroscopy, and thermogravimetric analysis (TGA). The IR spectra revealed coordination of the deprotonated ligand to the metal through one oxygen and the nitrogen atom of the amide group. Moreover, EPR analysis of the Cu(II) solid sample indicated a distorted tetrahedral structure with a negligible exchange interaction between the Cu(II) ions. The UV-vis spectral results from the Co(II) and Fe(II) complexes showed a distorted tetrahedral geometric arrangement for both compounds. The DFT calculation approach was used to study the nature of the interaction between the metal ions and the ligand where the molecular stability and bond strengths were evaluated by Natural Bond Orbital (NBO) and quantum parameters. The biological activity of the metal complexes was investigated by several different bioassays. The DNA binding constant Kb showed an intercalation binding mode for both the free drug and the metal compounds. An in vitro protein (HSA) binding study showed binding with TM–Zn Kb = 9.87 × 10⁵ M−1. The cytotoxic activity of each divalent complex was tested against two cell lines: (1) a human colon carcinoma (HCT-116) cell line and (2) a human breast carcinoma (MCF-7) tumor cell line and demonstrated anti-cancer cell activities. Molecular docking was utilized to explain the biological inhibition of the Cu(II) and Zn(II) complexes.
1. Introduction
Metal-based drugs derived from transition metals have been extensively studied for their biological activity.1 Enhancing their bioactivity is key to designing new and more effective medical drugs. Metal-based drug bioactivity can be increased by modulating the metal chelation, which in turn decreases their toxicity and enhances their lipophilicity, absorbance, and stability.2 Some transition metals are essential components of biological systems, playing diverse roles including as cofactors in the enzyme oxidation process, controlling the geometry of the enzymic active sites, and activating enzymatic reactions.3 Moreover, they are present in vitamins such as Co(II) in B12. Copper is essential for nervous system development and it exists in many enzymes and proteins with a range of functions such as in energy metabolism.4 Zinc is the most abundant transition metal in the human body playing several important roles including in immunity and metabolism, and is crucial for the function of more than 300 enzymes.3,5Thiamphenicol (TM), also known as dextrosulphenidol,6 is an antimicrobial drug with broad antibiotic activity. It is an analogue of chloramphenicol by NO2 substitution with methyl sulfinyl, and is 2.5 to 5 times more potent than chloramphenicol.7 The chemical structure of TM has three donor atoms that could coordinate to a metal ion: the primary alcohol, the secondary alcohol, and the amide group. However, until now, the reaction of TM with biological metals or other inorganic metals has not been well investigated.
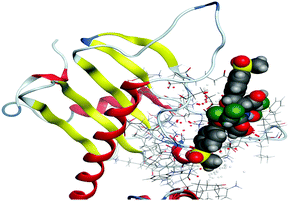
Attempting to improve the efficiency of the free drug, five new metal complexes were synthesized in ethanol solution and characterized by analytical, spectroscopic, and thermal techniques. DNA helix is a biomolecule that represents a major target in the development strategies of the drugs designed.8 Among many other transporting proteins human serum albumin (HSA) is the main carrier of ions and molecules in the blood plasma. The interaction of a biological target such as DNA or specific protein to drugs could change their structure or inhibit their activity. For this purpose, we evaluated the binding affinity of the metal complexes to a pharmacological target using spectroscopic experiments with CT-DNA and human serum albumin (HSA). The cytotoxic activity of the prepared compounds was tested theoretically via molecular docking against two proteins, 4FM9 and 1H7K. Finally, we tested the complexes’ in vitro activity against human colon carcinoma (HCT-116) and human breast carcinoma (MCF-7) tumor cell lines.
2. Experimental methods
2.1. Chemicals and reagents
Thiamphenicol of 99% purity was purchased from Aldrich. All chemicals used in this study, including the metal(II) salts and solvents, were of analytical reagent grade, commercially available from BDH and used without further purification.2.2. Synthesis of the metal(II) complexes
A refluxing method was used to prepare the divalent metal complexes at a 1![[thin space (1/6-em)]](https://www.rsc.org/images/entities/char_2009.gif) :
:![[thin space (1/6-em)]](https://www.rsc.org/images/entities/char_2009.gif) 2 (M
2 (M![[thin space (1/6-em)]](https://www.rsc.org/images/entities/char_2009.gif) :
:![[thin space (1/6-em)]](https://www.rsc.org/images/entities/char_2009.gif) TM) molar ratio. Appropriate amounts of CuCl2, CoCl2, ZnCl2, NiCl2, or FeCl2 were dissolved in ethanol and added to 2 mmol of TM (0.712 g) ligand solution in ethanol, pH = 8.9 adjusted by KOH. The mixture was incubated on a hotplate for 2–3 h. Solid precipitates were formed after leaving the mixtures overnight till the volumes reduced by half. This was followed by filtering and washing with a few drops of ethanol and diethyl ether. Finally, the complexes were dried in a vacuum desiccator over anhydrous CaCl2 in preparation for characterization. There were many attempts to get single crystals from the metal complexes using the diffusion method with DMS and chloroform or ethanol and benzene but all failed.
TM) molar ratio. Appropriate amounts of CuCl2, CoCl2, ZnCl2, NiCl2, or FeCl2 were dissolved in ethanol and added to 2 mmol of TM (0.712 g) ligand solution in ethanol, pH = 8.9 adjusted by KOH. The mixture was incubated on a hotplate for 2–3 h. Solid precipitates were formed after leaving the mixtures overnight till the volumes reduced by half. This was followed by filtering and washing with a few drops of ethanol and diethyl ether. Finally, the complexes were dried in a vacuum desiccator over anhydrous CaCl2 in preparation for characterization. There were many attempts to get single crystals from the metal complexes using the diffusion method with DMS and chloroform or ethanol and benzene but all failed.
2.3. Physicochemical measurements
Infrared spectra of the TM ligand and its complexes were recorded on a Bruker infrared spectrophotometer in the range of 400–4000 cm−1. The molar conductance and the electronic spectra of 10−3 M solutions of the metal complexes in DMF solvent were measured on a HACH conductivity meter and Shimadzu UV/vis spectrometer in the range of 200–800 nm. All the measurements were taken at room temperature for freshly prepared solutions. Microanalytical analyses (% carbon, % hydrogen and % nitrogen) were carried out on a Vario EL Fab. CHNS. The content of metal ions was calculated gravimetrically as metal oxides. 1H-NMR spectra were recorded in DMSO d6 solutions on a Bruker 850 MHz spectrometer using TMS as the internal standard. The mass susceptibility of the metal complexes was measured at room temperature using Gouy's method using a magnetic susceptibility balance from Johnson Matthey (Sherwood model). EPR spectra in the solid state were acquired using a continuous wave Bruker EMX PLUS spectrometer operating at an X band frequency (9.5 GHz). Thermogravimetric analysis TG–DTG experiments were conducted using a Mettler Toledo STARe thermal analysis system with the STARe software. All experiments were performed using a single loose top loading platinum sample pan under air at a flow rate of 30 ml min−1 and a 10 °C min−1 heating rate for the temperature range 25–800 °C.2.4. Theoretical aspects
The Gaussian 09 software package9 was used for the optimization calculations of the free ligand and its metal complexes. The DFT method using the hybrid density functional B3LYP was used with the 6-311G(d,p) for the ligand and the LANL2DZ basis set was used for the metal ions for the metal complexes in the gas phase. Vibrational frequencies were calculated to ensure that the optimized geometry corresponds to a true energy minimum. The calculated harmonic frequencies were scaled by a factor of 0.966 and 0.961 for 6-31G(d,p) and LANL2DZ basis set, respectively.10 GaussView software11 was used to visualize the output files and to prepare the figures showing the molecular orbitals (MOs). HOMO and LUMO energies were obtained and used to calculate essential quantum parameters using the following equations: energy gap (Egap = ELUMO − EHOMO), absolute electronegativities (χ = −EHOMO + ELUMO/2), absolute hardness (η = ELUMO − EHOMO/2), chemical potentials (μ = −χ), global softness (S = 1/2η), and global electrophilicity (ω = π2/2η).12,13 MEP maps were projected by applying the B3LYP/LANL2DZ level within DFT.2.5. Biological application
| [DNA]/(εa − εf) = [DNA]/(εb − εf) + 1/Kb(εa − εf). |
The slope-to-intercept ratio was collected by plotting [DNA]/(εb − εf) versus [DNA], which is the Kb value. The standard Gibbs free energy (ΔG) for DNA binding was evaluated from the following relationship: ΔG≠b = −RT![[thin space (1/6-em)]](https://www.rsc.org/images/entities/i_char_2009.gif) ln
ln![[thin space (1/6-em)]](https://www.rsc.org/images/entities/char_2009.gif) Kb,18 where R = 8.314 J K−1 mol−1 and T = 298 K.
Kb,18 where R = 8.314 J K−1 mol−1 and T = 298 K.
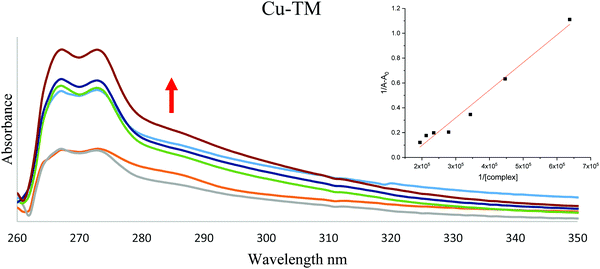
![[thin space (1/6-em)]](https://www.rsc.org/images/entities/char_2009.gif) 219 M−1 cm−1 at 280 nm using quartz cuvettes of 1 cm path-length. Complex solutions with 1.1 × 10⁻³ M−1 were prepared in DMS. The HSA concentration was kept constant during the titration experiment while the complex concentration was varied in the range 1.57 × 10⁻⁵ to 5.15 × 10⁻⁵ μM. The intrinsic binding constants (kb) of the metal complexes with HSA were calculated using the following equation:
219 M−1 cm−1 at 280 nm using quartz cuvettes of 1 cm path-length. Complex solutions with 1.1 × 10⁻³ M−1 were prepared in DMS. The HSA concentration was kept constant during the titration experiment while the complex concentration was varied in the range 1.57 × 10⁻⁵ to 5.15 × 10⁻⁵ μM. The intrinsic binding constants (kb) of the metal complexes with HSA were calculated using the following equation:where A0 and A are the absorbance of HSA at 280 nm in the absence and presence of the complex, respectively. εHSA and εb are the molar extinction coefficient of HSA and the HSA bound complex. The relation of 1/A − A0vs. 1/Ccomplex is linear and Kb could be estimated from the ratio of the intercept to the slope.
3. Results and discussion
3.1. Analytical and physical data
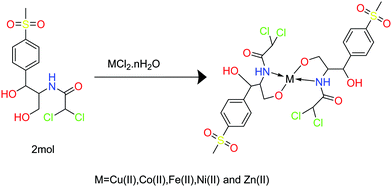
The new metal complexes were prepared by reacting the TM ligand with transition metal salts in ethanoic solution with the pH adjusted to 8.9 with KOH, Scheme 1. The prepared metal complexes were tested using elemental analysis, infrared spectroscopy (IR), 1H-NMR, UV-vis, conductometric measurements and magnetic susceptibility measurements, as well as density functional theory (DFT) analysis.The physical properties of TM and the metal complexes and elemental analysis are listed in Table 1. The colored solid TM complexes were stable in air, insoluble in some polar solvents, such as H2O and ethanol solvents, and readily soluble in DMSO and DMF. Moreover, they had low conductance values in DMF, 1 × 10⁻³ M, indicating that the complexes are neutral complexes.21 TM has two sites to coordinate to the metal ion as a bidentate ligand: the two hydroxyl groups or the oxygen and nitrogen atoms of the amide group.22 The calculated elemental values were in good agreement with the experimental results.
| Metal complex | M. wt., g mol−1 | Color | Elemental analysis % calc. (% found) | Λm, Ω cm2 mol−1 | Melting point, °C | ||||
|---|---|---|---|---|---|---|---|---|---|
| C | N | S | H | M | |||||
| TM | 356.22 | White | 40.50 (40.46) | 3.90 (3.93) | 8.90 (8.95) | 4.80 (4.78) | — | <1 | 165 |
| Cu(TM)2 | 771 | Dark gold | 37.34 (37.33) | 3. 63 (3.69) | 8.31 (8.35) | 3.40 (3.42) | 8.23 (8.26) | 3.13 | 212 |
| Co(TM)2 | 767.3 | Dim gray | 37.57 (37.53) | 3.60 (3.59) | 8.36 (8.36) | 3.40 (3.38) | 7.70 (7.71) | 3.13 | 326 |
| Ni(TM)2 | 767.1 | Pale green | 37.58 (37.60) | 3.60 (3.59) | 8.36 (3.36) | 3.41 (3.39) | 7.62 (7.70) | 20.31 | 227 |
| Fe(TM)2 | 764.2 | Dark red | 37.72 (37.70) | 3.64 (3.61) | 8.39 (8.35) | 3.42 (3.39) | 7.28 (7.30) | 1.56 | 207 |
| Zn(TM)2 | 773.8 | White | 37.25 (37.26) | 3.60 (3.62) | 8.45 (8.42) | 3.40 (3.41) | 8.45 (8.44) | 1.56 | 259 |
3.2. Infrared (IR) spectra
The IR spectra of TM and the Cu(II), Co(II), Fe(II), Ni(II) and Zn(II) complexes are shown in Fig. S1 (ESI†) while Table 2 illustrates the main bands and their assignments for the free TM ligand and its metal complexes. Experimentally, the bands observed between 3490 and 3450 cm−1 were assigned to stretching ν(OH) and ν(NH) in the free ligand spectrum. Upon complexation, both ν(OH)and ν(NH) frequency shifted to a higher frequency. Moreover, in the metal–TM complexes, ν(C![[double bond, length as m-dash]](https://www.rsc.org/images/entities/char_e001.gif) O) stretching was still present at 1690 cm−1, which revealed that it was not involved in metal coordination. The NH bending appearing at 1515 cm−1 showed a small shift with increasing intensity, which indicated the association of NH in the metal coordination. The free ligand had two strong bands in the C–O region, namely at 1186–1146 cm−1, which were assigned to the secondary and primary alcohol, respectively.7 The clear blue shift upon complexation for the CH–OH peak proved that the ligand coordinates to the metal through the hydroxyl group. The new bands in the IR spectra for all the metal–TM complexes in the 500–420 cm−1 range were assigned to the νM–O and νM–N bands.23,24
O) stretching was still present at 1690 cm−1, which revealed that it was not involved in metal coordination. The NH bending appearing at 1515 cm−1 showed a small shift with increasing intensity, which indicated the association of NH in the metal coordination. The free ligand had two strong bands in the C–O region, namely at 1186–1146 cm−1, which were assigned to the secondary and primary alcohol, respectively.7 The clear blue shift upon complexation for the CH–OH peak proved that the ligand coordinates to the metal through the hydroxyl group. The new bands in the IR spectra for all the metal–TM complexes in the 500–420 cm−1 range were assigned to the νM–O and νM–N bands.23,24
| Metal complex | C![[double bond, length as m-dash]](https://www.rsc.org/images/entities/char_e001.gif) O O |
NH | H2C–O primary | HC–O secondary | M–N | M–O |
|---|---|---|---|---|---|---|
| TM | 1690 (1692) | 1520 (1519) | 1086 (1090) | 1146 (1140) | — | — |
| Cu–TM | 1690 (1692) | 1515 (1490) | 1084 (1093) | 1141 (1137) | 504 (510) | 406 (396) |
| Co–TM | 1690 (1691) | 1514 (1485) | 1084 (1093) | 1142 (1138) | 504 (511) | 410 (396) |
| Ni–TM | 1689 (1691) | 1515 (1488) | 1084 (1093) | 1141 (1137) | 507 (511) | 406 (397) |
| Fe–TM | 1689 (1691) | 1515 (1490) | 1084 (1093) | 1140 (1136) | 506 (511) | 405 (396) |
| Zn–TM | 1689 (1691) | 1514 (1500) | 1084 (1093) | 1142 (1137) | 506 (511) | 406 (396) |
The theoretical spectra calculated with B3LYP/6-311G(d,p) for the ligand and using the LANL2DZ basis set for the metal complexes strongly correlated with the experimental bands as presented in Table 2 and the comparison spectra are shown in the ESI.†
3.3. Proton nuclear magnetic resonance (1H-NMR)
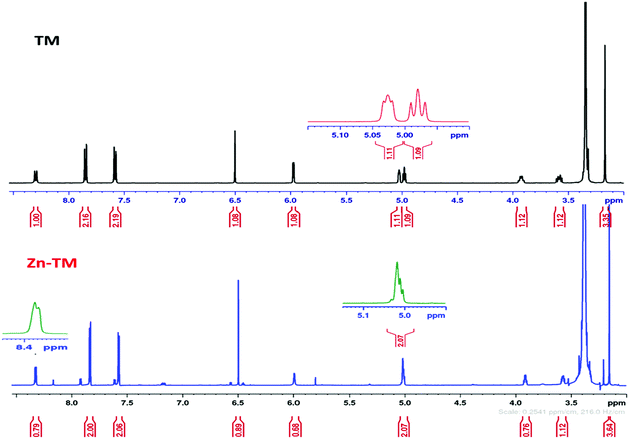
The spectral data of the free TM ligand and the Zn(II) complex were recorded in d6 dimethyl sulfoxide solvent and are presented in Fig. 1. The signals at 4.99–5.95 ppm represent the OH group in the free ligand7 for the primary and secondary alcohol, respectively. The primary alcohol at 4.99 ppm was affected via the metal magnet in the spectrum of Zn(TM)2 and vanished. This revealed that the coordination was through the oxygen atom of the OH groups. In contrast, the secondary OH was maintained at 5.95 ppm. Additionally, the NH signal in the 1H-NMR spectrum of the ligand at 8.31 ppm appeared at the same position with a slight shift and showed a change in multiplicity from a doublet to a singlet. The characteristic signals for the free TM ligand and the metal complexes are presented in Table 3.| Assignments | δ (ppm) free TM | δ (ppm) Zn–TM |
|---|---|---|
| –CH3 | 3.16 | 3.16 |
–![[C with combining low line]](https://www.rsc.org/images/entities/char_0043_0332.gif) ![[H with combining low line]](https://www.rsc.org/images/entities/char_0048_0332.gif) ![[2 with combining low line]](https://www.rsc.org/images/entities/char_0032_0332.gif) –OH –OH |
3.6 | 3.56 |
![[C with combining low line]](https://www.rsc.org/images/entities/char_0043_0332.gif) ![[H with combining low line]](https://www.rsc.org/images/entities/char_0048_0332.gif) –N –N |
3.94 | 3.93 |
–CH2–![[O with combining low line]](https://www.rsc.org/images/entities/char_004f_0332.gif) ![[H with combining low line]](https://www.rsc.org/images/entities/char_0048_0332.gif) |
4.99 | — |
![[C with combining low line]](https://www.rsc.org/images/entities/char_0043_0332.gif) ![[H with combining low line]](https://www.rsc.org/images/entities/char_0048_0332.gif) –OH –OH |
4.97 | 5.1 |
CH–![[O with combining low line]](https://www.rsc.org/images/entities/char_004f_0332.gif) ![[H with combining low line]](https://www.rsc.org/images/entities/char_0048_0332.gif) |
5.97 | 5.97 |
COC![[H with combining low line]](https://www.rsc.org/images/entities/char_0048_0332.gif) Cl2 Cl2 |
6.5 | 6.5 |
| Ar | 7.85–7.58 | 7.85–7.58 |
| NH | 8.31 | 8.32 |
3.4. Magnetic susceptibility and the electronic spectra
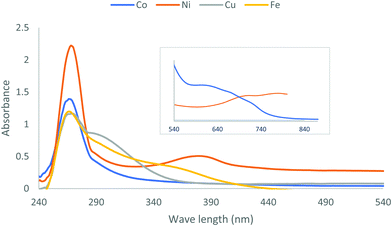
Electronic absorption spectroscopy was performed in DMSO solution at room temperature for TM as a free ligand and the colored divalent metal complexes; the Ni(II), Co(II), Cu(II) and Fe(II) complexes are shown in Fig. 2. The essential maximum peaks for the ligand at 266 and 339 nm were due to the transitions n → π* and π → π*, respectively, which were absorbed within the amide group7 and shifted to high or low wavelengths after complexation.The Ni–TM compound presented two bands, at 14.286 and 12.820 cm−1, which were assigned to the transitions 3T2(F) → 3A2 and 3T1(F) → 3T1(P), respectively. These bands demonstrate an intermediate structure between a square planar and a tetrahedral geometry.25,26 Moreover, the effective magnetic moment (μeff) of 1.29 BM for the Ni–TM compound verified this result.27 The Fe(II) complex had a tetrahedral structure and paramagnetic nature (μeff = 4.63 BM), which usually indicates electronic transitions in the near-infrared region.28,29 We attributed the complex color to an electron transition located by an obscured band that overlapped with 390 nm, which was assigned to charge transfer transitions from the metal to empty orbitals of the ligand, causing the intensely colored complex.30 The Co–TM compound presented two bands at 550–667 nm corresponding to 4A2 → 4T1(P) and 4A2 → 4T1(F). Although the electronic spectra of tetrahedral Co(II) always show three spin-allowed transitions, the transition of 4A2 → 4T1(F) often dominates.27 Moreover, the obtained magnetic moment value for Co(II) was in the reported range of the tetrahedral geometry.27 The Cu(II) complex displayed one prominent broad band at 10![[thin space (1/6-em)]](https://www.rsc.org/images/entities/char_2009.gif) 917 cm−1, which we assigned to the d → d transition.31 The Zn(II) complex was diamagnetic in nature and has a tetrahedral structure. Table 4 summarizes the main electronic bands and the assignments for the Ni(II) and Co(II) metal complexes.
917 cm−1, which we assigned to the d → d transition.31 The Zn(II) complex was diamagnetic in nature and has a tetrahedral structure. Table 4 summarizes the main electronic bands and the assignments for the Ni(II) and Co(II) metal complexes.
| Complex | Bands nm (cm−1) | Assignment | Magnetic moment (B.M.) | ||
|---|---|---|---|---|---|
| V | V3 | V2 | |||
| Co(TM)2 | 400 (25.000) | 558 (18![[thin space (1/6-em)]](https://www.rsc.org/images/entities/char_2009.gif) 000) 000) |
631 (16![[thin space (1/6-em)]](https://www.rsc.org/images/entities/char_2009.gif) 000) 000) |
4A2 → 4T1(P), 4A2 → 4T1(F) | 4.63 |
| Ni(TM)2 | 377 (26![[thin space (1/6-em)]](https://www.rsc.org/images/entities/char_2009.gif) 525) 525) |
700 (14.286) | 780 (12.820) | 3A2g → 3T2g, 3A2g → 3T1g | 1.29 |
3.5. Electron paramagnetic resonance analysis (EPR)
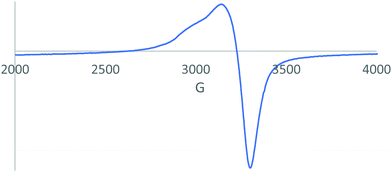
Electron spin resonance (ESR), also known as electron paramagnetic resonance (EPR), is a powerful analytical tool that selectively detects species with unpaired electrons such as paramagnetic transition metal complexes like copper and iron complexes32,33 and organic free radicals.34–37 In addition to structural information, EPR spectra provide important information on the atoms that coordinate with the transition metal.38–40 The solid sample spectrum of the Cu–TM compound obtained in X-band EPR spectroscopy at room temperature is shown in Fig. 3. Based on the g-values, it showed a characteristic axial symmetry with g‖ (2.32) and g⊥ (2.07) > 2.0023 and is a distorted tetrahedron.41 Therefore, the ground state will be dx2−y2 and has a highest half-occupied orbital that repels the ligand in the equatorial plane.42,43 The gav value, calculated by the equation gav = (g‖ + 2g⊥)/3,44,45 was 2.14 and indicates a covalent environment around the Cu(II) metal ion.46 To study the exchange interaction between the Cu(II) ions in a powder solid sample, the G value was computed using42,47G = (g‖ − ge)/(g⊥ − ge)
According to the reported literature, if G is between 3 and 5, then the magnetic environment in the cell is equivalent; if 5 < G < 3, then the exchange coupling in the unit cell is not equivalent.48 The calculated value of G = 4.27 reflects that the exchange interaction is negligible between the Cu(II) ions.44,48
3.6. Thermal analysis (TGA)
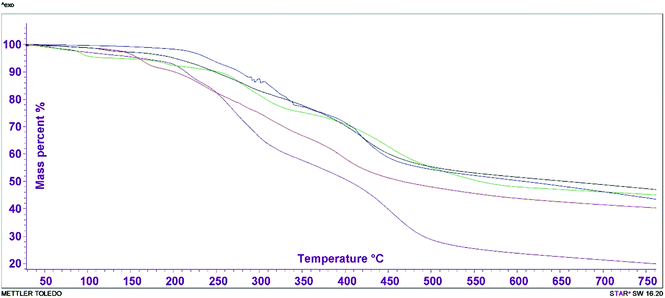
The crystal water content in the complexes and the mass loss percentage for the transition metal coordination complexes were studied by a thermal technique in order to analyze their stability. All the metal–TM complexes had a similar decomposition step over the temperature range 70–500 °C, with the exception of the Co(II) and Zn(II) compounds. In atmospheric air, Cu–TM, Fe–TM and Ni–TM were stable up to ∼119 °C and the decomposition occurred in three stages. The first decomposition stage began with the loss of HCl in the range 150–200 °C. The formed compounds underwent further decomposition from 207 to 280 °C with a mass loss percentage range of 20–30%. The final stage started between 350 and 600 °C, and the maximum temperature produced a metal oxide as the final product.In contrast, the Co(II) compound showed only two decomposition steps. In the first step, starting at 147–246 °C, it lost 20.7% of its mass. The second step occurred at 327–436 °C, with a gradual but minor mass loss that resulted in a metal oxide with 45.85%. Interestingly, Zn–TM was stable up to ∼260 °C in atmospheric air; then it decomposed in a single stage. The decomposition was indicated by the DTG peak and the corresponding endothermic reaction. All the final products had some amount of hydrocarbon with the metal oxide as the final residue. The thermal degradation behavior of the metal complexes is presented in Fig. 4. The thermal mass loss and decomposition stages are illustrated in Table 6. These results agree with the speculated formulas for the coordinated compounds.
3.7. Thermodynamics
The thermodynamic parameters of the ligand and complexes were calculated by employing two methods, the Coast–Redfern integral49 and the approximation of Horowitz–Metzger,50 to obtain the activation energy (Ea). Next, thermodynamic activation parameters, namely the activation enthalpy (ΔH), activation entropies (ΔS) and ΔG Gibbs free energy, were calculated using the relationships| ΔH = E − RT, |
| ΔS = R[In(Ah/kT)] |
| ΔG = ΔH − TΔS, |
The thermodynamic behavior of all complexes of TM with transition metal ions is a non-spontaneous and slow reaction due to the negative values of ΔS.51,52 The Ea values increased at the second stage for all compounds, and then reduced after degradation, which indicates high stability of the complexes. Moreover, the reactions were endothermic (ΔH > 0) and endergonic (ΔG > 0) (Table 5).53
| Complex | Step | Temp. range | Weight loss % found (calc.) | Assignments | Total mass loss/% found (calc.) | Final solid state residue |
|---|---|---|---|---|---|---|
| Cu–TM | 1st | 166–200 | 12.7 (12.9) | Cl2 + CO | 65.9(66.3) | CuO + 10C, 25.6(25.69) |
| 2nd | 252–305 | 24.5 (24.9) | C5H6 + 2NO + 2HCl | |||
| 3rd | 310–454 | 28.7 (29) | 2CO2 + 2SO2 + H2O + C2H2 | |||
| Fe–TM | 1st | 169–202 | 9.1 (9.3) | 2HCl | 66.4(67.0) | Fe2O3 + 10C, 35.7(36) |
| 2nd | 207–218 | 28.3 (28.6) | 4C2H2 + 2NO + 2HCl | |||
| 3rd | 352–390 | 29 (29.1) | 2SO2 + 2CO2 | |||
| Ni–TM | 1st | 164–220 | 9.3 (9.4) | 2HCl | 65.4(66.7) | NiO + 12C, 32.3(32.9) |
| 2nd | 227–379 | 21.9 (22) | 2HCl + 2NO + 2C2H2 | |||
| 3rd | 384–664 | 33.5 (34) | 2C2H2 +2SO2 + 2CO2 | |||
| Co–TM | 1st | 147–246 | 20.3 (20.7) | 2NO+ 2HCl + C2H4 | 46.7(46.9) | CoO + 12C, 45.85(45.6) |
| 2nd | 327–436 | 26.4 (26.2) | 2CO2 + 2SO2 + 2HCl | |||
| Zn–TM | One step | 259–303 | 51.9 (52.5) | 7C2H2 + 2SO2 + 2NO + 4HCl + 4H2O | 51.9(52.5) | ZnO + 10C, 33.61(33.6) |
3.8. Molecular orbital calculations
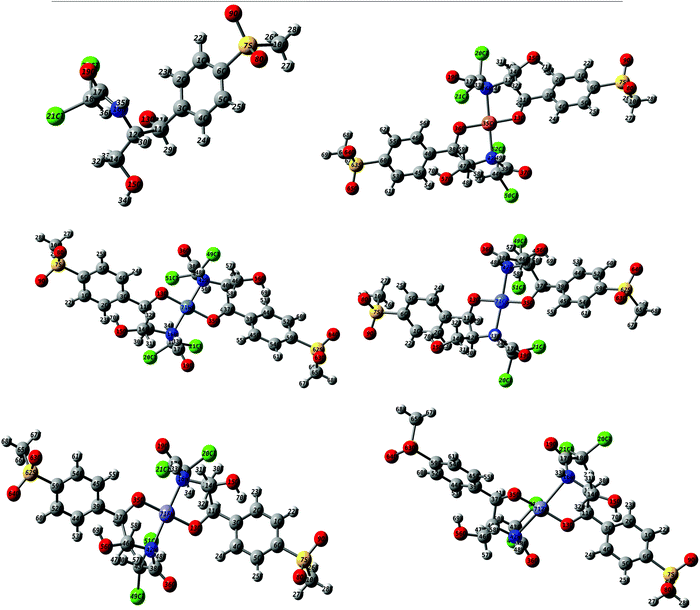
Selected geometric parameters around the coordination sphere were extracted as bond lengths and bond angles for the free ligand and its metal complexes and are tabulated in Table 6.
| TM | Cu–TM | Co–TM | Ni–TM | Fe–TM | Zn–TM | |
|---|---|---|---|---|---|---|
| Bond lengths | ||||||
| C11–C12 | 1.55 | 1.56 | 1.58 | 1.57 | 1.57 | 1.58 |
| C12–C14 | 1.53 | 1.54 | 1.54 | 1.54 | 1.54 | 1.54 |
| C12–N16 | 1.48 | 1.51 | 1.51 | 1.53 | 1.52 | 1.49 |
| C11–O13 | 1.46 | 1.38 | 1.38 | 1.39 | 1.39 | 1.39 |
| N16–M | — | 2.16 | 1.99 | 1.95 | 2.03 | 2.46 |
| O13–M | — | 1.84 | 1.81 | 1.92 | 1.84 | 1.82 |
| O35–M | — | 1.84 | 1.81 | 1.82 | 1.85 | 1.82 |
| N43–M | — | 2.16 | 1.99 | 1.96 | 2.08 | 2.40 |
| Bond angles | ||||||
| O13–C11–C12 | 107 | 110.67 | 110.23 | 110.76 | 110.63 | 110.49 |
| N16–C12–C11 | 105 | 106.81 | 107.0 | 105.59 | 108.89 | 108.31 |
| O13–M–N16 | — | 84.35 | 88.36 | 87.9 | 86.14 | 80.80 |
| O13–M–N43 | — | 95.02 | 92.5 | 92.39 | 93.82 | 101.45 |
| N42–M–O35 | — | 84.84 | 84.12 | 87.35 | 85.43 | 81.65 |
| N16–M–O35 | 95.35 | 94.6 | 92.30 | 94.21 | 100.05 | |
| Dihedral angles | ||||||
| M–O13–C11–H29 | — | −63.25 | −66.9 | −71.86 | −88.79 | −64.69 |
| M–O35–C38–H42 | — | −66.89 | −70.7 | −68.45 | −72.83 | −63.20 |
| M–O13–C11–C12 | — | 53.54 | 29.26 | 45.16 | 28.74 | −52.76 |
| M–N16–C12–C11 | — | 22.16 | 27.35 | 24.77 | 35.16 | 31.08 |
| M–N43–C41–C38 | — | 26.68 | 25.68 | 20.20 | 29.81 | 25.88 |
In the metal complexes, the bond lengths of C11–O12 and C12–C14 were longer than the free ligand by 0.01–0.02 Å. The bond length of C11–O13 was compressed after coordination to the metal ions while C12–N16 elongated after binding to the metal. The M–O bonds between the metal and free ligand site were in the reported metal to oxygen range,54 which reflected the ionic character of these bonds. In contrast, the covalent bond between the metal and NH group showed a range of small and medium ionic character (bond length ≥ 2 Å).
There was a practical change of the bond angles after coordination with the transition metals. The bond angles O13–C11–C12 and N16–C12–C11 increased by 0.03–0.04° due to the electric repulsion after complexing. Moreover, the angles around the respective central metal ion indicated that the complex adopted a distorted tetrahedral geometry,55,56 as observed for Cu(II) and Zn(II), and the values of the bond angles of O–M–N emphasized this distortion. The complexes of Fe(II), Ni(II) and Co(II) suggested a highly distorted tetrahedral arrangement around the metal.
In addition, the dihedral angles around the metal ions were far from 0° or 180°. Thus, the metal ions in the studied compounds are not in the same molecular plane as the donating sites.
| Compound | HUMO | LUMO | ΔE | x | η | Pi | σ | S | ω | ΔNmax |
|---|---|---|---|---|---|---|---|---|---|---|
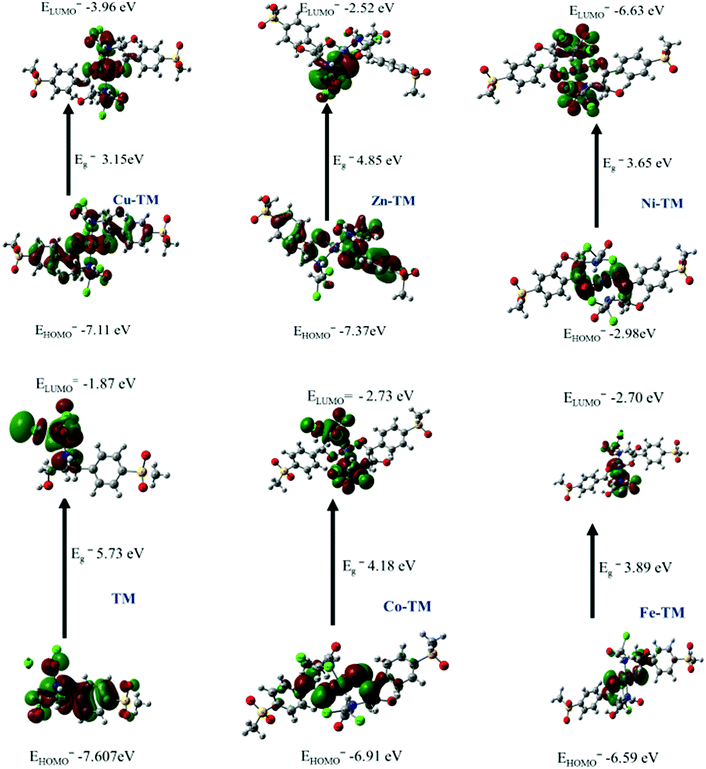
| TM | −7.61 | −1.87 | 5.73 | 4.74 | 2.87 | −4.74 | 0.35 | 1.43 | 3.92 | 1.65 |
| Ni–TM | −6.64 | −2.98 | 3.65 | 4.81 | 1.83 | −4.81 | 0.91 | 0.91 | 2.40 | 2.63 |
| Co–TM | −6.91 | −2.73 | 4.18 | 4.82 | 2.09 | 0.48 | −4.82 | 1.05 | 1.05 | 2.41 |
| Zn–TM | −7.37 | −2.53 | 4.85 | 4.95 | 2.42 | −4.95 | 1.21 | 1.21 | 2.48 | 2.04 |
| Cu–TM | −7.12 | −3.97 | 3.15 | 5.54 | 1.57 | −5.54 | 1.30 | 0.79 | 2.77 | 3.52 |
| Fe–TM | −6.59 | −2.70 | 3.89 | 4.64 | 1.95 | −4.64 | 0.97 | 0.97 | 2.32 | 2.38 |
| TM | Cu–TM | Co–TM | Ni–TM | Fe–TM | Zn–TM | |
|---|---|---|---|---|---|---|
| O13 | −0.765 | −0.933 | −0.854 | −0.867 | −0.894 | −1.00 |
| O15 | −0.786 | −0.716 | −0.795 | −0.715 | −0.715 | −0.714 |
| N16 | −0. 592 | −0.762 | −0.863 | −0.747 | −0.754 | −0.741 |
| O19 | −0.636 | −0.929 | −0.796 | −0.492 | −0.501 | −0.540 |
| M | — | 1.344 | 0.767 | 1.09 | 1.204 | 1.568 |
| Complex | Natural population | Natural electronic configuration | ||||
|---|---|---|---|---|---|---|
| Natural charge | Core | Valence | Rydberg | Total | ||
| Cu–TM | 0.50 | 74.98 | 121.62 | 0.678 | 197 | [core]4S0.363d9.294p0.015p 0.01 |
| Co–TM | 0.50 | 74.98 | 120.61 | 0.396 | 196 | [core]4S0.163d7.265P0.18 |
| Ni–TM | 0.01 | 149.96 | 243.24 | 1.35 | 394 | [core]4S0.363d8.534p0.015S0.36 |
| Fe–TM | −1.0 | 74.98 | 119.34 | 0.673 | 195 | [core]4S0.343d6.444p0.01 |
| Zn–TM | 0.01 | 149.97 | 245.20 | 1.34 | 396 | [core]4S0.493d9.924p0.01S50.01 |
In the TM ligand, most electronegative charges were found positioned on the oxygen of sulfonyl, primary and secondary alcohol, and carboxamide. The two alcohol oxygens were more electronegative (−0.765, −0.786) than the carboxamide group (−0.636, −0. 592) and could be possible donating atoms that could react with the electropositive metal ions Cu(II), Co(II), Ni(II), Fe(II) and Zn(II) by ionic bonds. In this complex, the NH group donated its electron via a covalent bond.
All the studied first row transition metal ions in the complexes have a +2 oxidation state, but the calculated natural charges for Cu+0.50, Ni+0.01, Zn+0.01 and Co+0.50 were lower than +2 due to receipt of electrons from the ligand.55 Additionally, Table 9 shows that the metal ions received varied electrons from the ligand: the highest ion that received 1.43e was Zn(d9.53), while Ni–TM(d8.53) received 1.26e, and Cu–TM(d9.29) had fewer electrons (0.67). Co–TM(d3.26) was > Fe–TM and received 0.79e (d6.44) from the ligand.
3.9. Biological studies
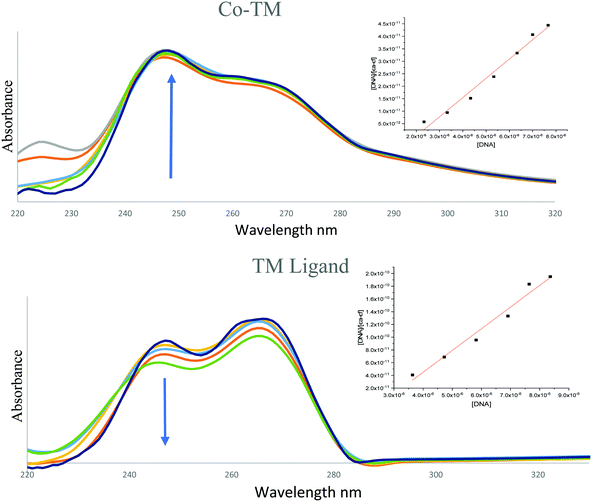 | ||
| Fig. 7 The hypochromic and hyperchromic reactions of (a) Co–TM and (b) the TM ligand (arrows indicate changes with increasing DNA concentration). | ||
(1) The modification of the structure of the target DNA after adding the metal complexes.59
(2) Charged cations in the process bind to the phosphate group in DNA by electrostatic attraction, thus damaging the secondary structure of the DNA.60
(3) Unraveling of the helix structure of DNA by external contact or partial effects, causing more bases of the DNA to unravel.61
However, the TM ligand and the Fe(II) complex had adverse behavior as well, showing a blue shift and hypochromic absorptivity, indicating weak intercalation to the base pairs of DNA62 (Fig. 7b).
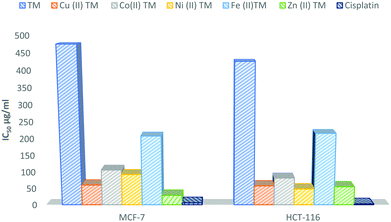
The computed binding constant (Kb) and absorption data of the metal–TM complexes are listed in Table S4 (ESI†). According to the literature, the range of 105–1011 reflects an intercalator binding type, which is less cytotoxic and could be promising therapeutically.59,63 The ΔG values indicate high spontaneous binding of the metal compounds to DNA.18 The investigated compounds in order of intercalative mode are arranged as follows: Zn(II) > Cu(II) > Ni(II).
| Complex | S.D. (±) | IC50 (μg ml−1) | ||
|---|---|---|---|---|
| MCF-7 | HCT-116 | MCF-7 | HCT-116 | |
| TM | 3.84 | 3.79 | 475 ± 9.8 | 426 ± 9.2 |
| Cu–TM | 0.78 | 0.95 | 48.8 ± 0.92 | 60.5 ± 1.8 |
| Ni–TM | 1.31 | 0.94 | 92.5 ± 2.7 | 57.5 ± 1.5 |
| Zn–TM | 0.69 | 0.73 | 28.6 ± 0.38 | 55.2 ± 1.6 |
| Co–TM | 0.97 | 0.87 | 106 ± 1.9 | 81.6 ± 2.1 |
| Fe–TM | 1.82 | 2.93 | 208 ± 4.3 | 216 ± 4.5 |
| Cisplatin | 0.12 | 0.07 | 5.71 | 2.43 |
Tables S5 and S6 (ESI†) reveal the following results:
(1) Both complexes have a higher negative score of free binding energy than the free ligand, indicating that the metal ion overlapped with the ligand orbitals upon chelation and reduced the metal polarity, thus increasing the lipophilicity and penetration through the lipid plasma membrane.69–71
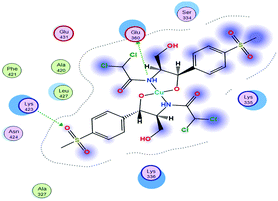
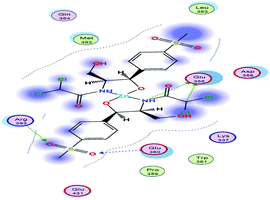
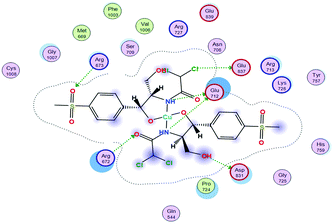
(2) The docking score values for Cu(II) and Zn(II) against colon receptors were −8.18 and −9.22 kcal mol−1, respectively.
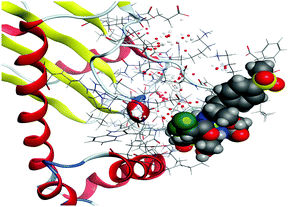
(3) The colon protein (4FM9) interacted via amino acid pocket molecules with Cu(II) through SO2 oxygen and NH groups by donating their H atoms or accepting H atoms. The H contact between the methyl group in Zn–TM and an amino residue increased the binding with this protein compared to the Cu(II) complex.
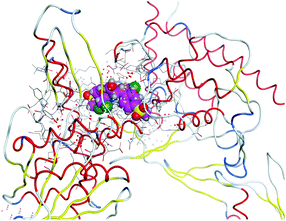
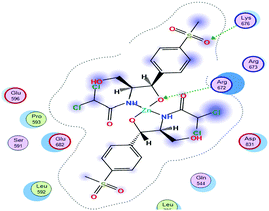
(4) Similarly, the breast protein (1H7K) docking score was −7.09 kcal mol−1, which resulted in the interaction with the Cu–TM complex by donating different amino acid hydrogens forming H bonds with Cl and O ions and the two NH groups, whereas Zn–TM showed H-accepting interactions with ARG 672 and Lys 675, as shown in Table 11.
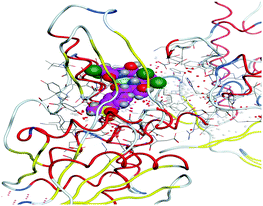
(5) Increasing the interaction between the complex molecules and the receptors might increase the docking scores and prove the in vitro inhibition activities (Table S6, ESI†). The best possible conformations of the two compounds inside the protein minor groove are presented in Table 11.
4. Conclusion
New complexes of divalent transition metals of the antibiotic thiamphenicol were successfully synthesized. All prepared complexes were characterized by various analytical techniques such as IR, EPR, elemental analysis, and thermal analysis. The IR and 1H-NMR results confirmed that a metal cation was coordinated to the one deprotonated alcohol and NH atom. The electronic spectrum of the Ni–TM complex at 14.286 and 12.820 cm−1 and the low magnetic moment value indicated the square planar geometry around the ion metal. The electronic spectrum of the Fe–TM complex did not show absorption in the UV-vis range, which indicates a tetrahedral geometry. The observed color of the complex is due to the charge transfer transitions, which presented as an overlapped band at 390 nm in the spectrum. The solid sample of Cu(II) displayed g‖ (2.32) > g⊥ (2.07) values, indicating a distorted tetrahedral complex. The DFT study showed that Zn(II) has a distorted tetrahedral geometry. The lower values of the energy gap, Eg, for the complexes indicated that the complexes are more reactive than the free ligand. Among the prepared complexes, Cu(II) showed the highest softness and electrophilicity, which could indicate favourable biological activity. Moreover, kinetic data collected from the thermal study showed high-stability compounds by increasing the Ea value with an endothermic reaction (ΔG > 0) through the decomposition process.The binding constant (Kb) and Gibbs free energy (ΔG) values from the DNA-binding study for the metal complexes and the free ligand revealed an intercalation binding mode with high unprompted binding. The addition of the Cu–TM compound resulted in hyperchromism in the HSA absorption peak, while Zn–TM showed hypochromism and practical binding to the HSA protein, 9.87 × 10⁵ M−1. The zinc-based and copper-based TM complexes showed good cytotoxic activity against the MCF-7 and HCT-116 cancer cell lines. The energy scores of the molecular docking study of the ligand and its zinc-based and copper-based complexes were in good agreement with the experimental results.
Author contributions
Synthesis and characterization, A. A. S; supervision and writing original draft preparation, M. A. A.; EPR analysis, A. E.; writing, review and editing; A. E. and M. J. All authors have read and agreed to the published version of the manuscript.Conflicts of interest
The authors declare no competing financial interest.Acknowledgements
We thank King Fahad Medical Research Center for the use of their facilities and also thank King Abdullah University of Science and Technology (KAUST) for their financial support. The simulations in this work were performed at King Abdulaziz University's High-Performance Computing Center (Aziz Supercomputer) (http://hpc.kau.edu.sa).References
- S. Rafique, M. Idrees, A. Nasim, H. Akbar and A. Athar, Transition metal complexes as potential therapeutic agents, Biotechnol. Mol. Biol. Rev., 2010, 5(2), 38–45 CAS.
- L.-F. Li, H. Wang, J. Zhang, C. Ma, Y.-Y. Li, L. Wang, S.-K. Liang, H.-T. Jin, S.-J. Liu and M.-C. Zhu, Syntheses, characterization, interaction with DNA, cytotoxic and apoptosis of two novel complexes of Zn(II) and Mn(II) with 2-methyl-1H-4,5-imidazoledicarboxylic acid, Eur. J. Med. Chem., 2015, 92, 295–301 CrossRef CAS PubMed.
- R. M. Roat-Malone, Bioinorganic chemistry: a short course, John Wiley & Sons, 2007 Search PubMed.
- F. Tisato, C. Marzano, M. Porchia, M. Pellei and C. Santini, Copper in diseases and treatments, and copper-based anticancer strategies, Med. Res. Rev., 2010, 30(4), 708–749 CAS.
- H. Sahyon, A. El-Bindary, A. Shoair and A. Abdellatif, Synthesis and characterization of ruthenium(III) complex containing 2-aminomethyl benzimidazole, and its anticancer activity of in vitro and in vivo models, J. Mol. Liq., 2018, 255, 122–134 CrossRef CAS.
- H. C. Neu and K. P. Fu, In vitro activity of chloramphenicol and thiamphenicol analogs, Antimicrob. Agents Chemother., 1980, 18(2), 311–316 CrossRef CAS PubMed.
- G. Indrayanto, D. L. Trisna, M. H. Santosa, R. Handajani, T. Agustono and P. Sucipto, Thiamphenicol, Analytical Profiles of Drug Substances and Excipients, Elsevier, 1993, vol. 22, pp. 461–488 Search PubMed.
- O. A. El-Gammal, F. S. Mohamed, G. N. Rezk and A. A. El-Bindary, Synthesis, characterization, catalytic, DNA binding and antibacterial activities of Co(II), Ni(II) and Cu(II) complexes with new Schiff base ligand, J. Mol. Liq., 2021, 326, 115223 CrossRef CAS.
- M. Frisch, G. Trucks, H. B. Schlegel, G. E. Scuseria, M. A. Robb, J. R. Cheeseman, G. Scalmani, V. Barone, B. Mennucci and G. Petersson, Gaussian 09, Revision D. 01, Gaussian Inc., Wallingford CT, 2009, p. 201 Search PubMed.
- N. I. o. Standards, Technology, Precomputed Vibrational Scaling Factors, 2018.
- R. Dennington, T. Keith and J. Millam, GaussView, Version 4.1.2. Semichem Inc., Shawnee Mission, KS 2007.
- A. A. Sharfalddina, A.-H. Emwasb, M. Jaremkoc and M. A. Hussien, Transition Metal Complexes of 6-Mercaptopurine; Characterization, DFT Calculation, DNA binding, Molecular Docking, and Anticancer Activity, Appl. Organomet. Chem., 2020, 35(1), e6041 Search PubMed.
- A. Sharfalddin, B. Davaasuren, A.-H. Emwas, M. Jaremko, Ł. Jaremko and M. Hussien, Single crystal, Hirshfeld surface and theoretical analysis of methyl 4-hydroxybenzoate, a common cosmetic, drug and food preservative—Experiment versus theory, PLoS One, 2020, 15(10), e0239200 CrossRef CAS PubMed.
- A. A. Sharfalddin, A.-H. M. Emwas, M. Jaremko and M. A. Abdulala, Practical and Computational studies of Bivalence Metal Complexes of Sulfaclozine and Biological Studies, Front. Chem., 2021 Search PubMed , in press.
- L. H. Abdel-Rahman, A. M. Abu-Dief and A. A. H. Abdel-Mawgoud, Development, structural investigation, DNA binding, antimicrobial screening and anticancer activities of two novel quari-dentate VO(II) and Mn(II) mononuclear complexes, J. King Saud Univ., Sci., 2019, 31(1), 52–60 CrossRef.
- A. Wolfe, G. H. Shimer Jr and T. Meehan, Polycyclic aromatic hydrocarbons physically intercalate into duplex regions of denatured DNA, Biochemistry, 1987, 26(20), 6392–6396 CrossRef CAS PubMed.
- L. H. Abdel-Rahman, M. S. S. Adam, A. M. Abu-Dief, H. Moustafa, M. T. Basha, A. S. Aboraia, B. S. Al-Farhan and H. E. S. Ahmed, Synthesis, theoretical investigations, biocidal screening, DNA binding, in vitro cytotoxicity and molecular docking of novel Cu(II), Pd(II) and Ag(I) complexes of chlorobenzylidene Schiff base: Promising antibiotic and anticancer agents, Appl. Organomet. Chem., 2018, 32(12), e4527 CrossRef.
- D. Sabolová, M. Kožurková, T. Plichta, Z. Ondrušová, D. Hudecová, M. Šimkovič, H. Paulíková and A. Valent, Interaction of a copper(II)–Schiff base complexes with calf thymus DNA and their antimicrobial activity, Int. J. Biol. Macromol., 2011, 48(2), 319–325 CrossRef.
- M. Mokhtar, T. S. Saleh, N. S. Ahmed and A. S. Al-Bogami, A Green Mechanochemical One-Pot Three-Component Domino Reaction Synthesis of Polysubstituted Azoloazines Containing Benzofuran Moiety: Cytotoxic Activity Against HePG2 Cell Lines, Polycyclic Aromat. Compd., 2018, 1–15 Search PubMed.
- G. A. Fawzy, H. Y. Al Ati and A. A. El Gamal, Chemical composition and biological evaluation of essential oils of Pulicaria jaubertii, Pharmacogn. Mag., 2013, 9(33), 28 CrossRef CAS.
- I. Ali, W. A. Wani and K. Saleem, Empirical formulae to molecular structures of metal complexes by molar conductance, Synth. React. Inorg., Met.-Org., Nano-Met. Chem., 2013, 43(9), 1162–1170 CrossRef CAS.
- G. Fazakerley, P. W. Linder and L. Nassimbeni, Complexation of copper(II) by chloramphenicol, Inorg. Nucl. Chem. Lett., 1973, 9(10), 1069–1072 CrossRef CAS.
- L. H. Abdel-Rahman, A. M. Abu-Dief, H. Moustafa and S. K. Hamdan, Ni(II) and Cu(II) complexes with ONNO asymmetric tetradentate Schiff base ligand: synthesis, spectroscopic characterization, theoretical calculations, DNA interaction and antimicrobial studies, Appl. Organomet. Chem., 2017, 31(2), e3555 CrossRef.
- L. H. Abdel-Rahman, A. M. Abu-Dief, R. M. El-Khatib and S. M. Abdel-Fatah, Some new nano-sized Fe(II), Cd(II) and Zn(II) Schiff base complexes as precursor for metal oxides: Sonochemical synthesis, characterization, DNA interaction, in vitro antimicrobial and anticancer activities, Bioorg. Chem., 2016, 69, 140–152 CrossRef CAS PubMed.
- R. J. Alvarez-Mendez, S. Escalante, J. M. Fernández-G, S. Hernández-Ortega, R. Salcedo and A. Vela, The square-planar structure of bis [N-(i-propyl)-3-oxy-2-naphthaldiminato] copper(II), J. Coord. Chem., 2014, 67(14), 2405–2414 CrossRef CAS.
- J. K. Burdett, A New Look at Structure and Bonding in Transition Metal Complexes, in Advances in Inorganic Chemistry and Radiochemistry, Academic Press, 1978, vol. 21, pp. 113–146 Search PubMed.
- A. Mohammad, C. Varshney and S. A. Nami, Synthesis, characterization and antifungal activities of 3d-transition metal complexes of 1-acetylpiperazinyldithioc arbamate, M (acpdtc) 2, Spectrochim. Acta, Part A, 2009, 73(1), 20–24 CrossRef PubMed.
- E. J. Hawrelak, W. H. Bernskoetter, E. Lobkovsky, G. T. Yee, E. Bill and P. J. Chirik, Square planar vs tetrahedral geometry in four coordinate iron(II) complexes, Inorg. Chem., 2005, 44(9), 3103–3111 CrossRef CAS PubMed.
- D. Forster and D. Goodgame, Preparation and electronic spectra of some tetrahedral complexes of iron(II), J. Chem. Soc., 1965, 454–458 RSC.
- P. Gütlich, J. Jung and H. A. Goodwin, Spin transitions in Iron(II) complexes, in Molecular Magnetism: from molecular assemblies to the devices, Springer, 1996, pp. 327–378 Search PubMed.
- A. M. Abu-Dief and L. A. Nassr, Tailoring, physicochemical characterization, antibacterial and DNA binding mode studies of Cu(II) Schiff bases amino acid bioactive agents incorporating 5-bromo-2-hydroxybenzaldehyde, J. Iran. Chem. Soc., 2015, 12(6), 943–955 CrossRef CAS.
- M. A. Haque, A. N. Gandi, R. Mohanraman, Y. K. Weng, B. Davaasuren, A. H. Emwas, C. Combe, D. Baran, A. Rothenberger, U. Schwingenschlogl, H. N. Alshareef, S. Dong and T. Wu, A 0D Lead-Free Hybrid Crystal with Ultralow Thermal Conductivity, Adv. Funct. Mater., 2019, 29, 13 CrossRef.
- I. M. Kooter, R. A. Steiner, B. W. Dijkstra, P. I. van Noort, M. R. Egmond and M. Huber, EPR characterization of the mononuclear Cu-containing Aspergillus japonicus quercetin 2,3-dioxygenase reveals dramatic changes upon anaerobic binding of substrates, Eur. J. Biochem., 2002, 269(12), 2971–2979 CrossRef CAS PubMed.
- S. M. Mattar, A. H. Emwas and L. A. Calhoun, Spectroscopic studies of the intermediates in the conversion of 1,4,11,12-tetrahydro-9,10-anthraquinone to 9,10-anthraquinone by reaction with oxygen under basic conditions, J. Phys. Chem. A, 2004, 108(52), 11545–11553 CrossRef CAS.
- J. Al-Nu'airat, B. Z. Dlugogorski, I. Oluwoye, X. P. Gao and M. Altarawneh, Effect of Fe2O3 nanoparticles on combustion of coal surrogate (Anisole): Enhanced ignition and formation of persistent free radicals, Proc. Combust. Inst., 2019, 37(3), 3091–3099 CrossRef.
- G. D. Fang, X. R. Chen, W. H. Wu, C. Liu, D. D. Dionysiou, T. T. Fan, Y. J. Wang, C. Y. Zhu and D. M. Zhou, Mechanisms of Interaction between Persulfate and Soil Constituents: Activation, Free Radical Formation, Conversion, and Identification, Environ. Sci. Technol., 2018, 52(24), 14352–14361 CrossRef CAS PubMed.
- S. M. Mattar, A. D. Stephens and A. H. Emwas, Generation and spectroscopic characterization of the 2,3,5,6-tetramethoxy-1,4-benzosemiquinone reactive intermediate, Chem. Phys. Lett., 2002, 352(1-2), 39–47 CrossRef CAS.
- A. I. Poddel'sky, V. K. Cherkasov and G. A. Abakumov, Transition metal complexes with bulky 4,6-di-tert-butyl-N-aryl(alkyl)-o-iminobenzoquinonato ligands: Structure, EPR and magnetism, Coord. Chem. Rev., 2009, 253(3–4), 291–324 CrossRef.
- S. Vancoillie, P. A. Malmqvist and K. Pierloot, Calculation of EPR g tensors for transition-metal complexes based on multiconfigurational perturbation theory (CASPT2), ChemPhysChem, 2007, 8(12), 1803–1815 CrossRef CAS PubMed.
- W. L. Zhang, Z. Cao, W. X. Wang, E. Alhajji, A. H. Emwas, P. Costa, L. Cavallo and H. N. Alshareef, A Site-Selective Doping Strategy of Carbon Anodes with Remarkable K-Ion Storage Capacity, Angew. Chem., Int. Ed., 2020, 59(11), 4448–4455 CrossRef CAS PubMed.
- Y.-M. Lee, B.-J. Kim, H.-J. Kim, S.-Y. Kim, S. K. Kang and S.-N. Choi, Crystal structures and spectroscopic properties of copper(II) pseudohalide complexes with two sparteine epimers, having a CuN4 chromophore, Polyhedron, 2009, 28(14), 3060–3064 CrossRef CAS.
- L. Li, X. Shi, C. M. Evans and G. L. Findley, Atomic and Molecular Low-n Rydberg States in Near Critical Point Fluids, Adv. Aspects Spectrosc., 2012, 451 CAS.
- E. Garribba and G. Micera, The determination of the geometry of Cu(II) complexes: an EPR spectroscopy experiment, J. Chem. Educ., 2006, 83(8), 1229 CrossRef CAS.
- M. M. Ibrahim, A.-M. M. Ramadan, H. S. El-Sheshtawy, M. A. Mohamed, M. Soliman and S. IM Zayed, Synthesis, characterization and medical efficacy (hepatoprotective and antioxidative) of albendazole-based copper(II) complexes–an experimental and theoretical approach, J. Coord. Chem., 2015, 68(24), 4296–4313 CrossRef CAS.
- R. Mogili, M. Ravinder, K. Mamatha, N. Padmaja and S. Srihari, Synthesis, Characterization and Antimicrobial Activity of some Quinoxaline derivatives and their Metal Complexes, J. Pharm. Chem., 2007, 1, 35–39 CAS.
- D. Kivelson and R. Neiman, ESR studies on the bonding in copper complexes, J. Chem. Phys., 1961, 35(1), 149–155 CrossRef CAS.
- A. Shoair, A. El-Bindary, N. El-Ghamaz and G. Rezk, Synthesis, characterization, DNA binding and antitumor activities of Cu(II) complexes, J. Mol. Liq., 2018, 269, 619–638 CrossRef CAS.
- B. Hathaway and D. Billing, The electronic properties and stereochemistry of mono-nuclear complexes of the copper(II) ion, Coord. Chem. Rev., 1970, 5(2), 143–207 CrossRef CAS.
- A. Coats and J. Redfern, Thermogravimetric analysis. A review, Analyst, 1963, 88(1053), 906–924 RSC.
- A. Siddalingaiah and S. G. Naik, Spectroscopic and thermogravimetric studies on Ni(II), Cu(II) and Zn(II) complexes of di (2,6-dichlorophenyl) carbazone, THEOCHEM, 2002, 582(1–3), 129–136 CrossRef CAS.
- A. Frost and R. Pearson, Kinetics and mechanism, J. Phys. Chem., 1961, 65(2), 384 CrossRef.
- A. El-Bindary, S. El-Marsafy and A. El-Maddah, Enhancement of the photocatalytic activity of ZnO nanoparticles by silver doping for the degradation of AY99 contaminants, J. Mol. Struct., 2019, 1191, 76–84 CrossRef CAS.
- H. Kiwaan, T. Atwee, E. Azab and A. El-Bindary, Photocatalytic degradation of organic dyes in the presence of nanostructured titanium dioxide, J. Mol. Struct., 2020, 1200, 127115 CrossRef CAS.
- A. El-Sonbati, M. Diab, A. El-Bindary, M. Abou-Dobara and H. Seyam, Molecular docking, DNA binding, thermal studies and antimicrobial activities of Schiff base complexes, J. Mol. Liq., 2016, 218, 434–456 CrossRef CAS.
- N. S. Abdel-Kader, S. A. Abdel-Latif, A. L. El-Ansary and A. G. Sayed, Combined experimental, DFT theoretical calculations and biological activity of sulfaclozine azo dye with 1-hydroxy-2-naphthoic acid and its complexes with some metal ions, New J. Chem., 2019, 43(44), 17466–17485 RSC.
- L. H. Abdel-Rahman, A. M. Abu-Dief, M. Ismael, M. A. Mohamed and N. A. Hashem, Synthesis, structure elucidation, biological screening, molecular modeling and DNA binding of some Cu(II) chelates incorporating imines derived from amino acids, J. Mol. Struct., 2016, 1103, 232–244 CrossRef CAS.
- A. A. Sharfalddin and M. A. Hussien, Bivalence Metal Complexes of Antithyroid Drug Carbimazole; Synthesis, Characterization, Computational simulation, and Biological Studies, J. Mol. Struct., 2020, 129725 Search PubMed.
- R. Parthasarathi, V. Subramanian, D. R. Roy and P. Chattaraj, Electrophilicity index as a possible descriptor of biological activity, Bioorg. Med. Chem., 2004, 12(21), 5533–5543 CrossRef CAS PubMed.
- M. Sirajuddin, S. Ali and A. Badshah, Drug–DNA interactions and their study by UV–Visible, fluorescence spectroscopies and cyclic voltametry, J. Photochem. Photobiol., B, 2013, 124, 1–19 CrossRef CAS PubMed.
- F. Arjmand and A. Jamsheera, DNA binding studies of new valine derived chiral complexes of tin(IV) and zirconium(IV), Spectrochim. Acta, Part A, 2011, 78(1), 45–51 CrossRef PubMed.
- N. Shahabadi, S. Kashanian, M. Khosravi and M. Mahdavi, Multispectroscopic DNA interaction studies of a water-soluble nickel(II) complex containing different dinitrogen aromatic ligands, Transition Met. Chem., 2010, 35(6), 699–705 CrossRef CAS.
- K. Ashwini Kumar, K. L. Reddy, S. Vidhisha and S. Satyanarayana, Synthesis, characterization and DNA binding and photocleavage studies of [Ru(bpy)2BDPPZ]2+, [Ru(dmb)2BDPPZ]2+ and [Ru(phen)2BDPPZ]2+ complexes and their antimicrobial activity, Appl. Organomet. Chem., 2009, 23(10), 409–420 CrossRef.
- A. M. Abu-Dief, L. H. Abdel-Rahman and A. A. H. Abdel-Mawgoud, A robust in vitro anticancer, antioxidant and antimicrobial agents based on new metal-azomethine chelates incorporating Ag(I), Pd(II) and VO(II) cations: Probing the aspects of DNA interaction, Appl. Organomet. Chem., 2020, 34(2), e5373 CrossRef CAS.
- S. Tabassum, M. Zaki, M. Ahmad, M. Afzal, S. Srivastav, S. Srikrishna and F. Arjmand, Synthesis and crystal structure determination of copper(II)-complex: in vitro DNA and HSA binding, pBR322 plasmid cleavage, cell imaging and cytotoxic studies, Eur. J. Med. Chem., 2014, 83, 141–154 CrossRef CAS PubMed.
- S. Al-Harthi, J. I. Lachowicz, M. E. Nowakowski, M. Jaremko and Ł. Jaremko, Towards the functional high-resolution coordination chemistry of blood plasma human serum albumin, J. Inorg. Biochem., 2019, 198, 110716 CrossRef CAS PubMed.
- A. J. Stewart, C. A. Blindauer, S. Berezenko, D. Sleep, D. Tooth and P. J. Sadler, Role of Tyr84 in controlling the reactivity of Cys34 of human albumin, FEBS J., 2005, 272(2), 353–362 CrossRef CAS PubMed.
- M. H. Baig, S. Rahman, G. Rabbani, M. Imran, K. Ahmad and I. Choi, Multi-spectroscopic characterization of human serum albumin binding with cyclobenzaprine hydrochloride: insights from biophysical and in silico approaches, Int. J. Mol. Sci., 2019, 20(3), 662 CrossRef CAS PubMed.
- B. Tweedy, Plant extracts with metal ions as potential antimicrobial agents, Phytopathology, 1964, 55, 910–914 Search PubMed.
- A. A. Al-Amiery, A. A. H. Kadhum and A. B. Mohamad, Antifungal and antioxidant activities of pyrrolidone thiosemicarbazone complexes, Bioinorg. Chem. Appl., 2012, 2012, 795812 Search PubMed.
- K. S. Prasad, L. S. Kumar, S. C. Shekar, M. Prasad and H. Revanasiddappa, Oxovanadium complexes with bidentate N, O ligands: synthesis, characterization, DNA binding, nuclease activity and antimicrobial studies, Chem. Sci. J., 2011, 12, 1–10 Search PubMed.
- L. H. Abdel-Rahman, A. M. Abu-Dief, M. O. Aboelez and A. A. H. Abdel-Mawgoud, DNA interaction, antimicrobial, anticancer activities and molecular docking study of some new VO(II), Cr(III), Mn(II) and Ni(II) mononuclear chelates encompassing quaridentate imine ligand, J. Photochem. Photobiol., B, 2017, 170, 271–285 CrossRef CAS PubMed.
Footnote |
| † Electronic supplementary information (ESI) available. See DOI: 10.1039/d1nj00293g |
| This journal is © The Royal Society of Chemistry and the Centre National de la Recherche Scientifique 2021 |


