DOI:
10.1039/D0NJ04617E
(Paper)
New J. Chem., 2021,
45, 394-402
TiO2–reduced graphene oxide for the removal of gas-phase unsymmetrical dimethylhydrazine†
Received
16th September 2020
, Accepted 5th November 2020
First published on 12th November 2020
Abstract
Unsymmetrical dimethylhydrazine (UDMH) contaminated waste gas and related intermediates pose a great threat to human health. TiO2–reduced graphene oxide aerogel (rGA) samples with different graphene content levels were synthetized and characterized for the degradation of UDMH. The effects of GO content, humidity, and temperature were investigated under UV and VUV light, with highest UDMH conversion values of 68% and 95%, respectively. Compared with pure TiO2, the enhanced degradation activity of TiO2–rGA under UV light can be attributed to a synergetic effect between absorption and photocatalysis, while the high UDMH conversion under VUV light relies on photolysis and ozonation. The high oxygen-containing group content, rather than a high SSA, and electron trapping by graphene are key factors determining the outstanding performance of TiO2–rGA with 80 mg of GO. The prepared TiO2–graphene aerogels are promising for the degradation of gas-phase UDMH.
1. Introduction
Unsymmetrical dimethylhydrazine (UDMH) is a commonly used propellant in rocket and missile engines because of its high specific impulse. The waste liquid and gas produced during its use and storage can cause serious environmental pollution. UDMH is also seriously toxic to organisms, and it can cause different degrees of damage to the human central nervous system, liver, and kidneys. The treatment of UDMH waste has long been a research hotspot around the world. Traditionally, waste UDMH gas was treated via water absorption, high-altitude emission, and direct combustion methods. However, these methods often have the disadvantages of needing a lot of energy, being labor intensive, and having high cost. It is necessary to seek an effective, green, and convenient method for UDMH degradation. Photocatalysis and absorption are the most effective means that can be applied to remove UDMH contaminants. Gao1 used CdS-sensitized TiO2 nanorod arrays decorated with Au nanoparticles to degrade UDMH wastewater with an efficiency of 51.51%. However, little research has been done on the degradation of gas-phase UDMH using photocatalysts.
Photocatalysis, as an advanced oxidation technology, has been used in the field of waste-gas treatment, such as for formaldehyde,2,3 benzene,4,5 and toluene.6–8 Titanium oxide (TiO2) is considered to be a distinguished photocatalyst for remediating environmental pollution due to its unique features of being low-cost, non-toxic, and environmentally friendly.9 TiO2 can create electron–hole pairs under illumination, followed by the generation of free radicals that are able to undergo secondary reactions. For practical applications, the problem of high photoinduced electron and hole recombination rates exists.10 To overcome this problem, a Schottky junction can be fabricated on a surface via loading with conductive materials with higher work functions than TiO2.11
Graphene, consisting of super strong sheets of carbon, conducts heat and electricity extremely well. TiO2 and graphene can be integrated to effectively transport photoinduced carriers and prolong carrier lifetimes. What is more, TiO2/graphene can easily form chemical bonds in the process, and the close interaction between TiO2 and graphene is conducive to charge transfer and band-gap reduction.12 During the in situ preparation of TiO2/graphene, hydrophilic groups, including hydroxyl and carboxyl groups on GO, facilitate dispersion in water and the heterogeneous nucleation and growth of titanium dioxide. A. Trapalis13 explored the use of TiO2/graphene composite photocatalysts made from pure graphene (G) and graphene oxide (GO) to remove NOx. The results showed that TiO2/rGO prepared via a solvothermal method exhibited superior efficiency to TiO2/G. For TiO2/rGO, the type and number of remaining oxygen-containing groups on rGO vary as a result of different degrees of reduction during the hydrothermal reaction. In addition, it is easy to carry out the chemical absorption of UDMH molecules on these groups. Therefore, chemical absorption and charge-carrier separation are proposed as key factors for improving the degradation performance of TiO2/rGO. In a previous report, Ebrahimi14 prepared P25–rGO with P25 nanoparticles uniformly well-decorated on graphene, and the efficiency of the degradation of gaseous acetaldehyde reached about 70% at a velocity of 17 mL min−1 under visible light.
Nowadays, another challenge hindering the widespread application of granular nanoparticles is that most photocatalysts are difficult to gather and recover. TiO2/reduced graphene oxide aerogel (rGA) obtained via freeze-drying is easy to recycle. Also, the high surface area and countless bonding sites of 3D aerogels are favorable for physical and chemical adsorption.
In this study, we combine reduced graphene oxide with TiO2via a one-pot hydrothermal method. The degradation of gaseous UDMH by TiO2/rGA was investigated under ultraviolet (UV) light and vacuum ultraviolet (VUV) light in flowing gas. The phase structure, texture, and optical properties were characterized to understand the underlying reasons behind the improved UDMH conversion. Also, a possible degradation mechanism and proposed pathway are discussed based on the degradation products.
2. Experimental
2.1. Preparation of TiO2/rGA
Graphite oxide was prepared according to the modified Hummers’ method.15 Briefly, 3 g of natural graphite was mixed with 70 mL of concentrated H2SO4 under stirring, then 1.5 g of NaNO3 and 9 g of KMnO4 were slowly added to the mixture in an ice bath. Afterwards, the solution was removed from the ice bath and kept between 35 and 40 °C for 90 min under strong stirring. Then, 140 mL of deionized (DI) water was added and the solution was stirred at 95 °C for 15 min. After that, 500 mL of DI water and 20 mL of 30% H2O2 were added. Finally, the solution was filtered and washed with HCl (1![[thin space (1/6-em)]](https://www.rsc.org/images/entities/char_2009.gif) :
:![[thin space (1/6-em)]](https://www.rsc.org/images/entities/char_2009.gif) 10) and DI water several times. The supernatant was then removed via centrifugation to obtain a brown slurry. Then, the slurry was diluted and subjected to ultrasonic treatment for 1 h before further use. To prepare TiO2/rGA, titanic sulfate (Ti(SO4)2) was chosen as the precursor, and glucose acted as the crosslinking agent and reducing agent. A certain amount (20 mg, 40 mg, 80 mg, 120 mg, or 160 mg) of GO, 0.03 g of glucose and 0.72 g of Ti(SO4)2 were magnetically stirred for 30 min and placed into a Teflon-lined autoclave, which was maintained at 180 °C for 12 h. The prepared TiO2/rGO hydrogel (rGH) samples were washed and dehydrated via freeze-drying to form TiO2/rGA samples, referred to as TiO2/rGA-1, TiO2/rGA-2, TiO2/rGA-3, TiO2/rGA-4, and TiO2/rGA-5. In this work, TiO2/rGA represents TiO2/rGA-3 unless otherwise specified. For comparison, rGA (without adding Ti(SO4)2) and TiO2 (without adding GO) were also synthesized via the same procedures.
10) and DI water several times. The supernatant was then removed via centrifugation to obtain a brown slurry. Then, the slurry was diluted and subjected to ultrasonic treatment for 1 h before further use. To prepare TiO2/rGA, titanic sulfate (Ti(SO4)2) was chosen as the precursor, and glucose acted as the crosslinking agent and reducing agent. A certain amount (20 mg, 40 mg, 80 mg, 120 mg, or 160 mg) of GO, 0.03 g of glucose and 0.72 g of Ti(SO4)2 were magnetically stirred for 30 min and placed into a Teflon-lined autoclave, which was maintained at 180 °C for 12 h. The prepared TiO2/rGO hydrogel (rGH) samples were washed and dehydrated via freeze-drying to form TiO2/rGA samples, referred to as TiO2/rGA-1, TiO2/rGA-2, TiO2/rGA-3, TiO2/rGA-4, and TiO2/rGA-5. In this work, TiO2/rGA represents TiO2/rGA-3 unless otherwise specified. For comparison, rGA (without adding Ti(SO4)2) and TiO2 (without adding GO) were also synthesized via the same procedures.
2.2. Characterization methods
The phase structures of the samples were analysed via X-ray diffraction (XRD) with Cu Kα radiation (λ = 0.15401 nm) using a generator voltage of 40 kV and a current of 40 mA. Analysis was performed over a 2θ range of 5.0–85.0° at a scanning rate of 0.02° per second. The surface morphologies were characterized using a scanning electron microscopy (SEM) system (VEDAIIXMUINCN) equipped with an energy-dispersive X-ray spectroscopy (EDS) system. Raman spectra of the samples were taken using Ar+ (532 nm) laser excitation (inVia Reflex, Renishaw, England) in the range of 100–3200 cm−1. The sample was loaded on a silica wafer and focused using a 50× objective. The surface functional groups were analysed via Fourier-transform infrared (FT-IR) spectroscopy (NEXUS, Nicolet, USA) in transmittance mode with a spectral range of 400–4000 cm−1. X-Ray photoelectron spectroscopy (XPS) characterization was performed (Escalab 250Xi, Thermo Scientific) with an Al Kα X-ray source. All binding energy values were corrected via calibrating to the C 1s peak at 284.8 eV. Brunauer–Emmett–Teller (BET) specific surface areas and porosities of samples were evaluated based on nitrogen adsorption isotherms measured at 77 K using gas adsorption apparatus (TriStar II 3020, Micromeritics, USA). All samples were degassed at 180 °C before nitrogen adsorption measurements. The BET surface areas were determined using adsorption data in the relative pressure (p/p0) range of 0.06–0.2. PL measurements were performed at room temperature using a Hitachi F-4700 fluorescence spectrophotometer.
2.3. UDMH degradation experiments under UV and VUV light
The photocatalytic degradation of UDMH was investigated in a continuous fixed-bed reactor, as shown in Fig. 1. UDMH was put in a refrigerator purged using nitrogen at a flow rate of 1 mL min−1. Water vapor was generated via bubbling purified air provided by an air compressor. The flows of UDMH, water vapor, and purified air were adjusted using a mass flowmeter and then mixed in a buffer bottle. The total flow rate is controlled at 0.6 L min−1. The gas from the buffer bottle then flowed into the reactor.
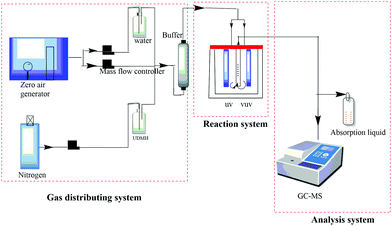 |
| | Fig. 1 A schematic diagram of the reaction system. | |
A cylindrical reactor made of stainless steel with a working volume of 500 mL was used in the experiments. UV and VUV lamps and a catalyst quartz tube were fixed vertically in the reactor. The UV and VUV lamp tubes used in the experiment were both 4 W lamps (Cnlight) with irradiation peaks at 254 nm and 185 nm, respectively. The distances between the lamps and the quartz tube were both 2 cm. The as-synthesized nanocomposite was loaded in the tube, through which the gas would be detected by the analysis system.
The concentration of UDMH was measured via a gas chromatograph (Clarus 680, PerkinElmer, USA)-mass spectrometer (Clarus SQ 8T, PerkinElmer, USA). The gas was periodically transferred into a sampling loop (500 μL) via a ten-way valve and separated through a capillary column (Elite-WAX, PerkinElmer) with an inner diameter of 0.25 mm and a length of 2 m. The oven temperatures were programmed as follows: the temperature was initially set to 50 °C and maintained for 1 min, then increased to 100 °C at a rate of 20 °C min−1 and maintained for 1 min, and then increased to 180 °C at a rate of 10 °C min−1 and maintained for 1 min. The measurement time for each sample was 3 hours. UDMH conversion was defined as follows:
| UDMH conversion (%) = (UDMHinlet − UDMHoutlet)/UDMHinlet × 100% |
where UDMH
inlet and UDMH
outlet are the concentrations of UDMH at the inlet and outlet, respectively. Each experiment was duplicated under the same conditions three times.
3. Results and discussion
3.1. Phase structure and chemical composition
Fig. 2 displays the XRD patterns of GO, rGA, TiO2, and TiO2/rGA. The diffraction peaks at 10.9° and 26.5° represent GO and rGA. The diffraction peak at 26° in the GO pattern is attributed to unoxidized graphite in small amounts. The d-spacing values of the graphite layers calculated using Bragg's law (2d![[thin space (1/6-em)]](https://www.rsc.org/images/entities/char_2009.gif) sin
sin![[thin space (1/6-em)]](https://www.rsc.org/images/entities/char_2009.gif) θ = nλ) are 0.804 nm and 0.336 nm. The d-spacing of GO was broadened compared with natural graphite due to the introduction of functional groups between the graphite layers. The preparation of rGA involves the reverse process, namely the removal of functional groups from GO. The wide peak in rGA represents the high stripping of graphene and the formation of few-layer rGO sheets. The peaks at values of 25.3°, 37.8°, 48.1°, 54.4°, 62.9°, 69.9°, and 74.9° in the pure TiO2 and TiO2/rGA patterns can be respectively indexed to the (101), (004), (200), (211), (204), (220), and (215) planes of the TiO2 anatase phase (JCPDS-21-1272). Based on the Scherrer equation, the crystallite sizes of TiO2 in the pure TiO2 and TiO2/rGA samples were 11 and 14 nm, respectively, via assuming a shape factor of 0.9. Graphene and GO can hardly be seen in TiO2/rGA due to the low content and the decreased layer-regularity of graphene nanosheets.16
θ = nλ) are 0.804 nm and 0.336 nm. The d-spacing of GO was broadened compared with natural graphite due to the introduction of functional groups between the graphite layers. The preparation of rGA involves the reverse process, namely the removal of functional groups from GO. The wide peak in rGA represents the high stripping of graphene and the formation of few-layer rGO sheets. The peaks at values of 25.3°, 37.8°, 48.1°, 54.4°, 62.9°, 69.9°, and 74.9° in the pure TiO2 and TiO2/rGA patterns can be respectively indexed to the (101), (004), (200), (211), (204), (220), and (215) planes of the TiO2 anatase phase (JCPDS-21-1272). Based on the Scherrer equation, the crystallite sizes of TiO2 in the pure TiO2 and TiO2/rGA samples were 11 and 14 nm, respectively, via assuming a shape factor of 0.9. Graphene and GO can hardly be seen in TiO2/rGA due to the low content and the decreased layer-regularity of graphene nanosheets.16
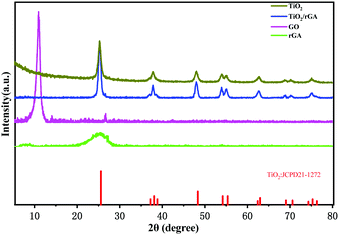 |
| | Fig. 2 XRD patterns of the samples. | |
The surface components and chemical states of TiO2/rGA were investigated via XPS. Fig. 3a exhibits the full spectrum of TiO2/rGA, which demonstrates the coexistence of Ti, O, and C. The O 1s spectrum of TiO2/rGA is exhibited in Fig. 3b. The O 1s XPS spectrum can be divided into three peaks at 530.5, 532.25 and 533.55 eV, representing Ti–O–Ti, C–O–Ti, and C–O, respectively, in TiO2/rGA. In Fig. 3c, the Ti 2p peaks, located at binding energies of 459.2 and 465 eV, in the TiO2 spectrum, with a separation of 5.8 eV, can be ascribed to pure anatase phase Ti4+.17 The peak at 472.7 eV is a satellite peak of Ti 2p1/2. The Ti 2p peaks are positively shifted to 459.35 and 465.15 eV in TiO2/rGA, which is caused by electrons migrating away from TiO2 to graphene, because the Fermi level of TiO2 is higher than that of graphene. A comparison of the C 1s spectra of GO and TiO2/rGA is presented in Fig. 3d. The XPS peaks at 284.8, 286.3, and 288.95 eV can be assigned to the C–C/C![[double bond, length as m-dash]](https://www.rsc.org/images/entities/char_e001.gif) C, C
C, C![[double bond, length as m-dash]](https://www.rsc.org/images/entities/char_e001.gif) O, and O
O, and O![[double bond, length as m-dash]](https://www.rsc.org/images/entities/char_e001.gif) C–O bonds of TiO2/rGA and GO. The peak intensities of the oxygen-containing groups were reduced after the hydrothermal reaction, indicating that GO had been reduced. Notably, a few C
C–O bonds of TiO2/rGA and GO. The peak intensities of the oxygen-containing groups were reduced after the hydrothermal reaction, indicating that GO had been reduced. Notably, a few C![[double bond, length as m-dash]](https://www.rsc.org/images/entities/char_e001.gif) O and O
O and O![[double bond, length as m-dash]](https://www.rsc.org/images/entities/char_e001.gif) C–O bonds can still be found in TiO2/rGA.
C–O bonds can still be found in TiO2/rGA.
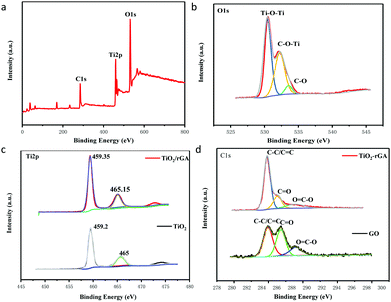 |
| | Fig. 3 XPS spectra: full spectrum of TiO2/rGA (a), O 1s spectrum of TiO2/rGA (b), Ti 2p spectra of TiO2/rGA and of TiO2 (c), and C 1s spectra of TiO2/rGA and GO (d). | |
Fourier transform infrared spectra of the samples are shown in Fig. 4. The characteristic peaks from carbonyl C![[double bond, length as m-dash]](https://www.rsc.org/images/entities/char_e001.gif) O stretching vibrations, molecular water or C
O stretching vibrations, molecular water or C![[double bond, length as m-dash]](https://www.rsc.org/images/entities/char_e001.gif) C vibrations, C–OH bending vibrations, and C–O stretching vibrations or epoxy C–O–C vibrations in GO appear at 1734, 1633, 1200, and 1080 cm−1, respectively. The abundant oxygen-containing groups on the surface indicate the good hydrophilicity of GO,18 easing its dispersal in water and bonding with other elements. During hydrothermal treatment, overheated supercritical water can play the role of a reducing agent, leading to decreases in the intensities of C
C vibrations, C–OH bending vibrations, and C–O stretching vibrations or epoxy C–O–C vibrations in GO appear at 1734, 1633, 1200, and 1080 cm−1, respectively. The abundant oxygen-containing groups on the surface indicate the good hydrophilicity of GO,18 easing its dispersal in water and bonding with other elements. During hydrothermal treatment, overheated supercritical water can play the role of a reducing agent, leading to decreases in the intensities of C![[double bond, length as m-dash]](https://www.rsc.org/images/entities/char_e001.gif) O stretching vibrations and C–O/C–O–C vibrations in TiO2/rGA. The changes show the reduction of GO, as shown by XPS, and previous research produced similar results.19 The C–OH bonds exhibit more intense peaks in TiO2/rGA than GO due to interactions between graphene and hydroxyl groups after the hydrolysis of titanous sulfate. The wide peak between 500 and 900 cm−1 could be ascribed to Ti–O–Ti and Ti–O–C, confirming the chemical interaction between TiO2 and graphene.20,21 Comparing TiO2/rGA with different GO content levels, the C–OH and C–O/C–O–C peaks at 1200 and 1080 cm−1 in TiO2/rGA-3 are relatively high. This is due to a combination of the hydrolysis of titanous sulfate and the reduction of GO, which vary at different GO content levels and for different structures.
O stretching vibrations and C–O/C–O–C vibrations in TiO2/rGA. The changes show the reduction of GO, as shown by XPS, and previous research produced similar results.19 The C–OH bonds exhibit more intense peaks in TiO2/rGA than GO due to interactions between graphene and hydroxyl groups after the hydrolysis of titanous sulfate. The wide peak between 500 and 900 cm−1 could be ascribed to Ti–O–Ti and Ti–O–C, confirming the chemical interaction between TiO2 and graphene.20,21 Comparing TiO2/rGA with different GO content levels, the C–OH and C–O/C–O–C peaks at 1200 and 1080 cm−1 in TiO2/rGA-3 are relatively high. This is due to a combination of the hydrolysis of titanous sulfate and the reduction of GO, which vary at different GO content levels and for different structures.
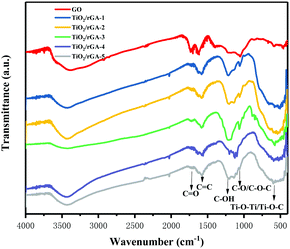 |
| | Fig. 4 FTIR patterns of the samples. | |
Fig. 5a presents the Raman spectra of GO, rGA, TiO2, and TiO2/rGA. The peaks at about 1350 cm−1 and 1590 cm−1 represent the D band and G band of graphene, respectively. In detail, the D band reflects edge carbon or the disordered sp3 structure,22 while the G band represents the ordered sp2 carbon structure. With a higher ID/IG ratio, the average size of the in-plane sp2 domains and the conductivity of the composite will decrease, while the degree of reduction becomes higher. The ID/IG ratios of GO, rGA, and TiO2/rGA-3 are 0.89, 1.04, and 0.91, respectively. The increased ID/IG ratio of rGA confirms the reduction of GO, as well as the presence of sp3 defects.18,23 Furthermore, bare TiO2 exhibits five intensive peaks from anatase. The peaks at 144 and 636 cm−1 can be assigned to the Eg mode of TiO2 (symmetric stretching vibrations of O–Ti–O bonds), and the peaks at 396 cm−1 and 517 cm−1 correspond to the B1g mode of TiO2 and an A1g/B1g doublet (symmetric and asymmetric bending vibrations of O–Ti–O).7 As seen in the enlarged view shown in Fig. 5a, the peak of TiO2 at 144 cm−1 is shifted positively to 150 cm−1 in TiO2/rGA, which indicates that the symmetric O–Ti–O stretching vibration in TiO2 has been destroyed to some extent due to new bonds being formed between TiO2 and graphene. As shown in Fig. 5b, the ID/IG values of TiO2/rGA-1, TiO2/rGA-2, TiO2/rGA-4, and TiO2/rGA-5 were all greater than 1, with only TiO2/rGA-3 being less than 1. TiO2/rGA-3 has the lowest reduction degree and some oxygen containing groups remain on the surface, which is similar to the FTIR spectra results.
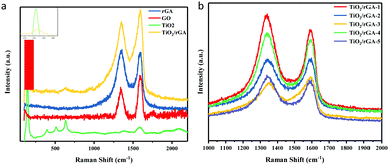 |
| | Fig. 5 (a) Raman spectra of rGA, GO, TiO2, and TiO2/rGA. (b) Raman spectra of TiO2/rGA with different amounts of graphene. | |
3.2. Microstructure and texture properties
The morphologies and constitutions of GO, rGA, TiO2, and TiO2/rGA were observed clearly via SEM and EDS studies, as seen in Fig. 6. As shown in Fig. 6a, the surface of GO is wrinkled and cross-linked, which can provide enough active sites. After the hydrolysis reaction, the three-dimensional porous structure of rGA can be seen in Fig. 6b. The pure TiO2 nanoparticles are seen to clump together in Fig. 6c. The SEM images of TiO2/rGA are quite different due to the different amounts of graphene. The morphologies of TiO2/rGA-1 and TiO2/rGA-2 are close to that of titanium dioxide, as shown in Fig. 6d and e. Upon increasing the graphene content, the skeleton of the graphene aerogel can be clearly seen in the next three images, and the TiO2 nanoparticles are evenly coated on graphene due to the crosslinking effect of glucose and chemical interactions between TiO2 and graphene. As shown in Fig. 6i, the elements Ti, O, and C can be detected in the EDS spectrum.
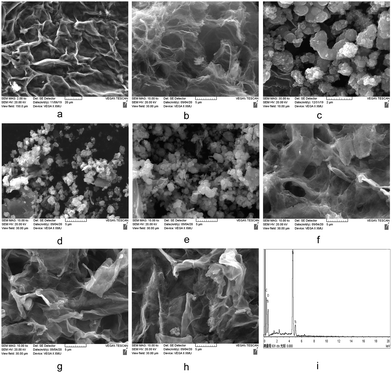 |
| | Fig. 6 SEM images of (a) GO, (b) rGA, (c) TiO2, and (d–h) TiO2/rGA, and the EDX spectrum (i) of TiO2/rGA. | |
The N2 adsorption–desorption isotherm curves for TiO2/rGA and TiO2 are shown in Fig. 7, and the corresponding data are summed up in Table 1. TiO2 displayed a type-IV physisorption isotherm (based on IUPAC classification) with a H2 hysteresis loop. The pores are mainly in the shape of an ink bottle, and they are possibly caused by the accumulation of homogeneous titanium dioxide. TiO2/rGA displayed type-IV physisorption isotherms, with a combination of H2 and H3 hysteresis loops. The hysteresis loops are triangularly shaped, mainly due to pores arising from aggregated nanoparticles and slit-shaped mesopores due to the stacking of rGO sheets.24 The hysteresis loops of TiO2/rGA are closer to TiO2-type at low graphene content and closer to graphene-type at high graphene content, which agrees with the SEM results. From the BJH spectra, it can be seen that TiO2 and TiO2/rGA showed uniform aggregated mesopores in the range of 3–8 nm. The specific surface areas of the samples are shown in Table 1. TiO2/rGA-1 and TiO2/rGA-2 exhibited higher specific surface areas than pure TiO2 and rGA, with surface areas of up to 116 m2 g−1 and 140 m2 g−1, respectively. The addition of graphene in small amounts contributed to the overall specific surface area and the crystallite growth. When the graphene content was higher, the surface area sharply decreased to 13 m2 g−1. As shown in Fig. 6, the morphology of TiO2/rGA changed from granular to lamellar. Compared with Fig. 6b, the graphene sheets are stacked together and more closely linked to titanium dioxide.
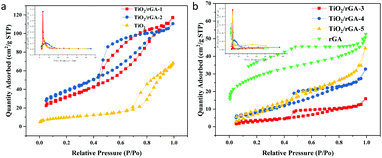 |
| | Fig. 7 BET spectra of (a) TiO2/rGA-1, TiO2/rGA-2, and TiO2, and (b) TiO2/rGA-3, TiO2/rGA-4, TiO2/rGA-5, and rGA. | |
Table 1 Specific surface area and pore structure values obtained via the multipoint BET method
| Composite |
S
BET (m2 g−1) |
V
pore (cm3 g−1) |
D
pore (nm) |
| rGA |
97.5722 |
0.081287 |
1.63237 |
| TiO2 |
34.6566 |
0.105611 |
4.58944 |
| TiO2/rGA-1 |
116.7444 |
0.185195 |
4.7602 |
| TiO2/rGA-2 |
140.3755 |
0.177772 |
4.2374 |
| TiO2/rGA-3 |
13.0532 |
0.024687 |
5.1295 |
| TiO2/rGA-4 |
32.5060 |
0.051381 |
4.8364 |
| TiO2/rGA-5 |
38.9673 |
0.067024 |
5.8281 |
3.3. Optical properties and band gaps
The PL intensity can reflect the photogenerated hole and electron separation efficiency.6 The PL spectra of TiO2 and TiO2/rGA are shown in Fig. 8. There are strong emission peaks for TiO2 at around 460 nm and 425 nm, which can be ascribed to self-trapped excitons in TiO2.25 TiO2 and TiO2/rGA show similar PL signal shapes, however, the TiO2/rGA signals were obviously weaker than that of TiO2. This is mainly because the addition of graphene can decrease the radiative recombination of carriers at the rGO–TiO2 interface, henceforth quenching the PL intensity. The excited electrons are transferred from the conduction band of TiO2 to the rGO sheets, prolonging the carrier lifetimes.
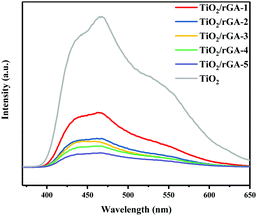 |
| | Fig. 8 PL spectra of TiO2/rGA-1, TiO2/rGA-2, TiO2/rGA-3, TiO2/rGA-4, TiO2/rGA-5, and TiO2. | |
3.4. The photocatalytic degradation of UDMH under UV light
3.4.1 Humidity.
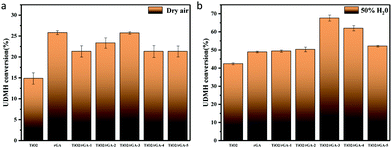
Photocatalytic experiments involving the gas-phase degradation of UDMH were performed at room temperature (25 °C) and under ambient pressure. UDMH conversion over bare TiO2, rGA, TiO2/rGA-1, TiO2/rGA-2, TiO2/rGA-3, TiO2/rGA-4, and TiO2/rGA-5 at different humidity levels (a: dry air; b: 50% H2O) under UV light is shown in Fig. 9. The UDMH conversion levels when using TiO2/rGA lie in the range of 19–28%, which are higher than the reference catalyst of pure TiO2 in dry air. Pure rGA shows better performance than TiO2/rGA-1 and TiO2/rGA-2 due to its high absorption capacity. The relatively high efficiency of TiO2/rGA is attributed to a synergetic effect between photocatalysis and absorption. On one hand, TiO2 can produce electron–hole pairs under UV irradiation, and graphene can efficiently transport the carriers, as verified by the Ti 2p XPS spectra. On the other hand, the Schottky junction formed between TiO2 and rGA contributes to the degradation of UDMH. The Schottky barrier serves as an efficient electron trap, thus leading to a high partial electron density around graphene for photocatalysis and preventing the unexpected migration of electrons from graphene back to the semiconductor.26 In addition, the upshifted Fermi level of TiO2 under UV light irradiation could decrease the TiO2–rGA barrier and benefit electron transport.27
 |
| | Fig. 9 UDMH conversion under UV light in (a) dry air and (b) air at 50% humidity. | |
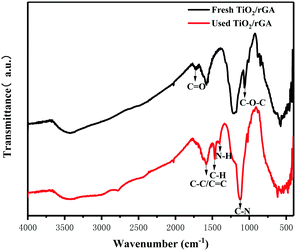
When the humidity was raised to 50%, the UDMH conversion of TiO2/rGA-3 can reach 68%, which is much higher than in dry air. More reactive oxygen species can be produced in humid air. As a strong oxidizing agent, hydroxide radicals may be generated on the surface of TiO2. The UDMH conversion levels of TiO2/rGA with different GO content vary greatly, following the order: TiO2/rGA-3 > TiO2/rGA-4 > TiO2/rGA-5 > TiO2/rGA-2 > TiO2/rGA-1 > rGA > TiO2. The material with the highest efficiency is TiO2/rGA-3, with a relatively low SSA and moderate carrier density based on the previous characterization results. From the obtained PL spectra, we can infer that TiO2/rGA-5 has a relatively high catalytic effect, as it had the lowest fluorescence intensity. However, the degradation efficiency of TiO2/rGA-5 is lower because the degradation of UDMH under UV light is affected by a combination of absorption and catalysis. In order to analyse the degradation mechanism, the FTIR patterns of fresh and used TiO2/rGA-3 are shown in Fig. 10. The characteristic peaks of C![[double bond, length as m-dash]](https://www.rsc.org/images/entities/char_e001.gif) O, C–OH, and C–O–C decreased after degradation, and two new peaks due to C–H and N–H appeared. Degradation may arise due to chemical interactions between reducing UDMH and oxygen-containing groups. As shown in Fig. 4 and 5, the reduction degree of TiO2/rGA-3 is weaker and the number of oxygen-containing groups on TiO2/rGA-3 is higher than the other samples. It can be deduced that the increased activity of TiO2/rGA-3 can mainly be accredited to chemical absorption on oxygen-containing groups.
O, C–OH, and C–O–C decreased after degradation, and two new peaks due to C–H and N–H appeared. Degradation may arise due to chemical interactions between reducing UDMH and oxygen-containing groups. As shown in Fig. 4 and 5, the reduction degree of TiO2/rGA-3 is weaker and the number of oxygen-containing groups on TiO2/rGA-3 is higher than the other samples. It can be deduced that the increased activity of TiO2/rGA-3 can mainly be accredited to chemical absorption on oxygen-containing groups.
 |
| | Fig. 10 The FTIR patterns of fresh and used TiO2/rGA. | |
3.4.2 Temperature.
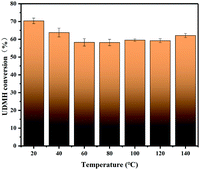
Fig. 11 demonstrates the effects of temperature on the degradation of UDMH in the range of 20–140 °C. UDMH conversion decreased as the temperature increased from 20 to 80 °C. The results suggest that UDMH adsorption on TiO2/rGA is an exothermic process. Elevating the temperature can promote molecular diffusion, enhancing the adsorption rate.28 Cation–π bonding and hydrogen bonding between UDMH and rGO also contribute to absorption.29 When the temperature was further increased, the UDMH conversion to other organics slightly increased. These results are similar to a previous report.28
 |
| | Fig. 11 The effects of temperature on UDMH conversion under UV light. | |
3.4.3 Reaction mechanism and the proposed degradation pathway of UDMH under UV light.
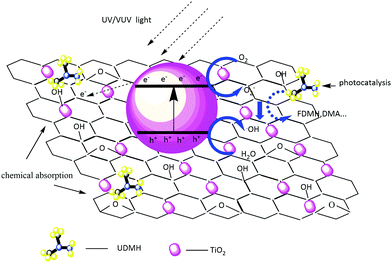
The UDMH degradation mechanism includes both chemical adsorption and a photocatalytic process. Fig. 12 schematically shows the degradation mechanism on TiO2/rGA. Because most of the oxygen-containing groups contribute to the adhesion of hydrophilic VOCs onto the carbon surface, the adsorption of UDMH on graphene can provide more opportunities for TiO2 to come into contact with UDMH. This allows further photocatalysis on TiO2/rGA. Electron–hole pairs can be generated by TiO2 when it absorbs photons with energy higher than the intrinsic bandgap energy. Graphene can effectively transfer the photogenerated electrons and prevent the recombination of h+ and e− on TiO2. Holes on the surface of TiO2 can rapidly react with water to form ˙OH. Also, oxygen radical will be generated upon the interaction of electrons with O2. The reactive oxygen species (ROS) can then react with UDMH.
 |
| | Fig. 12 A schematic diagram of the photocatalytic degradation mechanism on TiO2/rGA. | |
In order to further understand the possible UDMH transformation path, different intermediate products observed via GC-MS are listed in Fig. 13 and Table 2. The organic products vary considerably under different conditions. In dry air, the main components other than UDMH are formaldehyde dimethylhydrazone (FDMH), dimethylamine (DMA), and nitrosodimethylamine (NDMA).
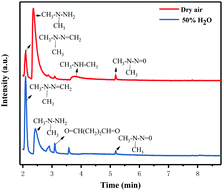 |
| | Fig. 13 Gas chromatograms of the degradation products of UDMH under UV light. | |
Table 2 Products observed during the reaction of 1,1-dimethyldrazine with TiO2–rGA under UV light
| Product |
Peak/min |
CAS no. |
Dry |
50% H2O |
| FDMH |
2.2 |
2035-89-4 |
+ |
+ |
| UDMH |
2.42 |
57-14-7 |
+ |
+ |
| Butanedial |
3.09 |
638-37-9 |
|
+ |
| DMA |
3.77 |
124-40-3 |
+ |
+ |
| NDMA |
5.19 |
62-75-9 |
+ |
+ |
The high yields of FDMH observed during the transformation of UDMH were initiated by H-abstraction from C–H bonds of UDMH. Firstly, –CH2˙ is formed in the presence of oxygen. Then, oxygen inserts into R–CH2˙ to form HCHO and methylhydrazine (MMH) (eqn (1)). Lastly, FDMH is formed when UDMH reacts with HCHO30 (eqn (2)). MMH can further be attacked by ozone to form methyl radicals (eqn (5)). The formed methyl radicals account for the observed DMA groups. When the humidity of UDMH gas is adjusted to 50%, a new peak appeared at 3.09, which was correspondingly assigned to butanedial. The formation of butanedial may involve the participation of hydroxide radicals. The hydroxide radicals can react with methyl radicals (eqn (5)) to form aldehydes.
| |  | (1) |
| | R2–NH2 + HCHO → R3–N![[double bond, length as m-dash]](https://www.rsc.org/images/entities/char_e001.gif) CH2 + H2O CH2 + H2O | (2) |
| |  | (4) |
| |  | (5) |
In eqn (1) and (2), R1 refers to (CH3)NNH2; R1H refers to MMH; R2 refers to (CH3)(CH3)N.
3.5. The photocatalytic degradation of UDMH under VUV light
3.5.1 Humidity.
The UDMH conversion levels under VUV light in both dry and moist air are about 95%, as shown in Fig. 14. The differences in UDMH conversion are negligible at different GO content levels. Presumably, most UDMH molecules were degraded in the gas phase and not on the photocatalyst surface.31 The VUV light used in the experiment, with a wavelength of 185 nm, generates energetic photons that can activate oxygen and water vapor to produce numerous reactive species, such as O(1D), O(3P), hydroxyl radicals (˙OH), and O3.32 VUV photolysis has been used to destroy VOCs like benzene and formaldehyde.33,34 The bonds of UDMH are initially destroyed by VUV photolysis and are then oxidized by residual O3 from photolysis. Due to the abundant reactive species generated in the gas phase, the oxidation degree of UDMH increases and the number of intermediates increases. When water was added, the UDMH conversion increased slightly, as more hydroxyl radicals (˙OH) were generated in the system.
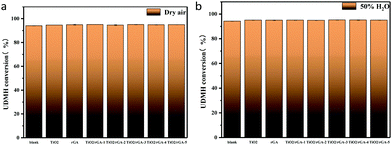 |
| | Fig. 14 UDMH conversion under VUV light in (a) dry air and (b) air at 50% humidity. | |
3.5.2 Temperature.
The UDMH conversion at different temperatures at 50% humidity is shown in Fig. 15. With an increase in temperature, the UDMH conversion is almost unchanged. Absorption is an exothermic reaction under UV light, while UDMH conversion increased slightly under VUV light. Therefore, adsorption does not play the main role and temperature has little effect on UDMH conversion, while photocatalysis and ozonation play the main role in the process.
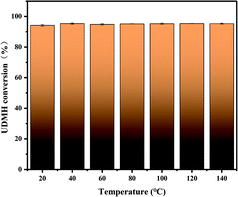 |
| | Fig. 15 The effects of temperature on UDMH conversion under UV light. | |
3.5.3 Reaction mechanism and the proposed degradation pathway of UDMH under VUV light.
The possible reaction mechanism of UDMH transformation is reliant on direct photolysis and photocatalysis reactions between UDMH and photogenerated ROS under VUV light. Different intermediate products are shown in Fig. 16, and the product details observed via GC-MS are listed in Table 3. The proportion of UDMH converted to other organics is almost 95%, much higher than under UV light. One of the degradation products, NDMA, has toxic mutagenic, teratogenic, and carcinogenic properties. It is noted that the yield of NDMA is obviously more than under UV light. Because more ozone can be produced under VUV light, the N–H bonds of UDMH could easily be attacked by ozone, and H-abstraction reactions can take place. Then, ozone attacks intermediates containing NH˙ free radicals to form NDMA30 (eqn (6)). NDMA can also be synthesized via combining FDMH with ozone (eqn (7)). The high yields of NDMA are confirmed in EC Tuzon's study.35 FDMH can also react with oxygen to produce (CH3˙)2NN and (CH3˙)2NN, which quickly combine to form 1,1,4,4-tetramethyl-1,2-tetrazene (TMT). Furthermore, NDMA and dimethylnitramine (NTDMA) can be formed in the presence of TMT upon adding ozone (eqn (8)). When water is involved in the reaction, the N![[double bond, length as m-dash]](https://www.rsc.org/images/entities/char_e001.gif) CH2 species in FDMH will convert to ˙CN and then react with ˙CH3 and UDMH to form (dimethylamino)acetonitrile.
CH2 species in FDMH will convert to ˙CN and then react with ˙CH3 and UDMH to form (dimethylamino)acetonitrile.| |  | (6) |
| |  | (7) |
| |  | (8) |
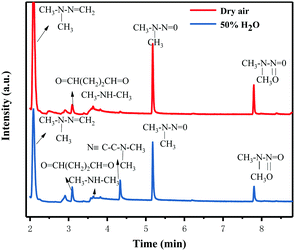 |
| | Fig. 16 Gas chromatograms of the degradation products of UDMH under VUV light. | |
Table 3 Products observed during the reaction of 1,1-dimethyldrazine with TiO2/rGA under VUV light
| Product |
Peak/min |
CAS no. |
Dry |
50% H2O |
| FDMH |
2.2 |
2035-89-4 |
+ |
+ |
| UDMH |
2.42 |
57-14-7 |
+ |
+ |
| Butanedial |
3.09 |
638-37-9 |
|
+ |
| DMA |
3.77 |
124-40-3 |
+ |
+ |
| (Dimethylamino)acetonitrile |
4.34 |
926-64-7 |
|
+ |
| NDMA |
5.19 |
62-75-9 |
+ |
+ |
| Dimethylnitramine (NTDMA) |
7.8 |
4164-28-7 |
+ |
+ |
3.6. Reusability of TiO2/rGA under UV light and VUV light
TiO2/rGA-3 was selected to investigate the stability and reusability of samples under UV light and VUV light. The sample was exposed to flowing UDMH gas for 3 h. Then it was washed three times in deionized water and dried at 110 °C prior to the next reaction cycle. As shown in Fig. 17, the UDMH conversion slightly decreased in UV and VUV light during the first cycle, due to partial sample loss. After five cycles, the samples still show stable UDMH conversion levels, implying good reusability during the degradation of UDMH.
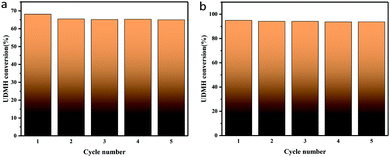 |
| | Fig. 17 The stability of a typical TiO2/rGA-3 sample under (a) UV and (b) VUV light. | |
4. Conclusions
In summary, a series of TiO2/rGA samples was prepared using titanium sulfate and GO as precursors. The morphologies and number of surface oxygen-containing groups of the TiO2/rGA samples varied considerably upon the addition of different amounts of GO, as determined through characterization studies. TiO2/rGA-3 exhibited extraordinary UDMH degradation performance under UV light. Moist conditions were conducive to the removal of gas-phase UDMH, and absorption on TiO2–rGA was an exothermic process. UDMH conversion could reach about 68% and 95% at 50% humidity under UV and VUV light, respectively. Compared with pure TiO2 and graphene, chemical interactions and the Schottky junction formed in TiO2–rGA accounted for the high charge separation and transmission efficiencies, which are helpful for improving the catalytic performance. TiO2/rGA-3 showed higher UDMH conversion under UV light, which was mainly due to chemical absorption between reducing UDMH and oxygen-containing groups. The mechanism of UDMH degradation under VUV light was attributed to photocatalysis and ozonation. The high UDMH conversion in a continuous fixed bed reactor shows that this photocatalyst system is useful for removing gas-phase UDMH in practice.
Conflicts of interest
There are no conflicts to declare.
Acknowledgements
This project is supported by the National Natural Science Foundation of China (21875281).
Notes and references
- X. Gao, X. Liu, Z. Zhu, Y. Gao, Q. Wang, F. Zhu and Z. Xie, Sci. Rep., 2017, 7, 973–982 CrossRef.
- J. Yang, Q. Shi, R. Zhang, M. Xie, X. Jiang, F. Wang, X. Cheng and W. Han, Carbon, 2018, 138, 118–124 CrossRef CAS.
- J. Wang, G. Zhang and P. Zhang, Appl. Catal., B, 2018, 239, 77–85 CrossRef CAS.
- L. Tian, L. Xing, X. Shen, Q. Li, S. Ge, B. Liu and L. Jie, Atmos. Pollut. Res., 2020, 11, 179–185 CrossRef CAS.
- A. J. Jafari, R. R. Kalantary, A. Esrafili and H. Arfaeinia, Process Saf. Environ. Prot., 2018, 116, 377–387 CrossRef CAS.
- H. Ye, Z. Wang, Y. Liu, S. Chen, H. Wang and Z. Wu, Catal. Lett., 2019, 149, 2739–2748 CrossRef CAS.
- J.-J. Li, B. Weng, S.-C. Cai, J. Chen, H.-P. Jia and Y.-J. Xu, J. Hazard. Mater., 2018, 342, 661–669 CrossRef CAS.
- W. Szeto, J. Li, H. Huang and D. Y. C. Leung, Chem. Eng. Sci., 2018, 177, 380–390 CrossRef CAS.
- X. Peng, M. Wang, F. Hu, F. Qiu, H. Dai and Z. Cao, J. Alloys Compd., 2019, 770, 1055–1063 CrossRef CAS.
- J. Vargas Hernández, S. Coste, A. García Murillo, F. Carrillo Romo and A. Kassiba, J. Alloys Compd., 2017, 710, 355–363 CrossRef.
- P. Tan, A. Zhu, L. Qiao, W. Zeng, H. Cui and J. Pan, J. Colloid Interface Sci., 2019, 533, 452–462 CrossRef CAS.
- K. Alamelu and B. M. Jaffar Ali, New J. Chem., 2020, 44, 7501–7516 RSC.
- A. Trapalis, N. Todorova, T. Giannakopoulou, N. Boukos, T. Speliotis, D. Dimotikali and J. Yu, Appl. Catal., B, 2016, 180, 637–647 CrossRef CAS.
- A. Ebrahimi and S. Fatemi, Clean Technol. Environ. Policy, 2017, 19, 2089–2098 CrossRef CAS.
- W. S. Hummers Jr and R. E. Offeman, J. Am. Chem. Soc., 1958, 80, 1339 CrossRef.
- X. Chen, Q. Chen, W. Jiang, Z. Wei and Y. Zhu, Appl. Catal., B, 2017, 211, 106–113 CrossRef CAS.
- C. Peng, W. Wang, W. Zhang, Y. Liang and L. Zhuo, Appl. Surf. Sci., 2017, 420, 286–295 CrossRef CAS.
- N. Shehzad, M. Tahir, K. Johari, T. Murugesan and M. Hussain, Appl. Surf. Sci., 2019, 463, 445–455 CrossRef CAS.
- S. Pei and H.-M. Cheng, Carbon, 2012, 50, 3210–3228 CrossRef CAS.
- A. J. Wang, W. Yu, Y. Fang, Y. L. Song, D. Jia, L. L. Long, M. P. Cifuentes, M. G. Humphrey and C. Zhang, Carbon, 2015, 89, 130–141 CrossRef CAS.
- H. Zhang, X. Lv, Y. Li, Y. Wang and J. Li, ACS Nano, 2010, 4, 380–386 CrossRef CAS.
- K. N. Kudin, B. Ozbas, H. C. Schniepp, R. K. Prud’homme, I. A. Aksay and R. Car, Nano Lett., 2008, 8, 36–41 CrossRef CAS.
- Y. Fan, W. Ma, D. Han, S. Gan, X. Dong and L. Niu, Adv. Mater., 2015, 27, 3767–3773 CrossRef CAS.
- M. Thommes, K. Kaneko, A. V. Neimark, J. P. Olivier, F. Rodriguez-Reinoso, J. Rouquerol and K. S. W. Sing, Pure Appl. Chem., 2015, 87, 1051–1069 CAS.
- S. Shuang, R. Lv, Z. Xie and Z. Zhang, Sci. Rep., 2016, 6, 26670 CrossRef CAS.
- X. Li, R. Shen, S. Ma, X. Chen and J. Xie, Appl. Surf. Sci., 2018, 430, 53–107 CrossRef CAS.
- J. Liu, Z. Wang, L. Liu and W. Chen, Phys. Chem. Chem. Phys., 2011, 13, 13216–13221 RSC.
- X. Zhang, B. Gao, A. E. Creamer, C. Cao and Y. Li, J. Hazard. Mater., 2017, 338, 102–123 CrossRef CAS.
- M. Maiti, M. Sarkar and D. Liu, Catal. Sci. Technol., 2020, 10, 2797–2809 RSC.
- D. Huang, X. Liu, Z. Xie, X. Wang, X. Gao and Y. Yang, Symmetry, 2018, 10, 394–406 CrossRef CAS.
- T. Z. Xu, H. Zheng and P. Y. Zhang, Build. Environ., 2018, 142, 379–387 CrossRef.
- T. M. Hashem, M. Zirlewagen and A. M. Braun, Water Sci. Technol., 1997, 35, 41–48 CrossRef CAS.
- H. Huang, H. Huang, Y. Zhan, G. Liu, X. Wang, H. Lu, L. Xiao, Q. Feng and D. Y. C. Leung, Appl. Catal., B, 2016, 186, 62–68 CrossRef CAS.
- P. F. Fu, P. Y. Zhang and J. Li, Int. J. Photoenergy, 2012, 2012, 174862 CrossRef.
- E. C. Tuazon, W. P. L. Carter, A. M. Winer and J. N. Pitts, Environ. Sci. Technol., 1981, 15, 823–828 CrossRef CAS.
Footnote |
| † Electronic supplementary information (ESI) available. See DOI: 10.1039/d0nj04617e |
|
| This journal is © The Royal Society of Chemistry and the Centre National de la Recherche Scientifique 2021 |
Click here to see how this site uses Cookies. View our privacy policy here.  ,
Jia
Ying
*,
Huang
Yuanzheng
,
Shen
Keke
and
Zhu
Huixin
,
Jia
Ying
*,
Huang
Yuanzheng
,
Shen
Keke
and
Zhu
Huixin
![[thin space (1/6-em)]](https://www.rsc.org/images/entities/char_2009.gif) :
:![[thin space (1/6-em)]](https://www.rsc.org/images/entities/char_2009.gif) 10) and DI water several times. The supernatant was then removed via centrifugation to obtain a brown slurry. Then, the slurry was diluted and subjected to ultrasonic treatment for 1 h before further use. To prepare TiO2/rGA, titanic sulfate (Ti(SO4)2) was chosen as the precursor, and glucose acted as the crosslinking agent and reducing agent. A certain amount (20 mg, 40 mg, 80 mg, 120 mg, or 160 mg) of GO, 0.03 g of glucose and 0.72 g of Ti(SO4)2 were magnetically stirred for 30 min and placed into a Teflon-lined autoclave, which was maintained at 180 °C for 12 h. The prepared TiO2/rGO hydrogel (rGH) samples were washed and dehydrated via freeze-drying to form TiO2/rGA samples, referred to as TiO2/rGA-1, TiO2/rGA-2, TiO2/rGA-3, TiO2/rGA-4, and TiO2/rGA-5. In this work, TiO2/rGA represents TiO2/rGA-3 unless otherwise specified. For comparison, rGA (without adding Ti(SO4)2) and TiO2 (without adding GO) were also synthesized via the same procedures.
10) and DI water several times. The supernatant was then removed via centrifugation to obtain a brown slurry. Then, the slurry was diluted and subjected to ultrasonic treatment for 1 h before further use. To prepare TiO2/rGA, titanic sulfate (Ti(SO4)2) was chosen as the precursor, and glucose acted as the crosslinking agent and reducing agent. A certain amount (20 mg, 40 mg, 80 mg, 120 mg, or 160 mg) of GO, 0.03 g of glucose and 0.72 g of Ti(SO4)2 were magnetically stirred for 30 min and placed into a Teflon-lined autoclave, which was maintained at 180 °C for 12 h. The prepared TiO2/rGO hydrogel (rGH) samples were washed and dehydrated via freeze-drying to form TiO2/rGA samples, referred to as TiO2/rGA-1, TiO2/rGA-2, TiO2/rGA-3, TiO2/rGA-4, and TiO2/rGA-5. In this work, TiO2/rGA represents TiO2/rGA-3 unless otherwise specified. For comparison, rGA (without adding Ti(SO4)2) and TiO2 (without adding GO) were also synthesized via the same procedures.
![[thin space (1/6-em)]](https://www.rsc.org/images/entities/char_2009.gif) sin
sin![[thin space (1/6-em)]](https://www.rsc.org/images/entities/char_2009.gif) θ = nλ) are 0.804 nm and 0.336 nm. The d-spacing of GO was broadened compared with natural graphite due to the introduction of functional groups between the graphite layers. The preparation of rGA involves the reverse process, namely the removal of functional groups from GO. The wide peak in rGA represents the high stripping of graphene and the formation of few-layer rGO sheets. The peaks at values of 25.3°, 37.8°, 48.1°, 54.4°, 62.9°, 69.9°, and 74.9° in the pure TiO2 and TiO2/rGA patterns can be respectively indexed to the (101), (004), (200), (211), (204), (220), and (215) planes of the TiO2 anatase phase (JCPDS-21-1272). Based on the Scherrer equation, the crystallite sizes of TiO2 in the pure TiO2 and TiO2/rGA samples were 11 and 14 nm, respectively, via assuming a shape factor of 0.9. Graphene and GO can hardly be seen in TiO2/rGA due to the low content and the decreased layer-regularity of graphene nanosheets.16
θ = nλ) are 0.804 nm and 0.336 nm. The d-spacing of GO was broadened compared with natural graphite due to the introduction of functional groups between the graphite layers. The preparation of rGA involves the reverse process, namely the removal of functional groups from GO. The wide peak in rGA represents the high stripping of graphene and the formation of few-layer rGO sheets. The peaks at values of 25.3°, 37.8°, 48.1°, 54.4°, 62.9°, 69.9°, and 74.9° in the pure TiO2 and TiO2/rGA patterns can be respectively indexed to the (101), (004), (200), (211), (204), (220), and (215) planes of the TiO2 anatase phase (JCPDS-21-1272). Based on the Scherrer equation, the crystallite sizes of TiO2 in the pure TiO2 and TiO2/rGA samples were 11 and 14 nm, respectively, via assuming a shape factor of 0.9. Graphene and GO can hardly be seen in TiO2/rGA due to the low content and the decreased layer-regularity of graphene nanosheets.16
![[double bond, length as m-dash]](https://www.rsc.org/images/entities/char_e001.gif) C, C
C, C![[double bond, length as m-dash]](https://www.rsc.org/images/entities/char_e001.gif) O, and O
O, and O![[double bond, length as m-dash]](https://www.rsc.org/images/entities/char_e001.gif) C–O bonds of TiO2/rGA and GO. The peak intensities of the oxygen-containing groups were reduced after the hydrothermal reaction, indicating that GO had been reduced. Notably, a few C
C–O bonds of TiO2/rGA and GO. The peak intensities of the oxygen-containing groups were reduced after the hydrothermal reaction, indicating that GO had been reduced. Notably, a few C![[double bond, length as m-dash]](https://www.rsc.org/images/entities/char_e001.gif) O and O
O and O![[double bond, length as m-dash]](https://www.rsc.org/images/entities/char_e001.gif) C–O bonds can still be found in TiO2/rGA.
C–O bonds can still be found in TiO2/rGA.
![[double bond, length as m-dash]](https://www.rsc.org/images/entities/char_e001.gif) O stretching vibrations, molecular water or C
O stretching vibrations, molecular water or C![[double bond, length as m-dash]](https://www.rsc.org/images/entities/char_e001.gif) C vibrations, C–OH bending vibrations, and C–O stretching vibrations or epoxy C–O–C vibrations in GO appear at 1734, 1633, 1200, and 1080 cm−1, respectively. The abundant oxygen-containing groups on the surface indicate the good hydrophilicity of GO,18 easing its dispersal in water and bonding with other elements. During hydrothermal treatment, overheated supercritical water can play the role of a reducing agent, leading to decreases in the intensities of C
C vibrations, C–OH bending vibrations, and C–O stretching vibrations or epoxy C–O–C vibrations in GO appear at 1734, 1633, 1200, and 1080 cm−1, respectively. The abundant oxygen-containing groups on the surface indicate the good hydrophilicity of GO,18 easing its dispersal in water and bonding with other elements. During hydrothermal treatment, overheated supercritical water can play the role of a reducing agent, leading to decreases in the intensities of C![[double bond, length as m-dash]](https://www.rsc.org/images/entities/char_e001.gif) O stretching vibrations and C–O/C–O–C vibrations in TiO2/rGA. The changes show the reduction of GO, as shown by XPS, and previous research produced similar results.19 The C–OH bonds exhibit more intense peaks in TiO2/rGA than GO due to interactions between graphene and hydroxyl groups after the hydrolysis of titanous sulfate. The wide peak between 500 and 900 cm−1 could be ascribed to Ti–O–Ti and Ti–O–C, confirming the chemical interaction between TiO2 and graphene.20,21 Comparing TiO2/rGA with different GO content levels, the C–OH and C–O/C–O–C peaks at 1200 and 1080 cm−1 in TiO2/rGA-3 are relatively high. This is due to a combination of the hydrolysis of titanous sulfate and the reduction of GO, which vary at different GO content levels and for different structures.
O stretching vibrations and C–O/C–O–C vibrations in TiO2/rGA. The changes show the reduction of GO, as shown by XPS, and previous research produced similar results.19 The C–OH bonds exhibit more intense peaks in TiO2/rGA than GO due to interactions between graphene and hydroxyl groups after the hydrolysis of titanous sulfate. The wide peak between 500 and 900 cm−1 could be ascribed to Ti–O–Ti and Ti–O–C, confirming the chemical interaction between TiO2 and graphene.20,21 Comparing TiO2/rGA with different GO content levels, the C–OH and C–O/C–O–C peaks at 1200 and 1080 cm−1 in TiO2/rGA-3 are relatively high. This is due to a combination of the hydrolysis of titanous sulfate and the reduction of GO, which vary at different GO content levels and for different structures.


![[double bond, length as m-dash]](https://www.rsc.org/images/entities/char_e001.gif) O, C–OH, and C–O–C decreased after degradation, and two new peaks due to C–H and N–H appeared. Degradation may arise due to chemical interactions between reducing UDMH and oxygen-containing groups. As shown in Fig. 4 and 5, the reduction degree of TiO2/rGA-3 is weaker and the number of oxygen-containing groups on TiO2/rGA-3 is higher than the other samples. It can be deduced that the increased activity of TiO2/rGA-3 can mainly be accredited to chemical absorption on oxygen-containing groups.
O, C–OH, and C–O–C decreased after degradation, and two new peaks due to C–H and N–H appeared. Degradation may arise due to chemical interactions between reducing UDMH and oxygen-containing groups. As shown in Fig. 4 and 5, the reduction degree of TiO2/rGA-3 is weaker and the number of oxygen-containing groups on TiO2/rGA-3 is higher than the other samples. It can be deduced that the increased activity of TiO2/rGA-3 can mainly be accredited to chemical absorption on oxygen-containing groups.
![[double bond, length as m-dash]](https://www.rsc.org/images/entities/char_e001.gif) CH2 + H2O
CH2 + H2O

![[double bond, length as m-dash]](https://www.rsc.org/images/entities/char_e001.gif) CH2 species in FDMH will convert to ˙CN and then react with ˙CH3 and UDMH to form (dimethylamino)acetonitrile.
CH2 species in FDMH will convert to ˙CN and then react with ˙CH3 and UDMH to form (dimethylamino)acetonitrile.


