 Open Access Article
Highly stable and bright blue light-emitting diodes based on carbon dots with a chemically inert surface†
Tianyang
Zhang
a,
Xiao
Wang
a,
Zhenyu
Wu
a,
Tianyu
Yang
a,
Han
Zhao
a,
Jiawei
Wang
a,
Hui
Huang
 a,
Yang
Liu
*a and
Zhenhui
Kang
 *ab
*ab
aInstitute of Functional Nano and Soft Materials (FUNSOM), Jiangsu Key Laboratory for Carbon-based Functional Materials and Devices, Soochow University, Suzhou 215123, China. E-mail: zhkang@suda.edu.cn; yangl@suda.edu.cn
bMacao Institute of Materials Science and Engineering, Macau University of Science and Technology, Taipa 999078, Macau SAR, China
First published on 4th October 2021
Abstract
The manufacture of blue light-emitting diodes (LEDs) has always been a tough problem to solve in the display and illumination fields. Inorganic/organic semiconductors and carbon dots (CDs) with a wide band gap still face obstacles such as a low external quantum efficiency (EQE) and poor stability. Herein, we synthesized highly stable and blue emission CDs with a chemically inert surface, and the photoluminescence (PL) peak (in ultra-pure water) of which is located at 446 nm with an absolute PL quantum yield (PLQY) of 26.4%. The LEDs based blue emission CDs exhibit an electroluminescence (EL) peak located at 456 nm and a high brightness of 223 cd m−2 with an EQE of 0.856%. The Commission Internationale del'Eclairage (CIE) coordinates are located at (0.21, 0.23) and the device lifetime with 65% brightness (T65) reaches over 217 h because of the chemically inert surface of the CDs. The results mean the devices are the most stable CDs-LEDs reported to date. This work represents a novel route for the preparation of low cost, highly stable and very bright CDs-LEDs with a short wavelength emission.
1. Introduction
In principle, pure blue light-emitting diodes (LEDs) are regulated as being (0.14, 0.08) in the Commission Internationale del'Eclairage (CIE) by the classical National Television System Committee (NTSC 1953).1 Blue LEDs are used in display devices, high power laser diodes, medical treatments and so on.2 Notably, pure blue LEDs are one of the significant dopants, along with pure red and green LEDs, which play a key role in modulated white LEDs.3 However, blue LEDs still face great challenges in their fabrication in spite of the rapid development of LEDs. The low quantum efficiency, inferior saturated color purity and poor stability are bottlenecks to the development of blue LEDs, which are hardly reported nowadays.2,4–11 Carbon dots (CDs) are a type of brand-new zero dimensional material based on carbon nanomaterials, and they have significant applications in the fields of biological imaging, optoelectronics, biosensors, photoelectrocatalysis, medical treatments and for use as LEDs.12–15 Due to their nontoxicity, environmental protection, good biocompatibility and simple synthesis methods, CDs have tremendous advantages in the field of optical materials.16,17 Recently, CDs have paved a new way for the development of LEDs owing to their high photoluminescence quantum yield (PLQY), fluorescence stabilization, resistance to photobleaching, adjustable excitation wavelength and emission wavelength, and their good solubility.15,18–30 Kang et al. successfully manufactured bright violet CDs-LEDs with a PLQY of 23.9% and the highest reported luminance of 163 cd m−2.31 Ultra-bright and blue CDs-LEDs possessed a PLQY of 88.9% and in addition to producing the highest reported brightness of 648 cd m−2, the external quantum efficiency (EQE) of which reached 2.114%. The half lifetime of the device reached 200 h, which was the longest lifetime recorded at the time.32 Moreover, the regulatable correlated color temperature (CCT) of the CDs based white LEDs are able to enforce by machine learning, which is to use computer algorithm to learn the change trend of color temperature of existing white light devices, and finally output the CDs proportion corresponding to different CCTs, so as to guide the experiments.33 Last but not least, Sargent et al. engineered deep blue LEDs based on CDs modified using amino functional groups with a high brightness and EQE.34 However, the amino functional group is a type of active group that is not suitable for producing stable devices made on CDs. Furthermore, highly efficient and stable blue CDs based LEDs are still a thorny obstacle for the production of full spectrum CDs-LEDs.6,32,34–38Herein, we demonstrate highly stable and blue CDs with a chemically inert surface without modification of the amino functional groups that were synthesized using malonylurea and citric acid by a simple one-step hydrothermal method. The PL peak of the blue CDs is centered at 446 nm in ultra-pure water and possesses a PLQY of 26.4%. Then, the functional emission layer was spin-coated using the blue CDs doped in poly(vinylcarbazole) (PVK), designated as CDP, to fabricate the blue CDs-LEDs. The electroluminescence (EL) peak of the devices is located at 456 nm and the highest reported brightness of 223 cd m−2 is observed with a high EQE of 0.856%. The CIE coordinates are situated at (0.21, 0.23), towards the blue region, which is regulated by the classical National Television System Committee (NTSC 1953). The device lifetime, with a 65% brightness (T65), reached over 217 h because of the chemically inert surface of the CDs. The results show that the devices are the most stable CDs-LEDs reported to date. Based on the luminescence properties, these CDs have the potential to become active materials for next generation LEDs.
2. Experimental section
2.1. Materials
All materials and reagents used within the work were purchased from China National Pharmaceutical Industry Corporation Ltd.2.2. Synthesis of carbon dots
Briefly, 200 mg malonylurea and 100 mg citric acid were dispersed in 15 mL ultra-pure water. Then, 50 μL ethylenediamine was added to the mixed solution. We transferred the solution into hydrothermal reaction vessels, the volume of which was 20 mL and warmed them up to 160 °C for 10 h. By cooling to room temperature, a turbid liquid was achieved. Advanced purification was obtained using silica gel column chromatography with dichloromethane and methanol as eluents. Finally, deep blue powders of CDs were acquired using a rotary evaporator and stored in hermetic containers.2.3. Fabrication of carbon dots light-emitting diodes
Indium-tin-oxide (ITO) on a glass substrate was used as the anode for the blue emission CDs-LEDs. After cleaning by using ultraviolet ozone, the poly (3,4-ethylenedioxythiophene): poly(styrenesulfonate) (PEDOT:PSS) was formed on the ITO surface through spin-coating as the hole injected layer (HIL) and then the film was annealed at 130 °C for 10 min. After cooling for 10 min, the CDP dispersed in chloroform was spin-coated on the HIL as the active emission layer and then annealed at 130 °C for a further 10 min. After that we used thermal evaporating coating equipment to thermally evaporate the other functional layers of the devices in the following order: 20 nm 1,3,5-tris(N-phenylbenzimidazol-2-yl)benzene (TPBi) as the electron transport layer (ETL), 2 nm 8-quinolinolato lithium (Liq) as the electron injected layer (EIL) and 100 nm Al as the cathode for the devices. The special mask that was used in the process of thermal evaporation allows a luminous area of 1 mm2 for the CDs. Finally, a quartz chip was applied to package the effective luminous area of the blue emission CDs-LEDs in case of destruction by H2O and O2 in the air.3. Results and discussion
3.1. Structural characterization of the carbon dots
The morphological analysis of CDs is shown by using transmission electron microscopy (TEM) in Fig. 1a. The CDs are well-dispersed with roughly uniform sizes. The high resolution transmission electron microscopy (HRTEM) image (inset in Fig. 1a) implies that the clear lattice fringes of the CDs possess a lattice spacing of 0.21 nm, which is attributed to the (100) lattice plane of the CDs.39 The dimension distributions of CDs are narrow and are homogeneously illustrated in Fig. S1.† Notably, the average size of the CDs is approximately 2.42 nm, obtained by counting 300 particles, which is instrumental to the pure color emission of the LEDs made of them.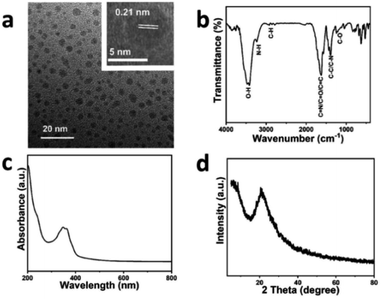 | ||
| Fig. 1 Structural characterizations of the CDs. (a) TEM and HRTEM images of the CDs. (b) FTIR spectrum of the CDs. (c) UV-vis spectrum of the CDs. (d) XRD pattern for the CDs. | ||
The Fourier transform infrared spectroscopy (FTIR) spectrum displayed in the Fig. 1b exhibits the stretching vibrations and bending vibrations of the surface functional groups of the CDs. The peaks observed at 3436, 3230, 2866 and 1631 cm−1 are respectively ascribed to the stretching vibrations of O–H, N–H, C–H and C![[double bond, length as m-dash]](https://www.rsc.org/images/entities/char_e001.gif) N/C
N/C![[double bond, length as m-dash]](https://www.rsc.org/images/entities/char_e001.gif) O/C
O/C![[double bond, length as m-dash]](https://www.rsc.org/images/entities/char_e001.gif) C. The flexural vibrations of C–C/C–N and C–O are observed at 1382 and 1238 cm−1.31,32,40 Ultraviolet and visible spectrophotometry (UV-vis) is usually used to study the optical absorption properties of the materials. In Fig. 1c, the strong absorption peak situated at 204 nm represents the π–π* transition of the conjugated aromatic C
C. The flexural vibrations of C–C/C–N and C–O are observed at 1382 and 1238 cm−1.31,32,40 Ultraviolet and visible spectrophotometry (UV-vis) is usually used to study the optical absorption properties of the materials. In Fig. 1c, the strong absorption peak situated at 204 nm represents the π–π* transition of the conjugated aromatic C![[double bond, length as m-dash]](https://www.rsc.org/images/entities/char_e001.gif) C bond. The peaks centered at 348 and 362 nm are assigned to the n–π* transition of the double bonds, which include C
C bond. The peaks centered at 348 and 362 nm are assigned to the n–π* transition of the double bonds, which include C![[double bond, length as m-dash]](https://www.rsc.org/images/entities/char_e001.gif) O and C
O and C![[double bond, length as m-dash]](https://www.rsc.org/images/entities/char_e001.gif) N.31 The X-ray diffractometry (XRD) pattern was used to analyze the matter phase as usual. The XRD pattern (Fig. 1d) shows a broad peak situated at approximately 21°, which is in contrast to the graphite structure and the (002) lattice plane of the CDs.41
N.31 The X-ray diffractometry (XRD) pattern was used to analyze the matter phase as usual. The XRD pattern (Fig. 1d) shows a broad peak situated at approximately 21°, which is in contrast to the graphite structure and the (002) lattice plane of the CDs.41
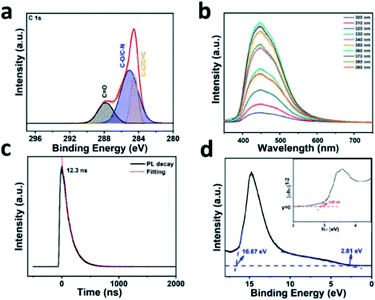
The survey spectrum for the X-ray photoelectron spectroscopy (XPS) demonstrated that the CDs contain the elements C, O and N, as shown in Fig. S2a,† which are respectively centered at 284.1, 400.1, and 531.1 eV. In the high resolution XPS spectra, the bonding structures can be analyzed clearly. The C 1s XPS spectrum in Fig. 2a shows that three peaks are centered at 287.8, 285.1 and 284.5 eV, which are attributed to C![[double bond, length as m-dash]](https://www.rsc.org/images/entities/char_e001.gif) O, C–O/C–N and C–C/C
O, C–O/C–N and C–C/C![[double bond, length as m-dash]](https://www.rsc.org/images/entities/char_e001.gif) C, respectively. The N 1s XPS spectrum shown in Fig. S2b† is deconvoluted into two peaks situated at 400.8 and 399.7 eV, which are attributed to graphitic N and pyridinic N. The loss of intensity of the amino N suggests that the surface of the blue emission CDs contain no amino functional groups, which means the CDs possess a chemically inert surface, resulting in a good stability. In addition, the O 1s spectrum displays C
C, respectively. The N 1s XPS spectrum shown in Fig. S2b† is deconvoluted into two peaks situated at 400.8 and 399.7 eV, which are attributed to graphitic N and pyridinic N. The loss of intensity of the amino N suggests that the surface of the blue emission CDs contain no amino functional groups, which means the CDs possess a chemically inert surface, resulting in a good stability. In addition, the O 1s spectrum displays C![[double bond, length as m-dash]](https://www.rsc.org/images/entities/char_e001.gif) O and C–O with binding energies of 531.4 and 533.4 eV in Fig. S2c.†
O and C–O with binding energies of 531.4 and 533.4 eV in Fig. S2c.†![[thin space (1/6-em)]](https://www.rsc.org/images/entities/char_2009.gif) 41–43 Taken together, the XPS and FTIR spectra prove that the CDs contain no amino groups in the structure.
41–43 Taken together, the XPS and FTIR spectra prove that the CDs contain no amino groups in the structure.
Fig. S3† shows the PL spectrum of the CDs with a chemically inert surface under an ultraviolet excitation of 360 nm. The PL peak for the CDs is centered at 446 nm (in ultra-pure water) under a 360 nm excitation xenon lamp source and has an absolute PLQY of 26.4%. In Fig. 2b, the PL peak is observed at about 446 nm with excitation wavelengths increasing from 320 to 600 nm, which indicates that the emission is excitation-independent.31Fig. 2c shows the time-resolved PL (TRPL) spectrum of the CDs, which is used for analysis of the principle of the dynamic carrier recombination of CDs. The 300 nm laser was used as the excitation source to study the emission wavelength at 446 nm for the CDs. For the curve obtained from the test, the mono-exponential decay function was chosen to fit the attenuation curve of the lifetime. The fitting consequence shows the lifetime of the blue CDs is 12.3 ns, which is mainly attributed to the radiative recombination, resulting in the good stability of the PL emission.41,42 In the inset image shown in Fig. 2d, light quantum energy (hν) is employed as the lateral axis and the (αhν)1/2 is employed as the longitudinal axis to redisplay the UV-vis absorbance spectrum in order to calculate the bandgap of the CDs, in which α is the absorbance in the UV-vis spectrum. According to the tangent method, the value of the bandgap is implied to be 2.87 eV, as assigned to the PL peak of 446 nm. The positions of the energy bands and the bandgap energies can be analyzed using ultraviolet photoelectron spectroscopy (UPS). Significantly, the Fermi edge and the end edge were both determined by Fig. 2d. The position of the highest occupied molecular orbital (HOMO) can be found using the formula 21.22 eV − (16.67 − 2.81) eV = −7.36 eV (EVB = −(21.22 − (Eendedge − Efermi))), (ECB = EVB + Ebandgap), in which 21.22 eV is the energy of He I.32 Meanwhile, the position of the lowest unoccupied molecular orbital (LUMO) is acquired in the same way, which is (7.36 − 2.87) eV = −4.49 eV. The results of the UPS directly demonstrate the bandgap transitions of the carriers in the CDs.
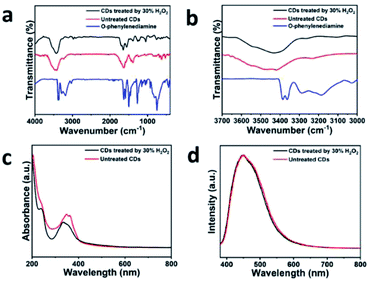
In order to ensure the CDs include no amino functional groups, the sample was treated using 30% H2O2 using the heating condensation reflux method for 5 h. Eventually, CDs treated using 30% H2O2 were obtained and then went through analysis using FTIR, UV-vis and PL in the proper sequence. The FTIR spectra of the treated and untreated CDs are exhibited in Fig. 3a with that of O-phenylenediamine, which is rich in amino functional groups and is used as the reference sample to compare the signal intensity of the amino functional groups. The peaks for the blue line, which refers to O-phenylenediamine observed at 3385 and 3361 cm−1, are assigned to the characteristic signals of the primary amines, which are clearly shown in Fig. 3b. The FTIR spectrum of the treated CDs (the black line) shows the peaks located at 3433, 3258, 2914, and 1639 cm−1, which are similar to the untreated CDs. Meanwhile, the characteristic peaks assigned to N–H, which are respectively located at 3258 and 1427 cm−1, possess a lower transmittance than those of untreated CDs. The comparison results prove that the originally synthesized CDs contain no active amino functional groups after treatment using 30% H2O2 and the CDs possess a reduced amount of N–H. Fig. 3c exhibits untreated CDs and the UV-vis spectra of the CDs treated using 30% H2O2. The decrease in absorbance for the treated CDs at 362 nm corresponds to the loss of N–H on the surface of the CDs due to hydrogen peroxide treatment. A comparison of the PL spectra of the untreated CDs and the CDs treated using 30% H2O2 is shown in Fig. 3d. Both the PL spectra share extremely similar shapes and locations of peaks, which implies that the fluorescence properties of CDs after hydrogen peroxide treatment hardly change. The results also prove that the CDs contain no amino functional groups that could be harmful to the stability of the CDs. In other words, CDs with a chemically inert surface are successfully manufactured.
3.2. Electroluminescence properties of the carbon dots light-emitting diodes
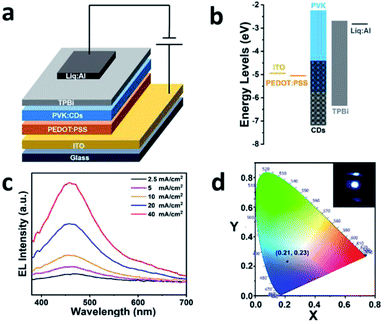
An ordinary and generally accepted structure was employed for the fabrication of the CDs-LEDs illustrated in Fig. 4a. In the order of bottom-up, the devices were composed of an ITO glass substrate as the anode of the device, PEDOT:PSS as the HIL, the blue CDs with the chemically inert surface mixed in PVK as the actively functional layer, TPBi as the ETL, Liq as the EIL and a Liq/Al double-layered cathode.26 As observed in the energy level diagram for the blue CDs based LEDs displayed in Fig. 4b, it is suggested that the HOMO and LUMO energy levels are instrumental in the carrier transmission in the devices because of the weak energy barriers that block the injection of carriers from the anode and the cathode to the active emission layer. Consequently, the carriers can be concentrated on the active emission layer, the surfaces of which are located between the HTL and functional emission layer or the ETL and functional emission layer. Then, the carriers can demonstrate radiative recombination at the active emission layer while generating EL.As shown in Fig. S4a,† the EL spectra of the CDs mixed in PVK were used to study the EL properties of the CDs-LEDs at different CDs to PVK mass ratios. More performances for the EL CDs-LED were tested, as shown in Fig. S4b,† which demonstrates the best performance with a high brightness and low driven voltage could be acquired when the mass ratio of the CDs to PVK is 40 wt%. In addition, the CDs treated by 30% H2O2 were also used to fabricate the other CDs-LEDs with 40 wt% CDP. The EL spectra of the treated and untreated CDs, in which the current densities both reach 40 mA cm−2, are displayed together in Fig. S5† to allow comparison with each other. The contrast results imply that the EL spectra of the CDs before and after hydrogen peroxide treatment hardly differ from each other, which suggests that the CDs possess a chemically inert surface and the devices based on them have an excellent stability. In the following discussion, the EL performances of the blue CDs-LEDs with 40 wt% CDP are primarily considered.
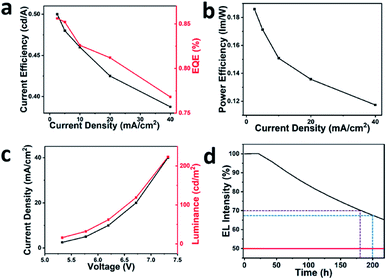
Fig. 4c and d and 5 depict the EL performances for the 40 wt% CDP LEDs. In Fig. 4c, the EL peaks are all situated at 456 nm and are bathochromic shifted by 10 nm in contrast to the PL spectra of the blue CDs. Moreover, the location of the PL peaks remains constant and the intensity of them increases gradually as the current density is increased from 2.5 to 40 mA cm−2. In Fig. 4d, the CIE coordinates are located at (0.21, 0.23), towards the blue region and the image inserted in Fig. 4d shows a photograph of the CDP LEDs. As exhibited on the curve of the current efficiency (black line) versus the current density in Fig. 5a, the maximum current efficiency is 0.5 cd A−1 corresponding to the current density for 2.5 and 5 mA cm−2 at which the devices achieve the optimum performance. The curve of EQE (red line) versus current density, which is also illustrated in Fig. 5a, shows the EQE of the completed CDs-LEDs attains 0.856%. Fig. 5b clearly shows the curve for the relationship between the current density and the power efficiency. At first, there is a significant decline in the power efficiency while the current density is low. The power efficiency immediately exhibits a smooth constant rate of descent as the current efficiency enlarges to 10 mA cm−2, which demonstrates the carriers have an excellent mobility when transmitting and recombining between the interfaces of each of the functional layers.
The curve of the relationship between the voltage and the current density is shown in Fig. 5c. The threshold voltage of the CDs-LEDs is 5.4 V owing to the increasing quantity of CDs, which means that the CDs-LEDs possess a good electroconductibility, which is one of the criteria used to judge the quality of LEDs. The slope of the curve from the point after 5.4 V seems to be a constant, which indicates that the blue CDs-LEDs possess excellent stability properties. The curve of luminance versus voltage of the CDs-LEDs is also displayed in Fig. 5c. The luminance reaches the maximum 223 cd m−2 at the voltage of 7.3 V for devices with a luminance area of 1 mm2. The device lifetime with a 65% brightness (T65) for blue CDs-LEDs is exhibited in Fig. 5d. The unsealed devices are proved to possess a lifetime of over 217 h when the brightness decays to 65%. The violet line shows that the lifetime of the CDs-LEDs reached 181 h when the brightness decayed to 70%. Compared with previously reported stable blue CDs-LEDs, in which only 50% remain after 200 h, the blue line shows that the brightness of the CDs-LEDs remains at about 67.5% when the time reaches 200 h, which means these are the most stable CDs-LEDs reported to date.32 The results indicate the highly stable performance of the EL, exhibited by the very stable blue emission, as the active emission layers for the devices.
3.3. Electroluminescence mechanism of the carbon dot light-emitting diodes
Different contents of CDs to PVK mass ratios were used to make CDs-LEDs and ultimately the optimal quality ratio was found to be 40 wt% of CDs to PVK, which corresponds to the outcomes from the EL spectra. As illustrated in Fig. 6a, the normalized UV-vis absorption spectrum of the CDs shares a large overlapping area with the normalized PL spectrum of PVK, which means that CDs can absorb the photons that are emitted from the PVK and emit photons out of themselves. Fig. S6† shows the TRPL spectra of the pure CDs, pure PVK and various mass fractions of CDP. The TRPL spectrum of pure CDs is the mono-exponential attenuation for the PL lifetime of 12.3 ns and that of pure PVK is a double exponent attenuation for the PL lifetime of 22.85 ns. The TRPL spectra of various mass ratios of 0.5 wt%, 1 wt%, 2 wt%, 3 wt% and 4 wt% CDs to PVK, for which the PL lifetime are respectively 10.87 ns, 10.82 ns, 10.02 ns, 9.84 ns and 9.67 ns, are all double exponential decay. With the increase in the concentration of CDs, the PL lifetime of CDP rises gradually to 11.09 ns, which is still faster than that of the pure CDs. All the TRPL spectra of CDP, except for the mass ratio of 40 wt% CDs to PVK show double exponential decay, indicating that two thoroughfares exist for carriers recombining as pure PVK. Moreover, it suggests that the CDs form into an excimer polymer with the PVK in the solution. Most TRPL spectra for CDP demonstrate double exponential decay among the samples, which means a loss of energy occurs during the process of energy transmission between the CDs and PVK. Notably, it can be convincingly proved that complete transfer of energy occurs between the PVK and CDs as the TRPL spectra for 40 wt% of CDP demonstrate mono-exponential decay, which is also less than that observed for pure CDs. Consequently, it demonstrates that the mode of energy transmission from the PVK to CDs is Förster resonance energy transfer (FRET). The topography and roughness of the film surfaces were analyzed using atomic force microscopy (AFM). In Fig. S7,† the AFM image shows the CDP in the film enables excellent dispersion without any obvious cluster phenomena, which also proves the good compatibility of the CDP at the same time. Moreover, the AFM image reveals the low surface roughness of the film, which is formed by CDP, with a roughness value of 0.826 nm for a root mean square.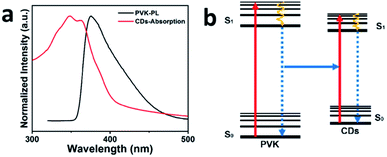 | ||
| Fig. 6 The mechanism of FRET. (a) PL spectrum of PVK (black line) and normalized UV-vis absorption spectrum of the CDs (red line). (b) Schematic FRET from the PVK to CDs. | ||
Based on the above experimental results and analysis, Fig. 6b explains the process of FRET between the CDs and PVK. When the voltage is applied to both ends of the devices, the carriers, including electrons and holes, are excited from the ground state to the excited state. After transmission between different transport layers, electrons and holes recombine at the functional layers and then release photons outward. In the whole process, the photons resulting from the recombination of electrons and holes are first absorbed by the PVK. Then, the PVK releases energy and produces photons that are totally absorbed by the CDs to then emit blue light outward.32,44 The EL spectra contains no PVK EL spectra as a result of the complete energy transmission between the CDs and PVK.
The highly stable blue CDs were obtained using a one-step hydrothermal method with an emission peak of 446 nm and a PLQY of 26.4%. The traditional design for the device structure of a quantum light emitting diode (QLED) is used for reference to manufacture the blue emission CDs-LEDs. Notably, the brightness of blue emission CDs-LEDs reaches 223 cd m−2 and the CIE coordinates are located at (0.21, 0.23), which are in the blue region according to the criteria set by NTSC 1953. In addition, CDs-LEDs possess excellent characteristics compared with the instantly popular organic light emitting diodes (OLEDs) and quantum light emitting diodes (QLEDs). Firstly, carbon materials are abundant on earth and easy to mine and extract.20 The carbon element is also one of the basic elements used to construct life and CDs are a non-toxic and harmless functional material, which have natural advantages compared with traditional OLEDs or QLEDs materials that contain toxic substances such as heavy metals.15,19 Next, amino functional groups possess very strong activities, meaning that they are harmful to the stability of the devices. However, for our blue CDs, the CDs contain no amino functional groups, which shows that the CDs have a chemically inert surface and a very stable performance for use as CDs-LEDs. Eventually, the blue CDs can be stored in air at normal temperature and pressure for a long time, which indicates that the blue CDs are easy to store and the blue CDs are also stable materials with a short wavelength emission for LEDs.25–30 Table S1 (ESI†) summarizes the key optical parameters of the LEDs based quantum dots and CDs, including the corresponding half lifetime and EQE of the solution-processing LEDs. This work on blue CDs-LEDs opens up a novel route for the low cost development of stable and high performance LEDs. However, the EQE of the CDs-LEDs is still limited by the theoretical boundary of 5% because of the forbidden transitions of the triplet states. Significant contributions still need to be made to improve the LEDs based on CDs so that CDs can become the key materials used to promote the development of next generation LEDs.
4. Conclusion
Highly stable CDs exhibiting blue emission with a chemically inert surface were produced by a one-step hydrothermal method with malonylurea and citric acid. The PL peak of the CDs is centered at 446 nm in ultra pure water with a PLQY of 26.4%. Then, the CDP forms an active emission layer to fabricate highly stable and bright CDs based LEDs. The CDs-LEDs possess a brightness of 223 cd m−2, as a result of the highly stable CDs, and an EQE of 0.856% with a device lifetime that demonstrates a 65% brightness (T65) over 217 h, which are the most stable CDs-LEDs reported to date. The CIE coordinates of the CDs-LEDs are located at (0.21, 0.23). This work demonstrates a novel method for the preparation of low cost, highly stable and very bright CDs-LEDs, which have a short wavelength emission. These CDs-LEDs have a huge potential to become next generation active materials for use in LEDs.Conflicts of interest
There are no conflicts to declare.Acknowledgements
This work is supported by the National MCF Energy R&D Program of China (2018YFE0306105), the National Key R&D Program of China (2020YFA0406104), the Innovative Research Group Project of the National Natural Science Foundation of China (51821002), the National Natural Science Foundation of China (51725204, 21771132, 51972216, 52041202), the Natural Science Foundation of Jiangsu Province (BK20190041), the Key-Area Research and Development Program of Guang Dong Province (2019B010933001), the Collaborative Innovation Center of Suzhou Nano Science & Technology, and the 111 Project.Notes and references
- X. Cai and S.-J. Su, Adv. Funct. Mater., 2018, 28, 1802558 CrossRef.
- G. Eda, Y. Y. Lin, C. Mattevi, H. Yamaguchi, H. A. Chen, I. S. Chen, C. W. Chen and M. Chhowalla, Adv. Mater., 2010, 22, 505–509 CrossRef CAS PubMed.
- L. G. Reventlow, W. Jiang, D. M. Stoltzfus, S. M. Russell, P. L. Burn and A. Colsmann, Adv. Opt. Mater., 2020, 8, 7196–7203 Search PubMed.
- C. Bi, Z. Yao, X. Sun, X. Wei, J. Wang and J. Tian, Adv. Mater., 2021, 33, 2006722 CrossRef CAS PubMed.
- M. K. Gangishetty, S. Hou, Q. Quan and D. N. Congreve, Adv. Mater., 2018, 30, 1706226 CrossRef PubMed.
- K. Jiang, S. Sun, L. Zhang, Y. Lu, A. Wu, C. Cai and H. Lin, Angew. Chem., Int. Ed., 2015, 54, 5360–5363 CrossRef CAS PubMed.
- H. H. Kuo, Y. T. Chen, L. R. Devereux, C. C. Wu, M. A. Fox, C. Y. Kuei, Y. Chi and G. H. Lee, Adv. Mater., 2017, 29, 1702464 CrossRef PubMed.
- S. Y. Lee, C. Adachi and T. Yasuda, Adv. Mater., 2016, 28, 4626–4631 CrossRef CAS PubMed.
- X. Li, J. Zhang, Z. Zhao, L. Wang, H. Yang, Q. Chang, N. Jiang, Z. Liu, Z. Bian, W. Liu, Z. Lu and C. Huang, Adv. Mater., 2018, 30, 1705005 CrossRef PubMed.
- S. Yan, W. Tian, H. Chen, K. Tang, T. Lin, G. Zhong, L. Qiu, X. Pan and W. Wang, Adv. Opt. Mater., 2020, 9, 2001709 CrossRef.
- B. Zhao, Z. Wang and Z. a. Tan, Nat. Photonics, 2020, 14, 130–131 CrossRef CAS.
- A. P. Litvin, X. Zhang, E. V. Ushakova and A. L. Rogach, Adv. Funct. Mater., 2021, 31, 18 CrossRef.
- P. Long, Y. Feng, C. Cao, Y. Li, J. Han, S. Li, C. Peng, Z. Li and W. Feng, Adv. Funct. Mater., 2018, 28, 37 Search PubMed.
- S. Lu, G. Xiao, L. Sui, T. Feng, X. Yong, S. Zhu, B. Li, Z. Liu, B. Zou, M. Jin, J. S. Tse, H. Yan and B. Yang, Angew. Chem., Int. Ed., 2017, 56, 6187–6191 CrossRef CAS PubMed.
- Z. Wang, F. Yuan, X. Li, Y. Li, H. Zhong, L. Fan and S. Yang, Adv. Mater., 2017, 29, 37 Search PubMed.
- Y. Liu, Y. Yang, Z. Peng, Z. Liu, Z. Chen, L. Shang, S. Lu and T. Zhang, Nano Energy, 2019, 65, 104023 CrossRef CAS.
- Z. Xie, F. Wang and C.-y. Liu, Adv. Mater., 2012, 24, 1716–1721 CrossRef CAS PubMed.
- K. Hola, M. Sudolska, S. Kalytchuk, D. Nachtigallova, A. L. Rogach, M. Otyepka and R. Zboril, ACS Nano, 2017, 11, 12402–12410 CrossRef CAS PubMed.
- H. Jia, Z. Wang, T. Yuan, F. Yuan, X. Li, Y. Li, Z. Tan, L. Fan and S. Yang, Adv. Sci., 2019, 6, 1900397 CrossRef PubMed.
- J. Lee, K. Min, Y. Park, K. S. Cho and H. Jeon, Adv. Mater., 2018, 30, 3 Search PubMed.
- D. Li, P. Jing, L. Sun, Y. An, X. Shan, X. Lu, D. Zhou, D. Han, D. Shen, Y. Zhai, S. Qu, R. Zboril and A. L. Rogach, Adv. Mater., 2018, 30, 1705913 CrossRef PubMed.
- S. Lu, L. Sui, J. Liu, S. Zhu, A. Chen, M. Jin and B. Yang, Adv. Mater., 2017, 29, 15 Search PubMed.
- A. Singh, A. Wolff, S. D. Yambem, M. Esmaeili, J. D. Riches, M. Shahbazi, K. Feron, E. Eftekhari, K. K. Ostrikov, Q. Li and P. Sonar, Adv. Mater., 2020, 32, 1906176 CrossRef CAS PubMed.
- Z. Wang, Y. Liu, S. Zhen, X. Li, W. Zhang, X. Sun, B. Xu, X. Wang, Z. Gao and X. Meng, Adv. Sci., 2020, 7, 1902688 CrossRef CAS PubMed.
- M. Y. Ye, Z. H. Zhao, Z. F. Hu, L. Q. Liu, H. M. Ji, Z. R. Shen and T. Y. Ma, Angew. Chem., Int. Ed., 2017, 56, 8407–8411 CrossRef CAS PubMed.
- F. Yuan, Z. Wang, X. Li, Y. Li, Z. Tan, L. Fan and S. Yang, Adv. Mater., 2017, 29, 3 Search PubMed.
- F. Yuan, T. Yuan, L. Sui, Z. Wang, Z. Xi, Y. Li, X. Li, L. Fan, Z. Tan, A. Chen, M. Jin and S. Yang, Nat. Commun., 2018, 9, 2249 CrossRef PubMed.
- X. Zhang, Q. Zeng, Y. Xiong, T. Ji, C. Wang, X. Shen, M. Lu, H. Wang, S. Wen, Y. Zhang, X. Yang, X. Ge, W. Zhang, A. P. Litvin, A. V. Baranov, D. Yao, H. Zhang, B. Yang, A. L. Rogach and W. Zheng, Adv. Funct. Mater., 2020, 30, 11 Search PubMed.
- B. Zhao and Z. Tan, Adv. Sci., 2021, 8, 2001977 CrossRef CAS PubMed.
- Z. Zhou, P. Tian, X. Liu, S. Mei, D. Zhou, D. Li, P. Jing, W. Zhang, R. Guo, S. Qu and A. L. Rogach, Adv. Sci., 2018, 5, 1800369 CrossRef PubMed.
- X. Wang, X. Zhang, X. Gu, H. Nie, M. Zhu, B. Wang, J. Gao, Y. Tao, Y. Zhu, H. Huang, C. Xu, M. Shao, Y. Liu, L. Liao and Z. Kang, Adv. Opt. Mater., 2020, 8, 15 Search PubMed.
- X. Wang, Y. Ma, Q. Wu, Z. Wang, Y. Tao, Y. Zhao, B. Wang, J. Cao, H. Wang, X. Gu, H. Huang, S. Li, X. Wang, F. Hu, M. Shao, L. Liao, T. K. Sham, Y. Liu and Z. Kang, Laser Photonics Rev., 2021, 15, 3 Search PubMed.
- X. Wang, B. Wang, H. Wang, T. Zhang, H. Qi, Z. Wu, Y. Ma, H. Huang, M. Shao, Y. Liu, Y. Li and Z. Kang, Angew. Chem., Int. Ed., 2021, 60, 12585–12590 CrossRef CAS PubMed.
- F. Yuan, Y.-K. Wang, G. Sharma, Y. Dong, X. Zheng, P. Li, A. Johnston, G. Bappi, J. Z. Fan, H. Kung, B. Chen, M. I. Saidaminov, K. Singh, O. Voznyy, O. M. Bakr, Z.-H. Lu and E. H. Sargent, Nat. Photonics, 2019, 14, 171–176 CrossRef.
- T. Feng, S. Tao, D. Yue, Q. Zeng, W. Chen and B. Yang, Small, 2020, 16, 2001295 CrossRef CAS PubMed.
- A. K. Pal, S. Krotkus, M. Fontani, C. F. R. Mackenzie, D. B. Cordes, A. M. Z. Slawin, I. D. W. Samuel and E. Zysman-Colman, Adv. Mater., 2018, 30, 1804231 CrossRef PubMed.
- J. Pan, L. N. Quan, Y. Zhao, W. Peng, B. Murali, S. P. Sarmah, M. Yuan, L. Sinatra, N. M. Alyami, J. Liu, E. Yassitepe, Z. Yang, O. Voznyy, R. Comin, M. N. Hedhili, O. F. Mohammed, Z. H. Lu, D. H. Kim, E. H. Sargent and O. M. Bakr, Adv. Mater., 2016, 28, 8718–8725 CrossRef CAS PubMed.
- S. J. Park, H. K. Yang and B. K. Moon, Nano Energy, 2019, 60, 87–94 CrossRef CAS.
- J. He, Y. He, Y. Chen, B. Lei, J. Zhuang, Y. Xiao, Y. Liang, M. Zheng, H. Zhang and Y. Liu, Small, 2017, 13, 1700075 CrossRef PubMed.
- X. Wang, L. Bai, L. Shen, B. Yao, H. Huang, Y. Liu, Y. Song and Z. Kang, Opt. Mater., 2019, 95, 109216 CrossRef CAS.
- B. Wang, J. Li, Z. Tang, B. Yang and S. Lu, Sci. Bull., 2019, 64, 1285–1292 CrossRef CAS.
- H. Song, X. Liu, B. Wang, Z. Tang and S. Lu, Sci. Bull., 2019, 64, 1788–1794 CrossRef CAS.
- C. M. Das, L. Kang, Q. Ouyang and K. T. Yong, InfoMat, 2020, 2, 698–714 CrossRef CAS.
- J. Xu, Y. Miao, J. Zheng, Y. Yang and X. Liu, Adv. Opt. Mater., 2018, 6, 1800181 CrossRef.
Footnote |
| † Electronic supplementary information (ESI) available. See DOI: 10.1039/d1na00576f |
| This journal is © The Royal Society of Chemistry 2021 |

