 Open Access Article
Size-dependent trends in the hydrogen evolution activity and electronic structure of MoS2 nanotubes†
Charlie
Ruffman
 ,
J. T. A.
Gilmour
 and
Anna L.
Garden
 *
*
MacDiarmid Institute for Advanced Materials and Nanotechnology, Department of Chemistry, University of Otago, P.O. Box 56, Dunedin 9054, New Zealand. E-mail: anna.garden@otago.ac.nz
First published on 30th August 2021
Abstract
The thermodynamics of hydrogen evolution on MoS2 nanotubes is studied for the first time using periodic density functional theory calculations to obtain hydrogen adsorption free energies (ΔGHads) on pristine nanotubes and those with S-vacancy defects. Armchair and zigzag MoS2 nanotubes of different diameters, ranging from 12 to 22 Å, are examined. The H adsorption energy is observed to become more favourable (lower ΔGHads) as nanotube diameter decreases, with ΔGHads values ranging from 1.82 to 1.39 eV on the pristine nanotubes, and from 0.03 to −0.30 eV at the nanotube S-vacancy defect sites. An ideal thermoneutral ΔGHads value of nearly 0 eV is observed at the S-vacancy site on nanotubes around 20 to 22 Å in diameter. For the pristine nanotubes, density of states calculations reveal that electron transfer from S to Mo occurs during H adsorption, and the energy gap between these two states yields a highly reliable linear correlation with ΔGHads, where a smaller gap leads to a more favourable hydrogen adsorption. For the S-vacancy defect site the H adsorption resembles that on a pure metallic surface, meaning that a traditional d-band centre model can be applied to explain the trends in ΔGHads. A linear relation between the position of the Mo d-states and ΔGHads is found, with d-states closer to the Fermi level leading to strong hydrogen adsorption. Overall this work highlights the relevance of MoS2 nanotubes as promising hydrogen evolution catalysts and explains trends in their activity using the energies of the electronic states involved in binding hydrogen.
1 Introduction
Molecular H2 is highly sought after as a carbon-zero energy transport and storage medium,1–3 as well as a critical reactant in many key industrial processes such as the Haber–Bosch reaction to generate nitrogenous fertilizer.4 Currently, the majority of H2 is produced either via steam reformation of natural gas or from reformation of fuel oils.5,6 However, these processes are energy intensive, consume dwindling fossil fuel reserves, and produce harmful by-products such as CO2.4 Instead, it is highly desirable to be able to produce large volumes of H2 through the electrolysis of water, which is a clean process that can be driven by renewable energy sources.7One of the key half-reactions in water electrolysis is the hydrogen evolution reaction (HER), where protons are formally reduced at the cathode (2H+ + 2e− → H2). Pt and Pt-based catalysts are generally accepted to be the most active for hydrogen evolution,8–10 yet these materials can be prohibitively expensive on an industrial scale due to the scarcity of Pt. As a result, there has been much attention directed at developing a catalyst for the HER that is competitive with Pt in terms of activity, yet is composed of only Earth-abundant materials. Nanostructured molybdenum disulfide (MoS2) is one such material, and its promising HER activity has been documented across many studies11–13 since it was first proposed.14
Structurally, bulk MoS2 is composed of layered 2D sheets, where a single layer constitutes a row of Mo atoms sandwiched between two rows of S atoms. Because the sheets are only held together by weak van der Waals forces, individual layers can be isolated or synthesized as stand-alone structures, which are highly catalytically interesting. In this single-layer form, MoS2 has a large flat basal plane which both experimental11 and theoretical evidence14,15 has indicated is inactive to hydrogen evolution. However, MoS2 catalysts also have exposed edges that dominate the reactivity,11,16 despite making up a relatively small proportion of the material.
Unfortunately, the activity of most MoS2 catalysts falls short of the current standard, Pt, by around two orders of magnitude.11,13,17 However, there is also substantial room to improve the performance of MoS2. A very large body of work has been devoted to improving the HER on the edges of MoS2 through heteroatom doping with Co18 or Ni,19 or supporting the thin MoS2 on other materials which modify its activity.16,20,21 Because the HER activity of the MoS2 edges is already high, another promising way in which the overall catalyst could be improved is by activating the basal plane, as this inert portion actually makes up the majority of the catalyst. The present work focuses on this latter approach.
A large contributor to the poor HER activity on the MoS2 basal plane is that the thermodynamics of the reaction are highly unfavourable.14 Because the HER is a two-step process where H must first adsorb to the catalyst then two H atoms combine to form H2, the energy of the intermediate Hads state fully captures the thermodynamics of the overall reaction. Following the Sabatier principle,22 the catalyst should not bind H so strongly that it requires large amounts of energy to desorb and form H2 (ΔGHads ≪ 0), nor so weakly that it is difficult to get H adsorbed in the first place (i.e. ΔGHads ≫ 0). The thermodynamically optimal catalyst has ΔGHads = 0. It is known the pristine basal plane of MoS2 binds H too weakly (ΔGHads > 2.0 eV)21 to facilitate hydrogen evolution. This contrasts to the much more favourable ΔGHads value of −0.30 eV on the MoS2 edge,21 and the even more favourable −0.03 eV on Pt(111) under electrocatalytic conditions.17 In the past, ΔGHads on the basal plane has been brought closer to thermoneutral (0 eV) by addition of conducting graphene derivative supports,21,23 doping with heteroatoms,24,25 creation of S-vacancy defects,26 or laterally straining the MoS2 sheet.27 Often, these techniques can be used in conjunction with each other to produce promising results, though they can be synthetically complex and require precision. Additionally, multiple high-resolution transmission electron microscopy studies have suggested that S vacancy defects are common in the basal plane of MoS2,28 with site densities of up to 1013 per cm2.29 DFT studies also confirm the likelihood of S-vacancies in the basal plane,26,30,31 finding that they affect both the electronic properties of the basal plane and significantly lower the H adsorption energy.31
Another way to activate the basal plane is to use a structural form of MoS2 that has a lower ΔGHads and higher intrinsic activity. Perhaps the most well known of these is 1T-MoS2, where an artificially induced phase-transition causes a shift to metallic behaviour on the basal plane.32,33 However, recently, several experimental studies have reported high HER activity from nanotube structures formed out of single-layer 2H-MoS2,34–36 where the layer of MoS2 is coiled up analogous to how carbon nanotubes are formed by rolling graphene. The nanotube form of MoS2 is relatively easy to synthesise, either with a single wall, multiple walls, or with a core material.37,38 The enhanced catalytic activity of the nanotubes compared to flat structures suggests that the strain placed on the basal plane by rolling it into a tube may somehow activate it to adsorbing H. This is reasonable to expect, as Shi et al.39 have previously shown that mechanical bending of flat forms of MoS2 can strengthen the H adsorption energy. Furthermore, the electronic structure in MoS2 nanotubes is known to change compared to flat structures, showing smaller band gaps40,41 and enhanced charge carrier mobility,42 both of which are features that are associated with high catalytic activity. Very recently, Cardoso et al.43 were able to show that electronic structure changes in nanotubes of different diachalcogenides, WS2 and WSe2, were responsible for improved H adsorption energies, and thus better HER performance. Therefore, it is of great interest to understand how the electronic structure in MoS2 nanotubes differs from that of the flat basal plane, and whether this can be related to the HER performance.
In addition to being different from the flat basal plane, it has long been established that the surface and electronic properties of MoS2 nanotubes are highly size dependent. Seifert et al.44 show that the strain energy of small MoS2 nanotubes (between 8 and 26 Å in diameter) increases notably as tubes get smaller. At the same time, the smaller nanotubes begin to behave more like conducting materials instead of semiconductors. More recently, Ansari et al.45 reported a near-linear decrease in the band gap of MoS2 nanotubes as the diameter decreased. If this relation is extrapolated, the band gap would approach 0 eV (i.e. conducting) at around 10 Å in diameter. In studying charge carrier mobility, Xiao et al.42 report notable deferences between the electron and hole mobility for two different ways of coiling MoS2 nanotubes: armchair and zigzag. The authors also see that the carrier mobility changes notably with the size of the nanotube. Given that altered electronic conductivity and a reduction of the band gap could be critical to HER catalysis,21 in the present work we study how the H adsorption free energy shifts between different sized nanotubes, for both armchair and zigzag structures. It can also be determined whether any observed effects on ΔGHads can be underpinned by the electronic structure changes.
Density functional theory calculations of ΔGHads on MoS2 nanotubes are used to explore the activation of the basal plane by reducing the thermodynamic cost to adsorbing or desorbing H. Armchair and zigzag nanotubes of diameters varying from 12 to 22 Å are studied, and both pristine and S-vacancy defect sites are considered. We find a reliable tendency for H adsorption to become more favourable as nanotube diameter decreases, regardless of adsorption site. Density of states calculations are used to rationalise this trend in terms of the energetic position of the S p-states and Mo d-states involved in binding H.
2 Methodology
2.1 Structure models
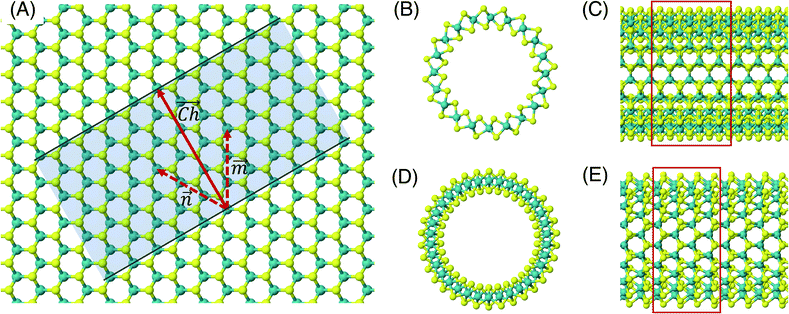
The flat basal plane of MoS2 was simulated using a single-layer slab, periodic in two dimensions, with an explicit unit cell measuring 5 × 5 Mo atoms. It was calculated to have a lattice constant of 3.18 Å, representing spacing between Mo atoms. At least 12 Å of vacuum separation was ensured between repeats in the non-periodic direction, perpendicular to the basal plane.To form MoS2 nanotubes, an extended sheet of flat single-layer MoS2 was coiled about a chiral vector,  , as seen in Fig. 1A. In this case, the shaded region makes up the atoms in the nanotube, and the two grey ends will meet when coiled.
  runs along the circumference of the coiled nanotube. The length and direction of
  comes from the sum of two vectors,
 ![[n with combining right harpoon above (vector)]](https://www.rsc.org/images/entities/i_char_006e_20d1.gif) and
and ![[m with combining right harpoon above (vector)]](https://www.rsc.org/images/entities/i_char_006d_20d1.gif) which are at 60° to each other. Coiled nanotubes are described by the length of their
which are at 60° to each other. Coiled nanotubes are described by the length of their ![[n with combining right harpoon above (vector)]](https://www.rsc.org/images/entities/i_char_006e_20d1.gif) and
and ![[m with combining right harpoon above (vector)]](https://www.rsc.org/images/entities/i_char_006d_20d1.gif) vectors in terms of the number of primitive cell repeats (
vectors in terms of the number of primitive cell repeats (![[n with combining right harpoon above (vector)]](https://www.rsc.org/images/entities/i_char_006e_20d1.gif) ,
, ![[m with combining right harpoon above (vector)]](https://www.rsc.org/images/entities/i_char_006d_20d1.gif) ). The example in Fig. 1A is a (3, 3) tube, which is smaller than is realistic and is included for illustration purposes only. Armchair nanotubes are defined by
). The example in Fig. 1A is a (3, 3) tube, which is smaller than is realistic and is included for illustration purposes only. Armchair nanotubes are defined by ![[n with combining right harpoon above (vector)]](https://www.rsc.org/images/entities/i_char_006e_20d1.gif) and
and ![[m with combining right harpoon above (vector)]](https://www.rsc.org/images/entities/i_char_006d_20d1.gif) having the same length, whereas for zigzag nanotubes the
having the same length, whereas for zigzag nanotubes the ![[m with combining right harpoon above (vector)]](https://www.rsc.org/images/entities/i_char_006d_20d1.gif) vector is always zero and
vector is always zero and ![[n with combining right harpoon above (vector)]](https://www.rsc.org/images/entities/i_char_006e_20d1.gif) can have any value. Examples of realistic coiled armchair and zigzag nanotubes are also given in Fig. 1.
can have any value. Examples of realistic coiled armchair and zigzag nanotubes are also given in Fig. 1.
In a computational representation of the nanotubes, there is one periodic direction along the length of the tube and two non-periodic directions. The explicitly simulated repeating cell in the periodic direction was 4 units long, as shown in Fig. 1C and E. At least 12 Å of vacuum spacing was ensured in the non-periodic directions either side of the nanotube.
2.2 Computational details
The structures were relaxed and electronic energies calculated using periodic density functional theory (DFT), as implemented in the Vienna ab initio simulation package (VASP).46 The form of the electron density, and thus the energy, was obtained via iterative diagonalization of the Kohn–Sham Hamiltonian. A Bayesian error estimation exchange–correlation functional with the inclusion of van der Waals forces (BEEF-vdW),47 was chosen, which represents the generalised gradient approximation level of theory. This functional is optimised for studying surface catalytic processes, making it an ideal fit here. A periodic plane-wave basis set with a kinetic energy cut-off of 500 eV was used to describe the valence electrons, whereas core electrons were described using the projector augmented wave method.48,49 To aid convergence, the energetic states of valence electrons were smeared according to a Fermi–Dirac distribution where kBT = 0.1 eV. For density of states calculations, the smearing width was reduced to 0.01 eV in order to provide finer resolution of the states. All reported energies were extrapolated to kBT = 0. When relaxing geometries, the coordinates of nuclear centres were updated in the direction of the forces acting on them until the total force on each centre was less than 0.03 eV Å−1. For the flat basal plane, reciprocal space was sampled using 4 × 4 × 1 Monkhorst–Pack k-point scheme. For nanotubes, where only one dimension is periodic, a 4 × 1 × 1 scheme was used instead.The strain on nanotube models due to their curvature, ΔEstrain, was calculated per Mo atom relative to a flat surface of the same size, following established methodology:50
 | (1) |
The formation energies (ΔEf) of each of the different nanotube structures were computed relative to bulk Mo and S in H2S:
 | (2) |
The formation energies of S-vacancy defects (ΔEf,vac) were also computed as:
| ΔEf,vac = Etube+vac + ES,ref − Etube | (3) |
Electronic H adsorption energies (ΔEHads) were calculated viaeqn (4):
 | (4) |
 is half the energy of H2 in a vacuum. Electronic adsorption energies were converted to Gibbs free energies as shown in eqn (5):
| ΔGHads = ΔEHads + Δ(ZPE) − TΔS | (5) |
3 Results and discussion
3.1 Pristine MoS2 nanotubes
The optimised values for the lattice constant (in the periodic direction along the axis of the nanotube) and the diameter of the different armchair and zigzag nanotubes tested here are presented in Table 1. For the all the different sized armchair nanotubes, the lattice constant of the 1D tube in the periodic direction is very slightly longer than that for the flat basal plane of MoS2 (3.18 Å). In contrast, for the zigzag nanotubes, this lattice constant is shorter than the basal plane. These patterns are highly consistent with past results.41 When moving to larger sizes, the lattice constant for both types of nanotube appears to trend in the direction of the bulk value.System (![[n with combining right harpoon above (vector)]](https://www.rsc.org/images/entities/i_char_006e_20d1.gif) , , ![[m with combining right harpoon above (vector)]](https://www.rsc.org/images/entities/i_char_006d_20d1.gif) ) ) |
Lattice constant/Å | Diameter/Å | ΔEf/eV | ΔEstrain per Mo/eV | ΔGHads S/eV | ΔGHads Mo/eV |
|---|---|---|---|---|---|---|
| Basal plane | ||||||
| 3.18 | — | −2.22 | — | 2.24 | 2.79 | |
![[thin space (1/6-em)]](https://www.rsc.org/images/entities/char_2009.gif) |
||||||
| Armchair | ||||||
| (8, 8) | 3.21 | 11.91 | −1.49 | 0.73 | 1.39 | 1.55 |
| (9, 9) | 3.21 | 13.56 | −1.63 | 0.59 | 1.51 | 1.70 |
| (10, 10) | 3.21 | 15.16 | −1.73 | 0.49 | 1.60 | 1.83 |
| (11, 11) | 3.20 | 16.75 | −1.81 | 0.41 | 1.67 | 1.91 |
| (12, 12) | 3.20 | 18.60 | −1.87 | 0.34 | 1.74 | 2.01 |
| (13, 13) | 3.20 | 20.36 | −1.92 | 0.30 | 1.79 | 2.11 |
| (14, 14) | 3.20 | 22.08 | −1.96 | 0.26 | 1.82 | 2.13 |
![[thin space (1/6-em)]](https://www.rsc.org/images/entities/char_2009.gif) |
||||||
| Zigzag | ||||||
| (14, 0) | 3.14 | 12.26 | −1.52 | 0.69 | 1.44 | 1.52 |
| (15, 0) | 3.14 | 13.16 | −1.60 | 0.61 | 1.52 | 1.67 |
| (17, 0) | 3.16 | 15.00 | −1.73 | 0.49 | 1.60 | 1.80 |
| (19, 0) | 3.16 | 16.96 | −1.82 | 0.40 | 1.70 | 1.88 |
| (20, 0) | 3.17 | 17.91 | −1.86 | 0.36 | 1.72 | 1.90 |
| (22, 0) | 3.17 | 19.97 | −1.91 | 0.30 | 1.79 | 2.06 |
| (24, 0) | 3.17 | 21.88 | −1.96 | 0.26 | 1.82 | 2.06 |
In terms of the nanotube internal diameters, a reasonable range is able to be simulated for both armchair and zigzag nanotubes, spanning in total from 11.91 Å to 21.88 Å. While most of the sizes reported here are smaller than those that are typically observed in experiment,38 the largest of the MoS2 nanotubes crosses over with the size of some of the smaller cases observed experimentally.53 The diameter range we report is similar to that of other DFT works.42,44
The strain energy due to curvature (calculated viaeqn (1)) is also presented in Table 1. There is a consistent trend for strain to increase as the nanotube diameter, d, gets smaller. Plots in the ESI (Fig. S1†) show that the strain appears to follow a  relation with nanotube diameter, which was originally reported by Seifert et al.44 Some of the smallest nanotubes studied here can be considered highly strained, with an energy difference of 0.73 eV per Mo atom compared to the flat surface. The strain effects are also clearly reflected in the formation energies of the nanotubes. While all of the materials studied here are stable relative to their constituent atoms, the flat basal plane has the most favourable formation energy, and the formation energy becomes less negative as the nanotubes get smaller. There is no notable difference between ΔEf for armchair and zigzag nanotubes.
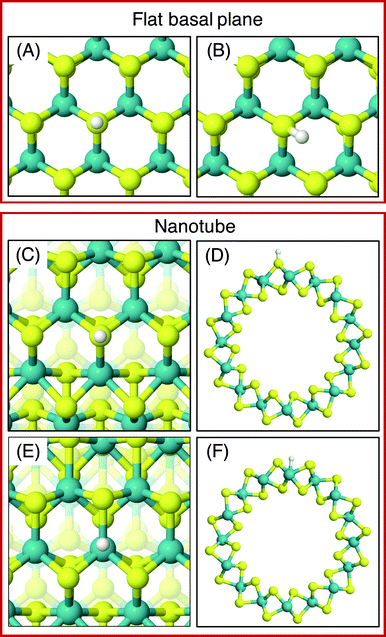
On the MoS2 basal plane, three stable H adsorption sites are located: directly on top of an S atom (Fig. 2A, ΔGHads = 2.24 eV), in a tilted configuration on an S atom at approximately 40° from the upright (Fig. 2B, ΔGHads = 2.04 eV), and directly on an Mo atom (ΔGHads = 2.79 eV). Each of these H adsorption sites was tested on the MoS2 nanotubes. However, the tilted H configuration could not be located on nanotubes of any size tested here, despite it being preferable on the flat MoS2 basal plane.54 Locating the titled geometry has been difficult in past works on flat MoS2 also, where supports beneath the catalyst prevented it being found.21 It is suggested that this tilted configuration is highly sensitive to perturbations of the MoS2 structure, and thus we proceed only with the stably located S on-top and Mo sites for the nanotubes. The H adsorption energy at the S site on the flat basal plane is 0.1–0.2 eV higher than some previous estimates,15 which is likely accounted for by the finer k-point mesh and larger model size employed here.
Unlike the basal plane which has symmetric faces, the sites inside and outside of the MoS2 nanotubes are inequivalent. To compare inside and outside H adsorption, three sizes for each of armchair and zigzag nanotubes were chosen as a representation of different diameters: (8, 8), (11, 11) and (14, 14) for armchair, and (14, 0), (19, 0) and (24, 0) for zigzag. The raw electronic adsorption energies for the inside and outside sites on these structures are available in the ESI (Table S1†). The overall trends indicated a strong and reliable preference for H adsorption on the outside of the nanotube as opposed to the inside, by on average 0.30 eV for S sites and 0.85 eV on Mo sites. The geometries of these favourable outside binding sites are pictured for an armchair nanotube in Fig. 2 at the S site (C and D) and the Mo site (E and F).
One possible reason for the preference to adsorb on the outside of the nanotube is a small but reliable charge disparity between the S atoms on the outside of the tube and those on the inside. Bader charge analyses of these centres in (8, 8) armchair MoS2 indicated the average net charge on the outside S atoms was −0.68e−, and for the inside S atoms was −0.57e−. This is in contrast to the flat basal plane, where the average Bader charge on the S atoms lies somewhere between these two values, at 0.61e−. A similar pattern was observed for larger nanotubes and also the zigzag nanotubes (see Fig. S2 to S7 in the ESI†). Considering the fairly large number of atoms this charge differential is distributed over, this indicates a reliable preference for electron density to be on the outside of the nanotube.
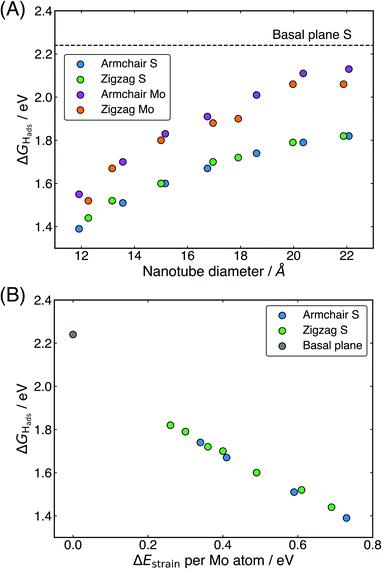
The ΔGHads values for the S and Mo sites on the outside of all nanotubes studied here are presented in Table 1, and these values are plotted against the nanotube diameter in Fig. 3A. There is a clear preference for adsorption at the S site over the Mo at the largest nanotube sizes by 0.31 eV on the armchair nanotubes and 0.24 eV on the zigzag nanotubes, but this difference in energy drops to only 0.16 eV and 0.08 eV, respectively, at the smallest sizes (clearly observed in Fig. 3A). For all nanotubes, this difference is significantly smaller than the 0.55 eV on the flat basal plane, suggesting that the S and Mo sites are far more competitive on nanotubes, especially those with small diameters. This may have mechanistic ramifications, as H diffusion to an Mo atom has previously been implicated as an important step in the HER on MoS2 edge structures,55,56 though this has not yet been explored on the basal plane of 2H-MoS2.57
Examining how ΔGHads changes with the diameter of different nanotubes, there is a clear trend for H adsorption to become more favourable as the nanotubes get smaller (Fig. 3A). Interestingly, no notable difference in ΔGHads between armchair and zigzag nanotube structures is observed, other than that induced by their slightly different diameters. This suggests that the local electronic and geometric structure around the H adsorption site is the same for both classes of nanotube. The most favourable adsorption energy found here is 1.39 eV, reported at an S atom site on the (8, 8) armchair nanotube with a diameter of slightly less than 12 Å. This is significantly lower than the 2.24 eV adsorption energy on the flat basal plane of MoS2, suggesting the nanotubes likely have enhanced HER activity, yet still is significantly higher than thermodynamically ideal. This finding can be partly explained by smaller nanotubes having higher strain energies. In Fig. 3B, it can be seen that the ΔGHads relates very closely to ΔEstrain. This linear relation may be highly useful for predicting ΔGHads values on different sized nanotubes, or even curved MoS2 surfaces. However, while it makes sense intuitively that higher strained materials may bind H stronger, it remains unclear what electronic and bonding factors underpin this behaviour. This point will be revisited and addressed in Section 3.3 later.
One interesting question is to what extent the present relation between ΔGHads and nanotube diameter or strain can be extrapolated. For instance, it is possible that ΔGHads values closer to 0 eV could be reached going to nanotubes smaller than 12 Å in diameter, corresponding to higher strain energies. When this idea was tested here, it was found these nanotubes were highly unstable, and tended to distort and break apart when H was adsorbed to the system. The breaking apart of the nanotubes is not overly surprising, given these particularly small systems would be under relatively high strain. This suggests that 12 Å diameter may pose a lower limit on the size of MoS2 nanotubes for surface catalysis applications at least. Looking at the larger sizes of nanotubes, it is possible that the relation could be extrapolated to a nanotube of infinite diameter, which should in theory match the ΔGHads of the basal plane. However, without additional testing of H adsorption on nanotubes larger than the maximum size reported here, making this extrapolation is difficult as it is unclear whether the relation between diameter and ΔGHads is linear in nature or curvilinear, in which case it may asymptote. Unfortunately larger sizes were outside the scope of the DFT calculations able to be performed here. Though, it is possible future work could be done using a limited selection of larger nanotubes or models that had fewer repeats in the periodic direction of the tube.
3.2 S-vacancy defects in MoS2 nanotubes
Given that even the smallest MoS2 nanotubes obtainable here still produced ΔGHads values that were much higher than the desired thermoneutral 0 eV, this alone was unlikely to be able to explain the experimentally observed enhanced catalytic activity of the nanotubes relative to the basal plane.35,58,59 Therefore, nanotubes with S-vacancy defects were also investigated. Previous reports on defects in MoS2 nanotubes report S-vacancies modifying the mechanical60 and electronic or magnetic properties,61 but the H adsorption energy has yet to be explored. Here, single S-vacancies are studied, where one S atom is removed from the outside of the nanotube. This was done for each of the sizes of pristine nanotube tested in the previous section. No notable structural distortion was observed on relaxation after a defect had been created. The vacancy formation energies (Table 2) indicate that it is about 0.3 eV more favourable for an S-vacancy to form on the flat basal plane than on the nanotube structures, which is likely a result of the added strain in the nanotube. However, there is very little variance observed between different nanotube sizes, and the vacancy formation energies are not prohibitively large.System (![[n with combining right harpoon above (vector)]](https://www.rsc.org/images/entities/i_char_006e_20d1.gif) , , ![[m with combining right harpoon above (vector)]](https://www.rsc.org/images/entities/i_char_006d_20d1.gif) ) ) |
ΔEf,vac/eV | ΔGHads S-vacancy/eV |
|---|---|---|
| Basal plane | ||
| 2.49 | 0.15 | |
![[thin space (1/6-em)]](https://www.rsc.org/images/entities/char_2009.gif) |
||
| Armchair | ||
| (8, 8) | 2.74 | −0.30 |
| (9, 9) | 2.80 | −0.22 |
| (10, 10) | 2.82 | −0.16 |
| (11, 11) | 2.81 | −0.13 |
| (12, 12) | 2.82 | −0.08 |
| (13, 13) | 2.81 | −0.05 |
| (14, 14) | 2.81 | −0.05 |
![[thin space (1/6-em)]](https://www.rsc.org/images/entities/char_2009.gif) |
||
| Zigzag | ||
| (14, 0) | 2.79 | −0.12 |
| (15, 0) | 2.80 | −0.10 |
| (17, 0) | 2.82 | −0.05 |
| (19, 0) | 2.82 | −0.02 |
| (20, 0) | 2.84 | −0.01 |
| (22, 0) | 2.82 | 0.01 |
| (24, 0) | 2.77 | 0.03 |
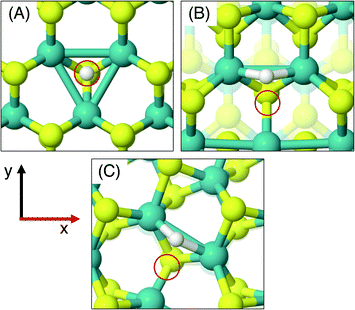
As was done for the pristine nanotubes, different H adsorption sites were investigated. On the flat basal plane with an S-vacancy, the most favourable adsorption site was found to be at the centre of the three Mo atoms directly below where the S has been removed (Fig. 4A), which is consistent with past work.31 This position is at least 0.5 eV more favourable than when H is situated on the S atoms surrounding the defect, and if H was positioned directly on top of one of the Mo atoms at the S-vacancy, it always relaxed such that it was centred between all three Mo. Interestingly, this was not the most favourable site on the defective MoS2 nanotubes – here H instead preferred to adsorb at a bridged position between only two of the Mo atoms underneath the S-vacancy for both armchair and zigzag nanotubes (Fig. 4B and C).
The different adsorption site preference for nanotubes is likely the result of inequivalent Mo atoms in the triangle below the S-vacancy defect. Because of the strain induced by coiling into a tube, two sides of the triangle of Mo atoms have longer bond lengths than the other. In the (8, 8) armchair nanotube the long Mo–Mo bonds are 3.47 Å and the short bond is 3.15 Å. For the (14, 0) zigzag nanotube, there is one long bond of 3.53 Å and two short bonds of 3.23 Å. H adsorbing in the bridged position at any of the short Mo–Mo bonds is the preferred site. Indeed, a stable adsorption geometry in the long bond position could not be located, and instead H would always diffuse to the short Mo–Mo bond site during relaxation.
The ΔGHads values for adsorption at the S-vacancy sites across all the nanotubes tested here are reported in Table 2. A substantial drop in ΔGHads compared to the pristine surfaces (Table 1) is observed both on the flat basal plane, and across all nanotubes. First looking at the flat basal plane, the ΔGHads of 0.15 eV is much closer to thermoneutral than for the pristine surface, a finding which is in close agreement with past work26 and indicates that the S-vacancy site is far more likely to be active for hydrogen evolution. For the nanotube structures, where the curvature was already seen to decrease ΔGHads relative to the flat basal plane for pristine systems, ΔGHads values at the S-vacancy site are also lowered and are actually negative for many of the sizes tested here. The negative values indicate that some nanotube S-vacancies actually bind H too strongly to be thermodynamically ideal, in stark contrast to the very weak H binding on the pristine flat basal plane of MoS2.
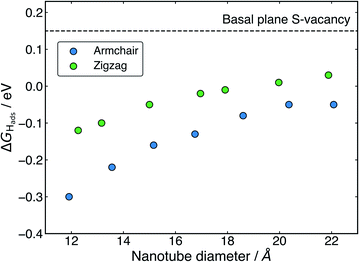
Examining the effect of nanotube diameter on ΔGHads for the S-vacancy sites (Fig. 5), it is clear that there is still a degree of tuning with size. However, compared to the pristine nanotubes, where the ΔGHads on S spanned a total 0.43 eV across diameters from approximately 12 to 22 Å, here the ΔGHads only varies by 0.25 eV for armchair and 0.15 eV for zigzag nanotubes across the same range. Interestingly, the range of ΔGHads values that are produced with different diameters spans the thermodynamically ideal region around 0 eV. These data suggest that nanotubes around the size of 17–22 Å in diameter would have S-vacancies with near ideal ΔGHads values for hydrogen evolution. Given that it is well known that specific active sites can dominate the activity of a catalyst even if they are not overly abundant,62,63 these S-vacancy sites could easily explain the high HER activity observed on experimentally synthesised MoS2 nanotubes. An interesting topic for further study would be to explore ΔGHads values as the nanotubes get larger than 22 Å in diameter. The trend observed here suggests ΔGHads could remain close to 0 eV at these larger diameters.
From Fig. 5 it is also clear that H adsorbing to armchair nanotube S-vacancies is consistently more favourable than the same site on zigzag nanotubes. This contrasts to the pristine structures, where armchair and zigzag tubes produced very similar ΔGHads values. This difference is likely a result of different Mo–Mo bond lengths at the bridged H adsorption site on the S-vacancy. As mentioned earlier, the Mo–Mo bonds are slightly shorter for the armchair nanotube (3.15 Å) than the zigzag (3.23 Å). This fits with the idea that it is more favourable for H to bind at short Mo–Mo bonds. As a result, while zigzag nanotubes span the ideal thermoneutral range between 17 and 22 Å in diameter, the armchair nanotubes still bind H slightly too strongly in this same diameter range. Indeed, it seems that slightly larger armchair nanotubes may be ideal, where these larger tubes are perhaps easier to obtain experimentally.38
3.3 Explaining the trends in H adsorption
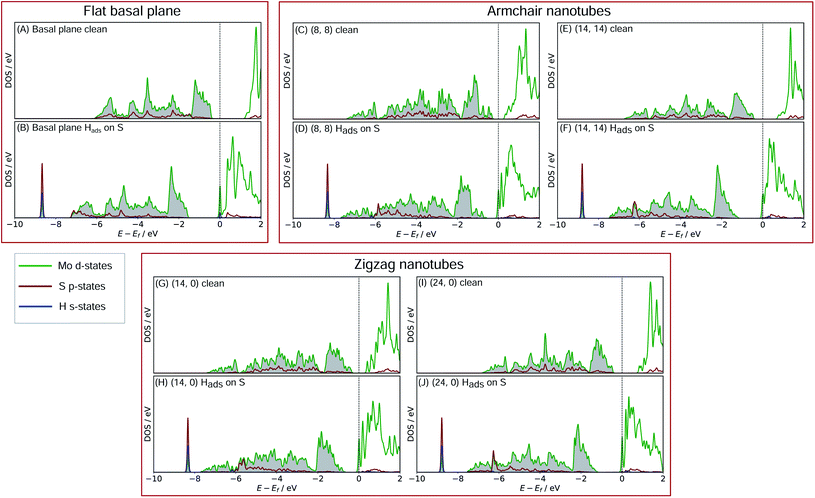
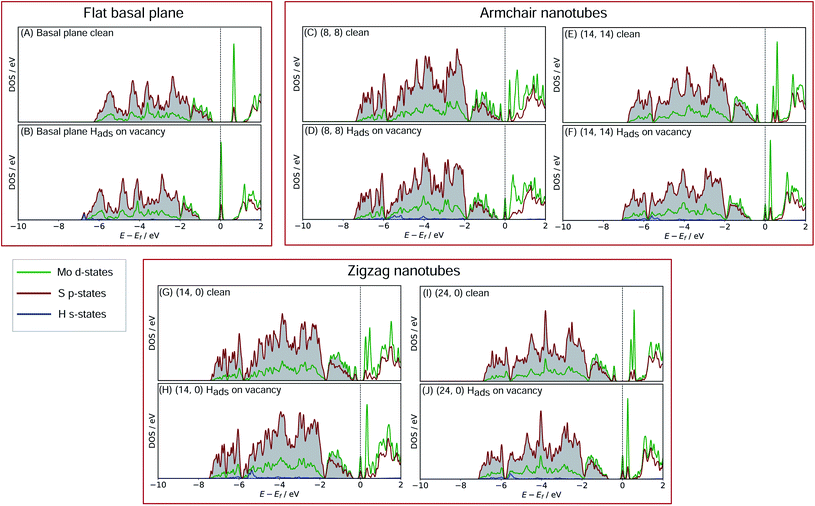
In order to better understand what factors might be underpinning the changes in ΔGHads observed with different nanotube diameters, investigations into the electronic structure were performed. In this section we consider only the most favourable H binding sites, which for the pristine nanotubes is on an S atom, and for the defective nanotubes is at a bridged position between Mo. Density of states (DOS) calculations were performed for all the clean and H adsorbed nanotubes studied here, including the S-vacancy defect systems and the basal plane. Furthermore, the charge movement arising from H adsorption was explored using Bader charge analyses. The results from these calculations are discussed in the following sections, separately for the pristine MoS2 systems and the S-vacancy systems.For the flat basal plane of MoS2 (Fig. 6A and B), when H adsorbs directly on-top of an S atom a sharp low-energy state with H s and S p character arises, indicating a S–H covalent bond has formed. Additionally, in the Hads system, a new feature arises at the Fermi level primarily composed of partially filled Mo d-states, suggesting the Mo d orbitals are also involved in bonding. This is highly consistent with Liu et al.'s recent model for H binding on MoS2 surfaces,54 where it is argued that S in the flat MoS2 basal plane has a full valence and must displace an electron to a neighbouring atom to form a bond with H. Here we suggest some of the S atom's electron density becomes shared across neighbouring Mo atoms. This idea is also supported by the Bader charge analyses of the clean and Hads systems, which show that S loses about 0.2 electron-equivalents of charge and the surrounding Mo atoms together gain around 0.1e−.
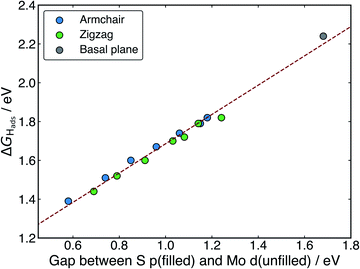
When H adsorbs to the MoS2 nanotubes, a very similar pattern of S–H bond formation and electron displacement to Mo is observed. Additionally, the same pattern of charge movement from S to Mo is also observed, and this remains at the same magnitude as the basal plane for all armchair nanotubes tested here (Table S2 in the ESI†). This indicates that the mode of H binding is likely the same as on the flat basal plane. However there are notable differences in the DOS between nanotubes of different sizes. Specifically, in the clean nanotube DOS, it appears that the gap between the edge of the filled S p-states and the unfilled Mo d-states reduces in smaller nanotubes. It has previously been found that the overall band gap of MoS2 nanotubes reduces with their diameter,42,45 but here the S p- and Mo-d states are studied specifically, because H binding involves an electron transfer between these two states. We propose that the lowering of ΔGHads values on smaller nanotubes is a direct result of the reduction of this energy gap. Indeed, a very reliable linear correlation can be drawn between ΔGHads and the energy gap between filled S p- and unfilled Mo d-states (Fig. 7). Extrapolating the linear trend suggests that, as the energy gap approaches zero, the ΔGHads value will fall to ∼0.8 eV, at which point the energy cost to adsorbing H may predominantly relate to the relaxation and movement of the nuclei.30 The flat basal plane of MoS2 is also included in Fig. 7, and lies closely on the trend described by nanotubes of different diameter. This is further evidence that the mode of H binding is the same.
Interestingly, a linear relation was not observed when ΔGHads was plotted against the energy of the S p-state edge on its own (see ESI Fig. S8†), suggesting it is specifically the electron transfer from S to Mo that is responsible for part of the energy cost to adsorbing H. This demonstrates that, while the p-state energy may play a role in determining ΔGHads, it is only considering the difference in energy between the S p- and Mo d-states (i.e. those directly involved in electron rearrangement on H adsorption) that yields a direct correlation to ΔGHads.
Another interesting feature in the DOS arises when H adsorbs to the flat basal plane or the nanotube S-vacancy sites – a sharp partially occupied state with S p and Mo d character appears at the Fermi level. In the case of H adsorbing to transition metal surfaces (e.g. Pt(111) in Fig. S9 the ESI†) this state is not visible, perhaps due to the conducting nature of the surface which has states already spanning the Fermi level. It is possible this state is evidence of electron transfer from Mo to H as a bond forms. Indeed, Bader charge analyses of the flat and nanotube surfaces indicate that H gains negative charge density on adsorbing (0.4e− equivalents), and the Mo atoms it binds to also lose about 0.3e− equivalents together.
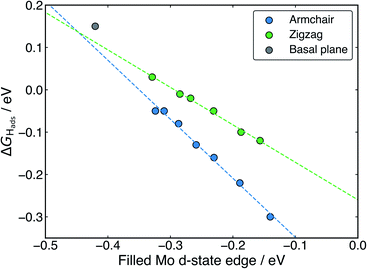
With H binding to Mo atoms at the S-vacancy defect on the flat basal plane,30 it has been previously found that the adsorption can be understood using d-band theory,65 which is typically applied to understand adsorption to pure metal surfaces. This model suggests that the binding strength of H will be proportional to the energy gap between the H s-states (set to 0 eV) and the Mo d-states, with a smaller gap meaning stronger binding. Application of this model to the S-vacancy is rational when considering the DOS analyses indicate that the H adsorption character is very similar to that on flat transition metals, as discussed above. Ouyang et al.30 have previously found that there is no relation between ΔGHads and the centre of the Mo d-band in flat MoS2, as it is only the states close to the Fermi level that are involved in adsorbing H. It makes more sense to only consider these high energy d-states because, in contrast to the pure transition metals, the d-orbitals in the S-vacancy site are inequivalent. In the present work we affirm this for MoS2 nanotubes. If ΔGHads is plotted against the d-band centre for both armchair and zigzag nanotubes, no clear relation is seen (Fig. S10 in the ESI†). Instead, when plotting the edge of the Mo d-band against ΔGHads (Fig. 9), an interesting pattern is observed. A linear relation exists, yet this relation appears to have a different slope for the armchair and zigzag nanotubes.
Returning to the d-band model,65 the slope of the relation between ΔGHadsand the d-state edge would be determined by the amount of overlap between the H atom states and the Mo states (i.e. the coupling matrix). For armchair nanotubes, H binds between two Mo atoms that are closer together than on the zigzag nanotube (as outlined in a previous section). This would suggest a larger coupling matrix for H adsorbing on the armchair nanotube, which is likely what gives rise to the steeper slope for the armchair nanotubes in Fig. 9. The flat basal plane lies somewhat offset from the line described by either form of nanotube, indicating the coupling matrix may be once again different in this case.
Overall, the existence of this trend suggests that the d-band model can be accurately applied to H adsorption at MoS2 S-vacancy sites, provided one uses only the Mo d-states that are involved in bonding (i.e. the highest energy states, represented by the edge of the d-band). The change in the d-band edge that generates this effect on ΔGHads is also shown plotted as a function of nanotube diameter in Fig. S11 in the ESI.† Indeed, the relation in Fig. 9 suggests that ideal HER thermodynamics (ΔGHads = 0) arise for MoS2 materials with d-band edges between −0.4 and −0.3 eV below the Fermi level. However, this depends on the specific structure of the Mo atoms in S-vacancy defect, which determines the coupling matrix. Going forwards, it may also be interesting to examine charge polarisation on the Mo centres in defect sites. This metric has previously been used to explain N adsorption trends on transition metal single-atom catalysts supported by boron carbide nanotubes.66
4 Conclusions
This work represents the first computational study of hydrogen evolution on MoS2 nanotubes. Density functional theory is used to systematically examine the H adsorption energies for pristine armchair and zigzag nanotubes, as well as nanotubes with an S-vacancy, across a range of different diameters. For the pristine nanotubes, there is a strong preference for H to adsorb on the outside as opposed to the inside of the nanotube, with the favourable adsorption site being directly on-top of an S atom. We also observe a relationship between the nanotube diameter and the H adsorption free energy (ΔGHads), such that smaller and more strained tubes adsorb H stronger. ΔGHads ranges between 1.82 and 1.39 eV as the nanotube diameter decreases from 22 to 12 Å. From density of states calculations across the different sized nanotubes, a very reliable linear relation is found between ΔGHads and the energy gap between the filled S p-states and the unfilled Mo d-states. These two states are implicated in electron transfer when H adsorbs, and thus we propose this energy gap – which is seen to close as the nanotubes get smaller – is determining the H adsorption energy.For the S-vacancy sites on the MoS2 nanotubes, H adsorbs significantly stronger than on the pristine nanotubes with ΔGHads in the range of 0.03 to −0.30 eV, depending on the nanotube diameter. For zigzag nanotubes at around 20 Å in diameter, the ΔGHads values are exactly at the 0 eV mark, which is thermodynamically ideal for hydrogen evolution. Given S-vacancy defects are common in MoS2 nanotubes,28,29 this suggests tubes of approximately this diameter would be highly promising hydrogen evolution catalysts. From density of states calculations, it is seen that the binding of H at the defect resembles adsorption to metallic surfaces, and is dissimilar to the distinct S–H covalent bond observed for the pristine nanotubes. Additionally, the variation in ΔGHads appears to be governed by different factors. The trend in ΔGHads when H binds to Mo atoms at the defect site is rationalised using the classic d-band model for adsorption on metals.65 A strong linear relation is observed between the position of the d-states in Mo and ΔGHads, which differs for armchair and zigzag nanotubes due to different coupling matrices in the Mo–H bond.
Overall, these findings suggest that MoS2 nanotubes are highly promising for hydrogen evolution, and that their activity may be readily modified by controlling the size distribution of the tubes. Additionally, the electronic explanations of the factors affecting H adsorption that we report here can be used to assist in the rational improvement of current MoS2 catalysts, or aid in the design of novel hydrogen evolution catalysts.
Conflicts of interest
There are no conflicts to declare.Acknowledgements
The authors acknowledge financial support from the MacDiarmid Institute for Advanced Materials and Nanotechnology and the University of Otago. Special thanks also go to the New Zealand eScience Infrastructure (NeSI), funded through the New Zealand Ministry of Business, Innovation and Employment. NeSI's high performance computing facilities allowed this work to be performed.Notes and references
- J. O. Bockris and E. C. Potter, J. Electrochem. Soc., 1952, 99, 169 CrossRef CAS.
- G. Glenk and S. Reichelstein, Nat. Energy, 2019, 4, 216–222 CrossRef CAS.
- A. M. Abdalla, S. Hossain, O. B. Nisfindy, A. T. Azad, M. Dawood and A. K. Azad, Energy Convers. Manag., 2018, 165, 602–627 CrossRef CAS.
- J. Brightling, Johnson Matthey Technol. Rev., 2018, 62, 32–47 CrossRef CAS.
- I. Dincer and C. Acar, Int. J. Hydrogen Energy, 2014, 40, 11094–11111 CrossRef.
- N. Z. Muradov and T. N. Veziroǧlu, Int. J. Hydrogen Energy, 2005, 30, 225–237 CrossRef CAS.
- M. S. Dresselhaus and I. L. Thomas, Nature, 2001, 414, 332–337 CrossRef CAS PubMed.
- E. Skúlason, G. S. Karlberg, J. Rossmeisl, T. Bligaard, J. Greeley, H. Jónsson and J. K. Nørskov, Phys. Chem. Chem. Phys., 2007, 9, 3241–3250 RSC.
- E. Skúlason, V. Tripkovic, M. E. Bjorketun, S. Gudmundsdottir, G. Karlberg, J. Rossmeisl, T. Bligaard, H. Jónsson and J. K. Nørskov, J. Phys. Chem. C, 2010, 114, 18182–18197 CrossRef.
- J. Greeley, T. Jaramillo, J. Bonde, I. Chorkendorff and J. K. Nørskov, Nat. Mater., 2006, 5, 909–913 CrossRef CAS PubMed.
- T. F. Jaramillo, K. P. Jørgensen, J. Bonde, J. H. Nielsen, S. Horch and I. Chorkendorff, Science, 2007, 317, 100–102 CrossRef CAS PubMed.
- J. Bonde, P. G. Moses, T. F. Jaramillo, J. K. Nørskov and I. Chorkendorff, Faraday Discuss., 2009, 140, 219–231 RSC.
- J. D. Benck, T. R. Hellstern, J. Kibsgaard, P. Chakthranont and T. F. Jaramillo, ACS Catal., 2014, 4, 3957–3971 CrossRef CAS.
- B. Hinnemann, P. G. Moses, J. Bonde, K. P. Jørgensen, J. H. Nielsen, S. Horch, I. Chorkendorff and J. K. Nørskov, J. Am. Chem. Soc., 2005, 127, 5308–5309 CrossRef CAS PubMed.
- C. Tsai, K. Chan, J. K. Nørskov and F. Abild-Pedersen, Surf. Sci., 2015, 640, 133–140 CrossRef CAS.
- C. Tsai, F. Abild-Pedersen and J. K. Nørskov, Nano Lett., 2014, 14, 1381–1387 CrossRef CAS PubMed.
- J. K. Nørskov, T. Bligaard, A. Logadottir, J. R. Kitchin, J. G. Chen, S. Pandelov and U. Stimming, J. Electrochem. Soc., 2005, 152, 23–26 CrossRef.
- J. Kibsgaard, A. Tuxen, K. G. Knudsen, M. Brorson, H. Topsøe, E. Lægsgaard, J. V. Lauritsen and F. Besenbacher, J. Catal., 2010, 272, 195–203 CrossRef CAS.
- D. Escalera-López, Y. Niu, J. Yin, K. Cooke, N. V. Rees and R. E. Palmer, ACS Catal., 2016, 6, 6008–6017 CrossRef PubMed.
- Y. Li, H. Wang, L. Xie, Y. Liang, G. Hong and H. Dai, J. Am. Chem. Soc., 2011, 133, 7296–7299 CrossRef CAS PubMed.
- C. Ruffman, C. K. Gordon, J. T. Gilmour, F. D. Mackenzie and A. L. Garden, Nanoscale, 2021, 13, 3106–3118 RSC.
- S. Trasatti, J. Electroanal. Chem., 1972, 39, 163–184 CrossRef CAS.
- S. Tang, W. Wu, S. Zhang, D. Ye, P. Zhong, X. Li, L. Liu and Y. F. Li, Phys. Chem. Chem. Phys., 2018, 20, 1861–1871 RSC.
- Y. Shi, Y. Zhou, D. R. Yang, W. X. Xu, C. Wang, F. B. Wang, J. J. Xu, X. H. Xia and H. Y. Chen, J. Am. Chem. Soc., 2017, 139, 15479–15485 CrossRef CAS PubMed.
- S. Park, J. Park, H. Abroshan, L. Zhang, J. K. Kim, J. Zhang, J. Guo, S. Siahrostami and X. Zheng, ACS Energy Lett., 2018, 3, 2685–2693 CrossRef CAS.
- C. Tsai, H. Li, S. Park, J. Park, H. S. Han, J. K. Nørskov, X. Zheng and F. Abild-Pedersen, Nat. Commun., 2017, 8, 1–8 CrossRef PubMed.
- G. Gao, Q. Sun and A. Du, J. Phys. Chem. C, 2016, 120, 16761–16766 CrossRef CAS.
- W. Zhou, X. Zou, S. Najmaei, Z. Liu, Y. Shi, J. Kong, J. Lou, P. M. Ajayan, B. I. Yakobson and J. C. Idrobo, Nano Lett., 2013, 13, 2615–2622 CrossRef CAS PubMed.
- H. Qiu, T. Xu, Z. Wang, W. Ren, H. Nan, Z. Ni, Q. Chen, S. Yuan, F. Miao, F. Song, G. Long, Y. Shi, L. Sun, J. Wang and X. Wang, Nat. Commun., 2013, 4, 1–6 Search PubMed.
- Y. Ouyang, C. Ling, Q. Chen, Z. Wang, L. Shi and J. Wang, Chem. Mater., 2016, 28, 4390–4396 CrossRef CAS.
- H. Li, C. Tsai, A. L. Koh, L. Cai, A. W. Contryman, A. H. Fragapane, J. Zhao, H. S. Han, H. C. Manoharan, F. Abild-Pedersen, J. K. Nørskov and X. Zheng, Nat. Mater., 2016, 15, 48–53 CrossRef CAS PubMed.
- M. A. Lukowski, A. S. Daniel, F. Meng, A. Forticaux, L. Li and S. Jin, J. Am. Chem. Soc., 2013, 135, 10274–10277 CrossRef CAS PubMed.
- D. Voiry, M. Salehi, R. Silva, T. Fujita, M. Chen, T. Asefa, V. B. Shenoy, G. Eda and M. Chhowalla, Nano Lett., 2013, 13, 6222–6227 CrossRef CAS PubMed.
- L. Song, M. Zhao, X. Li, Z. Zhang and L. Qu, RSC Adv., 2016, 6, 70740–70746 RSC.
- X. Zhou, J. Prikryl, M. Krbal, J. M. Macak and P. Schmuki, Electrochem. Commun., 2017, 82, 112–116 CrossRef CAS.
- W. Jian, X. Cheng, Y. Huang, Y. You, R. Zhou, T. Sun and J. Xu, Chem. Eng. J., 2017, 328, 474–483 CrossRef CAS.
- M. Remskar, A. Mrzel, Z. Skraba, A. Jesih, M. Ceh, J. Demšar, P. Stadelmann, F. Lévy and D. Mihailovic, Science, 2001, 292, 479–481 CrossRef CAS PubMed.
- F. L. Deepak and M. Jose-Yacaman, Isr. J. Chem., 2010, 50, 426–438 CrossRef CAS.
- W. Shi, Z. Wang and Y. Q. Fu, J. Nanoparticle Res., 2017, 19, 1–7 CrossRef CAS.
- R. de Alencar Rocha, W. F. da Cunha and L. A. Ribeiro, J. Mol. Model., 2019, 25, 290 CrossRef PubMed.
- W. Li, G. Zhang, M. Guo and Y.-W. W. Zhang, Nano Res., 2014, 7, 1–10 CrossRef.
- J. Xiao, M. Long, X. Li, H. Xu, H. Huang and Y. Gao, Sci. Rep., 2014, 4, 1–7 Search PubMed.
- G. L. Cardoso, P. C. Piquini and R. Ahuja, Energy Fuels, 2021, 21, 40 Search PubMed.
- G. Seifert, H. Terrones, M. Terrones, G. Jungnickel and T. Frauenheim, Phys. Rev. Lett., 2000, 85, 146–149 CrossRef CAS PubMed.
- R. Ansari, S. Malakpour, M. Faghihnasiri and S. Sahmani, Superlattices Microstruct., 2015, 82, 188–200 CrossRef CAS.
- G. Kresse and J. Furthmüller, Comput. Mater. Sci., 1996, 6, 15–50 CrossRef CAS.
- J. Wellendorff, K. T. Lundgaard, A. Møgelhøj, V. Petzold, D. D. Landis, J. K. Nørskov, T. Bligaard and K. W. Jacobsen, Phys. Rev. B: Condens. Matter Mater. Phys., 2012, 85, 235149 CrossRef.
- P. E. Blöchl, Phys. Rev. B: Condens. Matter Mater. Phys., 1994, 50, 17953–17979 CrossRef PubMed.
- G. Kresse and D. Joubert, Phys. Rev. B: Condens. Matter Mater. Phys., 1999, 59, 1758 CrossRef CAS.
- S. Xiong and G. Cao, Nanotechnology, 2016, 27, 105701 CrossRef PubMed.
- H.-P. Komsa and A. V. Krasheninnikov, Phys. Rev. B: Condens. Matter Mater. Phys., 2015, 91, 125304 CrossRef.
- R. Kronberg, M. Hakala, N. Holmberg and K. Laasonen, Phys. Chem. Chem. Phys., 2017, 19, 16231–16241 RSC.
- L. Margulis, G. Salitra, R. Tenne, M. Talianker and M. Tallanker, Nature, 1993, 365, 113–114 CrossRef CAS.
- M. Liu, M. S. Hybertsen and Q. Wu, Angew. Chem., 2020, 132, 2–9 CrossRef.
- Y. Huang, R. J. Nielsen, W. A. Goddard III and M. P. Soriaga, J. Am. Chem. Soc., 2015, 137, 6692–6698 CrossRef CAS PubMed.
- C. Ruffman, C. K. Gordon, E. Skúlason and A. L. Garden, J. Phys. Chem. C, 2020, 124, 17015–17026 CrossRef CAS.
- W. Li, G. Liu, J. Li, Y. Wang, L. Ricardez-Sandoval, Y. Zhang and Z. Zhang, Appl. Surf. Sci., 2019, 143869 CrossRef CAS.
- T. Niyitanga, P. E. Evans, T. Ekanayake, P. A. Dowben and H. K. Jeong, J. Electroanal. Chem., 2019, 845, 39–47 CrossRef CAS.
- H. Wang, H. J. Lin, W. T. Cai, L. Z. Ouyang and M. Zhu, J. Alloys Compd., 2016, 658, 280–300 CrossRef CAS.
- Q. L. Xiong, J. Zhang, C. Xiao and Z. H. Li, Phys. Chem. Chem. Phys., 2017, 19, 19948–19958 RSC.
- Y. Yang, Y. Liu, B. Man, M. Zhao and W. Li, RSC Adv., 2019, 9, 17203–17210 RSC.
- E. Skúlason, A. A. Faraj, L. Kristinsdóttir, J. Hussain, A. L. Garden and H. Jónsson, Top. Catal., 2014, 57, 273–281 CrossRef.
- K. Honkala, A. Hellman, I. N. Remediakis, A. Logadottir, A. Carlsson, S. Dahl, C. H. Christensen and J. K. Nørskov, Science, 2005, 307, 555–558 CrossRef CAS PubMed.
- P. Légaré, Surf. Sci., 2004, 559, 169–178 CrossRef.
- B. Hammer and J. K. Nørskov, Surf. Sci., 1995, 343, 211–220 CrossRef CAS.
- T. Liu, Q. Dang, X. Zhou, J. Li, Z. Ge, H. Che, S. Tang, Y. Luo and J. Jiang, Chem.–Eur. J., 2021, 27, 6945–6953 CrossRef CAS PubMed.
Footnote |
| † Electronic supplementary information (ESI) available. See DOI: 10.1039/d1na00441g |
| This journal is © The Royal Society of Chemistry 2021 |

