
 Open Access Article
 This Open Access Article is licensed under a Creative Commons Attribution-Non Commercial 3.0 Unported Licence
Exploring the use of upconversion nanoparticles in chemical and biological sensors: from surface modifications to point-of-care devices
Marylyn S.
Arai
 * and
Andrea S. S.
de Camargo
*
* and
Andrea S. S.
de Camargo
*
São Carlos Institute of Physics, University of São Paulo, Av. Trabalhador Sãocarlense 400, 13566-590 São Carlos, Brazil. E-mail: marylyn.setsuko@gmail.com; andreasc@ifsc.usp.br
First published on 23rd July 2021
Abstract
Upconversion nanoparticles (UCNPs) have emerged as promising luminescent nanomaterials due to their unique features that allow the overcoming of several problems associated with conventional fluorescent probes. Although UCNPs have been used in a broad range of applications, it is probably in the field of sensing where they best evidence their potential. UCNP-based sensors have been designed with high sensitivity and selectivity, for detection and quantification of multiple analytes ranging from metal ions to biomolecules. In this review, we deeply explore the use of UCNPs in sensing systems emphasizing the most relevant and recent studies on the topic and explaining how these platforms are constructed. Before diving into UCNP-based sensing platforms it is important to understand the unique characteristics of these nanoparticles, why they are attracting so much attention, and the most significant interactions occurring between UCNPs and additional probes. These points are covered over the first two sections of the article and then we explore the types of fluorescent responses, the possible analytes, and the UCNPs’ integration with various material types such as gold nanostructures, quantum dots and dyes. All the topics are supported by analysis of recently reported sensors, focusing on how they are built, the materials’ interactions, the involved synthesis and functionalization mechanisms, and the conjugation strategies. Finally, we explore the use of UCNPs in paper-based sensors and how these platforms are paving the way for the development of new point-of-care devices.
 Marylyn S. Arai | Marylyn Arai has earned a BSc in Chemistry and a M.Sc. in Materials Science and Engineering from the University of São Paulo (USP) in Brazil and is currently a PhD student at the São Carlos Institute of Physics (IFSC/USP). She has experience in the synthesis and functionalization of nanomaterials such as upconversion nanoparticles, quantum dots, and metallic nanostructures. She is now particularly interested in the combination of UCNPs with other probe materials for the development of energy transfer pairs aimed at the subsequent construction of sensing platforms. |
 Andrea S. S. de Camargo | Andrea S. S. de Camargo received her BSc and M.Sc. degrees in Chemistry from the State University of São Paulo (UNESP), and her PhD in Applied Physics from the University of São Paulo (USP). She worked as a postdoctoral fellow at the USP and at the Federal University of São Carlos and was a Humboldt postdoctoral fellow at Westfälisches Wilhelms University of Münster in Germany. In 2006 she became a Professor at the São Carlos Institute of Physic (IFSC/USP), where, since 2015, she has been at the Associate level. At USP, she is the head of the highly interdisciplinary Laboratory of Spectroscopy of Functional Materials (LEMAF). Her broad research interests in the area of optical and luminescent materials include the development and spectroscopic characterization of glasses, glass ceramics and host–guest meso- and nanoscopic hybrid materials. She is an Editor of Journal of Materials Science, a Scientific Director of the Brazilian Society of Materials Research (SBPMat), and an Alexander von Humboldt Ambassador Scientist in Brazil. |
1. Introduction
Lanthanide-doped upconversion nanoparticles (UCNPs) constitute a class of luminescent nanomaterials with the ability to emit radiation of shorter wavelength than their excitation radiation. Typically, they absorb in the near-infrared region (NIR) and emit photons of higher energy in the ultraviolet (UV) and/or visible (Vis) region. UCNPs were first studied in the mid-1960s1,2 and emerged as interesting alternatives to conventional fluorescent probes such as organic dyes and quantum dots (QDs).3 Although the latter exhibit high quantum yields, their applications are frequently hindered by limitations such as photodegradation and blinking (random switching between bright emission and darkness). Additionally, these materials are often excited in the UV/Vis region, which requires expensive and biologically harmful UV sources and leads to autofluorescence of biomolecules. Therefore, UCNPs have been attracting considerable attention, particularly for biological applications.4In order to produce nanoparticles with high upconversion (UC) efficiency, two requisites need to be fulfilled: first, the crystalline host matrix must be a dielectric material displaying low frequency phonons, which is necessary to minimize the non-radiative decays of the lanthanide dopant ions responsible for the UC phenomenon.5,6 Among various possible matrices, the hexagonal (β)-NaYF4 phase stands out as one of the most efficient hosts, particularly for red, green and blue emissions.7,8 Second, there must be a proper choice of the dopant lanthanide ions depending on the targeted emission. To that end, the most often employed ions are Nd3+, Ho3+, Er3+, Tm3+ and Tb3+.
Due to great similarity in their electronic configurations, [Xe]4fn−15s25p66s2, the trivalent lanthanide ions (Ln3+) exhibit similar physical and chemical properties and present an ample range of emissions associated with intraconfigurational 4f–4f transitions. Since the internal 4f orbitals are shielded from the coordination environment by the more radially extensive 5s and 5p orbitals, they do not experience significant overlap with the ligand orbitals. In this way, the discrete emissions are practically invariant from host to host with respect to positions and lineshapes.9 Furthermore, since there is no parity change between ground and excited 4f states, the transitions are forbidden by electric dipole interactions and thus, absorption and emission cross-sections are low. To overcome this drawback, a sensitizer ion is commonly employed to contribute to the excitation of the activator ion via energy transfer.10 The sensitizer and activator ions are co-doped in the host lattice in concentrations usually close to 20 mol% and <2 mol%, respectively.
The Yb3+ ion with a simple two energy level diagram and a high absorption cross-section at 976 nm (2F7/2 → 2F5/2 transition) is, by far, the most employed sensitizer. Most Ln3+ ions (except La3+ and Lu3+) are suitable to be used as activators. Er3+ and Tm3+ display ladder-like energy levels and are frequently employed in combination with Yb3+ due to their matching energy levels around 976 nm, as shown in Fig. 1A. Upon excitation at this wavelength, Yb/Er-doped UCNPs display characteristic emissions in the green (520 and 540 nm), corresponding to the 2H11/2,4S3/2 → 4I15/2 transitions, and in the red (650 nm), corresponding to the 4F9/2 → 4I15/2 transition. On the other hand, UCNPs doped with Yb/Tm display emissions in the blue at around 451 nm (1D2 → 3F4) and 480 nm (1G4 → 3H6), and in the red at 649 nm (1G4 → 3F4).11,12 In Fig. 1B it is possible to observe the UC multicolor fine-tuning through the use of NaYF4 nanoparticles doped with various concentrations of Yb3+, Er3+ and Tm3+.13
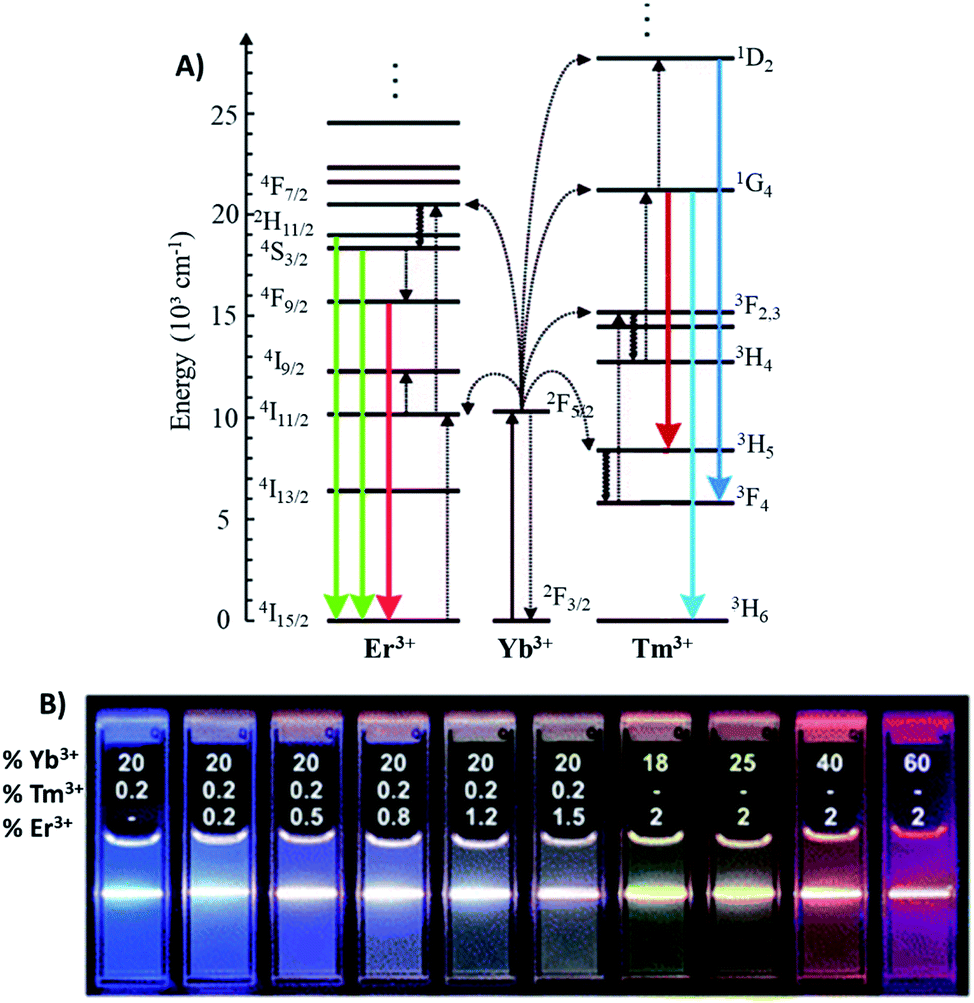 | ||
| Fig. 1 (A) Energy-level diagram of anti-Stokes processes in UCNPs (NaYF4:Yb,Er/Tm). The sensitizer ion Yb3+ absorbs most of the NIR light, and the activator ions Er3+ or Tm3+ emit UV-visible light. Full arrows: radiative transitions, dotted arrows: non-radiative energy transfer, curled arrows: multiphonon relaxation. Modified with permission from ref. 11. Copyright 2004, Wiley-VCH Verlag GmbH & Co. KGaA, Weinheim. (B) Luminescence photographs showing the corresponding colloidal solutions of NaYF4 nanoparticles doped with varied concentrations of Yb3+, Er3+ and Tm3+, excited at 980 nm, with a 600 mW diode laser. Modified with permission from ref. 13. Copyright 2008, American Chemical Society. | ||
Different upconversion luminescence mechanisms have been recognized to occur either alone or in combination. These mechanisms involve the sequential absorption of two or more photons by metastable, long-lived energy states. This absorption leads to the population of excited states in the UV or visible region, yielding upconversion emissions. The three main possible mechanisms are as follows: (i) excited-state absorption (ESA); (ii) energy transfer upconversion (ETU); and (iii) photon avalanche (PA). They differ from each other in how the multiphoton absorption process occurs and if the emission intensity scales quadratically or cubically with the exciting power density for two- or three-photon absorption, respectively.14 ETU is the most frequently observed and developed mechanism in UC nanomaterials, while ESA is the least efficient one, and PA is rare. The mechanisms of lanthanide upconversion processes have been extensively discussed in previous reviews that can be consulted for more detailed information.15–18
When it comes to the design and preparation of crystalline upconversion materials, there are several routes to synthetize UCNPs such as co-precipitation,19 thermal decomposition,20 solvothermal21 and hydrothermal22 synthesis, and sol–gel processes.23 Among these, one of the most used methods is thermal decomposition, which occurs at elevated temperature in high boiling point organic solvents and results in highly crystalline particles with controlled size and shape. Co-precipitation synthesis is another well-known method, which compared to thermal decomposition, is sometimes considered to be more convenient due to a simpler protocol and short reaction time. Yet, an interesting alternative to the previous methods is hydro(solvo)thermal synthesis, which allows the obtainment of crystalline nanomaterials under relatively mild conditions as compared to other synthetic routes.6,24 Despite the variety of preparation methods, most synthetic strategies for UCNP production employ organic solvents and/or hydrophobic surface stabilizing agents, which yields particles with a hydrophobic surface lacking functional groups for bioconjugation. Thus, several post-synthesis methods have been developed to yield hydrophilic particles with enhanced UC emission efficiency and to functionalize them with anchoring groups for further applications. These synthesis and post-synthesis methods have been reviewed several times6,25–28 and will be addressed throughout this work.
The unique nature of the upconversion process, the fact that the excitation wavelength lies in the NIR optical window of biological tissues (where light is able to achieve the maximum penetration)4 and the discrete emissions of Ln3+ in the UV-Vis spectral region have allowed the design of very interesting UCNP-based systems for photodynamic therapy of cancer cells,29 photodynamic inactivation of bacteria,30in vivo and in vitro bioimaging,31 and drug and gene delivery,32 just to mention a few.33 Although UCNPs have been used in a large number of applications, it is probably in the field of sensing they have been best showing their potential. Conventional fluorescent probes usually used to construct sensing platforms are predominantly excited by high energy radiation in the UV range (between 300 and 400 nm), particularly the recently widely explored QDs34,35 and carbon dots.36,37 However, the UV light can also trigger the emission of biotissues and biomolecules, which results in high background emission and low sensitivity levels. Additionally, these dots are cytotoxic, hindering their use in in vivo sensors. In this way, thanks to their low cytotoxicity, high photostability, large anti-Stokes shifts, long excited state lifetime values, and reduced background noise, which significantly enhances the limit of detection (LOD), UCNP-based sensing platforms are increasingly being developed through innovative approaches.
In this review we summarize recent studies on the use of UCNPs in different chemical and biological sensing platforms and discuss essential information that should be addressed in the construction of UCNP-based sensors. We analyze important interactions that can occur between UCNPs and the environment, and between UCNPs and additional probes. These interactions directly interfere with the response of the system, which is the focus in the second part of the manuscript, where we explore the fluorescent response possibilities based on the UCNP emissions in the presence of analytes. Third, we present the integration of UCNPs with various material types focusing on the synthesis and functionalization reaction mechanisms and conjugation strategies. At last, we analyze the use of UCNPs to produce paper-supported sensors, exploring their characteristics, new types of signal response readouts, and the development of point-of-care devices.
2. Important interactions in UCNP-based sensing systems
As previously discussed, due to the shielding provided by the outer shells, the 4f–4f transitions of the lanthanide dopants are barely affected by their surroundings and are little responsive to external stimuli.38 Although there are some articles describing how the UCNP emissions can be affected by the solvent,39,40 pH,41 or presence of heavy metal ions,42 their response to all these interferences is rather unspecific and the nanoparticles’ intrinsic emission changes can hardly be utilized alone for sensing applications. In this way, for the construction of UCNP-based sensitive sensors, it is necessary to use recognition elements, which specifically bind target species and instantly lead to the production of spectral responses, and/or to use methods for signal referencing. These conditions lead to the combination of relatively inert UCNPs (in terms of luminescent responses to external stimuli) with sensitive molecules that show selective response to certain analytes and with other luminescent materials that can be used as both recognition elements and reference signals.43The combination between UCNPs and these other materials, used as recognition probes and/or references, most of the times, but not always (Section 4.5), is explored through different energy (ET) and charge transfer (CT) mechanisms that are responsible for the modulation of the sensing signal, e.g. photoinduced electron transfer (PET),44–47 resonance energy transfer,48 inner filter effect, charge transfer,49,50 cooperative energy transfer (CET)51 and others.52 Among these processes, resonance energy transfer (RET) and the inner filter effect are the two most explored mechanisms in the construction of sensing platforms. Resonance energy transfer is a dynamic process that occurs through dipole–dipole coupling in which energy is non-radiatively transferred from the excited state of a donor material to the ground state of an acceptor, resulting in a shortened lifetime of the donor emitting level. In this way, there must be spectral overlap of the donor emission and the absorption of the acceptor material, and the extent of energy transfer is proportional to this overlap. This process is distance dependent and usually occurs when the space between the two materials is between 2 and 10 nm. RET can also be referred to as Fluorescence Resonance Energy Transfer (FRET) or as lanthanide-based Luminescence Resonance Energy Transfer (LRET),53,54 so that, in this review, the acronyms will be used in accordance with the usage in the respective referenced articles.
On the other hand, the inner filter effect is a process that can be of two main types depending on the kind of light absorbed by the acceptor. The primary inner filter effect (pIFE) refers to the absorption of the excitation radiation, by various absorbers in the system, while the secondary inner filter effect (sIFE) relates to the absorption of the emission radiation by acceptors. Since UCNP-based sensors are excited in the NIR region, the pIFE is easily controlled and hardly observed. The sIFE is predominant in most sensing platforms and, for the sake of simplicity, from now on it will be referred to as the IFE. The IFE is a static process in which the energy transfer to the acceptor takes place after the radiative relaxation of the donor, and thus, the temporal behavior of the donor emission is not affected, and the distance between the two materials is not relevant.55
UCNPs stand out as energy donor materials in the construction of FRET and IFE-based systems due to their large anti-Stokes shifts, sharp-bands, and easily modulated emissions which can be tuned through the proper choice of the dopant Ln3+ – almost the entire UV-vis spectrum can be covered. IFE-based sensors are usually constructed by combining UCNPs with colorimetric indicators and the sensing depends on modifications in the indicator absorption in the presence of analytes, which leads to changes in the overall emission of the system.56
The use of UCNPs in FRET-based sensors is much more often explored and it has been shown that UCNPs can be used as energy donors in combination with several types of probe materials57 such as organic dyes, noble metal nanostructures, carbon-based materials, and QDs. As previously discussed, FRET is based on two pivotal rules: (1) the chosen material should have an absorption spectrum that overlaps with the UCNP emission and (2) the distance between the UCNPs and the additional probe should be short enough to allow the energy transfer process to occur. FRET-based sensors rely on careful control and modulation of these two conditions in response to the analyte presence. The first rule can be explored through the selection of a suitable energy acceptor material with an absorption changeable by the target species. Furthermore, the materials’ approximation or separation from the UCNPs in the presence of analytes can be achieved in straightforward ways by careful selection of the conjugation strategies. All these variables (energy transfer mechanism, selection of probes, distance and absorption modulation, and conjugation strategies) are essential and should be thoughtfully chosen when developing an UCNP-based sensor. In the next sections, we investigate and discuss how these variables influence the type of luminescent response presented by sensors and we demonstrate how these platforms are constructed.
3. Types of responses from UCNP-based sensing systems
Although a remarkably high number of UCNP-based sensors have been developed so far, their general luminescent response can be divided into two major types: [1] fluorescence “turn-on/off” and [2] ratiometric fluorescence. The response type strongly depends on the chosen probes and recognition elements, and on the interactions occurring between the UCNPs and these elements, in the presence and absence of the analyte.3.1. Fluorescence “turn-off” and “turn-on” response
The “turn-off/on” mechanism relies on changes in the overall fluorescence intensity based on emission quenching (“turn off”) or enhancement (“turn on”), as schematically shown in Fig. 2. In the sections below we discuss how the “turn-off/on” response can be obtained and tuned.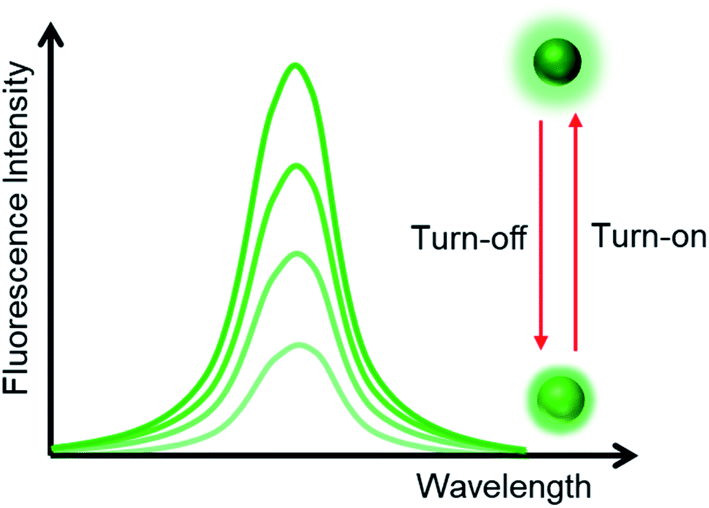 | ||
| Fig. 2 Schematic illustration of fluorescence enhancement (“turn-on”) and quenching (“turn-off”). | ||
| UCNP-based “turn-off” sensors | |||||
|---|---|---|---|---|---|
| UCNPs | Additional probe | Effect | Analyte | Limit of detection | Ref. |
| a Abbreviations: RhBD: rhodamine B derivative; CD: cyclodextrin; BHQ: black hole quencher; OTA: ochratoxin A; POEGMA-b-PMAEP: copolymer poly(ethylene glycol) methyl ether acrylate phosphate methacrylate; TAMRA: carboxytetramethyl rhodamine; Cit: citrate; ALP: alkaline phosphatase; MLP: melanin like polymers; TYR: tyrosinase; RePr: resorufin propionate; TMB: 3,3′,5,5′-tetramethylbenzidine; OPD: o-phenylenediamine; HQC: 8-hydroxyquinoline-2-carboxylic acid; OP: organophosphorus; AIV: avian influenza virus; LSP: localized surface plasmon; HCPT: hydroxycamptothecin; TOPOI: type I topoisomerase; MS: magnetic separation; ZEA: zearalenone; AFB1: aflatoxin B1; SQ: sulfaquinoxaline; DON: deoxynivalenol; CET: cooperative energy transfer; MPMs: magnetic polystyrene microspheres; EDT: ethane-1,2-dithiol; CAs: catecholamines; DA: dopamine; EP: epinephrine; COFs: covalent organic frameworks; GND: guanidine; TNP: 2,4,6-trinitrophenol; PFOS: perfluorooctane sulfonate; DES: diethylstilbestrol. | |||||
| NaYF4@NaYF4:Er,Yb@NaYF4@PAA | RhBD | LRET | Cu2+ | — | 62 |
| NaYF4:Yb,Er@α-CD | RhBD | FRET | Cysteine | 1.1 μM | 73 |
| NaYF4:Yb,Er@PEI-aptamer | BHQ1 | FRET | OTA | 0.022 ng mL−1 | 61 |
| NaYF4:Yb,Er@POEGMA-b-PMAEP | TAMRA | LRET | Exonuclease III | 15 pM | 74 |
| NaYF4:Yb,Er@α-CD | RePr | LRET | Hydrazine | 35.5 μM | 63 |
| NaYF4:Yb,Er,Mn@mPEG-DNA | BHQ3 | LRET | OTA | 0.098 ng mL−1 | 64 |
| NaGdF4:Yb,Er@NaGdF4:YB,Nd@NOBF4 | IR-808 | ET | Water content | 0.018% | 75 |
| NaYF4:Yb,Er@NaYF4@Cit-DNA | Cy3 | LRET | DNA | 146 fmol | 65 |
| NaYF4:Yb,Tm@PAA-DNA | SYBR green I | LRET | Hg2+ | 0.14 nM | 76 |
| NaYF4:Yb,Er@NaYF4 | TMB | FRET | Fe3+ | 0.217 μM | 77 |
| NaYF4:Yb,Tm@PAA | o-Quinone | PET | Tyrosinase and ALP | — | 45 |
| NaYF4:Yb,Tm@CTAB | OPD | IFE | H2O2-related analytes | 21.3 nM for H2O2 and 29.7 nM for choline | 78 |
| NaYF4:Yb,Tm@PEI | OPD | IFE | Uric acid | 6.7 μM | 79 |
| NaYF4:Yb,Er,Tm@PEG | HQC | LRET | Cu2+ | — | 80 |
| NaGdF4:Yb,Er@NaYF4@CTAB | MLP | PET | Tyramine and TYR | 0.026 μM for tyramine and 0.003 U mL−1 for TYR | 46 |
| NaYF4:Yb,Er@PEI-aptamer | AuNPs | ET | Cocaine | 10 nM | 58 |
| NaYF4:Yb,Er@CTAB | AuNPs | FRET | OP pesticides | 0.67 ng L−1 for parathion-methyl | 71 |
| BaGdF5:Yb,Er@PEI-oligonucleotide | AuNPs | LRET | Ebola virus | 300 fM | 72 |
| BaGdF5:Yb,Er@PEI-oligonucleotide | AuNPs | LRET | AIV | 7 pM | 59 |
| NaYF4:Yb,Er@PAA-aptamer | AuNRs | FRET | Thrombin | 1.5 nM | 81 |
| NaYF4:Yb,Er@DNA | AuNRs | LRET | Exosomes | 1.1 × 10³ particles per μL | 60 |
| NaYF4:Yb,Tm@NaYF4@PAA | AuNTs | LSP and ET | Vitamin B12 | 3 nM | 82 |
| NaY/GdF4:Yb,Er@dSiO2-NH2 | AgNPs | IFE | Cr3+ | 34 nM | 83 |
| NaYF4:Yb,Gd,Er@HCPT | GO | FRET | TOPOI | 0.29 nM | 84 |
| NaYF4:Yb,Er@dSiO2 | Fe3O4 MNPs | MS | ZEA | 0.007 μg L−1 in beer | 68 |
| NaYGdF4:Yb,Ho@dSiO2-cDNA | Fe3O4 MNPs | MS | Tetracycline | 0.0062 ng mL−1 | 85 |
| NaYF4:Yb,Gd,Tm/Ho@dSiO2-antibody | Fe3O4 MNPs | MS | AFB1 and DON | 0.001 ng mL−1 | 86 |
| NaYF4:Yb,Er@dSiO2-cDNA | Fe3O4 MNPs | MS | Enrofloxacin | 0.06 ng mL−1 | 67 |
| NaYF4:Yb,Er@Cit-antibody | Fe3O4 MNPs | MS | AFB1 | 0.2 ng mL−1 | 66 |
| NaYF4:Yb,Tm@PAA-antibody | MPMs | MS | SQ | 0.1 μg L−1 | 87 |
| NaYF4:Yb,Tm@CTAB | Squaric acid-Fe3+ | IFE | Glucose | 2.3 μM | 88 |
| NaLuGdF4:Yb,Er@EDT | Fe3+, Cu2+ and Li+ | FRET | CAs | 2.8 nM for CA, 2.5 nM for DA and 2.4 nM for EP | 89 |
| NaGdF4:Yb,Tm@PEI | Cu2+ | CET | OP pesticides | 0.05 ng mL−1 | 51 |
| NaYF4:Yb,Tm@PAA | Cu2+ | LRET | Thiram | 1 μM | 90 |
| NaYF4:Yb,Er@GND | — | FRET | TNP | 77.8 pM | 91 |
| NaYF4:Yb,Er@dSiO2@MIP | — | PET | Acetamiprid | 8.3 ng mL−1 | 44 |
| NaGdF4:Yb,Tm@NaGdF4:Eu | — | ET | Cu2+ | 82 ppb | 92 |
| NaYF4:Yb,Er@mSiO2@COFs | — | ET | PFOS | 0.15 pM | 49 |
| NaYF4:Yb,Er@NaYF4 | — | ET and excitation attenuation | Water | 80 ppm | 40 |
| NaYF4:Yb,Tm,Er@NaYF4-DNA | — | Electron transfer | Hg2+ | 5 nM | 93 |
| NaYF4:Yb,Er@PAA@MIP | — | PET | Cytochrome c | 0.73 μM | 94 |
| NaYF4:Yb,Er@dSiO2@MIP | — | Charge transfer | DES | 12.8 ng mL−1 | 50 |
| NaBiF4:Yb,Er@PEI | — | NP disintegra-tion | Water content | — | 95 |
Meng et al. developed a FRET “turn-off” sensor using NaYF4:Yb,Er UCNPs functionalized with the dye 3,3′,5,5′-tetramethylbenzidine (UCNP-TMB) for the detection of F3+ ions, as schematically shown in Fig. 3A. The UCNP-TMB composite probe excited at 980 nm presents only the emissions of Er3+ due to the non-emissive TMB. However, the presence of Fe3+ ions causes oxidation of TMB molecules and the consequent development of a strong absorption from 500 to 750 nm, a region that overlaps well with Er3+ emission (Fig. 3B). In this way, upon Fe3+ addition, it was possible to observe a significant decrease in Er3+ emission intensities, particularly in the red. Additionally, a reduction in the 4F9/2 excited state lifetime was detected when Fe3+ was added to the TMB-UCNPs, which is solid evidence of FRET occurring with UCNPs acting as donors and TMB-Fe3+ as acceptors. The system presented high sensitivity in the range of 0–100 μM with a detection limit of 0.217 μM.77 A similar “turn-off” sensor based on the energy transfer pair UCNP-TMB was constructed by Liu et al. for simultaneous detection and quantification of H2O2 and glucose. When compared to other sensing systems, the developed platform presented higher sensitivity, detecting glucose in the range of 0.1–5.0 μM with a LOD of 64.0 nM in human serum.96
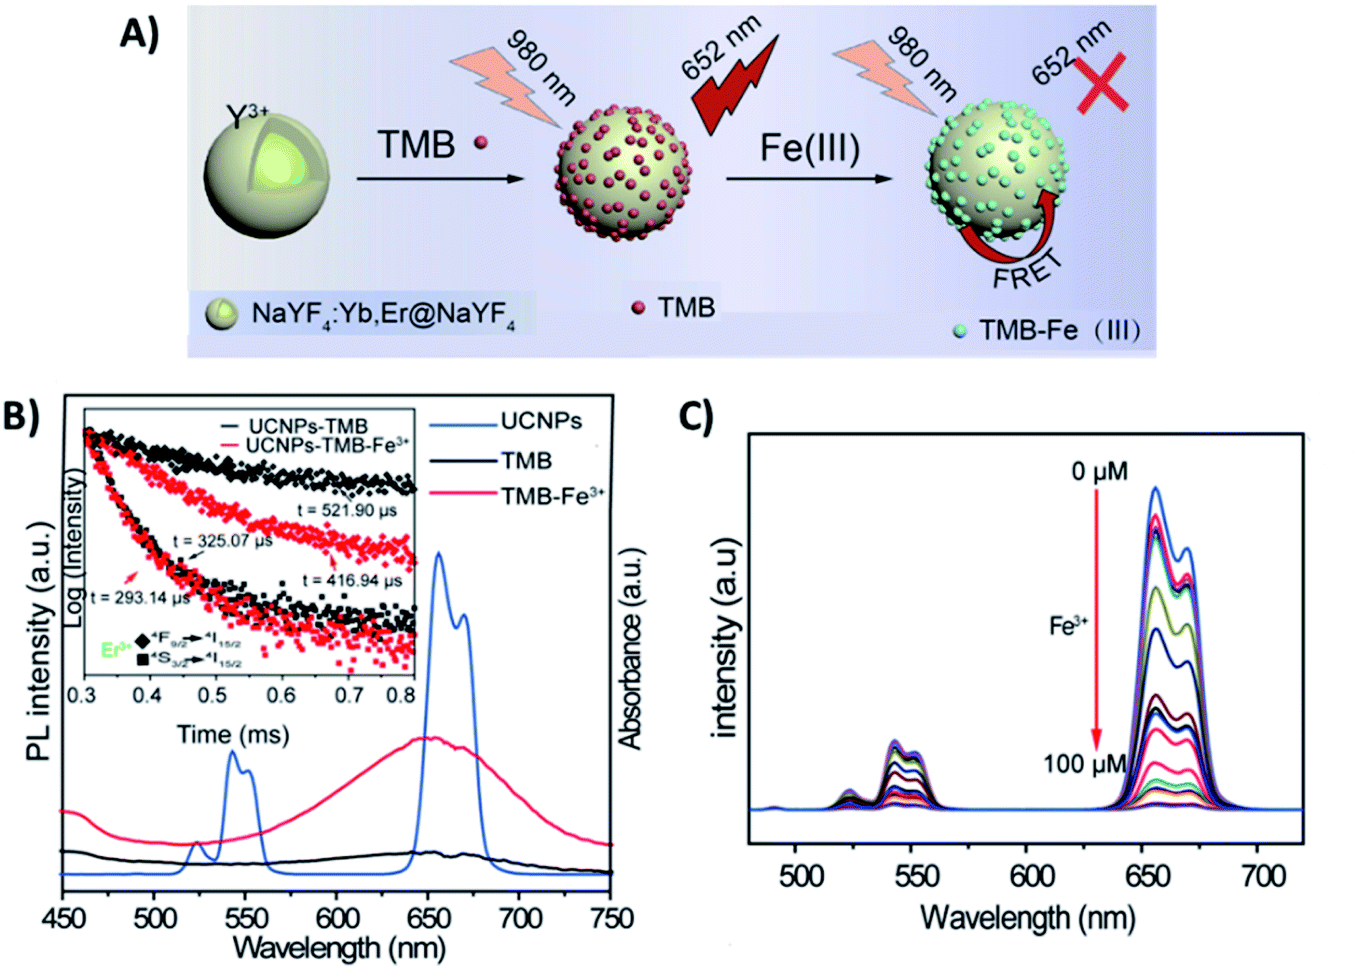 | ||
| Fig. 3 “Turn-off” platform for Fe3+ detection. (A) Schematic illustration of the UCNP-TMB sensor assembly and its sensing of Fe3+ based on FRET. (B) The emission spectrum of UCNPs (blue line) and ultraviolet-visible (UV-vis) spectra of TMB in the absence (black line) or presence of Fe3+ (red line); the inset shows the Er3+ decay curves recorded for UCNP-TMB with and without Fe3+. (C) The fluorescence spectra of UCNP-TMB in the presence of different concentrations of Fe3+ (0–100 μM). Modified with permission from ref. 77. Copyright 2019, IOP Publishing. | ||
Fig. 4A shows a schematic illustration of a “turn-off” UCNP-based fluorescent system for sensitive and selective detection of Cr3+, which was developed by Liu et al. through the use of NaY/GdF4:Yb,Er UCNPs and citrate-modified silver nanoparticles (Cit-AgNPs). The addition of Cr3+ to the Cit-AgNP-UCNP system results in the aggregation of Cit-AgNPs and as consequence, the surface plasmon resonance (SPR) band of the AgNPs shifts from 398 nm to longer wavelengths around 500–600 nm. This creates an obvious spectral overlap between the SPR band of the aggregated AgNPs and the emission spectra of the UCNPs at 545 nm (λexc = 980 nm), which meets the IFE requirement and leads to fluorescence quenching, as shown in Fig. 4B. The decrease in the UCNP emissions is dependent on the concentration of Cr3+ ions and responded linearly within the investigated concentration of 0.5–40 μM Cr3+ (Fig. 4C) with a limit of detection of 34 nM.83
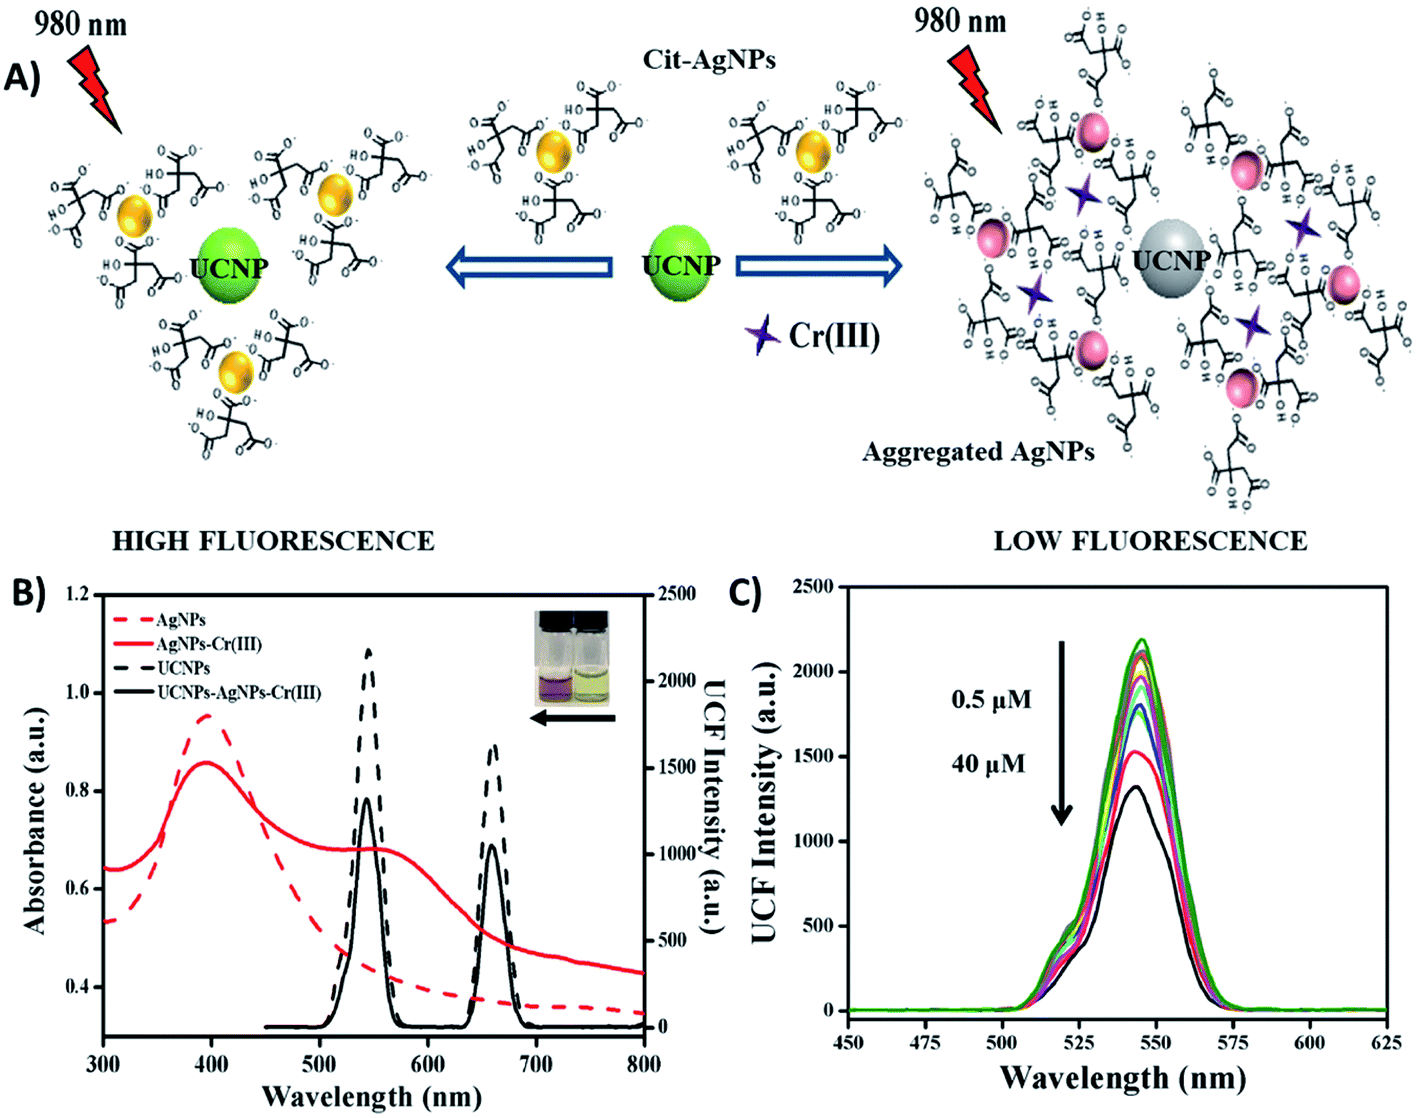 | ||
| Fig. 4 “Turn-off” UCNP-AgNP system for Cr3+ sensing. (A) Schematic representation of the platform working principle. (B) UV-vis spectra of AgNPs before and after the addition of Cr3+ (red dashed line and red solid line, respectively), emission spectra of UCNPs-AgNPs before and after the addition of Cr3+ (black dashed line and black solid line, respectively). The inset photograph shows the color of AgNPs and AgNPs-Cr3+ from right to left. (C) UC fluorescence spectra of UCNPs with AgNPs in the presence of different concentrations of Cr3+ (0.5–40 μM). Modified with permission from ref. 83. Copyright 2019, Elsevier B.V. | ||
Although several sensors reported in the literature are based on the “turn-off” mechanism, as previously mentioned, one must bear in mind that many factors such as the choice of solvent, pH value, and presence of charged molecules may lead to luminescence decrease, and thus these sensors usually exhibit lower selectivity and reliability. In this way, great efforts have been devoted to the design and construction of luminescence “turn-on” sensors by combining higher intrinsic sensitivity with higher chemical selectivity.
 | ||
| Fig. 5 “Turn-on” sensor for antioxidant capacity assay. (A) Schematic illustration of the design and working principle of the UCNPs/KMnO4 system. (B) Absorption spectrum of KMnO4 solution (red line) overlapping significantly with the emission spectrum of PAA-coated NaYF4:Yb/Er@NaYF4 core–shell UCNPs under excitation at 980 nm (black line). (C) UC emission spectra of UCNPs in the presence of a series of GSH concentrations. Reprinted with permission from ref. 97. Copyright 2019, Springer-Verlag GmbH Austria, part of Springer Nature. | ||
Huang et al. designed a “turn-on” ultrasensitive and selective biosensor for S1 nuclease assay based on FRET from DNA-functionalized UCNPs (NaYF4:Yb,Tm@NaYF4) to graphene oxide (GO) – a highly efficient energy acceptor material. The working principle of the upconversion FRET-based biosensor is shown in Fig. 6. When adding GO to the DNA-functionalized UCNPs, the nanoparticles adsorb on its surface via π–π stacking and hydrophobic interactions, which results in complete emission quenching. In contrast, when S1 nuclease is introduced into the system, DNA cleaves into mono- or short oligo-nucleotide fragments leading to weakened interactions, detachment, and keeping the UCNPs far away from the GO surface. As a result, the quenching efficiency decreases and the fluorescence recovery is proportional to the enzyme concentration, as observed in Fig. 6C. The developed sensor presented high sensitivity with a minimum detectable concentration of 1 × 10⁻⁴ units per mL S1 nuclease, which is more sensitive than previously developed approaches.99
 | ||
| Fig. 6 “Turn-on” UCNP-based sensor for S1 nuclease detection. (A) Schematic illustration of the upconversion FRET-based biosensor. (B) Fluorescence spectra of DNA-modified UCNPs before (red curve) and after incubation with GO (black curve), and the absorption spectrum of GO (blue curve). (C) UC fluorescence spectra of the biosensor with varying concentrations of S1 nuclease. Reprinted with permission from ref. 99. Copyright 2015, The Royal Society of Chemistry. | ||
Additionally to KMnO4 and GO,100,101 “turn-on” sensors have been constructed through the integration of UCNPs with several materials such as AuNPs,102–104 AgNPs,105,106 and dyes,107,108 and for sensing analytes ranging from metal ions109–111 to drug release,112 as summarized in Table 2.
| UCNP-based “turn-on” sensors | |||||
|---|---|---|---|---|---|
| UCNPs | Additional probe | Effect | Analyte | Limit of detection | Ref. |
| a Abbreviations: Cy: cyanine; GSH: glutathione; ATP: adenosine triphosphate; FAM: carboxyfluorescein; BHQ1: black hole quencher-1; RhBD: rhodamine B derivative; PPi: pyrophosphate; TAMRA: carboxytetramethyl rhodamine; TPPS: tetraphenylporphyrin tetrasulfonic acid hydrate; MMP: metalloproteinase; FITC: fluorescein isothiocyanate; Cit: citrate; DOX: doxorubicin; ALP: alkaline phosphatase; AA: ascorbic acid; Ox: oxidized; SWCNHs: single-walled carbon nanohorns; BACE-1 and PCA3: mRNA biomarkers associated with Alzheimer's disease and prostate cancer, respectively; AgTNPs: silver triangular nanoplates; CEA: carcinoembryonic antigen; HBV: hepatitis B virus; MB: molecular beacon; AChE: acetylcholinesterase; SPR: surface plasmon resonance; MNP: magnetic nanoparticles; MS: magnetic separation; COPs: copolymers; AFB1: aflatoxin B1; OTA: ochratoxin A; AIV: avian influenza virus; PSA: prostate specific antigen; EphA2: ephrin type-A receptor 2; HPAI H6N6: avian influenza viruses of high pathogenicity. | |||||
| NaYF4:Yb,Tm@NaYF4@PAA | Cy7 | FRET | Hydrogen sulfide | 510 nM | 113 |
| NaGdF4:Yb,Tm@NaGdF4@poly(D-lysine) | Cy3 | FRET | ATP | — | 114 |
| NaYF4:Yb,Er@NaYF4:Nd@PEG | Cy-GSH | LRET | Glutathione | 0.6 μM | 108 |
| NaYF4:Yb,Tm@NaYF4-DNAzyme | FAM, BHQ1 and dabcyl | LRET | Zn2+ | — | 111 |
| NaYF4:Yb,Er@NaGdF4@mSiO2 | RhBD | LRET | Cu2+ | 54 nM | 109 |
| NaYF4:Yb,Er@mSiO2 | RhB | FRET and IFE | Cu2+ and PPi | 117 nM for Cu2+ and 70 nM for PPi | 115 |
| NaGdF4:Yb,Er@NaGdF4 | RhB | FRET | Caspase-3 | 0.01 pg mL−1 | 107 |
| NaYF4:Yb,Tm | TPPS | FRET | Phosphate compounds | 0.066 μM for ATP and 0.36 μM for PPi | 116 |
| NaYF4:Yb,Tm | TPPS | FRET | Cu2+ | 0.21 μM | 117 |
| NaYF4:Yb,Er@dSiO2-streptavidin | TAMRA | FRET | Bisphenol A | 0.05 ng mL−1 | 118 |
| NaYF4:Gd,Yb@NaYF4:Yb,Tm,Er | TAMRA and FITC | LRET | MMP | 2.2 ng mL−1 for MMP-2 and 13.9 ng mL−1 for MMP-7 | 119 |
| NaGdF4:Yb,Er@PEG-DNA | TAMRA, Cy5 and AuNRs | LET | Divalent metal ions | 0.45 nmol/106 cells for Cu2+ | 120 |
| NaYF4:Yb,Er,Tm@NaGdF4@mPEG | Nile red derivative | LRET | Fe3+ | 89.6 nM | 121 |
| NaYF4:Yb,Er,Tm,Mn@PAA | H2S-responsive dyes | FRET | H2S | — | 122 |
| NaYF4:Yb,Er,Tm@NaGdF4@HmSiO2@PEI | Ru complex | LRET | Hg2+ | 0.16 μM | 123 |
| NaYF4:Yb,Er@Cit | Dopamine–melanin | PET | Antioxidants | — | 47 |
| NaGdF4:Yb,Er@NaGdF4:Yb-Mn@PEG | DOX | FRET | Drug release | — | 112 |
| NaYF4:Yb,Er@PAA | KMnO4 | FRET | Triclosan | 0.2 μM | 98 |
| NaYF4:Yb,Er@NaYF4@PAA | KMnO4 | IFE | Antioxidants | 3.3 μM for GHS | 97 |
| NaYF4:Yb,Tm@PEI | MnO2 | LET | ALP and AA | 0.045 mU mL−1 for ALP and 0.29 μM for AA | 124 |
| Ox-NaYF4:Yb,Tm@NaYF4 | MnO2 nanosheets | ET | H2O2 and glucose | 0.9 μM for H2O2 and 3.7 μM for glucose | 125 |
| Ox-NaYF4:Yb,Tm@NaYF4 | CoOOH nanoflakes | FRET | AA | 0.2 μM | 126 |
| NaYF4:Yb,Tm@NaYF4:Yb@PAA-aptamer | MoS2 | ET | Microcystin-LR | 0.002 ng mL−1 | 127 |
| NaYF4:Yb,Er@NaYF4@Cit-DNA | GQDs | LRET | Ag+ | 60 pM | 110 |
| NaYF4:Yb,Er@PAA-aptamer | CNPs | LRET | IgE | — | 128 |
| NaYF4:Yb,Er@NaYF4@Cit-pDNA | SWCNHs or GO | LRET | Pb2+ | 9.7 nM using SWCNHs and 10.8 nM using GO | 129 |
| NaYF4:Yb,Tm@NaYF4-DNA | GO | FRET | Endonuclease | 1 × 10⁻⁴ units per mL | 99 |
| NaYF4:Yb,Er@dSiO2-DNA | GO | FRET | DNA | 5 pM | 130 |
| NaYF4:Yb,Er@NaYF4@PAA-ssDNA | GO | FRET | Zn deficiency | — | 101 |
| NaYF4:Yb,Er@PAA-oligonucleotide | GO | FRET | Disease biomarkers | 500 fM for BACE-1 and PCA3 | 100 |
| NaYF4:Yb,Tm@dSiO2 | GO | FRET | MMP-9 | 12 ng mL−1 | 131 |
| NaYF4:Yb,Er,Zn@PEI | AgTNPs | FRET | ALP | 0.035 mU mL−1 | 132 |
| NaYF4:Yb,Tm@NaYF4 | AgNPs | LRET | H2O2 and glucose | 1.08 μM for H2O2 and 1.41 μM for glucose | 105 |
| NaYF4:Yb,Tm@PEI | AgNPs | LRET | Biothiols | — | 106 |
| NaYF4:Yb,Tm@PDA | AgNPs | LRET | CEA | 0.09 ng mL−1 | 133 |
| NaGdF4:Yb,Er@PEG-aptamer | Au@Ag@AuNPs | IFE | Sulfamethazine | 0.02 ng mL−1 | 134 |
| NaYF4:Yb,Er@PEI-DNA | AuNPs | FRET | HBV | 250 pM | 135 |
| NaYF4:Yb,Er@CTAB | AuNPs | FRET | Protamine and heparin | 6.7 ng mL−1 for protamine and 0.7 ng mL−1 for heparin | 136 |
| NaYF4:Yb,Ho@dSiO2-MB | AuNPs | FRET | Fumonisin B1 | 0.01 ng mL−1 | 137 |
| NaYF4:Yb,Ho@PAA-aptamer | AuNPs | FRET | Pb2+ and Hg2+ | 50 pM for Pb2+ and 150 pM for Hg2+ | 138 |
| NaYF4:Yb, Er@dSiO2-polypeptide | AuNPs | LRET | MMP-2 | 0.4 fg mL−1 | 103 |
| NaYF4:Yb,Er@CTAB | AuNPs | FRET | AChE and Cd2+ | 0.015 mU mL−1 for AChE and 0.2 mM for Cd2+ | 139 |
| NaYF4:Yb,Er@PAA-streptavidin | AuNPs | FRET | Trypsin | 4.15 ng mL−1 | 102 |
| NaYF4:Yb, Er@NaYF4-SDNA | AuNPs | FRET | Tumour-related ncRNA | ∼0.4 fM | 104 |
| NaYF4:Yb,Tm@dSiO2-aptamer | AuNPs | FRET | Hg2+ | 60 nM | 140 |
| NaYF4:Yb,Er,Gd@PAA | AuNPs | SPR | α-Fetoprotein | 0.095 ng mL−1 | 141 |
| NaYF4: Gd,Yb,Ho@dSiO2-aptamer | Fe3O4 MNPs and AuNPs | FRET | Pb2+ | 5 nM | 142 |
| NaYF4:Yb,Er/Tm@dSiO2-aptamer | Fe3O4 MNPs | MS | S. typhimurium and S. aureus | 5 cgu mL−1 for S. typhimurium and 8 cfu mL−1 for S. aureus | 143 |
| NaYF4:Yb,Er/Tm@dSiO2-antibody | Fe3O4 MNPs | MS | AFB1 and OTA | 0.01 ng mL−1 | 144 |
| NaYF4:Yb,Er@COPs | — | Spotlight effect | Foodborne bacteria | — | 145 |
| NaYF4:Yb,Tm@NaYF4:Ca@PEG-antibody | — | — | AIV | 103.5 EID50 per mL for HPAI H5N6 | 146 |
| NaYF4:Yb,Er/Tm@NaYF4@PEG-antibody | — | — | PSA and EphA2 biomarkers | 89 pg mL−1 for PSA and 400 pg mL−1 for EphA2 | 147 |
Despite the great number of applications, fluorescence intensities may be affected by factors such as light scattering by the sample matrix, excitation source fluctuation, microenvironment around probes and local concentration variation of probes, and thus these “turn-on/off” systems may have some limitations. In this way, the use of ratiometric fluorescence emerges as an alternative which enables the development of platforms with a wider sensing range and lower limit of detection.
3.2. Ratiometric fluorescence response
Ratiometric fluorescence is a method in which the intensities of two or more emissions at distinguishable wavelengths are measured to detect changes in the local environment and the ratio between these emissions is used. Since lanthanide-doped UCNPs exhibit a large variety of closely spaced electronic levels, it is relatively easy to construct ratiometric FL platforms employing them. Ratiometric fluorescence provides built-in self-calibration for the correction of various target-independent factors such as environmental influences and intrinsic fluorescence, and thus it has attracted particular attention for analytical sensing with improved sensitivity and accuracy.148,149There are two general categories for the fabrication of sensing systems based on ratiometric fluorescence, as schematically shown in Fig. 7. The first strategy, shown in Fig. 7A, is to use a target-responsive signal and introduce a second signal as a reference that is target insensitive, and this type of construction is known as ratiometric fluorescence with one reference signal (1RFS). The other approach is to apply two target-responsive signal changes that enable the achievement of dual-emission ratiometric FL, known as ratiometric fluorescence with two reversible signal changes (2RSC), as shown in Fig. 7B. Table 3 summarizes examples of UCNP-based sensors with ratiometric fluorescent response for detection and quantification of a wide range of analytes.
 | ||
| Fig. 7 Types of ratiometric fluorescent responses. (A) Ratiometric fluorescent response with one reference signal and (B) ratiometric fluorescent response with two reversible signal changes. | ||
| UCNP-based ratiometric sensors | |||||
|---|---|---|---|---|---|
| UCNPs | Additional probe | Effect | Analyte | Limit of detection | Ref. |
| a Abbreviations: FITC: fluorescein isothiocyanate; Zn(DZ)3: zinc–dithizone complex; CD: cyclodextrin; HA: hyaluronic acid; RhB: rhodamine B; ROS: reactive oxygen species; PAAO: poly acrylic acid-octylamine; DMC: dicyanomethylene-4H-pyran; OPD: o-phenylenediamine; ALP: alkaline phosphatase; DSPC: distearoylphosphatidylcholine; OPP: organophosphonate; TOPs: N-ethyl-N-(3-sulfopropyl)-3-methyl-aniline sodium salt, 4-AAP: 4-amino-antipyrine; PTZCy: phenothiazine cyanine; Cys: cysteine; TAMRA: carboxytetramethyl rhodamine; CRD: Cr3+-responsive rhodamine derivative; DD1: fluorescent probe 5(6)-carboxyfluorescein-O,O′-diacrylate; CEA: carcinoembryonic antigen; RhBD: rhodamine B derivative; hCy7: heptamethine cyanine dye, MMP: metalloproteinase. | |||||
| One reference signal | |||||
| NaYF4:Yb,Tm,Er@dSiO2 | Curcumin | IFE | F− | 5 μM | 150 |
| NaYF4:Yb,Tm@PEI | FITC | FRET | Intracellular pH | — | 151 |
| NaYF4:Yb,Er@P-PEG | Zn(DZ)3 | LRET | ClO− | 3 nM | 152 |
| NaYF4:Yb,Tm@α-CD | Ru complex | LRET | HClO | 16.6 μM (I450/I800) and 13.6 μM (I475/I800) | 153 |
| NaYF4:Yb,Er@NaGdF4@dSiO2 | Cy5-pep | FRET | Caspase-9 | 0.068 U mL−1 | 154 |
| NaFY4:Yb,Er@HA | RhB | LRET | ROS | 0.03 μM for ˙OH and 0.1 mM for O2− | 155 |
| NaYF4:Yb,Ho@γ-CD | RhB | FRET | Fe3+ | — | 156 |
| NaYF4:Yb,Nd,Er@NaYF4:Nd@PAAO | DCM-H2O2 | FRET | H2O2 | 0.168 μM | 157 |
| NaYF4:Yb,Ho@dSiO2 | Dithizone | IFE | Cd2+ and Pb2+ | 3.7 nM for Cd2+ and 8.4 nM for Pb2+ | 158 |
| NaYF4:Yb,Er,Tm,Zn@PEI | Ag+ and OPD | IFE | ALP | 18.3 nM | 159 |
| NaYF4:Yb,Er@DSPC | Azurin | IFE | Cu2+ | 2 μM | 160 |
| NaGdF4:Yb,Er@NaGdF4 | — | RET | RhB | 4 ppm | 161 |
| NaErF4:Ho@NaYF4-OA | Fe3+ and IR1061 | LRET | H2O2 | — | 162 |
| NaYF4:Yb,Tm@NaYF4@Tween 20-COOH | Rhodol | LRET | OPP nerve | 0.21 μM | 163 |
| NaGdF4@NaYF4:Yb,Tm@NaYF4@PAA | Hemicyanine | LRET | pH in living cells | — | 164 |
| NaYF4:Yb,Er,Tm@CTAB | TOPs, 4-AAP and H2O2 | IFE | Uric acid | 2.86 μM | 165 |
| NaYF4:Yb, Er@γ-CD | PTZCy | LRET | CN− | 0.84 μM | 166 |
| NaYF4:Yb,Tm@dSiO2 | Xylenol orange | LRET | Intracellular pH | — | 167 |
| NaYF4:Yb,Tm@NaYF4@mSiO2 | Ir complex | FRET | O2 | — | 168 |
| NaLuF4:Yb,Er,Tm@YSiO2 | ANP and Ir complex | LRET | Cys and CN− | 28.5 μM for Cys and 6.7 μM for CN− | 169 |
| NaYF4:Yb,Er/Tm@OA | TAMRA | LRET | Protease | 0.05 nM | 170 |
| NaYF4:Yb,Er@PAA@PAH | TAMRA | FRET | Lysozyme and DNA | 2.5 nM for lysozyme and 2.8 nM for DNA | 171 |
| NaYF4:Yb,Er@PAA and NaYF4:Yb,Tm@PEI | — | FRET | Explosives | — | 172 |
![[thin space (1/6-em)]](https://www.rsc.org/images/entities/char_2009.gif) |
|||||
| Two reversible signal changes | |||||
| LiYF4:Yb,Ho,Ce@LiYF4@mPEG | CRD | LRET | Cr3+ | 4.1 μM | 173 |
| NaYF4:Yb,Tm@NaYF4@mSiO2 | DD1 | IFE | Cys | 20 μM | 174 |
| NaYF4:Yb,Er@dSiO2 | FITC and RhBD | LRET | pH and Hg2+ | — | 175 |
| NaYF4:Yb,Tm@NaYF4@PAA | Zn2+-responsive molecule | FRET | Zn2+ | 0.78 μM | 176 |
| NaYF4:Yb,Tm@PEI-antibody | FITC | FRET | CEA | 0.89 ng mL−1 | 177 |
| NaYF4:Yb,Er@OA | RhBD | FRET | Cu2+ | — | 178 |
| NaYF4:Yb,Er,Tm@PEG | hCy7 | LRET | MeHg+ | 0.18 ppb | 179 |
| NaYF4:Yb/Er@NaYF4:Yb/Nd-peptide | QDs | FRET | MMP-2 | 32 pM | 180 |
| NaLuF4:Yb,Tm@OA | — | LRET | Sodium fluorescein | 0.14 μg mL−1 | 181 |
Li et al. reported the development of a ratiometric fluorescent sensor based on FRET for probing intracellular pH (pHi), using pH-sensitive fluorescein isothiocyanate (FITC) and NaYF4:Yb,Tm UCNPs, as shown in Fig. 8. Taking advantage of the spectral overlap between the absorption of FITC and the UC emission at 475 nm, UCNP-FITC probes were designed to realize self-ratiometric pH sensing. Upon 980 nm excitation, two UC emission bands appear at 475 nm and 645 nm, and thus the intensity at 475 nm, which is subject to FRET, was used as the response signal while the emission at 645 nm, inert to pH variation, was used as the reference signal. The UCNP lifetime value at 475 nm was measured to be 569.7 μs, while for FITC-UCNPs this value was shortened to 123.3 μs and the FRET efficiency was calculated to be 78.4%. In this way, a ratiometric measurement was realized by monitoring the intensity ratio (I475/I645) and, due to efficient energy transfer and fluorescence-free background, a highly sensitive and accurate sensing system has been produced, featuring 3.56 per unit change in pHi values between 3.0 and 7.0, with deviation lower than 0.43.151
 | ||
| Fig. 8 1RFS ratiometric platform for pHi sensing. (A) Schematic illustration of the UCNP-FITC nanoprobe. (B) Spectral overlap between the emission of UCNPs and the absorption of FITC in different buffer solutions with pH ranging from 3.0 to 8.0. (C) UC fluorescence emission of FITC-UCNPs with pH values ranging from 3.0 to 8.0 under 980 nm excitation. (D) The linear relationship between the ratio I475/645 and pH value. Modified with permission from ref. 151. Copyright 2016, Springer Nature. | ||
When it comes to IFE-based ratiometric fluorescent sensors, Liu et al. developed a 1RFS platform for the detection of fluoride ions using Yb3+, Er3+, and Tm3+ co-doped NaYF4 UCNPs, which emit at 546, 657, 758, and 812 nm under 980 nm excitation, and curcumin as the specific recognition element. In this system, schematically shown in Fig. 9A, the absorption peak of curcumin shows a bathochromic shift when F− is added, causing an UC fluorescence “turn-off” effect at 546 and 657 nm through the IFE, whereas the emissions at 758 and 812 nm remained unchanged. Thus, the fluorescence ratio I546/I758 was used for the quantification of F− and the obtained values were inversely proportional to the target concentration (Fig. 9B). Under optimized conditions, the developed UCNP–curcumin system achieved ratiometric fluorescence sensing toward F− in the linear range of 5–200 μM, with the detection limit as low as 5 μM.150
 | ||
| Fig. 9 UCNP–curcumin 1RFS sensor for F− detection. (A) Schematic illustration of the nanosystem’s response to F− showing photos and changes in ultraviolet absorbance and upconversion emission in their corresponding spectra. (B) UC fluorescence spectra of UCNP–curcumin after addition of different concentrations of F− (5–200 μM). (C) Emission intensity ratio (I550/I758) of UCNP–curcumin versus different concentrations of F− and the linear fits. Reprinted with permission from ref. 150. Copyright 2017, American Chemical Society. | ||
Guan et al. developed a nanosensor for the detection of cysteine (Cys), using mesoporous silica coated NaYF4:Yb,Tm UCNPs (UCNP@mSiO2) combined with the fluorescent dye 5(6)-carboxyfluorescein-O,O′-diacrylate (CFD), as shown in Fig. 10. After being treated with Cys, CFD is transformed into 5(6)-carboxyfluorescein (CF), which displays intense green fluorescence at 518 nm and absorbance overlapping with the blue UC emission of Tm3+ ions. As illustrated in Fig. 10B, the UC luminescence intensity at 475 nm is gradually decreased, while the emission intensity of CF at 518 nm increases with increasing Cys concentration. In this system, the silica shell is ∼20 nm thick, keeping the dye relatively far from the core UCNPs. Additionally, the authors observed that the luminescence decays at 475 nm (1G4 → 3H6) measured for unloaded UCNPs and for the nanosensing particles upon addition of Cys, are well fit by mono-exponential decay functions yielding lifetimes of 829 ms and 811 ms, respectively. There is only a slight difference between the two samples, suggesting that the dominant energy transfer mechanism should be the IFE rather than FRET. Using the intensity ratio between the 518 nm and 475 nm emissions (I518/I475), the concentration of Cys could be determined in the samples in an effective range from 20 to 200 mM, with a LOD of 20 mM.174
 | ||
| Fig. 10 2RSC platform developed for cysteine detection. (A) Schematic illustration of the nanosensor constructed using UCNP@mSiO2 combined with the dye 5(6)-carboxyfluorescein-O,O′-diacrylate. The nanosensor emission spectra before and after Cys addition are also shown. (B) Fluorescence spectra of the nanosensors upon addition of increasing concentrations of Cys (0–100 μM). Modified with permission from ref. 174. Copyright 2016, Elsevier B.V. | ||
Liu et al. constructed a 2RSC ratiometric sensor for methylmercury (MeHg+) detection using NaYF4:Yb,Er,Tm UCNPs as LRET donors and nanocarriers for the conjugation of heptamethine cyanine dye (hCy7) to form the hCy7-UCNP nanoprobes shown in Fig. 11A. hCy7 has an absorption peak around 670 nm that suffers a red shift to 845 nm upon the addition of MeHg+, due to its reaction with the thiosemicarbazide subunit to form hCy7′. In this way, in the presence of MeHg+, the Er3+ UC emission intensity at 660 nm suffers a significant increase accompanied by a decrease of Tm3+ emission intensity at 800 nm (Fig. 11B). The LRET efficiency was measured to be ∼90.0%, as deduced from the upconversion emission spectra of hCy7-UCNPs. Using the I660/I800 ratio as a detection signal, a good linear relationship was achieved in the quantification of MeHg+, with a LOD of 0.18 ppb (Fig. 11C). This value is lower than those obtained using I660/I540 (0.58 ppb) or I800nm/I540nm (0.25 ppb) ratios as output.179
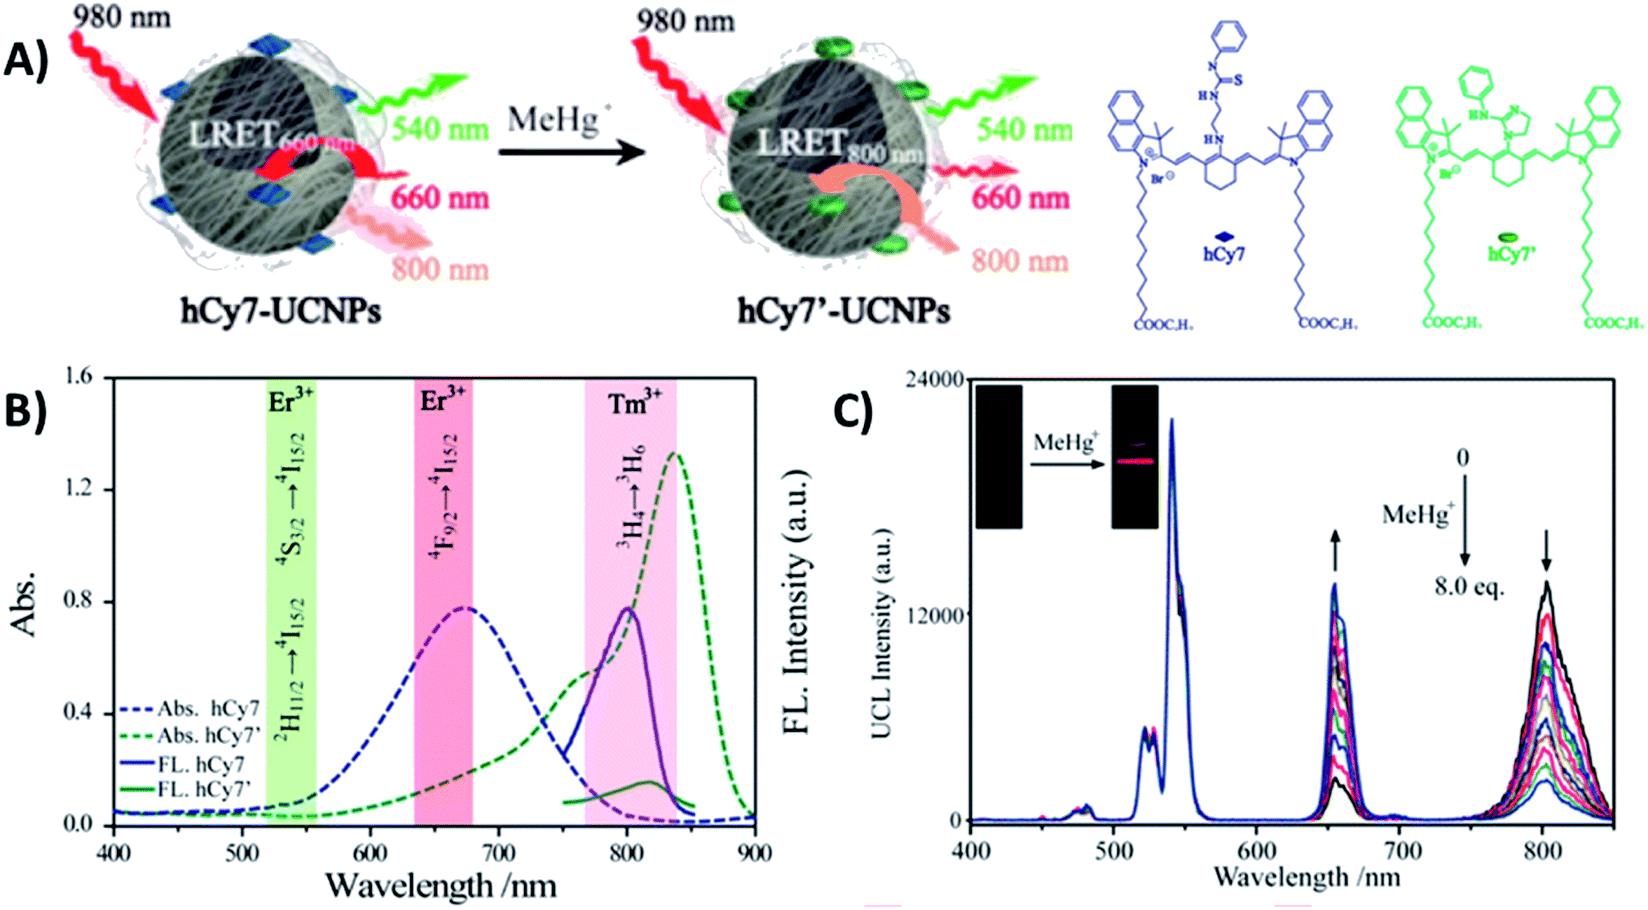 | ||
| Fig. 11 hCy7-UCNP sensor for the detection of MeHg+. (A) Schematic illustration of the nanoprobe and its sensing mechanism. (B) UV-vis absorption (dashes) and photoluminescence (solid) spectra of hCy7 in the absence and presence of MeHg+ and hCy7′ (λexc = 730 nm). The range of main UC emission bands of Er3+ and Tm3+ is also shown with different color. (C) UC fluorescence spectra of hCy7-UCNPs in aqueous solution upon gradual addition of MeHg+ (from 0 to 8 equiv.). The inset photos show changes in the red UC emissions. Modified with permission from ref. 179. Copyright 2013, American Chemical Society. | ||
From the previous examples it is possible to observe that the response type and the general characteristics of UCNP-based sensors are strongly determined by the probes chosen as energy acceptors and recognition elements, and by their specific interaction with the UCNPs. In the next section we carry out an in-depth exploration of the materials that are most usually integrated with UCNPs for the development of fluorescent sensing systems with enhanced sensitivity and selectivity.
4. Integration of UCNPS with various materials for sensing
In the construction of improved sensing systems, UCNPs have been combined with various materials, particularly phosphors and fluorophores, such as fluorescent dyes, carbon allotropes, and quantum dots, and also with noble metal nanoparticles (AuNPs and AgNPs), magnetic nanoparticles, and polymers. The construction of these sensing platforms requires UCNP post-synthesis procedures, and the typical routes are divided into (1) nanoparticle surface modification with shells and functional groups (e.g., amines and carboxylates) and (2) their integration with recognition elements and additional probes. In this section we present the most used strategies to combine UCNPs and different materials with unique properties, emphasizing the functionalization methods and the conjugation mechanisms.4.1. UCNP integration with dyes
Fluorescent dyes are normally polyaromatic or heterocyclic hydrocarbon molecules that exhibit small size, high fluorescence intensity, and easy chemical modification. The association between the properties of UCNPs and fluorescent dyes results in one of the most used IFE/FRET pairs and has enabled the development of several sensors.76,163 Some of these platforms are produced by simple mixture of UCNPs and a dye into the same system,62,78,116,117,178 while others require more elaborate reaction steps, as further discussed.Meng et al. reported the detection of Cu2+ and pyrophosphate (PPi) using UCNPs combined with the rhodamine B derivative RBP (UCNPs@mSiO2-RBP). The β-NaYF4:Yb,Er UCNPs were first covered with an inert layer of undoped NaYF4 matrix, which enhances the emission intensity and is produced by a thermal decomposition procedure similar to the synthetic route applied to produce the nanoparticles. Aiming towards the loading of RBP for detection of PPi in aqueous solution, the nanoparticles were further coated with a mesoporous silica (mSiO2) shell through a sol–gel reaction in which cetrimonium bromide (CTAB) was used as the surfactant and porogen agent to induce a mesoporous structure, and tetraethyl-orthosilicate (TEOS) was used as the silica precursor. The nanoprobe was finally formed by loading the RBP molecules onto the shell pores, as schematically shown in Fig. 12. In this “turn-on” system, the UCNPs@mSiO2-RBP’s green emission from Er3+ is significantly quenched upon the addition of Cu2+ owing to the strong absorbance of RBP-Cu2+ from 520 nm to 600 nm which triggers both FRET and IFE. Upon PPi addition, the fluorescence is gradually recovered due to its strong affinity for Cu2+, which leads to the formation of the Cu2+–PPi complex and results in the detachment of Cu2+ from the UCNPs@mSiO2-RBP probe. The produced sensor presented a wide linear response range (0–10 mM for Cu2+ and 5–35 mM for PPi) and high sensitivity (117 nM for Cu2+ and 70 nM for PPi).115 Rhodamine B derivatives were also applied in the construction of UCNP-based sensors for the detection of metal ions such as Cu2+,62,109,178,182 Hg2+,175 and in the sensing of nitric oxide,183 gluthatione,184 and caspase-3.107
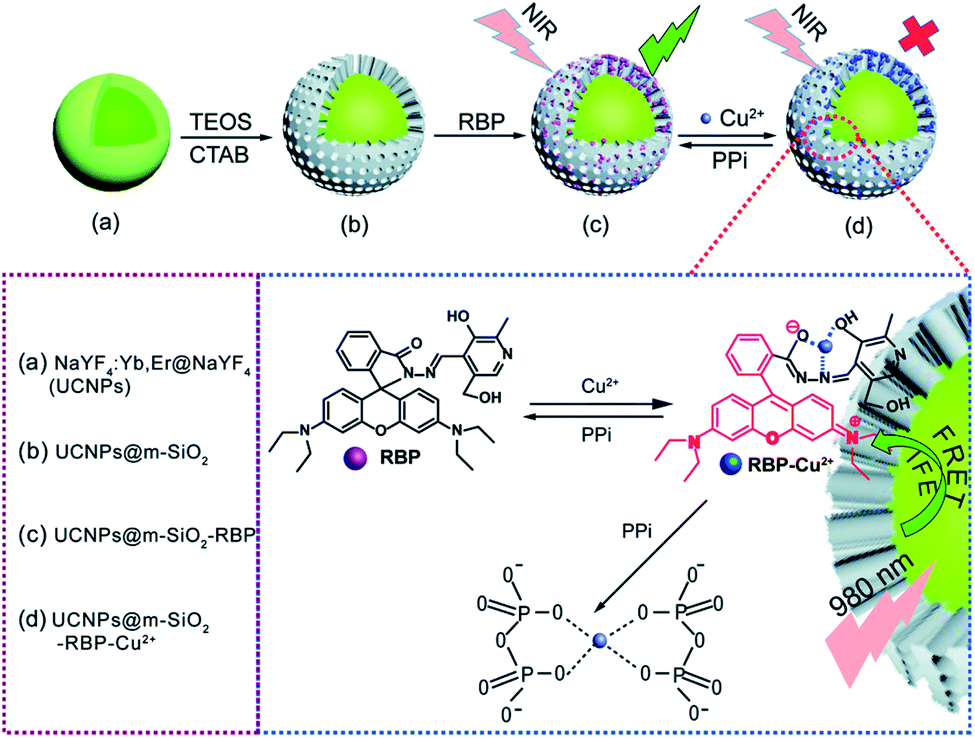 | ||
| Fig. 12 Schematic illustration of Cu2+ and PPi detection by UCNP@mSiO2-RBP. (a) Core–shell UCNPs, (b) UCNPs@mSiO2, (c) UCNPs@mSiO2 loaded with RBP to form the composite probe, and (d) the composite probe with Cu2+. Reprinted with permission from ref. 115. Copyright 2018, The Royal Society of Chemistry. | ||
UCNPs covered with a dense silica shell (dSiO2) also find many applications in the integration of UCNPs and dyes. Typically, there are two ways to coat dSiO2 onto UCNPs: one is via a reverse micelle nanoreactor used for UCNPs with hydrophobic capping ligands; the other is the Stöber method to coat UCNPs' surfaces that are already hydrophilic.185 Usually the silica precursors are chosen based on the desired functional groups in the NP surface. TEOS, the most used precursor, when used alone will promote the formation of a shell containing hydroxylic groups (–OH) on its surface. However, mixing TEOS with small amounts of (3-aminopropyl)triethoxysilane (APTES)167,186 or carboxyethyl-silanetriolis (CTES)154 can generate surfaces decorated with amine (–NH2) or carboxylic acid (–COOH) groups, respectively, which are usually used for the conjugation of dyes and other molecules via EDC/NHS coupling (1-ethyl-3-(3-dimethylaminopropyl) carbodiimide hydrochloride (EDC) and N-hydroxysulfosuccinimide sodium salt (NHS)).
Based on these strategies, Liu et al. developed a “turn-on” 1RFS detector for caspase-9 activity in vivo and in vitro through the conjugation of UNCP@dSiO2 with a cyanine Cy5 labeled peptide. The NaYF4:Yb,Er@NaGdF4 UCNPs were synthesized by a thermal decomposition method, covered using TEOS and CTES in a water-in-oil microemulsion method to produce UCNP@dSiO2-COOH, and the –COOH groups in the nanoparticles’ surface were conjugated to the amino-terminated Cy5-pep through an EDC/NHS coupling, as schematically shown in Fig. 13. The absorption band of Cy5 dye is centered at 650 nm, which overlaps with the red UC emission of UCNP@dSiO2 implying a FRET process and a decrease in the red emission, while the UCNP green emission at 540 nm is not affected. The addition of caspase-9 causes cleavage of Cy5-pep (LEHD fragment) and release of the dye resulting in red UC emission recovery, which is proportional to caspase-9 activity. The signal intensity ratio of red to green emission of UCNPs (termed R/G) was used to monitor the changes of caspase-9 activity levels in apoptotic cancerous cells (MG-63 and SW480) by cisplatin-induction.154
 | ||
| Fig. 13 Schematic representation of the synthesis steps and working principle of the UCNP-Cy5 sensing platform for the detection of caspase-9 activity both in vitro and in vivo. Reprinted with permission from ref. 154. Copyright 2019, Elsevier B.V. | ||
Carboxytetramethyl rhodamine (TAMRA), another rhodamine derivative, is also widely used in UCNP-based sensors, particularly in biosensing. The energy transfer pair UCNP-TAMRA, in combination with other probes, was applied in the sensing of human immunodeficiency viral DNA,74 methicillin-resistant Staphylococcus aureus (MRSA) DNA sequence,187 proteolytic activities of two matrix metalloproteinases (MMP-2 and MMP-7),119 and also in the detection of bisphenol A,118 and protease in vitro and in vivo.170 Using a TAMRA-labeled aptamer conjugated with UCNPs, Zhu et al. produced a sensor for the detection of lysozyme and DNA. NaYF4:Yb,Er nanoparticles were attached with the TAMRA-aptamer using poly(acrylic acid) (PAA) and poly(allylamine hydrochloride) (PAH) polymers as electrostatic linkers. As schematically shown in Fig. 14, hydrophobic UCNPs coated with oleic acid (OA-UCNPs) were first made hydrophilic through a ligand exchange reaction with PAA performed under acidic conditions. PAH was then loaded onto the UCNP-PAA for the formation of positively charged PAH-PAA-UCNPs (ppUCNPs) and the TAMRA labeled aptamer was further attached to the ppUCNPs through electrostatic interactions. In this 1RFS ratiometric FRET system, the TAMRA-aptamer absorption band overlaps well with the UC emission at 520 and 543 nm, causing its decrease, while the red emission at around 655 nm remains unchanged. Upon the addition of lysozyme or target DNA to the system, the TAMRA-aptamer is taken far away from the ppUCNPs and as a result, luminescence is restored. This sensor provided a linear concentration range from 30 to 210 nM for lysozyme and 40 to 200 nM for the target DNA, and the limit of detection was 2.5 nM and 2.8 nM, respectively.171
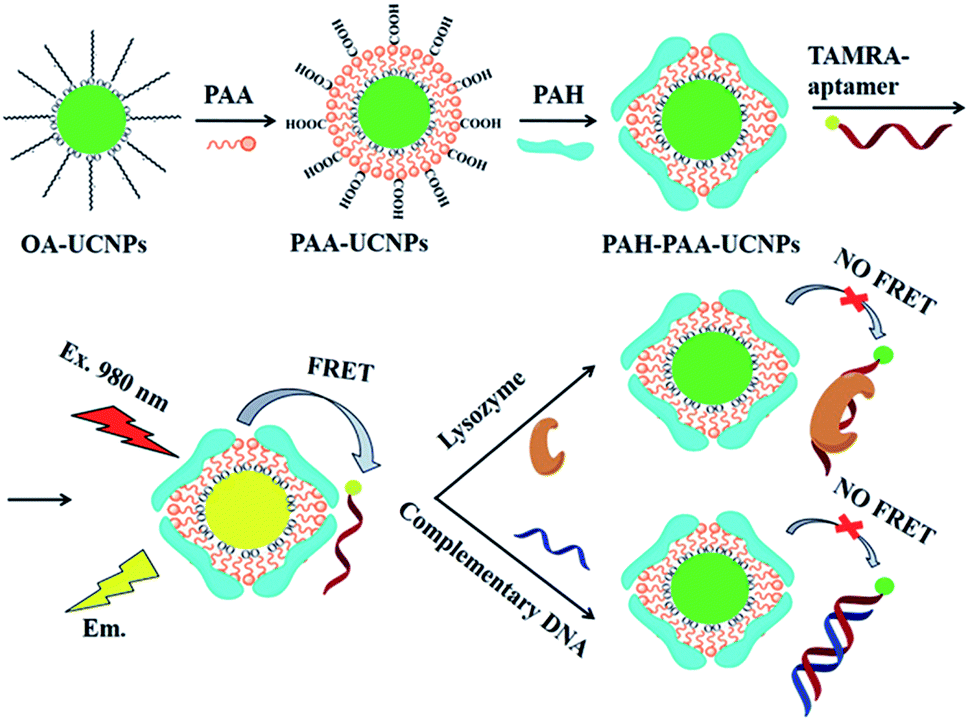 | ||
| Fig. 14 Schematic illustration of the synthesis steps and working principle of the 1RFS FRET biosensor for lysozyme and DNA detection based on ppUCNP-TAMRA nanoprobes. Reprinted with permission from ref. 171. Copyright 2015, The Royal Society of Chemistry. | ||
Polymer-coated UCNPs have also been applied in other sensing platforms, and generally the polymer is used to increase hydrophilicity and serve as a support to the loading of dyes. UCNPs-PAA-dye nanoprobes were applied in the sensing of H2S,113,122 Zn2+,176 H2O2,157 HOCl,152 and pH.164 UCNPs coated with polyethylene glycol (PEG) were conjugated with a Nile red derivative for intracellular detection of Fe3+,121 with 8-hydroxyquinoline-2-carboxylic acid (HQC) and rhodamine derivative (CRD) for Cu2+ (ref. 80) and Cr3+ (ref. 173) sensing, respectively, with black hole quencher 3 (BHQ3) for mycotoxin detection,64 and with cyanine for sensing glutathione.108
Another strategy to integrate dyes with UCNPs is based on the use of the cyclodextrine (CD) macromolecule. CD, which has been extensively used for phase transfer of nanoparticles in host–guest chemistry, is a cyclic oligosaccharide with a doughnut-shaped structure exhibiting a hydrophilic outer surface and a lipophilic cavity that can be used as a host for poorly water-soluble molecules.188 Ding et al. presented a novel sensing platform, using oleic acid covered NaYF4:Yb,Ho modified with γ-CD (CD-UCNPs) as carriers of RBD, for the detection of Fe3+ in aqueous solution. Owing to its hydrophobic interaction and suitable size, CD acts as the vital nexus between OA and RBD, and can protect the fluorescent probe by preventing photobleaching and photodegradation. The produced 1RFS response system is schematically shown in Fig. 15. Upon Fe3+ addition, the UC emission band at 542 nm overlaps with the absorbance of RBD-Fe3+, which enables a FRET process to partially quench the green emission of UCNPs, while the red signal at around 646 nm is unaffected and is used as the reference. The addition of Na2S to the system causes recovery of green emission as a result of a chemical reaction between Fe3+ and S2− which causes the reduction of Fe3+.The relative fluorescence quenching increased linearly with the concentration of Fe3+ in the range of 5 to 400 mM with a LOD of 1.2 mM.156
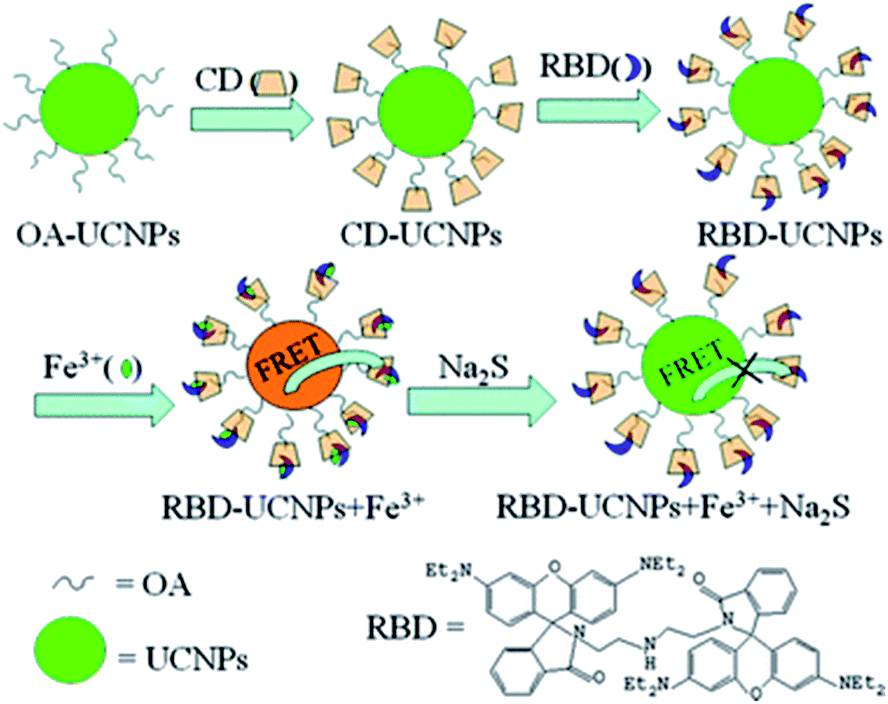 | ||
| Fig. 15 Schematic illustration of the synthesis of the RBD-UCNPs, their “turn-off” 1RFS response to Fe3+, and further addition of Na2S for emission recovery. Reprinted with permission from ref. 156. Copyright 2013, The Royal Society of Chemistry. | ||
Other UCNP-based sensors were constructed through the assembly of UCNP-CD and fluorescent dyes such as resorufin propionate (RePr) for sensing hydrazine in environmental samples,63 phenothiazine-cyanine (PTZCy) for cyanide detection in water samples166 and rhodamine derivatives for detection of cysteine73 and nitric oxide.183
4.2. UCNP integration with noble metal nanostructures
Gold nanoparticles exhibit unique optical, electrical, and catalytic features, including high fluorescence quenching efficiency, stable optical properties, and ease of labelling when compared to conventional quenchers.189 The combination of AuNPs and UCNPs is usually realized through bioconjugation using specific biomolecules or through electrostatic interactions between surface charged nanoparticles.83,139 Citrate-stabilized negatively charged AuNPs (−15.6 mV) were adsorbed to CTAB-stabilized NaYF4, Yb,Er UCNPs with a positive surface charge (+15.7 mV) via electrostatic interactions by the group of Long.136 The system was constructed for the detection of protamine and heparin, presents a “turn-on/off” response, and works through FRET due to the AuNPs’ characteristic surface plasmon resonance (SPR) peak at 526 nm which matches the green UC emission. When protamine is brought into contact with UCNPs–AuNPs, the AuNPs interact with it, desorbing from the surface of the UCNPs and aggregating, which results in the recovery of UCNP emission, as shown in Fig. 16A and C. Upon the addition of both protamine and heparin, with mutual interaction being stronger than that with the NPs, the AuNPs can re-adsorb on the UCNPs and the UC emission is quenched again (Fig. 16B and D). The linear response range was obtained over the concentration ranges of 0.02 to 1.2 μg mL−1 and 0.002 to 2.0 μg mL−1 with low detection limits of 6.7 and 0.7 ng mL−1 for protamine and heparin, respectively. | ||
| Fig. 16 Schematic illustration of the UCNP–AuNP fluorescence assay for the detection of protamine and heparin: (A) upon protamine addition and (B) upon protamine and heparin addition. UC emission spectra of (C) UCNP–AuNP mixture in the presence of different concentrations of protamine and (D) UCNP–AuNP/protamine mixed solution with various concentrations of heparin. Reprinted with permission from ref. 136. Copyright 2015, Elsevier Inc. | ||
Wu et al. developed a multifunctional nanoplatform for the detection of biomolecules and enzyme activity based on FRET between NaYF4:Yb,Er UCNPs and target-induced enlarged AuNPs. As schematically shown in Fig. 17, poly(vinylpyrrolidone) (PVP) is used as a mild reductant and capping agent for the formation of Au seeds from HAuCl4. The Au seeds and UCNPs are mixed and bound through electrostatic interactions and in the presence of some stronger reductants such as H2O2, ascorbic acid, and dopamine, the PVP-Au seeds (<6 nm) are enlarged forming AuNPs of about 20 nm and with the appearance of an absorption band at around 525 nm, which matches the green UCNP emission and leads to quenching. Based on this strategy, a multifunctional “turn-off” sensor was constructed which showed potential for detection of some life-related reductive molecules, enzyme substrates, and enzyme activity.190
 | ||
| Fig. 17 Schematic illustration of the construction and sensing principle of the multifunctional nanoplatform based on UCNPs and enlarged AuNPs for the detection of biomolecules. Reprinted with permission from ref. 190. Copyright 2017, American Chemical Society. | ||
The most used strategy to integrate UCNPs and AuNPs is through hybridization of biomolecules such as DNA, aptamers, and antibodies, which are conjugated to the nanoparticles’ surface. For example, Jin et al. developed a FRET aptasensor for bacteria detection using AuNPs conjugated with aptamers and UCNPs functionalized with the corresponding complementary DNA (cDNA). The aptamers were added to the AuNPs’ surface through Au–S chemistry and amino modified cDNAs were attached to carboxyl-functionalized UCNPs via a condensation reaction. UCNPs–cDNA hybridized with AuNPs–aptamers originated a FRET pair and consequently, green UC emission quenching. Upon bacteria addition, the aptamers preferentially bind to the target microorganisms to form a 3D stem–loop structure and cause the dissociation of UCNPs and AuNPs followed by fluorescence recovery. The “turn-on” platform, schematically shown in Fig. 18, successfully detected Escherichia coli ATCC 8739 (as a model analyte) with a detection range of 5–106 cfu mL−1 and detection limit of 3 cfu mL−1.191
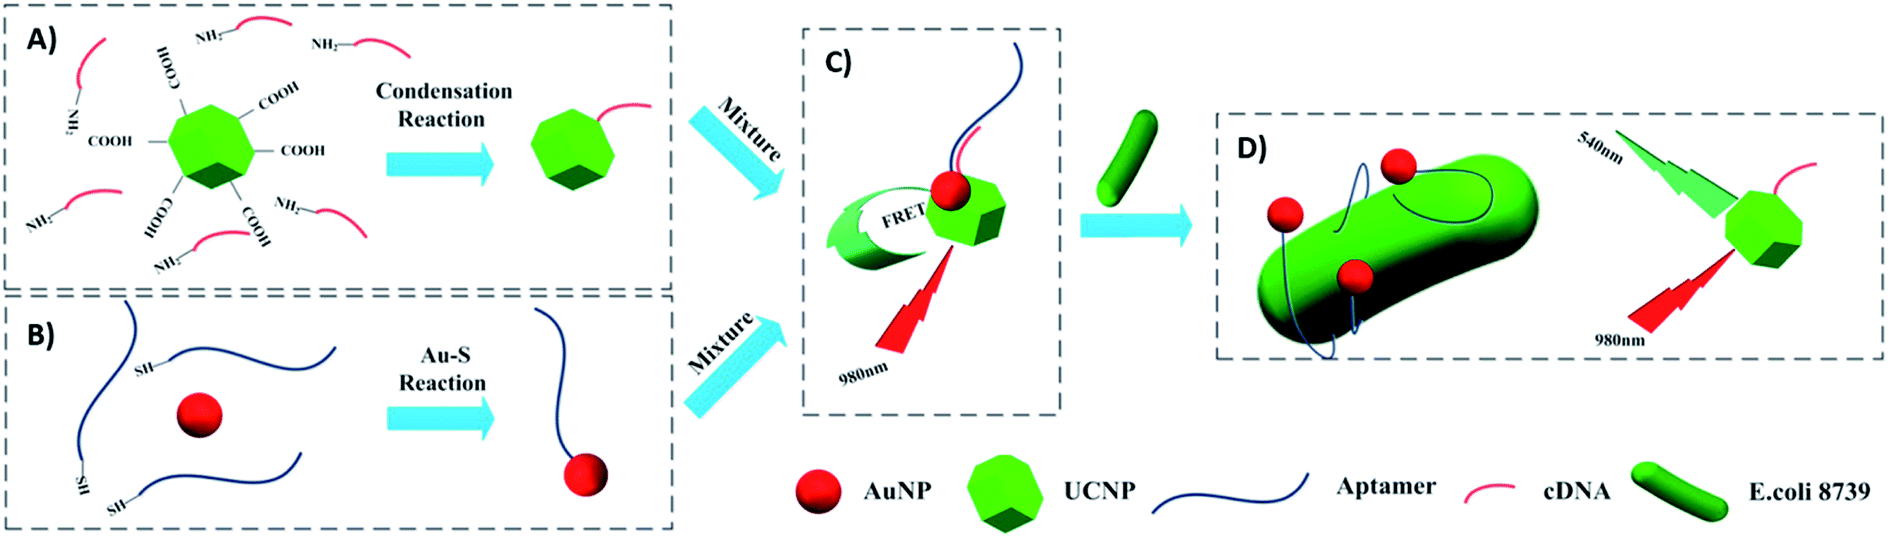 | ||
| Fig. 18 Schematic illustration of the UCNP–AuNP FRET aptasensor for bacteria detection. (A) Attachment of amino-modified cDNA to the carboxyl-functionalized UCNPs followed by (B) conjugation of thiol-modified aptamers to the AuNPs. (C) FRET pair formation: UCNPs–cDNA hybridized with AuNPs–aptamers. (D) Introduction of target bacteria leads to aptamers preferentially binding to the bacteria and results in green fluorescence recovery. Modified with permission from ref. 191. Copyright 2016, Elsevier B.V. | ||
Sensing systems constructed with the FRET pair UCNP–AuNPs and based on biomolecule hybridization have also been reported for the detection of metalloproteinase-2 (MMP2),103 influenza H7 virus,59,192 trypsin,102 sulfamethazine,134 Hg2+ (ref. 140) and Pb2+,138 cancer biomarkers,193 streptavidin,194 fumonisin B1,137 and for noncoding RNA (ncRNA) sensing,104 among other analytes. For the detection of hepatitis B virus (HBV), Zhu et al. developed a “turn-on” biosensor using two single-stranded DNA strands, which were partially complementary to each other, and conjugated them with amino-functionalized UCNPs and AuNPs. When the nanoparticles are mixed, the hybridization between complementary DNA sequences on UCNPs and AuNPs leads to quenching of UC luminescence. As schematically shown in Fig. 19A, upon addition of target DNA, AuNPs leave the surface of the UCNPs and fluorescence can be restored due to the formation of a more stable double-stranded DNA on the UCNPs. The increase in relative fluorescence intensity is linear with the increase of concentration of target DNA ranging from 0 to 50 nM and the LOD for HBV DNA was as low as 250 pM.135
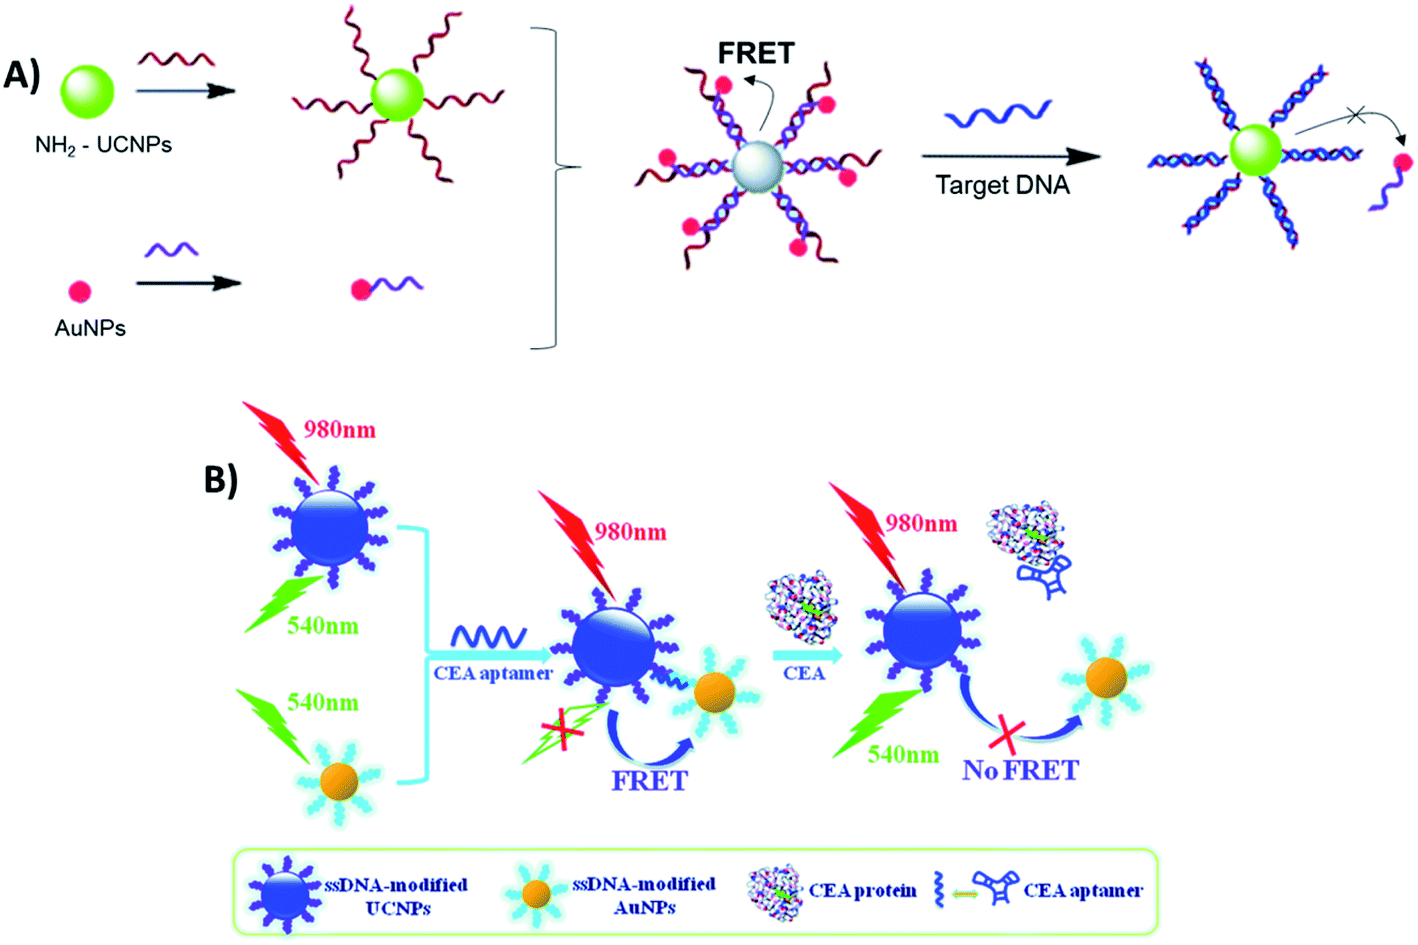 | ||
| Fig. 19 Schematic illustration of “turn-on” sensors based on the FRET pair UCNP–AuNPs and biomolecule hybridization. (A) Biosensor for HBV DNA detection. Modified with permission from ref. 135. Copyright 2015, The Royal Society of Chemistry. (B) Biosensor for CEA detection. Modified with permission from ref. 195. Copyright 2015, The Royal Society of Chemistry. | ||
Similarly, Li et al. fabricated a carcinoembryonic antigen (CEA) sensor based on aptamer bridged FRET from UCNPs to AuNPs, as schematically shown in Fig. 19B. The single-stranded DNA modified UCNPs and AuNPs were linked together by the CEA aptamer, which leads to UC quenching. However, the presence of CEA splits the above AuNP–aptamer–UCNP sandwich complex, resulting in emission recovery of UCNPs. The recovery of fluorescence intensity is linearly correlated to the concentration of CEA in the range of 0.05–2.0 ng mL−1, with a LOD of 0.02 ng mL−1.195
Gold nanorods (AuNRS) are also widely used in UCNP-based sensors, particularly when energy acceptors of longer wavelength are required. Due to their longitudinal plasmon absorption, the AuNR absorption bands can be modulated through the rods’ aspect ratio to perfectly match the UCNP emissions. Using aptamers, Chen et al. conjugated Er-doped UCNPs with AuNRs (17 nm width and 43 nm length – aspect ratio of 2.5) for thrombin sensing. The synthetized AuNRs have two resonance absorption bands at 514 and 666 nm, which overlap with the Er3+ emissions, resulting in FRET. The linear response of the sensor ranges from 2.5 to 90 nM with a LOD of 1.5 nM.81 In similar systems, NaYF4:Yb,Er nanoparticles were combined with AuNRs with mean aspect ratios of 2.2 and 4 for detection of cytosine methylation in DNA at a concentration as low as 7 pM (ref. 196) and for sensing of staphylococcal enterotoxin B (LOD of 0.9 pg mL−1),197 respectively.
Additionally, the synergistic effect between UCNPs and Ag nanoparticles has also been explored, particularly in biosensing. In the platform developed by Si et al. for the detection of cysteine, AgNPs and UCNPs were linked through electrostatic interactions. PEI-modified NaYF4:Yb,Tm UCNPs, synthesized through a one-step hydrothermal method, display positive surface charges, while L-ascorbic acid stabilized AgNPs have a negatively charged layer on their surface. The blue emission of the UCNPs located at 478 nm has a good overlap with the absorption spectrum of AgNPs, allowing LRET to occur. In this “turn-on” system, the addition of cysteine leads to aggregation of the AgNPs, increasing the distance between them and the UCNPs, which inhibits the LRET process and causes UC emission recovery, as schematically shown in Fig. 20A.106 The relationship between the luminescence intensity and the concentration of cysteine was linear in the range from 50 to 2000 mM. The UCNP–AgNP conjugated pair was also used for ovarian cancer marker detection198 and for sensitive quantification of alkaline phosphatase activity,132 achieving LODs of 120 pg mL−1 and 0.035 mU mL−1, respectively. Wu et al. integrated bare NaYF4:Yb,Tm@NaYF4 particles with DNA-templated AgNPs for the detection of H2O2 and glucose. As schematically shown in Fig. 20B, DNA-AgNPs can be directly assembled onto the surface of UCNPs leading to the formation of DNA-AgNPs/UCNP nanocomposites and resulting in luminescence quenching through LRET. Upon H2O2 addition, the AgNPs can be etched and transformed into Ag+, triggering the inhibition of the energy transfer process and recovery of fluorescence emission. Based on the conversion of glucose into H2O2 by glucose oxidase, the produced DNA-AgNPs/UCNP nanocomposite can also be used for glucose sensing.105
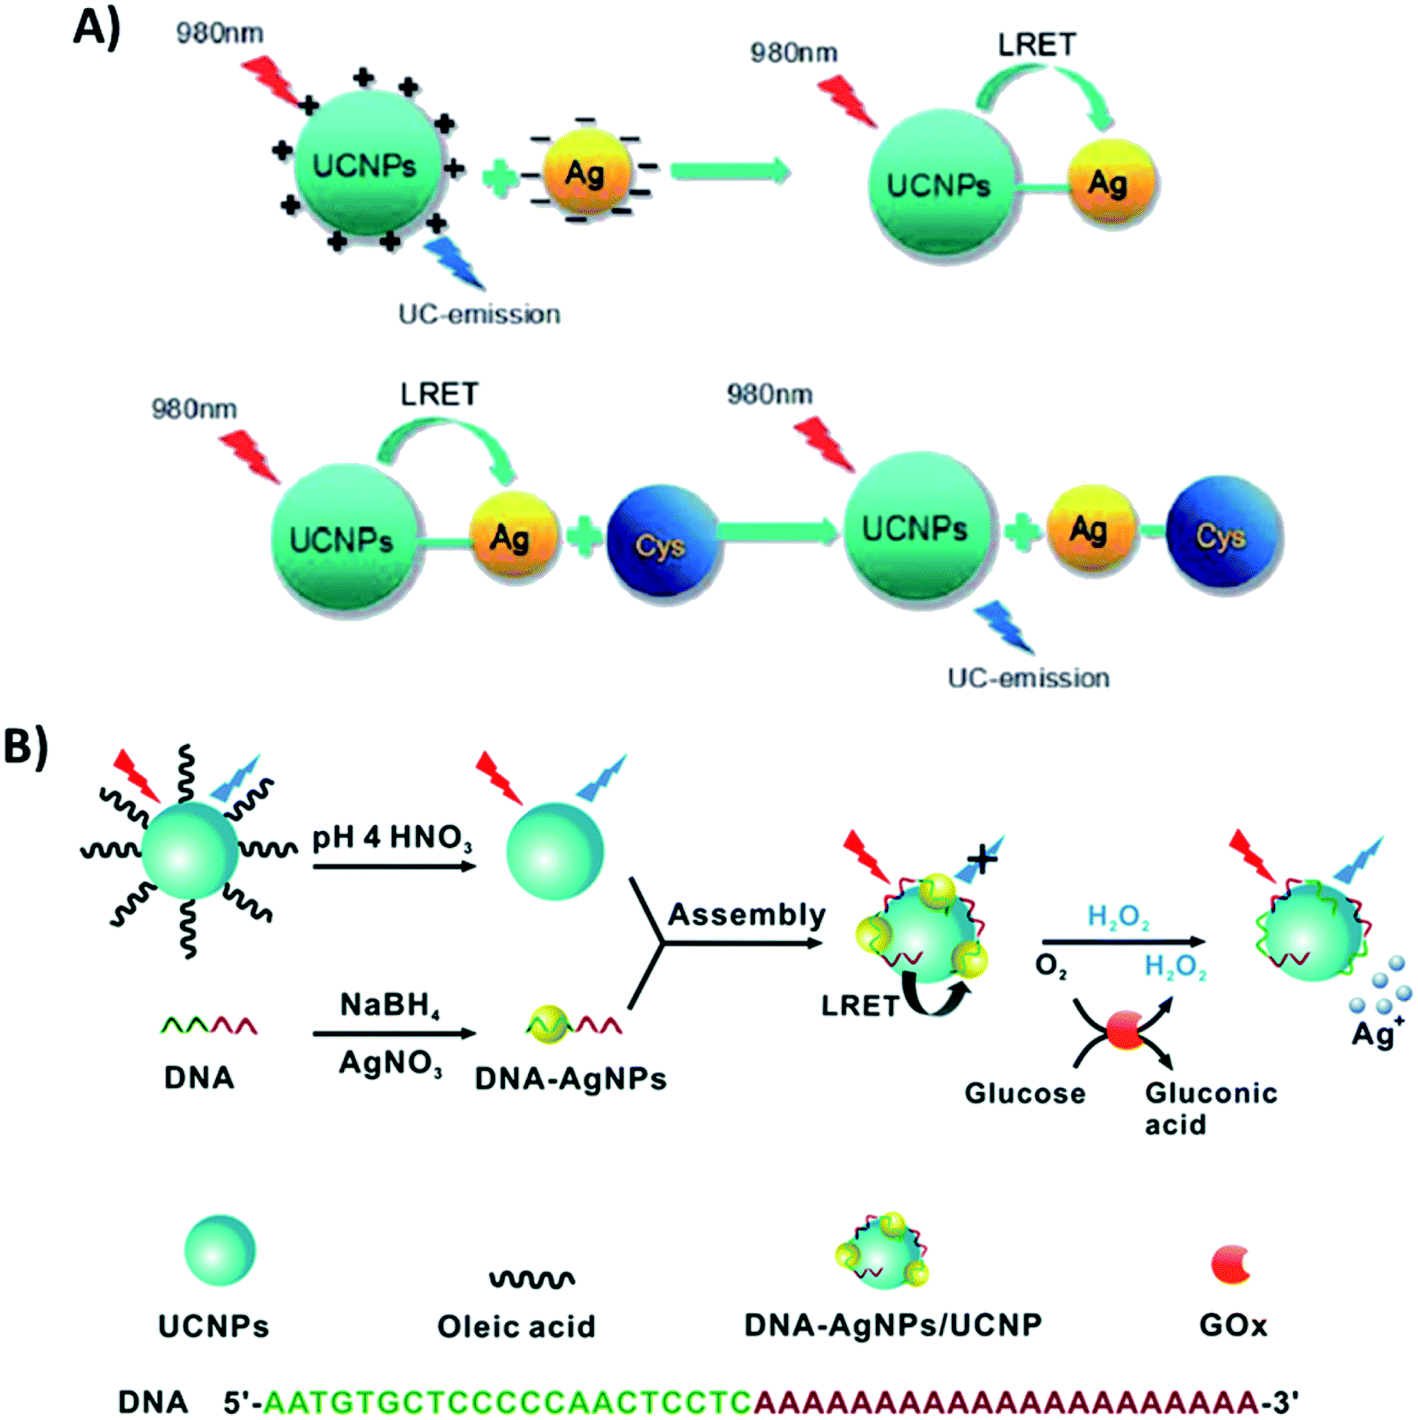 | ||
| Fig. 20 “Turn-on” sensors based on the integration of UCNPs with AgNPs. (A) Schematic representation of the UCNP–AgNP nanoprobe for cysteine detection. Reprinted with permission from ref. 106. Copyright 2016, The Royal Society of Chemistry. (B) Schematic illustration of the construction of the DNA-AgNPs/UCNP hybrid nanocomposite for sensing H2O2 and glucose. Reprinted with permission from ref. 105. Copyright 2016, The Royal Society of Chemistry. | ||
4.3. UCNP integration with carbon allotropes
Carbon-based nanomaterials such as carbon nanoparticles, carbon nanotubes (CNTs), and graphene have gained great attention and have been used for a broad range of applications due to their unique combination of properties such as high thermal conductivity, high mechanical strength, excellent electronic transport properties, and high surface area.199,200 The integration of UCNPs with carbon allotropes has been used for the development of various sensing systems,129,201 particularly due to the capacity of the sp2 carbon atoms to bond with single stranded oligonucleotides (ssDNA or ssRNA) through π–π interactions, making it relatively easy to program the assembly of certain carbon derivatives on the surface of ssDNA- or ssRNA-functionalized UCNPs, where they can act as energy acceptors.Graphene oxide (GO) stands out as the most used carbon allotrope in combination with UCNPs to produce biosensors. Wu et al. reported a “turn-on” FRET platform for the detection of human immunodeficiency virus (HIV) antibodies using GO combined with peptide-functionalized UCNPs (NaYF4:Yb,Er). The authors developed a facile one-step approach to prepare water-dispersible and peptide-functionalized UCNPs through the self-assembly of phospholipid–peptide conjugates onto the hydrophobic OA-UCNP surface. The UCNP emission bands at 540 and 650 nm overlap with the absorption spectrum of GO, as shown in Fig. 21A. In the absence of HIV antibodies, FRET occurs and the UC emission is quenched; on the other hand, specific interaction between the antigenic peptides and target antibodies leads to a decrease of UCNP adsorption on the GO surface and emission enhancement, as schematically shown in Fig. 21B. The detection limit of the sensors was calculated to be 2 nM.202
 | ||
| Fig. 21 UCNP-GO FRET sensor for HIV antibody detection. (A) UC fluorescence spectra of peptide-functionalized UCNPs and the absorption spectrum of GO (blue curve). (B) Schematic illustration of the upconversion FRET-based biosensor for the detection of anti-HIV-1 gp120 antibodies. Modified with permission from ref. 202. Copyright 2014, The Royal Society of Chemistry. | ||
Cristobal et al. functionalized NaYF4:Yb,Er@SiO2 UCNPs with single strands of DNA and combined them with GO for the detection of DNA in the limit of 5 pM. A schematic illustration of the chemical route used for UCNP functionalization is shown in Fig. 22A. The first step was the silanization of the nanoparticles, followed by surface modification with amino groups using APTES. The –NH2 groups act as nucleophiles for the reaction with succinic anhydride, which results in carboxylic acid functionalized UCNPs. The final experimental step was the EDC coupling reaction between the amino-modified ssDNA sequence and the carboxylic acid in the nanoparticle surface. In the absence of cDNA, the ssDNA coated UCNPs adsorb on the surface of the GO, and their fluorescence is quenched. In this “turn-on” FRET system, when the cDNA is added, the UCNPs are not able to physisorb onto the GO template, and thus their emission remains unquenched, as schematically shown in Fig. 22B.130 Based on very similar strategies, Er and Tm-doped UCNPs have been combined with GO for biosensing Alzheimer's disease and prostate cancer biomarkers,100 detection of dopamine released from stem cell derived dopaminergic-neurons,203 clenbuterol,204 carcinoembryonic antigen (CEA),205 endonuclease,99 topoisomerases in cell extracts,84 glycoprotein,206 metalloproteinase-9 in living cells,131 and also for sensing nutritional deficiencies in crops.101
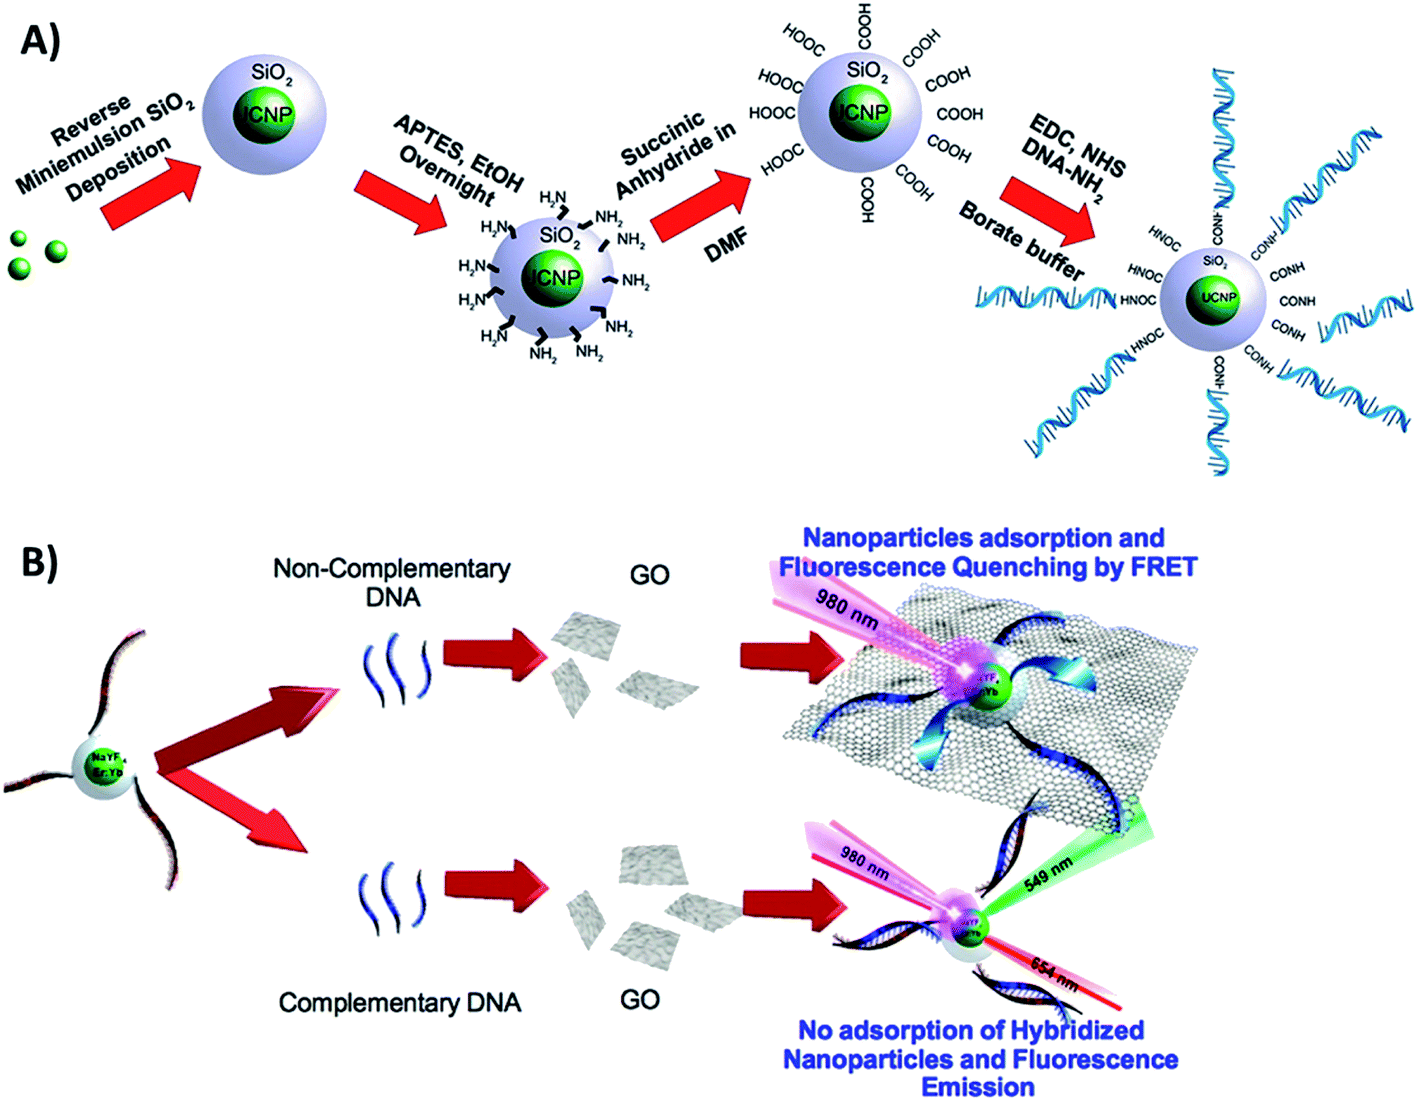 | ||
| Fig. 22 Schematic illustration of the UCNP-GO “turn-on” sensor developed for DNA detection. (A) Chemical route for the functionalization of UCNPs@SiO2 with amino-modified ssDNA. (B) Sensor working principle. Reprinted with permission from ref. 130. Copyright 2015, American Chemical Society. | ||
Similar to graphene, graphene quantum dots (GQDs) also have a lot of carboxyl groups and hydroxyl groups at the edges, giving them excellent water solubility and suitability for subsequent functionalization. More importantly, compared with two-dimensional graphene oxide, GQDs are smaller, and therefore single stranded oligonucleotides can be more strongly attached to their surface. He and coworkers produced a “turn-on” nanoplatform for sensing Ag+ ions based on LRET between cytosine (C) functionalized UCNPs (NaYF4:Yb,Er) and GQDs. In the absence of Ag+, the nanoparticles connect to each other and an effective quenching of the UC luminescence is observed. It is known that Ag+ could specifically bind to two cytosine (C) mismatches in DNA to form stable C–Ag+–C complexes, so upon Ag+ addition, the ssDNA changes from a random coil to a hairpin, resulting in the separation of GQDs from the UCNP surface and consequent emission enhancement. The nanosensor presents a linear concentration range response from 2 × 10⁻⁴ to 1 μM and a LOD as low as 60 pM.110
Exploring the interaction between GQDs and DNA nucleobases anchored on UCNPs (ssDNA-NaYF4:Yb,Er@SiO2), Laurenti et al. developed a sensor for the detection of specific microRNA (miRNA) sequences with a LOD of 10 fM. Different from the previous example, in this “turn-off” system, the presence of a great number of ultra-small GQDs (4.3 nm) in close proximity to the UCNPs leads to luminescence enhancement because they act as antennas, harvesting NIR photons more efficiently than the sensitizer ions of the UCNPs and transferring quanta to the Ln3+. The GQDs display absorption bands at 200 nm, 410 nm, and a broad one from 800 to 1150 nm; the proposed energy-transfer mechanism is shown in Fig. 23A. In the absence of complementary miRNA sequences, the ssDNA-functionalized UCNPs interact with the GQDs, and fluorescence enhancement is observed. In the presence of target miRNA sequences, the hybridization process yields a double-stranded DNA (dsDNA) on the surface of the UCNPs, which hinders interaction with the GQDs and reduces the UC emission, as schematically shown in Fig. 23B.70
 | ||
| Fig. 23 UCNP-GQD sensor for miRNA detection. (A) Proposed energy-transfer mechanism between the GQDs and UCNPs. (B) Schematic representation of the sensor response in the presence or absence of complementary oligonucleotides. Reprinted with permission from ref. 70. Copyright 2015, American Chemical Society. | ||
Carbon nanoparticles (CNPs) have also been used in UCNP-based sensors. Jiang et al. used CNPs, with diameters ranging from 30 to 50 nm, as energy acceptors in a “turn-on” FRET aptasensor for immunoglobulin E (IgE) detection. The NaYF4:Yb,Er UCNPs were functionalized with an amino modified IgE aptamer via EDC/NHS linking. The response signal was modulated by the high-affinity recognition of IgE with its aptamer decorated on the surface of Er-doped UCNPs. In the absence of IgE, the UCNP–aptamer interacts with CNPs through π–π stacking interaction, which leads to emission quenching due to the absorbance band of CNPs between 200 and 700 nm. In the presence of IgE, the aptamer recognizes it and forms an aptamer/IgE complex accompanied by conformational change, which enlarges the distance between UCNPs and CNPs, blocking the energy transfer and causing UC emission recovery. This aptasensor can be used to detect IgE concentrations in the range of 0.5–80 ng mL−1.128
4.4. UCNP integration with quantum dots
Quantum dots are nanocrystalline semiconductor materials with distinct characteristics of high brightness, large molar extinction coefficients, high quantum yield, good photostability and long fluorescence lifetime. QDs of different sizes can be excited to emit different fluorescence colors owing to the effects of quantum confinement. Due to their versatile properties, QDs have been combined with UCNPs for the construction of several sensing systems.207,208 UCNPs and QDs can be linked via bioconjugation as in the system reported by Chan et al. where they used NaYF4:Yb/Er UCNPs and InP QDs for metalloproteinase-2 sensing with a LOD of 32 pM,180 and as in the platform developed by Doughan et al. for the detection of unlabeled nucleic acid targets with a limit of detection as low as 13 fM.209In the meantime, the most used strategy to integrate UCNPs and QDs is through electrostatic interactions, such as in the biosensor developed by Xu et al. for sensitive detection of lead ions in human serum. In this “turn-off” system, NaYF4:Yb/Tm UCNPs were used as energy donors and CdSe QDs were used as energy acceptors in a FRET pair. The combination between PEI-modified UCNPs and thioglycolic acid (TGA)-capped QDs, which have positively and negatively charged surfaces, respectively, results in strong interaction between the nanoparticles. The QD absorption band is centered around 504 nm and partly overlaps with the 457 nm and 484 nm emissions of Tm3+ ions. The energy transfer between the particles results in weakening of the UCNP emission and the consequent QD emission at 550 nm, as observed in the spectrum shown in Fig. 24A. The TGA capping layer is crucial to secure the QD luminescence efficiency and water stability, and additionally, it works as the recognition element. Upon Pb2+ addition, the TGA capping is preferentially displaced from the surface of the QDs due to its binding to Pb2+ ions. The detachment of the TGA capping consequently creates imperfections on the QD surface resulting in the cessation of energy transfer and QD fluorescence quenching, as schematically shown in Fig. 24B. The strategy of using the UCNP-QD FRET pair overcomes the self-luminescence from serum excitation with visible light. Based on the QDs’ emission decrease (F0/F), the produced sensor achieved a good linear relationship and a low detection limit of 80 nM.210 Also using UCNPs (Er-doped) conjugated to QDs via electrostatic interactions, Cui et al.228 and Sai et al.211 constructed “turn-off” sensing systems for the detection of mercury ions with LODs of 15 nM and 70.5 nM, respectively.
 | ||
| Fig. 24 UCNP-QD “turn-off” sensor for Pb2+ detection. (A) Emission (blue line) spectrum of NaYF4:Yb,Tm UCNPs; absorption (red dashed line) and emission (green solid line) spectra of CdTe QDs. (B) Principle of upconversion lead-ion FRET detection by employing UCNPs as donors and QDs as acceptors. Reprinted with permission from ref. 210. Copyright 2014, The Royal Society of Chemistry. | ||
4.5. UCNP integration with magnetic nanoparticles
Magnetic nanoparticles (MNPs) are a class of nanomaterials consisting of magnetic elements, such as iron, nickel, cobalt, chromium, and their chemical compounds. MNPs are superparamagnetic because of their nanoscale size, offering great potential in a variety of applications.212,213 UCNPs and MNPs have been combined for the development of sensors based on magnetic separation and, differently from the previously discussed platforms, no energy transfer takes place between the nanomaterials.Generally, MNPs and UCNPs are integrated via hybridization of biomolecules on their surface, as in the system developed by Wu et al. for detecting the mycotoxin zearalenone (ZEN) in food samples. In this “turn-off” assay, NaYF4:Yb,Er UCNPs were conjugated with the complementary oligonucleotide of the ZEN aptamer for use as signal probes, while the Fe3O4 MNPs immobilized with the ZEN aptamer were assigned as capture probes. As schematically shown in Fig. 25, the aptamer–MNPs and cDNA–UCNPs were mixed to form a duplex structure; however, upon ZEN addition, the ZEN aptamer dissociates from its complementary DNA and preferentially binds to the target. After the complete chemical reaction, the products were isolated by magnetic separation and a decrease in the UC emission intensity followed. As it can be seen in the spectrum in Fig. 25, the fluorescence intensities gradually increase with increasing addition of the target molecules. The produced sensor presented LODs of 0.007 μg L−1 for detecting ZEN in beer and 0.126 μg kg−1 for corn.68 Based on similar strategies, UCNP-MNP “turn-off” platforms have been constructed for simultaneously sensing multi-toxins,86 and for the detection of aflatoxin B1,66 enrofloxacin,67 T2-toxin,69 sulfaquinoxaline,87 and tetracycline.85
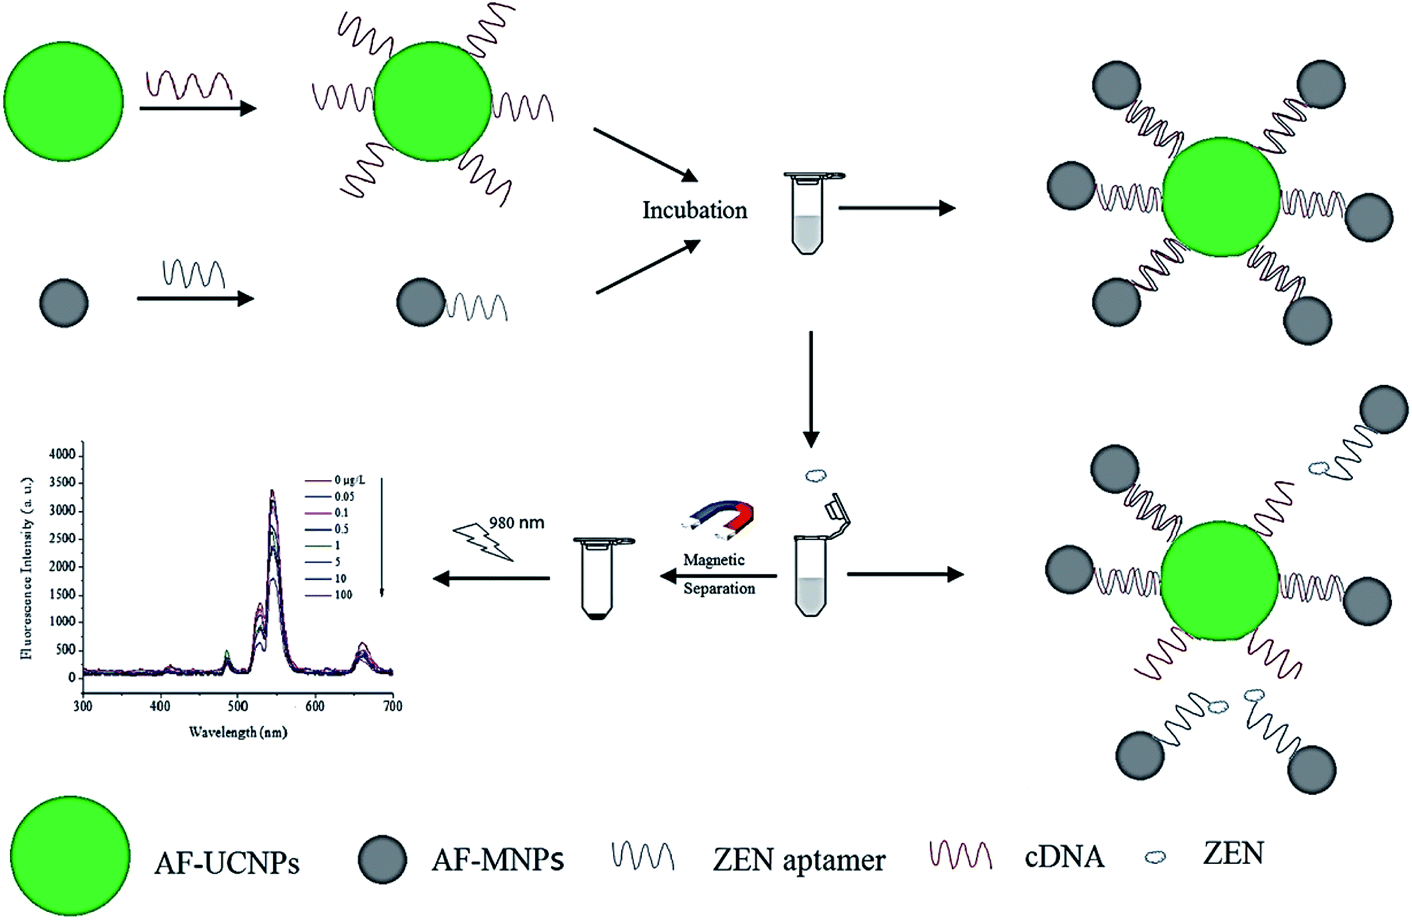 | ||
| Fig. 25 Schematic illustration of the UCNP-MNP based aptasensor developed for the sensitive detection of the mycotoxin ZEN. Reprinted with permission from ref. 68. Copyright 2017, Elsevier Ltd. | ||
Using aptamer-conjugated UCNPs and Fe3O4 MNPs, Duan et al. developed a biosensor for simultaneous detection of Salmonella typhimurium and Staphylococcus aureus. The system was fabricated by immobilizing aptamer 1 and aptamer 2 onto the surface of amine-functionalized MNPs, which were implemented to capture and concentrate S. typhimurium and S. aureus, respectively. The NaYF4:Yb/Er and NaYF4:Yb/Tm UCNPs were first covered with a silica shell using TEOS and APTES and further conjugated with modified bacterial aptamers (1 and 2). Due to the high affinity of aptamers for the corresponding bacteria, the 1-MNP–S. typhimurium complex formed subsequently binds to Tm-doped UCNP modified aptamer 1, and the 2-MNP–S. aureus binds to Er-doped UCNP modified aptamer 2, as schematically shown in Fig. 26. The final MNPs–bacteria–UCNP complexes were isolated using magnetic separation and the emission spectra were measured. The authors chose the emissions from Tm3+ at 452 nm and from Er3+ at 660 nm to monitor S. typhimurium and S. aureus because these two emission peaks will not interfere with each other in the fluorescence spectrum of the mixed probes. After isolation, in the absence of pathogenic bacteria, the luminescence intensity was at a minimum, and in the presence of different concentrations of microorganisms, the fluorescence signal of the nanocomposite varied. Under optimal conditions, the concentration of bacteria is proportional to the increase in luminescence intensity and the produced platform achieved LODs of 5 cfu mL−1 for S. typhimurium and 8 cfu mL−1 for S. aureus.143 Based on a similar strategy and using antigen-modified MNPs as immuno-sensing probes and antibody functionalized Er and Tm-doped UCNPs as signal probes, Wu et al. developed a sensor for the simultaneous detection of aflatoxin B1 and ochratoxin A.144
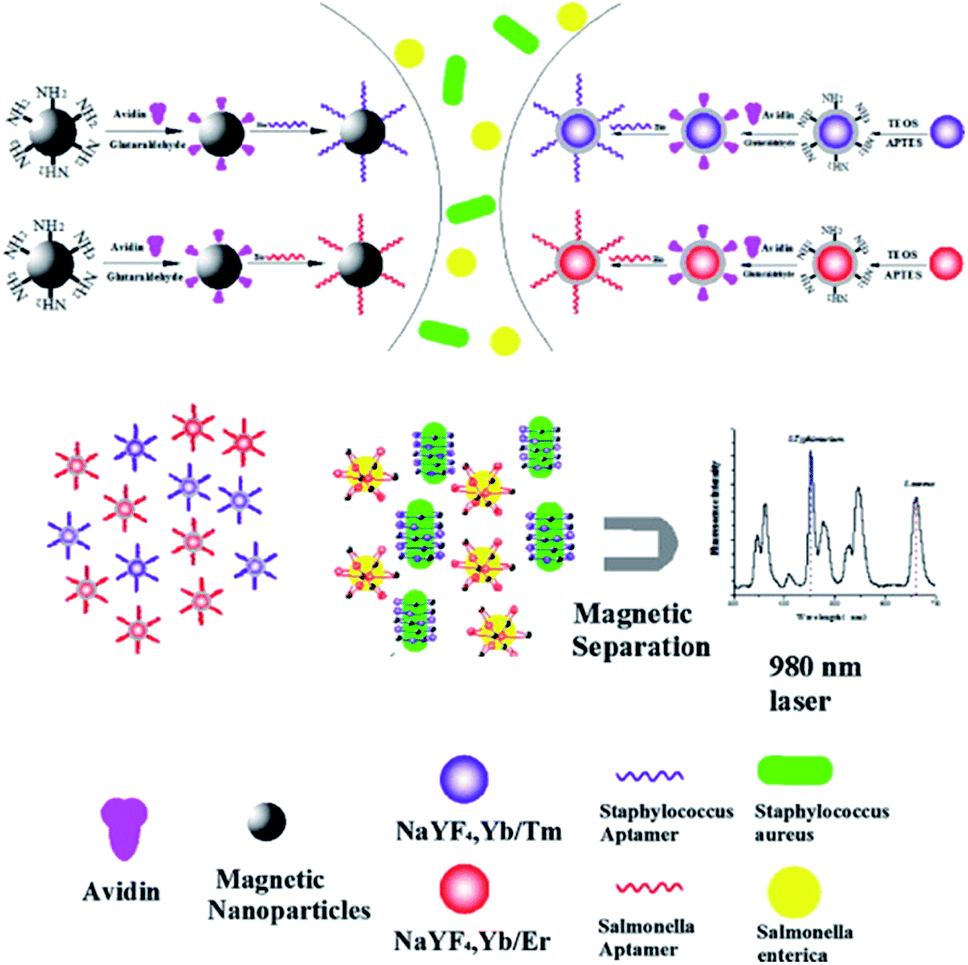 | ||
| Fig. 26 Schematic illustration of the fabrication process of biofunctionalized UCNPs-MNPs and the working principle of the performed bioassay for the detection of Salmonella typhimurium and Staphylococcus aureus. Reprinted with permission from ref. 143. Copyright 2012, Elsevier B.V. | ||
4.6. UCNP integration with molecularly imprinted polymers
Molecular imprinting is a technique that creates complementary cavities for a specific target by polymerizing functional monomers in the presence of template molecules. As one of the most suitable alternatives for biological molecular recognition, fully synthetic molecularly imprinted polymers (MIPs) have attracted great interest and have been used in chromatographic separations, chemo/biosensing and catalysis. Moreover, MIPs not only have a low cost and good stability but also can be directly synthetised on the nanoparticle surface.214To produce sensing platforms, generally UCNPs are coated with MIPs (UNCPs@MIP), as in the system developed by Wang and coworkers for the detection of diethylstilbestrol (DES) in milk samples. The authors used a one-step process to modify the surface of Er-doped UCNPs with alkenyl groups and then a MIP layer, which could selectively and sensitively recognize the target, was synthesized on the NPs by the surface-graft molecular imprinting method, as schematically shown in Fig. 27A. After the removal of the template molecules, the UCNPs@MIP were able to selectively recognize DES, and the fluorescence intensity decreased as the concentration of DES increased, showing a good linear relationship between 50 and 1000 ng mL−1 and a LOD of 12.8 ng mL−1. Since there is no overlap between the absorption of DES and the UC emission peaks, the quenching mechanism was attributed to a charge transfer process from UCNPs to DES.50
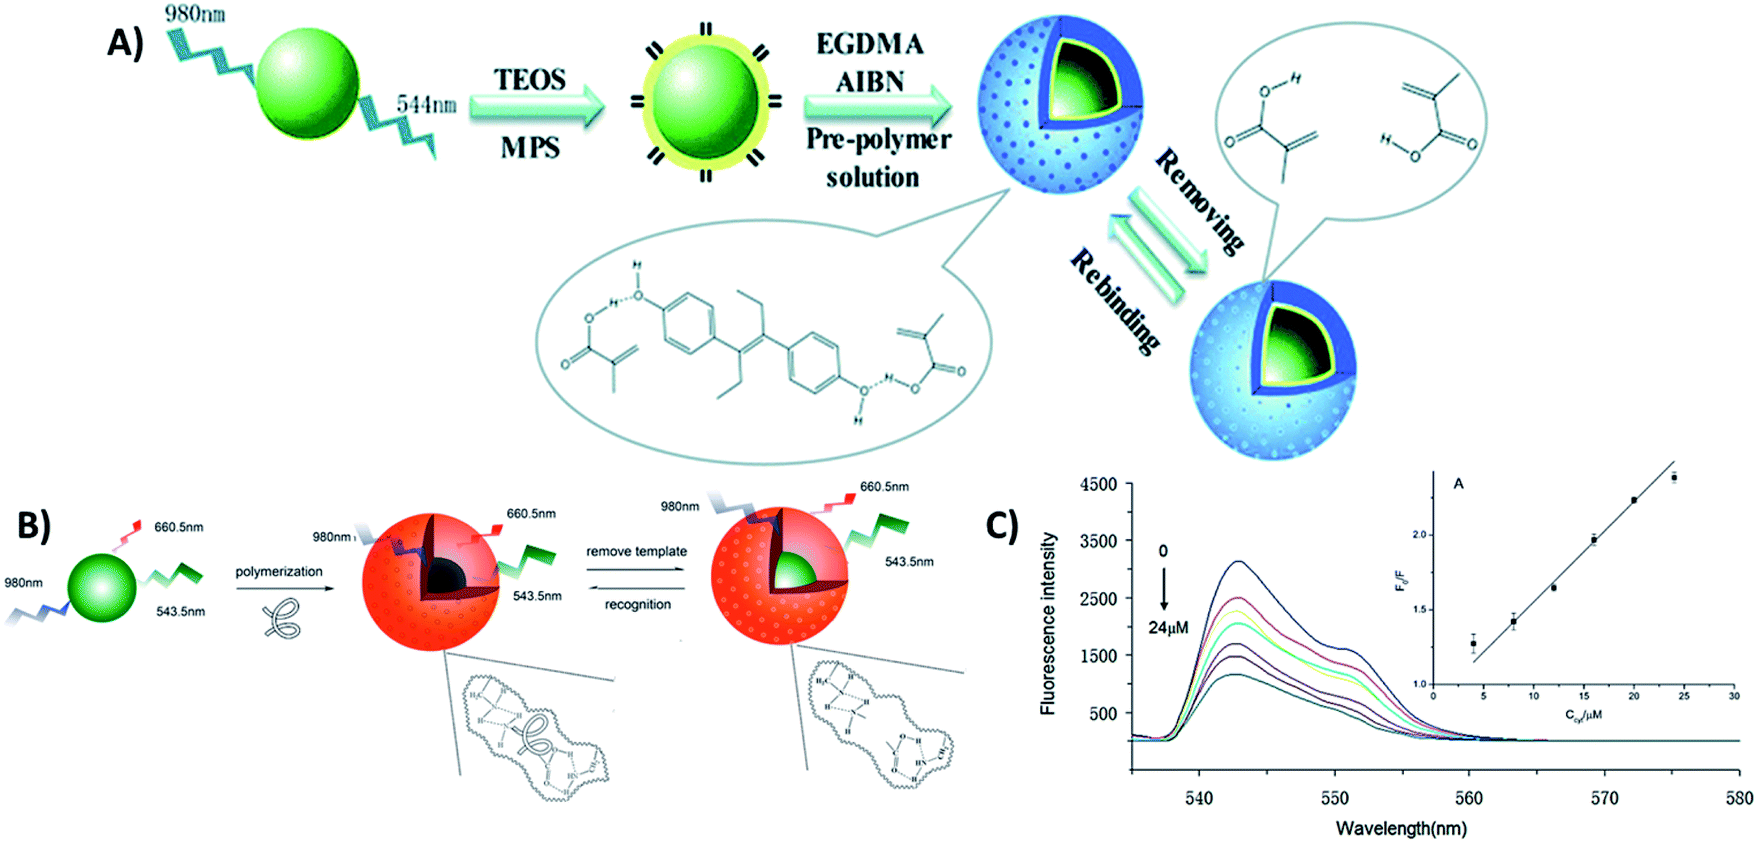 | ||
| Fig. 27 Schematic illustration of sensing platforms based on MIP-coated UCNPs. (A) Preparation procedure of UCNPs@MIP for the detection of diethylstilbestrol. Reprinted with permission from ref. 50. Copyright 2017, The Royal Society of Chemistry. (B) Route for the production of MIP-coated UCNPs used in Cyt c sensing. (C) Fluorescence emission spectra of UCNPs@MIP with the addition of increasing concentrations of the protein Cyt c. Reprinted with permission from ref. 94. Copyright 2015, Elsevier B.V. | ||
MIP-coated UCNPs have also been used for sensing ochratoxin A,215 acetamiprid,44 proteins,216 enrofloxacin,217 and cytochrome c (Cyt c).94Fig. 27B presents the scheme illustrating the synthesis process and the mechanism of UCNPs@MIP used for the detection of Cyt c. First, the template protein is immobilized on the surface of carboxyl modified Er-doped UCNPs and then the formed complex interacts with functional monomers (APTES) by non-covalent processes. Using TEOS as a crosslinker, the final composites were prepared through the hydrolysis and condensation reaction of APTES. After removal of the template protein, recognition sites were formed. In this “turn-off” system, the presence of Cyt c induces UCNP emission quenching (Fig. 27C) probably due to a photo-induced electron transfer process. The UCNPs@MIP exhibited a linear response in the range of 1–24 μM with a LOD of 0.73 μM.94
5. UCNP-based sensing systems on paper supports
So far, we presented the use of UCNPs in solution-phase sensing systems, in which both target recognition and signal transduction occur in a homogeneous solution, and the signal acquisition can be accomplished using common spectrophotometers.218 However, due to their unique characteristics, UCNPs can also find a great number of applications in the production of sensors on solid supports. These solid-state platforms are crucial for the development of portable, reusable, and convenient sensing systems, otherwise known as point-of-care (POC) testing. In this section we explore UCNP-based sensors on paper supports focusing on the integration between the nanoparticles and the substrate, methods for signal response acquisition, and the development of POC devices.Paper has been increasingly used as a support material for the fabrication of sensors and devices in analytical and clinical chemistry owing to its portability, simplicity, and low cost. In this scenario, the use of UCNPs is advantageous because they can efficiently eliminate background fluorescence interference, since phosphors in paper cannot be activated by NIR light, allowing higher sensitivity and lower detection limits. UCNP-based sensors on paper supports have drawn increasing attention in the past few years and have been applied for a broad range of analytes from explosives172 to DNA219 detection. Different techniques can be used to incorporate UCNP probes onto paper, for example, physical adsorption was used to immobilize avidin-UCNPs onto cellulose paper substrates for the detection of unlabeled nucleic acid,65 organophosphonate (OP) nerve agents163 and exosomes.60 On the other hand, UCNPs can also be printed onto paper, as realized by Xu et al. for sensing multiple cancer biomarkers. Briefly, in this nano-printing technology, the nanoparticle solutions were injected into cartridges and then printed on the surface of a piece of filter paper with a commercial printer.177
Usually, in these paper-based devices, a qualitative readout can be realized by naked eye, while more accurate response requires the use of spectrophotometers and other equipment. Recently, smartphone cameras have emerged as promising alternatives with several advantages such as portability, ease of use, accessibility, and relatively low cost, being excellent candidates for use in POC devices.220,221 In this way, Mei et al. developed a “turn-off” paper sensing system using Cu2+ ions loaded onto the surface of polymer-coated NaYF4:Yb/Tm, for the detection and quantification of the pesticide thiram using a smartphone camera, as schematically shown in Fig. 28. The UCNP-based paper sensor was fabricated by physical adsorption. Basically, a piece of common filter paper was immersed in the aqueous solution of NaYF4:Yb/Tm@PAA-Cu, ultrasonically agitated for 10 min and dried. The prepared test paper was then placed into a tailor-made optical accessory, which has an optical window for the smartphone camera, as shown in Fig. 28C and D. The images in Fig. 28E demonstrate the luminescence evolutions on the test paper; upon increasing the amount of thiram, the UC emission decreases due to FRET from the UCNPs to the complex formed between Cu2+ and the pesticide. To quantify the luminescence, the authors extracted the blue channel intensities of these RGB (Red-Green-Blue) colored images through a self-written Android program installed on the smartphone. In Fig. 28F it is possible to observe that the luminescence intensities on the test paper exhibit a linear relationship with the logarithm of thiram concentrations from 0.1 μM to 1 mM and the produced platform achieved a LOD of 0.1 μM.90
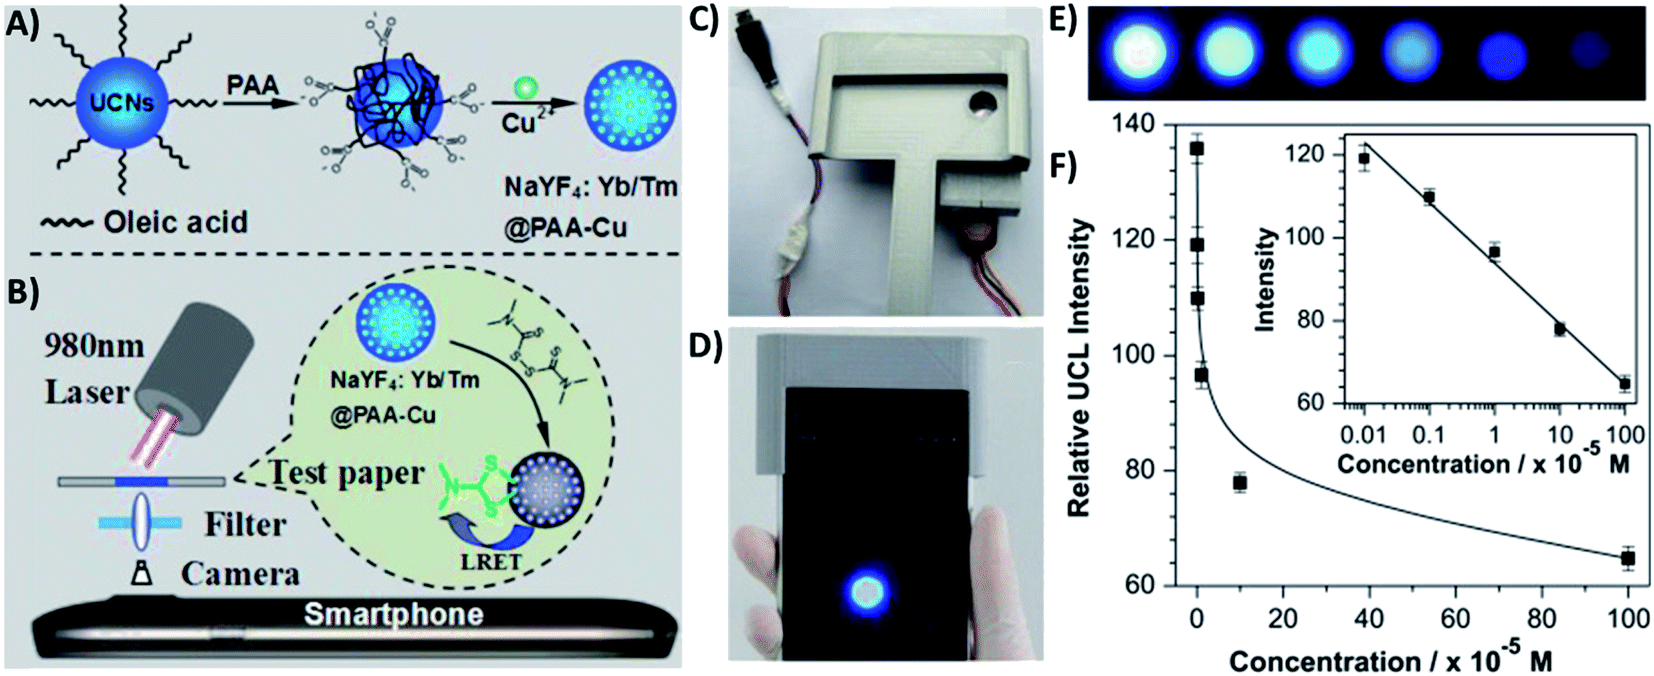 | ||
| Fig. 28 Paper UCNP-based “turn-off” sensor for thiram detection. (A) Schematic illustration of the preparation procedure of NaYF4:Yb/Tm@PAA-Cu nanoprobes. (B) The inner optical structure of the system and the detection principle for thiram. (C) Picture of the optical attachment. (D) Frontal view of the smartphone detection setup. (E) The luminescent images of the test paper upon addition of different amounts of thiram, which were taken using the smartphone detection setup. (F) The relative luminescence intensities of color images calculated through the blue channel. The inset figure shows the linear relationship of mean luminescence intensities with the logarithm of thiram concentrations. Reprinted with permission from ref. 90. Copyright 2015, Elsevier B.V. | ||
Similarly, He at al. developed a portable paper device for road-side field testing of cocaine (LOD of 10 nM), by covalently binding UCNPs to filter paper, as schematically shown in Fig. 29. In this “turn-off” sensor, the target recognition was realized by using an anticocaine aptamer (ACA), which was cut into two flexible ssDNA pieces, namely ACA-1 and ACA-2. To produce the sensor, first the paper surface was patterned with hydrophobic ink rings to isolate the test zones and then, the paper was treated with sodium periodate and lithium chloride to oxidize the hydroxyl group of cellulose to the aldehyde group. PEI-UCNPs and NH2-ACA-1 were immobilized on the aldehyde group functionalized paper through the formation of secondary amines. Sulfhydryl modified ACA-2 was attached to AuNPs and added to the system. When no target is present, there is no interaction between the two pieces of ssDNA and the luminescence of UCNPs remains constant; however, in the presence of cocaine, the two pieces of ssDNA reassemble which results in emission quenching due to FRET from UCNPs to AuNPs in close proximity. The fluorescence images were collected using a smartphone camera on a self-made detector holder and the green-channel intensities of these RGB colored images were extracted with Photoshop software to quantify the luminescence.58
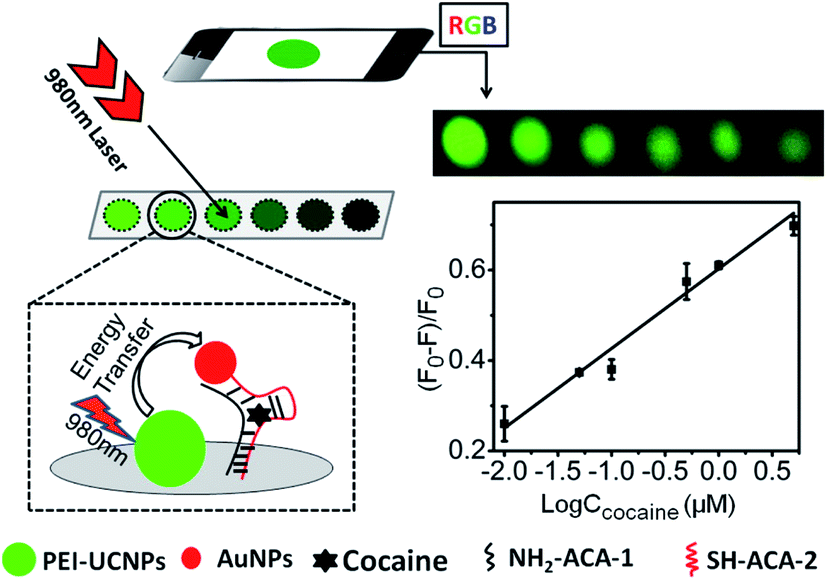 | ||
| Fig. 29 Schematic illustration of the UCNP-based paper device for cocaine field testing. Reprinted with permission from ref. 58. Copyright 2016, American Chemical Society. | ||
5.1. Lateral flow assays
In lateral flow assays (LFAs), a complex solution usually flows by capillary forces across a porous matrix strip, usually made of materials such as nitrocellulose. The analyte detection occurs through specific interactions with biomolecules that are previously immobilized at specific regions of the matrix. LFAs have an acknowledged position among sensing systems because they are not only sensitive, but also well suited for rapid on-site testing. UC-LFAs have been reported for the detection of single-stranded nucleic acids,222 cephalexin,223 human papillomavirus,224Vibrio anguillarum,225 among others.226You and coworkers developed a sensing platform by integrating a smartphone-based reader with a multiplexed upconversion fluorescent lateral flow strip (LFS) for early diagnosis of heart failure (HF). Er and Tm-doped UCNPs were used for multiplexed detection of brain natriuretic peptide (BNP) and suppression of tumorigenicity 2 (ST2), respectively, two target antigens/biomarkers associated with HF. When the sample is added to the LFS, the target analytes first specifically bind to the UCNP probes forming UCNP–analyte conjugates, as schematically shown in Fig. 30B–D, and then flow through the NC membrane, driven by capillary force, to be finally captured by the ST2 and BNP antibodies immobilized in the test lines. The excess UCNP probes without bound analytes react with goat antimouse immunoglobulin G (IgG) and are trapped in the control line. In Fig. 30E the emission evolution of both probes with increasing concentration of BNP and ST2 is shown. After reaction, the fluorescence signal from the LFS was read using a smartphone portable reader (Fig. 30A) and the images were analyzed through their blue and green channels. As a result, the produced sensor was able to detect minimal concentrations of 29.92 ng mL−1 for ST2 and 17.46 pg mL−1 for BNP.227 UC-LFS platforms combined with compact smartphone readers were also developed for the detection of avian influenza146 and the ultrasensitive detection of prostate specific antigen (PSA) and ephrin type-A receptor 2 (EphA2) biomarkers, achieving new records of limits of detection of 89 and 400 pg mL−1, respectively.147
 | ||
| Fig. 30 The multiplexed UC-LFS platform for early diagnosis of heart failure. (A) Integration of a smartphone-based portable reader and (B) a dual-color UCNP-based LFS. (C and D) Schematic illustration of the system response principle. (E) Photograph of the dual-color-based multiplexed LFS for simultaneously detecting BNP and ST2 antigens. Reprinted with permission from ref. 227. Copyright 2017, American Chemical Society. | ||
6. Conclusion and outlook
Throughout this review we have shown that UCNPs have most of the desirable characteristics of an ideal fluorescent reporter: high photostability, absence of photobleaching or blinking, large anti-Stokes shifts, long excited state lifetime values and discrete emissions. In particular, the possibility of background-free fluorescence detection enabled by the use of NIR excitations facilitates the development of sensors with significantly enhanced limits of detection, particularly for biological applications. Furthermore, UCNP emissions can be simply tuned by changing the lanthanide dopants, and their surface can be easily modified through post-synthesis methods, facilitating their combination with other materials and recognition elements. Due to the UCNPs’ versatility, truly resourceful sensors can be developed, and once the target species (the analyte) is designated, one can play with the following variables: (1) which Ln3+-doped UCNPs to use; (2) the recognition element; (3) how to integrate the recognition element with the UCNP – surface modifications and functionalization; (4) the expected response type; (5) the sensing mechanism (FRET, IFE, magnetic separation, etc.), and (6) if any additional probes are necessary. Through this article we discussed all these points and showed how to explore them in the development of sensitive and selective UCNP-based sensors.Although several improvements have been achieved over the years, one drawback of the UCNPs is still their low quantum yield compared to conventional fluorescent materials. The lower brightness is usually compensated using NIR lasers with high power densities, but this can also create an obstacle since most commercially available instrumentation lacks this type of excitation source. The most common fluorescence-based assays are not compatible with the UC technology and sometimes UCNP exploration is hampered due to the absence of adequate equipment. Fortunately, the excellent outcomes observed in UCNP-based sensors have been contributing to recent rapid development and implementation of appropriate instruments for upconversion readouts, which has facilitated the use of these particles in different types of systems from conventional homogenous assays over in vivo analysis to POC devices. Some of these developed UCNP-based platforms present results comparable to those of well-known labels and, in some cases, can surpass conventional commercial systems. In this scenario, the translation of UCNP-based sensors onto solid-state substrates such as paper has recently emerged as a promising alternative to construct portable, easy-to-use, reusable, and efficient sensing systems. As discussed in the last section of this article, the use of UCNPs in sensors follows the trend towards the development of point-of-care devices in which the detection and quantification are realized using smartphone cameras and apps. The development of novel chemical and biological UCNP-based sensors on solid substrates is a promising and fertile ground of research specifically keeping in mind the need for environmentally friendly reusable and/or low cost discardable sensors.
Conflicts of interest
There are no conflicts of interest to declare.Acknowledgements
The authors would like to acknowledge the financial support from the funding agencies CAPES – Coordenação de Aperfeiçoamento de Pessoal de Nível Superior, CNPq – Conselho Nacional de Desenvolvimento Científico e Tecnológico (Universal Grant No. 130562/2018-1) and FAPESP – Fundação de Amparo à Pesquisa do Estado de São Paulo (Grant No. 2021/01170-3, and Cepid Project No. 2013/07793-6; CeRTEV – Center for Research Technology and Education on Vitreous Materials). M. S. A. particularly acknowledges FAPESP for granting the doctoral fellowship (Grant No. 2019/12588-9).References
- F. Auzel, Chem. Rev., 2004, 104, 139–174 CrossRef CAS PubMed.
- V. V. Ovsyankin and P. P. Feofilov, J. Exp. Theor. Phys., 1967, 3, 322 Search PubMed.
- S. Wilhelm, ACS Nano, 2017, 11, 10644–10653 CrossRef CAS PubMed.
- X. Zhu, Q. Su, W. Feng and F. Li, Chem. Soc. Rev., 2017, 46, 1025–1039 RSC.
- M. Haase and H. Schäfer, Angew. Chem., Int. Ed., 2011, 50, 5808–5829 CrossRef CAS PubMed.
- Y. Liu, D. Tu, H. Zhu and X. Chen, Chem. Soc. Rev., 2013, 42, 6924 RSC.
- J.-C. Boyer and F. C. J. M. van Veggel, Nanoscale, 2010, 2, 1417 RSC.
- H.-X. Mai, Y.-W. Zhang, R. Si, Z.-G. Yan, L. Sun, L.-P. You and C.-H. Yan, J. Am. Chem. Soc., 2006, 128, 6426–6436 CrossRef CAS PubMed.
- H. Dong, L.-D. Sun and C.-H. Yan, Nanoscale, 2013, 5, 5703 RSC.
- Luminescence of Lanthanide Ions in Coordination Compounds and Nanomaterials, ed A. de Bettencourt-Dias, John Wiley & Sons Ltd, Chichester, United Kingdom, 2014 Search PubMed.
- S. Heer, K. Kömpe, H.-U. Güdel and M. Haase, Adv. Mater., 2004, 16, 2102–2105 CrossRef CAS.
- M. Wang, G. Abbineni, A. Clevenger, C. Mao and S. Xu, Nanomedicine, 2011, 7, 710–729 CrossRef CAS PubMed.
- F. Wang and X. Liu, J. Am. Chem. Soc., 2008, 130, 5642–5643 CrossRef CAS PubMed.
- H. Dong, L.-D. Sun and C.-H. Yan, Chem. Soc. Rev., 2015, 44, 1608–1634 RSC.
- S. T. Dibaba, X. Ge, W. Ren and L. Sun, J. Rare Earths, 2019, 37, 791–805 CrossRef CAS.
- S. Wen, J. Zhou, K. Zheng, A. Bednarkiewicz, X. Liu and D. Jin, Nat. Commun., 2018, 9, 2415 CrossRef PubMed.
- H. Qin, D. Wu, J. Sathian, X. Xie, M. Ryan and F. Xie, Sci. Rep., 2018, 8, 12683 CrossRef PubMed.
- C. Renero-Lecuna, R. Martín-Rodríguez, R. Valiente, J. González, F. Rodríguez, K. W. Krämer and H. U. Güdel, Chem. Mater., 2011, 23, 3442–3448 CrossRef CAS.
- B. Amouroux, C. Roux, J. D. Marty, M. Pasturel, A. Bouchet, M. Sliwa, O. Leroux, F. Gauffre and C. Coudret, Inorg. Chem., 2019, 58, 5082–5088 CrossRef CAS PubMed.
- J.-C. Boyer, F. Vetrone, L. A. Cuccia and J. A. Capobianco, J. Am. Chem. Soc., 2006, 128, 7444–7445 CrossRef CAS PubMed.
- H. Li, X. Liu and X. Li, RSC Adv., 2019, 9, 42163–42171 RSC.
- R. Rafique, S. H. Baek, L. M. T. Phan, S.-J. Chang, A. R. Gul and T. J. Park, Mater. Sci. Eng., C, 2019, 99, 1067–1074 CrossRef CAS PubMed.
- X. Gao, N. Wang, T. Shi, S. Wang, M. Zhang, W. Zhang, J. Zhong, H. Tong and X. Zhang, J. Fluorine Chem., 2016, 188, 23–27 CrossRef CAS.
- F. Wang and X. Liu, Chem. Soc. Rev., 2009, 38, 976 RSC.
- L. Sun, R. Wei, J. Feng and H. Zhang, Coord. Chem. Rev., 2018, 364, 10–32 CrossRef CAS.
- N. Kang, C.-C. Ai, Y.-M. Zhou, Z. Wang and L. Ren, Nanotechnology, 2018, 29, 075601 CrossRef PubMed.
- D. T. Klier and M. U. Kumke, J. Phys. Chem. C, 2015, 119, 3363–3373 CrossRef CAS.
- E. Andresen, U. Resch-Genger and M. Schäferling, Langmuir, 2019, 35, 5093–5113 CrossRef CAS PubMed.
- Y. Liu, X. Meng and W. Bu, Coord. Chem. Rev., 2019, 379, 82–98 CrossRef CAS.
- M. C. Grüner, M. S. Arai, M. Carreira, N. Inada and A. S. S. de Camargo, ACS Appl. Bio Mater., 2018, 1, 1028–1036 CrossRef.
- H. Dong, S.-R. Du, X.-Y. Zheng, G.-M. Lyu, L.-D. Sun, L.-D. Li, P.-Z. Zhang, C. Zhang and C.-H. Yan, Chem. Rev., 2015, 115, 10725–10815 CrossRef CAS PubMed.
- G. Lee and Y. Park, Nanomaterials, 2018, 8, 511 CrossRef PubMed.
- Y. Yang, Microchim. Acta, 2014, 181, 263–294 CrossRef CAS.
- S. Han, L. Yang, Z. Wen, S. Chu, M. Wang, Z. Wang and C. Jiang, J. Hazard. Mater., 2020, 398, 122894 CrossRef CAS PubMed.
- S. Chu, H. Wang, X. Ling, S. Yu, L. Yang and C. Jiang, ACS Appl. Mater. Interfaces, 2020, 12, 12962–12971 CrossRef PubMed.
- S. Chu, H. Wang, Y. Du, F. Yang, L. Yang and C. Jiang, ACS Sustainable Chem. Eng., 2020, 8, 8175–8183 CrossRef CAS.
- H. Wang, L. Yang, S. Chu, B. Liu, Q. Zhang, L. Zou, S. Yu and C. Jiang, Anal. Chem., 2019, 91, 9292–9299 CrossRef CAS PubMed.
- P. J. Dobson, Contemp. Phys., 2018, 59, 424 CrossRef.
- R. Arppe, I. Hyppänen, N. Perälä, R. Peltomaa, M. Kaiser, C. Würth, S. Christ, U. Resch-Genger, M. Schäferling and T. Soukka, Nanoscale, 2015, 7, 11746–11757 RSC.
- S. Guo, X. Xie, L. Huang and W. Huang, ACS Appl. Mater. Interfaces, 2016, 8, 847–853 CrossRef CAS PubMed.
- N. Bogdan, F. Vetrone, G. A. Ozin and J. A. Capobianco, Nano Lett., 2011, 11, 835–840 CrossRef CAS PubMed.
- S. M. Saleh, R. Ali and O. S. Wolfbeis, Chem.–Eur. J., 2011, 17, 14611–14617 CrossRef CAS PubMed.
- S. Christ and M. Schäferling, Methods Appl. Fluoresc., 2015, 3, 034004 CrossRef PubMed.
- Q. Yu, C. He, Q. Li, Y. Zhou, N. Duan and S. Wu, Microchim. Acta, 2020, 187, 222 CrossRef CAS PubMed.
- Y. Li, D. Jia, W. Ren, F. Shi and C. Liu, Adv. Funct. Mater., 2019, 29, 1–7 Search PubMed.
- H. Wang, Y. Lu, L. Wang and H. Chen, Talanta, 2019, 197, 558–566 CrossRef CAS PubMed.
- D. Wang, C. Chen, X. Ke, N. Kang, Y. Shen, Y. Liu, X. Zhou, H. Wang, C. Chen and L. Ren, ACS Appl. Mater. Interfaces, 2015, 7, 3030–3040 CrossRef CAS PubMed.
- N. T. Chen, S. H. Cheng, C. P. Liu, J. S. Souris, C. T. Chen, C. Y. Mou and L. W. Lo, Int. J. Mol. Sci., 2012, 13, 16598–16623 CrossRef CAS PubMed.
- J. Li, C. Zhang, M. Yin, Z. Zhang, Y. Chen, Q. Deng and S. Wang, ACS Omega, 2019, 4, 15947–15955 CrossRef CAS PubMed.
- Y. Wang, S. Ren, H. Jiang, Y. Peng, J. Bai, Q. Li, C. Li, Z. Gao and B. Ning, RSC Adv., 2017, 7, 22215–22221 RSC.
- P. Wang, H. Li, M. M. Hassan, Z. Guo, Z. Z. Zhang and Q. Chen, J. Agric. Food Chem., 2019, 67, 4071–4079 CrossRef CAS PubMed.
- Y. Ding, F. Wu, Y. Zhang, X. Liu, E. M. L. D. De Jong, T. Gregorkiewicz, X. Hong, Y. Liu, M. C. G. Aalders, W. J. Buma and H. Zhang, J. Phys. Chem. Lett., 2015, 6, 2518–2523 CrossRef CAS PubMed.
- R. M. Clegg, Curr. Opin. Biotechnol., 1995, 6, 103–110 CrossRef CAS PubMed.
- Principles of Fluorescence Spectroscopy, ed J. R. Lakowicz, Springer US, Boston, MA, 2006 Search PubMed.
- S. Chen, Y.-L. Yu and J.-H. Wang, Anal. Chim. Acta, 2018, 999, 13–26 CrossRef CAS PubMed.
- R. Wang and F. Zhang, Chapter 1:Lanthanide-Based Near Infrared Nanomaterials for Bioimaging, in Near-infrared Nanomaterials: Preparation, Bioimaging and Therapy Applications, RSC Publishing, 2016. Search PubMed.
- C. Wang, X. Li and F. Zhang, Analyst, 2016, 141, 3601–3620 RSC.
- M. He, Z. Li, Y. Ge and Z. Liu, Anal. Chem., 2016, 88, 1530–1534 CrossRef CAS PubMed.
- W. W. Ye, M. K. Tsang, X. Liu, M. Yang and J. Hao, Small, 2014, 10, 2390–2397 CrossRef CAS PubMed.
- X. Chen, J. Lan, Y. Liu, L. Li, L. Yan, Y. Xia, F. Wu, C. Li, S. Li and J. Chen, Biosens. Bioelectron., 2018, 102, 582–588 CrossRef CAS PubMed.
- K. Kim, E.-J. Jo, K. Joong Lee, J. Park, G. Y. Jung, Y.-B. Shin, L. P. Lee, M. Kim, G. Young, Y.-B. Shin, L. P. Lee and M. Kim, Biosens. Bioelectron., 2020, 150, 111885 CrossRef CAS PubMed.
- Y. Zhang, S. Xu, X. Li, J. Zhang, J. Sun, L. Tong, H. Zhong, H. Xia, R. Hua and B. Chen, Sens. Actuators, B, 2018, 257, 829–838 CrossRef CAS.
- K. L. Reddy, M. Venkateswarulu, K. R. Shankar, S. Ghosh and V. Krishnan, ChemistrySelect, 2018, 3, 1793–1800 CrossRef CAS.
- E. J. Jo, J. Y. Byun, H. Mun, D. Bang, J. H. Son, J. Y. Lee, L. P. Lee and M. G. Kim, Anal. Chem., 2018, 90, 716–722 CrossRef CAS PubMed.
- F. Zhou, M. Noor and U. Krull, Nanomaterials, 2015, 5, 1556–1570 CrossRef CAS PubMed.
- C. Sun, H. Li, A. Koidis and Q. Chen, Spectrochim. Acta, Part A, 2016, 165, 120–126 CrossRef CAS PubMed.
- X. Liu, L. Su, L. Zhu, X. Gao, Y. Wang, F. Bai, Y. Tang and J. Li, Sens. Actuators, B, 2016, 233, 394–401 CrossRef CAS.
- Z. Wu, E. Xu, M. F. J. Chughtai, Z. Jin and J. Irudayaraj, Food Chem., 2017, 230, 673–680 CrossRef CAS PubMed.
- D. He, Z. Wu, B. Cui, E. Xu and Z. Jin, Food Anal. Methods, 2019, 12, 625–632 CrossRef.
- M. Laurenti, M. Paez-Perez, M. Algarra, P. Alonso-Cristobal, E. Lopez-Cabarcos, D. Mendez-Gonzalez and J. Rubio-Retama, ACS Appl. Mater. Interfaces, 2016, 8, 12644–12651 CrossRef CAS PubMed.
- Q. Long, H. Li, Y. Zhang and S. Yao, Biosens. Bioelectron., 2015, 68, 168–174 CrossRef CAS PubMed.
- M. Tsang, W. Ye, G. Wang, J. Li, M. Yang and J. Hao, ACS Nano, 2016, 10, 598–605 CrossRef CAS PubMed.
- J. Ni, C. Shan, B. Li, L. Zhang, H. Ma, Y. Luo and H. Song, Chem. Commun., 2015, 51, 14054–14056 RSC.
- Y. Chen, H. T. T. Duong, S. Wen, C. Mi, Y. Zhou, O. Shimoni, S. M. Valenzuela and D. Jin, Anal. Chem., 2018, 90, 663–668 CrossRef CAS PubMed.
- W. Wang, M. Zhao, L. Wang and H. Chen, Microchim. Acta, 2019, 186, 630 CrossRef PubMed.
- A. N. Vijayan, Z. Liu, H. Zhao and P. Zhang, Anal. Chim. Acta, 2019, 1072, 75–80 CrossRef CAS PubMed.
- Z. Meng, S. Wu, L. Zhong, X. Sun, L. Li and S. Zhang, Nanotechnology, 2019, 30, 135502 CrossRef CAS PubMed.
- H. Chen, Q. Lu, K. He, M. Liu, Y. Zhang and S. Yao, Sens. Actuators, B, 2018, 260, 908–917 CrossRef CAS.
- Q. Long, A. Fang, Y. Wen, H. Li, Y. Zhang and S. Yao, Biosens. Bioelectron., 2016, 86, 109–114 CrossRef CAS PubMed.
- Z. Cui, W. Bu, W. Fan, J. Zhang, D. Ni, Y. Liu, J. Wang, J. Liu, Z. Yao and J. Shi, Biomaterials, 2016, 104, 158–167 CrossRef CAS PubMed.
- H. Chen, F. Yuan, S. Wang, J. Xu, Y. Y. Zhang and L. Wang, Biosens. Bioelectron., 2013, 48, 19–25 CrossRef CAS PubMed.
- L. M. Wiesholler, C. Genslein, A. Schroter and T. Hirsch, Anal. Chem., 2018, 90, 14247–14254 CrossRef CAS PubMed.
- Z. Liu, L. Yang, M. Chen and Q. Chen, J. Photochem. Photobiol., A, 2020, 388, 112203 CrossRef.
- X. Wang and X. P. Yan, Anal. Bioanal. Chem., 2018, 410, 6761–6769 CrossRef CAS PubMed.
- Q. Ouyang, Y. Liu, Q. Chen, Z. Guo, J. Zhao, H. Li and W. Hu, Food Control, 2017, 81, 156–163 CrossRef CAS.
- Q. Chen, W. Hu, C. Sun, H. Li and Q. Ouyang, Anal. Chim. Acta, 2016, 938, 137–145 CrossRef CAS PubMed.
- G. Hu, W. Sheng, Y. Zhang, J. Wang, X. Wu and S. Wang, J. Agric. Food Chem., 2016, 64, 3908–3915 CrossRef CAS PubMed.
- H. Chen, A. Fang, L. He, Y. Zhang and S. Yao, Talanta, 2017, 164, 580–587 CrossRef CAS PubMed.
- Z. Gerelkhuu, D. Jung, B. The Huy, S. M. Tawfik, M. L. Conte, E. D. Conte and Y. I. Lee, Sens. Actuators, B, 2019, 284, 172–178 CrossRef CAS.
- Q. Mei, H. Jing, Y. Li, W. Yisibashaer, J. Chen, B. Nan Li, Y. Zhang, B. Nan, B. Nan Li and Y. Zhang, Biosens. Bioelectron., 2016, 75, 427–432 CrossRef CAS PubMed.
- W. Wang, H. Li, M. Yin, K. Wang, Q. Deng, S. Wang and Y. Zhang, Sens. Actuators, B, 2018, 255, 1422–1429 CrossRef CAS.
- Y. T. Wong, S. Y. Pang, M. K. Tsang, Y. Liu, H. Huang, S. F. Yu and J. Hao, Nanoscale Adv., 2019, 1, 265–272 RSC.
- L. J. Huang, R. Q. Yu and X. Chu, Analyst, 2015, 140, 4987–4990 RSC.
- T. Guo, Q. Deng, G. Fang, C. Liu, X. Huang and S. Wang, Biosens. Bioelectron., 2015, 74, 498–503 CrossRef CAS PubMed.
- Z. Pan, Y. Wen, T. Wang, K. Wang, Y. Teng and K. Shao, J. Rare Earths, 2020, 38, 362–368 CrossRef CAS.
- J. Liu, L. Lu, A. Li, J. Tang, S. Wang, S. Xu and L. Wang, Biosens. Bioelectron., 2015, 68, 204–209 CrossRef CAS PubMed.
- L. Sun, H. Zhou, D. Huang, T. Wang, P. Gao, Y. Sun, G. Zhou and J. Hu, Microchim. Acta, 2019, 186, 502 CrossRef PubMed.
- D. Jung, Z. Gerelkhuu, B. T. Huy and Y. I. Lee, ACS Omega, 2019, 4, 7931–7937 CrossRef CAS PubMed.
- L. J. Huang, X. Tian, J. T. Yi, R. Q. Yu and X. Chu, Anal. Methods, 2015, 7, 7474–7479 RSC.
- P. Vilela, A. El-Sagheer, T. M. Millar, T. Brown, O. L. Muskens and A. G. Kanaras, ACS Sens., 2017, 2, 52–56 CrossRef CAS PubMed.
- D. Giust, M. I. Lucío, A. H. El-Sagheer, T. Brown, L. E. Williams, O. L. Muskens and A. G. Kanaras, ACS Nano, 2018, 12, 6273–6279 CrossRef CAS PubMed.
- M. Wu, X. Wang, K. Wang and Z. Guo, Talanta, 2017, 174, 797–802 CrossRef CAS PubMed.
- Y. C. Chan, C. W. Chen, M. H. Chan, Y. C. Chang, W. M. Chang, L. H. Chi, H. M. Yu, Y. F. Lin, D. P. Tsai, R. S. Liu and M. Hsiao, Biosens. Bioelectron., 2016, 80, 131–139 CrossRef CAS PubMed.
- K. Zhang, L. Yang, F. Lu, X. Wu and J. J. Zhu, Small, 2018, 14, 1–11 Search PubMed.
- S. Wu, X. J. Kong, Y. Cen, J. Yuan, R. Q. Yu and X. Chu, Nanoscale, 2016, 8, 8939–8946 RSC.
- B. Si, Y. Wang, S. Lu, E. Liu, X. Hu and J. Fan, RSC Adv., 2016, 6, 92428–92433 RSC.
- L. Liu, H. Zhang, D. Song and Z. Wang, Analyst, 2018, 143, 761–767 RSC.
- T. Liang, Z. Li, P. Wang, F. Zhao, J. Liu and Z. Liu, J. Am. Chem. Soc., 2018, 140, 14696–14703 CrossRef CAS PubMed.
- X. Mou, J. Wang, X. Meng, J. Liu, L. Shi and L. Sun, J. Lumin., 2017, 190, 16–22 CrossRef CAS.
- L. He, L. Yang, H. Zhu, W. Dong, Y. Ding and J.-J. Zhu, Methods Appl. Fluoresc., 2017, 5, 024010 CrossRef PubMed.
- Z. Yang, K. Y. Loh, Y. Te Chu, R. Feng, N. S. R. Satyavolu, M. Xiong, S. M. Nakamata Huynh, K. Hwang, L. Li, H. Xing, X. Zhang, Y. R. Chemla, M. Gruebele and Y. Lu, J. Am. Chem. Soc., 2018, 140, 17656–17665 CrossRef CAS PubMed.
- J. Xu, F. He, Z. Cheng, R. Lv, Y. Dai, A. Gulzar, B. Liu, H. Bi, D. Yang, S. Gai, P. Yang and J. Lin, Chem. Mater., 2017, 29, 7615–7628 CrossRef CAS.
- F. Wang, C. Zhang, X. Qu, S. Cheng and Y. Xian, Biosens. Bioelectron., 2019, 126, 96–101 CrossRef CAS PubMed.
- J. Zhao, J. Gao, W. Xue, Z. Di, H. Xing, Y. Lu and L. Li, J. Am. Chem. Soc., 2018, 140, 578–581 CrossRef CAS PubMed.
- Z. Meng, S. Wu, L. Zhong, M. Zeng, X. Sun, L. Li and S. Zhang, RSC Adv., 2018, 8, 38075–38080 RSC.
- Q. Yan, X. Y. Ding, Z. H. Chen, S. F. Xue, X. Y. Han, Z. Y. Lin, M. Yang, G. Shi and M. Zhang, Anal. Chem., 2018, 90, 10536–10542 CrossRef CAS PubMed.
- Q. Yan, Z. H. Chen, S. F. Xue, X. Y. Han, Z. Y. Lin, S. Zhang, G. Shi and M. Zhang, Sens. Actuators, B, 2018, 268, 108–114 CrossRef CAS.
- Q. Li, J. Bai, S. Ren, J. Wang, Y. Gao, S. Li, Y. Peng, B. Ning and Z. Gao, Anal. Bioanal. Chem., 2019, 411, 171–179 CrossRef CAS PubMed.
- S. Cao, Z. Li, J. Zhao, M. Chen and N. Ma, ACS Sens., 2018, 3, 1522–1530 CrossRef CAS PubMed.
- R. Gao, L. Xu, C. Hao, C. Xu and H. Kuang, Angew. Chem., Int. Ed., 2019, 58, 3913–3917 CrossRef CAS PubMed.
- R. Wei, Z. Wei, L. Sun, J. Z. Zhang, J. Liu, X. Ge and L. Shi, ACS Appl. Mater. Interfaces, 2016, 8, 400–410 CrossRef CAS PubMed.
- J. Peng, C. L. Teoh, X. Zeng, A. Samanta, L. Wang, W. Xu, D. Su, L. Yuan, X. Liu and Y. T. Chang, Adv. Funct. Mater., 2016, 26, 191–199 CrossRef CAS.
- X. Ge, L. Sun, B. Ma, D. Jin, L. Dong, L. Shi, N. Li, H. Chen and W. Huang, Nanoscale, 2015, 7, 13877–13887 RSC.
- M. Y. Liang, B. Zhao, Y. Xiong, W. X. Chen, J. Z. Huo, F. Zhang, L. Wang and Y. Li, Dalton Trans., 2019, 48, 16199–16210 RSC.
- J. Yuan, Y. Cen, X. J. Kong, S. Wu, C. L. Liu, R. Q. Yu and X. Chu, ACS Appl. Mater. Interfaces, 2015, 7, 10548–10555 CrossRef CAS PubMed.
- Y. Cen, J. Tang, X. J. Kong, S. Wu, J. Yuan, R. Q. Yu and X. Chu, Nanoscale, 2015, 7, 13951–13957 RSC.
- J. Lv, S. Zhao, S. Wu and Z. Wang, Biosens. Bioelectron., 2017, 90, 203–209 CrossRef CAS PubMed.
- P. Jiang, M. He, L. Shen, A. Shi and Z. Liu, Sens. Actuators, B, 2017, 239, 319–324 CrossRef CAS.
- Y. Xu, X. Meng, J. Liu, S. Dang, L. Shi and L. Sun, CrystEngComm, 2016, 18, 4032–4037 RSC.
- P. Alonso-Cristobal, P. Vilela, A. El-Sagheer, E. Lopez-Cabarcos, T. Brown, O. L. Muskens, J. Rubio-Retama and A. G. Kanaras, ACS Appl. Mater. Interfaces, 2015, 7, 12422–12429 CrossRef CAS PubMed.
- P.-D. Nguyen, V. T. Cong, C. Baek and J. Min, Nanotechnology, 2016, 27, 405101 CrossRef PubMed.
- H. Chen, X. Pang, Z. Ni, M. Liu, Y. Zhang and S. Yao, Anal. Chim. Acta, 2020, 1095, 146–153 CrossRef CAS PubMed.
- Y. Han, L. Shen, Z. Li and Z. Liu, Anal. Methods, 2018, 10, 3933–3938 RSC.
- Z. Wu and B. Cui, Microchim. Acta, 2019, 186, 555 CrossRef PubMed.
- H. Zhu, F. Lu, X. C. Wu and J. J. Zhu, Analyst, 2015, 140, 7622–7628 RSC.
- Q. Long, J. Zhao, B. Yin, H. Li, Y. Zhang and S. Yao, Anal. Biochem., 2015, 477, 28–34 CrossRef CAS PubMed.
- S. Wu, N. Duan, X. Li, G. Tan, X. Ma, Y. Xia, Z. Wang and H. Wang, Talanta, 2013, 116, 611–618 CrossRef CAS PubMed.
- S. Wu, N. Duan, Z. Shi, C. Fang and Z. Wang, Talanta, 2014, 128, 327–336 CrossRef CAS PubMed.
- A. Fang, H. Chen, H. Li, M. Liu, Y. Zhang and S. Yao, Biosens. Bioelectron., 2017, 87, 545–551 CrossRef CAS PubMed.
- Y. Liu, Q. Ouyang, H. Li, M. Chen, Z. Zhang and Q. Chen, J. Agric. Food Chem., 2018, 66, 6188–6195 CrossRef CAS PubMed.
- Y. Ma, L. Zhang, L. Wang, L. Wang and H. Chen, Anal. Methods, 2017, 9, 2977–2982 RSC.
- M. Chen, M. Hassan, H. Li and Q. Chen, Microchim. Acta, 2020, 187, 85 CrossRef CAS PubMed.
- N. Duan, S. Wu, C. Zhu, X. Ma, Z. Wang, Y. Yu and Y. Jiang, Anal. Chim. Acta, 2012, 723, 1–6 CrossRef CAS PubMed.
- S. Wu, N. Duan, C. Zhu, X. Ma, M. Wang and Z. Wang, Biosens. Bioelectron., 2011, 30, 35–42 CrossRef CAS PubMed.
- M. Yin, C. Jing, H. Li, Q. Deng and S. Wang, J. Nanobiotechnol., 2020, 18, 1–14 CrossRef PubMed.
- J. Kim, J. H. Kwon, J. Jang, H. Lee, S. Kim, Y. K. Hahn, S. K. Kim, K. H. Lee, S. Lee, H. Pyo, C. S. Song and J. Lee, Biosens. Bioelectron., 2018, 112, 209–215 CrossRef CAS PubMed.
- H. He, B. Liu, S. Wen, J. Liao, G. Lin, J. Zhou and D. Jin, Anal. Chem., 2018, 90, 12356–12360 CrossRef CAS PubMed.
- X. Huang, J. Song, B. C. Yung, X. Huang, Y. Xiong and X. Chen, Chem. Soc. Rev., 2018, 47, 2873–2920 RSC.
- R. Gui, H. Jin, X. Bu, Y. Fu, Z. Wang and Q. Liu, Coord. Chem. Rev., 2019, 383, 82–103 CrossRef CAS.
- Y. Liu, Q. Ouyang, H. Li, Z. Zhang and Q. Chen, ACS Appl. Mater. Interfaces, 2017, 9, 18314–18321 CrossRef CAS PubMed.
- C. Li, J. Zuo, L. Zhang, Y. Chang, Y. Zhang, L. Tu, X. Liu, B. Xue, Q. Li, H. Zhao, H. Zhang and X. Kong, Sci. Rep., 2016, 6, 1–9 CrossRef PubMed.
- Q. Mei, W. Deng, W. Yisibashaer, H. Jing, G. Du, M. Wu, B. N. Li and Y. Zhang, Small, 2015, 11, 4568–4575 CrossRef CAS PubMed.
- R. Zhang, L. Liang, Q. Meng, J. Zhao, H. T. Ta, L. Li, Z. Zhang, Y. Sultanbawa and Z. P. Xu, Small, 2019, 15, 1–11 Search PubMed.
- L. Liu, H. Zhang, Z. Wang and D. Song, Biosens. Bioelectron., 2019, 141, 111403 CrossRef CAS PubMed.
- Z. Chen, Z. Liu, Z. Li, E. Ju, N. Gao, L. Zhou, J. Ren and X. Qu, Biomaterials, 2015, 39, 15–22 CrossRef CAS PubMed.
- Y. Ding, H. Zhu, X. Zhang, J.-J. J. Zhu and C. Burda, Chem. Commun., 2013, 49, 7797 RSC.
- H. Wang, Y. Li, M. Yang, P. Wang and Y. Gu, ACS Appl. Mater. Interfaces, 2019, 11, 7441–7449 CrossRef CAS PubMed.
- M. Chen, F. Y. H. Kutsanedzie, W. Cheng, H. Li and Q. Chen, Microchem. J., 2019, 144, 296–302 CrossRef.
- H. Chen, Z. Zhou, Q. Lu, C. Wu, M. Liu, Y. Zhang and S. Yao, Anal. Chim. Acta, 2019, 1051, 160–168 CrossRef CAS PubMed.
- C. Liu, Y. Yu, D. Chen, J. Zhao, Y. Yu, L. Li and Y. Lu, Nanoscale Adv., 2019, 1, 2580–2585 RSC.
- H. Xiong, Q. Min, H. Ma, L. Zhao, W. Chen, J. Qiu, X. Yu and X. Xu, J. Rare Earths, 2019, 37, 339–344 CrossRef CAS.
- L. Liu, S. Wang, B. Zhao, P. Pei, Y. Fan, X. Li and F. Zhang, Angew. Chem., Int. Ed., 2018, 57, 7518–7522 CrossRef CAS PubMed.
- X. Wang, S. Wang, K. Huang, Z. Liu, Y. Gao and W. Zeng, Sens. Actuators, B, 2017, 241, 1188–1193 CrossRef CAS.
- H. Li, H. Dong, M. Yu, C. Liu, Z. Li, L. Wei, L. D. Sun and H. Zhang, Anal. Chem., 2017, 89, 8863–8869 CrossRef CAS PubMed.
- A. Fang, Q. Wu, Q. Lu, H. Chen, H. Li, M. Liu, Y. Zhang and S. Yao, Biosens. Bioelectron., 2016, 86, 664–670 CrossRef CAS PubMed.
- S. Zhao, F. Wu, Y. Zhao, Y. Liu and L. Zhu, J. Photochem. Photobiol., A, 2016, 319–320, 53–61 CrossRef CAS.
- T. Ma, Y. Ma, S. Liu, L. Zhang, T. Yang, H. R. Yang, W. Lv, Q. Yu, W. Xu, Q. Zhao and W. Huang, J. Mater. Chem. C, 2015, 3, 6616–6620 RSC.
- W. Lv, T. Yang, Q. Yu, Q. Zhao, K. Y. Zhang, H. Liang, S. Liu, F. Li and W. Huang, Adv. Sci., 2015, 2, 1–9 Search PubMed.
- L. Zhao, J. Peng, M. Chen, Y. Liu, L. Yao, W. Feng and F. Li, ACS Appl. Mater. Interfaces, 2014, 6, 11190–11197 CrossRef CAS PubMed.
- T. Zeng, T. Zhang, W. Wei, Z. Li, D. Wu, L. Wang, J. Guo, X. He and N. Ma, ACS Appl. Mater. Interfaces, 2015, 7, 11849–11856 CrossRef CAS PubMed.
- H. Zhu, Y. Ding, A. Wang, X. Sun, X. C. Wu and J. J. Zhu, J. Mater. Chem. B, 2015, 3, 458–464 RSC.
- X. Hu, T. Wei, J. Wang, Z.-E. E. Liu, X. Li, B. Zhang, Z. Li, L. Li and Q. Yuan, Anal. Chem., 2014, 86, 10484–10491 CrossRef CAS PubMed.
- S. Liu, Y. Li, C. Zhang, L. Yang, T. Zhao, R. Zhang and C. Jiang, J. Colloid Interface Sci., 2017, 493, 10–16 CrossRef CAS PubMed.
- Y. Guan, S. Qu, B. Li, L. Zhang, H. Ma and L. Zhang, Biosens. Bioelectron., 2016, 77, 124–130 CrossRef CAS PubMed.
- Y. X. Wu, X. B. Zhang, D. L. Zhang, C. C. Zhang, J. Bin Li, Y. Wu, Z. L. Song, R. Q. Yu and W. Tan, Anal. Chem., 2016, 88, 1639–1646 CrossRef CAS PubMed.
- J. Peng, W. Xu, C. L. Teoh, S. Han, B. Kim, A. Samanta, J. C. Er, L. Wang, L. Yuan, X. Liu and Y. T. Chang, J. Am. Chem. Soc., 2015, 137, 2336–2342 CrossRef CAS PubMed.
- S. Xu, B. Dong, D. Zhou, Z. Yin, S. Cui, W. Xu, B. Chen and H. Song, Sci. Rep., 2016, 6, 1–9 CrossRef PubMed.
- X. Jiang and G. Meng, J. Lumin., 2013, 135, 227–231 CrossRef CAS.
- Y. Liu, M. Chen, T. Cao, Y. Sun, C. Li, Q. Liu, T. Yang, L. Yao, W. Feng and F. Li, J. Am. Chem. Soc., 2013, 135, 9869–9876 CrossRef CAS PubMed.
- M. H. Chan, C. Y. Lai, Y. C. Chan, M. Hsiao, R. J. Chung, X. Chen and R. S. Liu, Nanomedicine, 2019, 14, 1791–1804 CrossRef CAS PubMed.
- Z. Chen, X. Wu, S. Hu, P. Hu, H. Yan, Z. Tang and Y. Liu, J. Mater. Chem. C, 2015, 3, 153–161 RSC.
- C. Li, J. Liu, S. Alonso, F. Li and Y. Zhang, Nanoscale, 2012, 4, 6065 RSC.
- N. Wang, X. Yu, K. Zhang, C. A. Mirkin and J. Li, J. Am. Chem. Soc., 2017, 139, 12354–12357 CrossRef CAS PubMed.
- T. T. T. Nguyen, B. T. Huy, S. M. Tawfik, G. Zayakhuu, H. H. Cho and Y. I. Lee, Arabian J. Chem., 2020, 13, 2671–2679 CrossRef CAS.
- J.-N. Liu, W.-B. Bu and J.-L. Shi, Acc. Chem. Res., 2015, 48, 1797–1805 CrossRef CAS PubMed.
- X. Liu, S. Q. Zhang, X. Wei, T. Yang, M. L. Chen and J. H. Wang, Biosens. Bioelectron., 2018, 109, 150–155 CrossRef CAS PubMed.
- J. Liu, J. Cheng and Y. Zhang, Biosens. Bioelectron., 2013, 43, 252–256 CrossRef CAS PubMed.
- G. Crini, Chem. Rev., 2014, 114, 10940–10975 CrossRef CAS PubMed.
- Y. C. Yeh, B. Creran and V. M. Rotello, Nanoscale, 2012, 4, 1871–1880 RSC.
- Q. Wu, H. Chen, A. Fang, X. Wu, M. Liu, H. Li, Y. Zhang and S. Yao, ACS Sens., 2017, 2, 1805–1813 CrossRef CAS PubMed.
- B. Jin, S. Wang, M. Lin, Y. Jin, S. Zhang, X. Cui, Y. Gong, A. Li, F. Xu and T. J. Lu, Biosens. Bioelectron., 2017, 90, 525–533 CrossRef CAS PubMed.
- M. K. Tsang, Y. T. Wong, T. H. Tsoi, W. T. Wong and J. Hao, Adv. Healthcare Mater., 2019, 8, 1–8 Search PubMed.
- X. Li, L. Wei, L. Pan, Z. Yi, X. Wang, Z. Ye, L. Xiao, H. W. Li and J. Wang, Anal. Chem., 2018, 90, 4807–4814 CrossRef CAS PubMed.
- S. Zhang, J. Wang, W. Xu, B. Chen, W. Yu, L. Xu and H. Song, J. Lumin., 2014, 147, 278–283 CrossRef CAS.
- X. H. Li, W. M. Sun, J. Wu, Y. Gao, J. H. Chen, M. Chen and Q. S. Ou, Anal. Methods, 2018, 10, 1552–1559 RSC.
- M. Wu, X. Wang, K. Wang and Z. Guo, Chem. Commun., 2016, 52, 8377–8380 RSC.
- Z. Wu, D. He and B. Cui, Microchim. Acta, 2018, 185, 1–8 CrossRef PubMed.
- J. Liu, S. Xu, L. Sun, S. Hu, J. Sun, M. Liu, C. Ma, H. Liu, Z. Wang, Y. Yang, B. Dong and D. Hong, J. Rare Earths, 2019, 37, 943–948 CrossRef CAS.
- S. Nasir, M. Hussein, Z. Zainal and N. Yusof, Materials, 2018, 11, 295 CrossRef PubMed.
- W. Yang, K. R. Ratinac, S. P. Ringer, P. Thordarson, J. J. Gooding and F. Braet, Angew. Chem., Int. Ed., 2010, 49, 2114–2138 CrossRef CAS PubMed.
- H. Li, D. En Sun, Y. Liu and Z. Liu, Biosens. Bioelectron., 2014, 55, 149–156 CrossRef CAS PubMed.
- Y. M. Wu, Y. Cen, L. J. Huang, R. Q. Yu and X. Chu, Chem. Commun., 2014, 50, 4759–4762 RSC.
- H. Rabie, Y. Zhang, N. Pasquale, M. J. Lagos, P. E. Batson and K. B. Lee, Adv. Mater., 2019, 31, 1–8 Search PubMed.
- X. Jin, G. Fang, M. Pan, Y. Yang, X. Bai and S. Wang, Biosens. Bioelectron., 2018, 102, 357–364 CrossRef CAS PubMed.
- M. He and Z. Liu, Anal. Chem., 2013, 85, 11691–11694 CrossRef CAS PubMed.
- T. Guo, Q. Deng, G. Fang, Y. Yun, Y. Hu and S. Wang, Biosens. Bioelectron., 2016, 85, 596–602 CrossRef CAS PubMed.
- M. Chern, J. C. Kays, S. Bhuckory and A. M. Dennis, Methods Appl. Fluoresc., 2019, 7, 012005 CrossRef CAS PubMed.
- J. Goicoechea, F. J. Arregui and I. R. Matias, in Sensors Based on Nanostructured Materials, Springer US, Boston, MA, 2009, pp. 1–51 Search PubMed.
- S. Doughan, U. Uddayasankar and U. J. Krull, Anal. Chim. Acta, 2015, 878, 1–8 CrossRef CAS PubMed.
- S. Xu, S. Xu, Y. Zhu, W. Xu, P. Zhou, C. Zhou, B. Dong and H. Song, Nanoscale, 2014, 6, 12573–12579 RSC.
- S. Xu, Y. Zhang, X. Li, J. Zhang, J. Sun, L. Cheng and B. Chen, J. Rare Earths, 2017, 35, 460–467 CrossRef CAS.
- L. Gloag, M. Mehdipour, D. Chen, R. D. Tilley and J. J. Gooding, Adv. Mater., 2019, 31, 1904385 CrossRef CAS PubMed.
- J. Kudr, Y. Haddad, L. Richtera, Z. Heger, M. Cernak, V. Adam and O. Zitka, Nanomaterials, 2017, 7, 243 CrossRef PubMed.
- J. J. BelBruno, Chem. Rev., 2019, 119, 94–119 CrossRef CAS PubMed.
- Z. Yan and G. Zhen Fang, J. Cent. South Univ., 2019, 26, 515–523 CrossRef CAS.
- T. Guo, Q. Deng, G. Fang, D. Gu, Y. Yang and S. Wang, Biosens. Bioelectron., 2016, 79, 341–346 CrossRef CAS PubMed.
- X. Liu, J. Ren, L. Su, X. Gao, Y. Tang, T. Ma, L. Zhu and J. Li, Biosens. Bioelectron., 2017, 87, 203–208 CrossRef CAS PubMed.
- M. Zarei, TrAC, Trends Anal. Chem., 2017, 91, 26–41 CrossRef CAS.
- Q. Ju, U. Uddayasankar and U. Krull, Small, 2014, 10, 3912–3917 CrossRef CAS PubMed.
- A. Ozcan, Lab Chip, 2014, 14, 3187–3194 RSC.
- D. Erickson, D. O'Dell, L. Jiang, V. Oncescu, A. Gumus, S. Lee, M. Mancuso and S. Mehta, Lab Chip, 2014, 14, 3159–3164 RSC.
- P. L. A. Corstjens, M. Zuiderwijk, M. Nilsson, H. Feindt, R. Sam Niedbala and H. J. Tanke, Anal. Biochem., 2003, 312, 191–200 CrossRef CAS PubMed.
- C. Liu, W. Ma, Z. Gao, J. Huang, Y. Hou, C. Xu, W. Yang and M. Gao, J. Mater. Chem. C, 2014, 2, 9637–9642 RSC.
- P. Corstjens, M. Zuiderwijk, A. Brink, S. Li, H. Feindt, R. S. Niedbala and H. Tanke, Clin. Chem., 2001, 47, 1885–1893 CrossRef CAS.
- P. Zhao, Y. Wu, Y. Zhu, X. Yang, X. Jiang, J. Xiao, Y. Zhang and C. Li, Nanoscale, 2014, 6, 3804–3809 RSC.
- J. Hampl, M. Hall, N. A. Mufti, Y. M. Yao, D. B. MacQueen, W. H. Wright and D. E. Cooper, Anal. Biochem., 2001, 288, 176–187 CrossRef CAS PubMed.
- M. You, M. Lin, Y. Gong, S. Wang, A. Li, L. Ji, H. Zhao, K. Ling, T. Wen, Y. Huang, D. Gao, Q. Ma, T. Wang, A. Ma, X. Li and F. Xu, ACS Nano, 2017, 11, 6261–6270 CrossRef CAS PubMed.
- S. Cui, S. Xu, H. Song, W. Xu, X. Chen, S. Zhou, Z. Yin and W. Han, RSC Adv., 2015, 5, 99099–99106 RSC.
| This journal is © The Royal Society of Chemistry 2021 |