
 Open Access Article
 This Open Access Article is licensed under a Creative Commons Attribution-Non Commercial 3.0 Unported Licence
The interaction of size-selected Ru3 clusters with RF-deposited TiO2: probing Ru–CO binding sites with CO-temperature programmed desorption†
Liam
Howard-Fabretto
ab,
Timothy J.
Gorey
c,
Guangjing
Li
c,
Siriluck
Tesana
d,
Gregory F.
Metha
 e,
Scott L.
Anderson
c and
Gunther G.
Andersson
*ab
e,
Scott L.
Anderson
c and
Gunther G.
Andersson
*ab
aFlinders Institute for Nanoscale Science and Technology, Flinders University, Adelaide, South Australia 5042, Australia. E-mail: gunther.andersson@flinders.edu.au
bFlinders Microscopy and Microanalysis, College of Science and Engineering, Flinders University, Adelaide, South Australia 5042, Australia
cChemistry Department, University of Utah, 315 S. 1400 E., Salt Lake City, UT 84112, USA
dThe MacDiarmid Institute for Advanced Materials and Nanotechnology, School of Physical and Chemical Sciences, University of Canterbury, Christchurch 8141, New Zealand
eDepartment of Chemistry, University of Adelaide, Adelaide, South Australia 5005, Australia
First published on 26th April 2021
Abstract
Small Ru clusters are efficient catalysts for chemical reactions such as CO hydrogenation. In this study 3-atom Ru3 clusters were deposited onto radio frequency (RF)-deposited TiO2 which is an inexpensive, nanoparticulate form of TiO2. TiO2 substrates are notable in that they form strong metal–substrate interactions with clusters. Using temperature programmed desorption to probe Ru–CO binding sites, and X-ray photoelectron spectroscopy to provide chemical information on clusters, differences in cluster–support interactions were studied for Ru3 deposited using both an ultra-high vacuum cluster source and chemical vapour deposition of Ru3(CO)12. The TiO2 was treated with different Ar+ sputter doses prior to cluster depositions, and SiO2 was also used as a comparison substrate. For cluster source-deposited Ru3, heating to 800 K caused cluster agglomeration on SiO2 and oxidation on non-sputtered TiO2. For cluster source-deposited Ru3 on sputtered TiO2 substrates, all Ru–CO binding sites were blocked as-deposited and it was concluded that for the binding sites to be preserved for potential catalytic benefit, sputtering of TiO2 before cluster deposition cannot be applied. Conversely, for Ru3(CO)12 on sputtered TiO2 the clusters were protected by their ligands and Ru–CO binding sites were only blocked once the sample was heated to 723 K. The mechanism for complete blocking of CO sites on sputtered TiO2 could not be directly determined; however, comparisons to the literature indicate that the likely reasons for blocking of the CO adsorption sites are encapsulation into the TiOx layer reduced through sputtering and also partial oxidation of the Ru clusters.
Introduction
Metal clusters are generally defined as groups of metal atoms with sizes less than ∼300 atoms.1–6 They often possess unique electronic and catalytic properties which are highly tuneable, such that the addition or subtraction of just one atom to a small cluster can be a deciding factor on whether it functions as a catalyst or not.7 For this reason, experiments often focus on a single cluster size. Ru clusters in particular have been shown to be among the most active catalysts for industrial and environmentally relevant reactions such as CO and CO2 hydrogenation.8–17 Two of the main ways to deposit Ru clusters onto substrates is through the preparation of bare clusters in vacuum using an ultra-high vacuum (UHV) cluster source, or through depositing ligand-stabilized clusters such as Ru3(CO)12 using chemical vapour deposition (CVD)18–22 or a solution-based deposition.23 This process of depositing metal carbonyl compounds using CVD is well explored in the literature and has been used to deposit clusters onto a number of substrates such as; metals (e.g. Au), metal oxides (e.g. TiO2), non-metal oxides (e.g. SiO2) and others such as zeolites.19,24–29 When depositing ligand-stabilized clutters, extra post-deposition surface treatments such as heating are needed to remove the ligands if bare metal clusters are desired on the substrate.TiO2 is a photocatalytically active substrate30 and is a common choice as a substrate for the deposition of clusters.19,20,31–43 Here we used RF-deposited TiO2 as a substrate. It is a nanoparticulate form of TiO2 made by radio frequency (RF) sputtering a TiO2 wafer onto a substrate (sputter deposition) under UHV, in the present case Si(100). This process produces a dense, uniform, stoichiometry-controlled layer of TiO2 more cheaply and readily than TiO2(110).44 RF-deposited TiO2 is polycrystalline and does not have a surface as flat as a single crystal. RF-deposited TiO2 does, however, more closely reflect the situation of TiO2 as used in a real catalyst than single crystal samples. Our previous studies have shown RF-deposited TiO2 does not feature X-ray diffraction peaks related to a specific crystal phase prior to heat treatment, however heating under vacuum or atmosphere results in anatase phase formation, and strong heating to 1373 K for 18 hours under atmosphere results in the emergence of a rutile crystal peak in addition to anatase.45
A key problem of clusters deposited onto surfaces is maintaining the properties of size-selected clusters by preventing them from agglomeration, in particular at elevated temperatures.46 One method to help with this is to induce defects on the substrate surface prior to cluster deposition.47,48 Clusters are known to preferentially bind to defect sites, as their surface energy is greater than the corresponding perfect crystal structure.48 As a specific example regarding TiO2 substrates, a study by Krishnan et al.48 showed that for Au9 clusters supported on atomic layer deposited (ALD) TiO2, sputter-treating the surface with Ar+ prior to cluster deposition was able to help prevent cluster agglomeration. The anchoring of clusters to defect sites on TiO2 has also been demonstrated by DFT calculations of Au clusters on TiO2(110).49 However, the cluster–substrate interaction, and therefore agglomeration characteristics, will be different for each cluster/substrate combination.
There are two main types of defects: oxygen vacancies and interstitial titanium ions30 both resulting in the presence of Ti3+ in the TiO2. The transport of each in the substrate can be explained by vacancy and interstitial models respectively.30,50–52 Interstitials are atoms present within crystal lattice locations where they should not normally be present. Ar+ sputter treatment of TiO2 removes O atoms more preferentially than Ti atoms from the surface, and the main surface defect sites from sputtering are predominantly vacancies in the bridging oxygen rows of the TiO2.30,53 These defect sites act as electron donors to clusters because the oxygen removal leaves behind two electrons which previously occupied O2p valence band levels.30,54
Previous studies on the effects of heating systems of small, size-selected Ru clusters on TiO2 have often focussed on Ru deposited using Ru3(CO)12: two separate studies by Zhao et al. and Rizzi et al.18,19 have been performed on Ru3(CO)12 deposited by CVD onto TiO2(110), using X-ray photoelectron spectroscopy (XPS) and/or CO-temperature programmed desorption (CO-TPD). Both studies found that there is partial decomposition of Ru3(CO)12 when deposited onto room-temperature TiO2(110).18,19 Furthermore, Zhao et al.19 demonstrated using XPS and TPD that heating to 700 K under UHV yielded almost pure Ru particles on the surface, but heating to 600 K while dosing O2 resulted in oxidised Ru. The latter point was also supported in the Rizzi et al. study using XPS.18 The specific cluster–substrate interaction can have a large effect on the state of supported clusters, even for differing forms of TiO2; CO-TPD spectra have been shown to have different CO desorption features for Ru3(CO)12 deposited onto varying forms of TiO2, such as TiO2(110),19 polycrystalline P25 TiO2,23 and TiO2/Mo(110).20 Other studies have used differing Ru/TiO2 systems with different thermal stability results, including one study by Komaya et al.55 for large Ru particles deposited with Ru(NO)(NO3)3 onto P25 nanocrystalline TiO2, where heating to 573 K resulted in the encapsulation of Ru by an amorphous titania layer. These studies show that it is unclear how Ru clusters interact with the substrate when deposited onto titania, in particular when heating of the cluster/substrate system is involved. It is therefore important to test the interaction and stability of Ru clusters on RF-deposited TiO2 because studies performed on differing TiO2 forms cannot predict the results for this substrate. Of particular interest is agglomeration of the clusters and encapsulation into the substrate.
The aim of this study was to determine whether defects induced in RF-deposited TiO2 substrates help to avoid agglomeration of bare Ru3 and Ru3(CO)12 clusters upon deposition, and how the clusters interact with TiO2 substrates upon heating to ∼800 K. The clusters were deposited both from a cluster source (bare Ru3) and evaporation of Ru3(CO)12via chemical vapour deposition (CVD). To the knowledge of the authors no previous studies exist for size-selected Ru deposited by a cluster source onto TiO2, and thus comparison between the results of these two common deposition methods is of critical importance. CO-TPD is used to probe the available CO adsorption sites on the metal clusters, as well as for probing the removal of ligands with heating in the case of CO-stabilized clusters.19,20,56–60 XPS is used to analyse the composition of the surface and to determine concentration depth profiles.
Methodology
Materials
P-type, boron-doped Si(100) wafers were purchased from MTI Corporation and used without further modification. RF-deposited TiO2 substrates (referred to as TiO2) were prepared by RF magnetron-sputtering using a 99.9% pure TiO2 ceramic target, where TiO2 is deposited via sputtering of the target onto a substrate, in this case a Si(100) wafer. This was under high vacuum using an HHV/Edwards TF500 Sputter Coater at a pressure <2 × 10⁻⁵ mbar, using 10 sccm Ar for sputtering the TiO2 surface. The power was ramped up at 50 W per minute to 500 W, and a shutter was then removed from the target for 50 minutes, allowing the deposition of material onto the rotating wafer. The thickness of the TiO2 was approximately 150 nm, which is thick enough that the SiO2 wafer beneath would not be detectable in the electron spectra. This thickness was estimated based on SEM measurements previously performed on wafers prepared using similar methodology on the same apparatus.45Clusters were prepared by depositions using (i) chemical vapour deposition (CVD) of ligated clusters and (ii) depositing bare clusters from a gas phase cluster source (CS). CVD depositions were performed with Ru3(CO)12; this was prepared as a powdered sample, according to synthesis procedures reported by Faure et al.61 CVD depositions were performed under UHV in a separate instrument for CO-TPD and XPS analysis. CS depositions were performed by a laser ablation cluster source which has been used and described in several previous publications.58,60,62 For cluster source-deposition of bare Ru3 clusters, the source was a 99.9% pure target of Ru.
Substrates and samples
Ru3 was deposited onto four different types of substrates: two TiO2 substrates modified by Ar+ sputter treatment (prior to the deposition of Ru clusters) at two different Ar+ doses, non-sputtered TiO2, and non-sputtered SiO2 for comparison. The different sputter dosages for TiO2 have been designated as follows: “low-dose sputtered TiO2” was treated with 4 × 10¹³ Ar+/cm2, and “high-dose sputtered TiO2” was treated with 6 × 10¹⁴ Ar+/cm2. Additionally, a “non-sputtered TiO2” sample was used. In the text these will be abbreviated to LDS-TiO2, HDS-TiO2, and NS-TiO2, respectively. A list of the substrates and their abbreviated names are given in Table 1. Deposition of Ru3 from CS was performed on all 4 substrates. However, deposition of Ru3(CO)12 from CVD was only undertaken on an HDS-TiO2 substrate. Clusters deposited by CS will herein be referred to as “Ru3”, while clusters deposited by CVD will be referred to as “Ru3(CO)12”. 5 samples were analysed with CO-TPD overall, and blank measurements CO-TPD were performed prior to the deposition of Ru clusters. Additional samples were prepared for further XPS analysis, and thus the XPS measurements in some cases were of samples prepared with an identical method, rather than the same sample as was analysed with CO-TPD. A list of all samples analysed is given in the ESI (Table S1†).| Substrate material | Ar+ sputter dose (Ar+/cm2) | Designated sample name | Abbreviated name |
|---|---|---|---|
| TiO2 | None | Non-sputtered TiO2 | NS-TiO2 |
| TiO2 | 4 × 10¹³ | Low-dose sputtered TiO2 | LDS-TiO2 |
| TiO2 | 6 × 10¹⁴ | High-dose sputtered TiO2 | HDS-TiO2 |
| SiO2/Si(100) | None | SiO2 | SiO2 |
Instrumentation
CS depositions, as well as XPS, CO-TPD, and Ar+ sputter treatment were performed using a UHV apparatus with a main chamber base pressure of <2 × 10⁻¹⁰ mbar at the University of Utah. All CS measurements and analysis were performed on this apparatus (i.e. all measurements except CVD depositions and the XPS of metallic Ru reference material, which are described separately). Samples were stored in the main chamber when depositing clusters using the cluster source. The instrument featured liquid N2 cooling and resistive heating. A C-type thermocouple was spot welded to the backing plate of the sample holder to monitor the temperature. The instrument includes capabilities for continuous temperature control and automatic, linear temperature ramping, and soft landing of small metal clusters. A soft-landing deposition energy of ∼1 eV per atom was used for the Ru3 clusters. Previous studies of the deposition of small Ir clusters onto TiO2 and SiO2 showed that impact energies in the tens of eV per atom are required to embed the clusters into these substrates (e.g. at least 10 eV per atom for small Ir clusters on TiO2).63,64 Thus, the ∼1 eV per atom deposition energy is considered suitable to not cause Ru cluster damage or embedding during depositions. Further details on the CS instrument and depositions are provided in the ESI.†The chemical vapor deposition (CVD) of ligated Ru3(CO)12 clusters was performed using a UHV apparatus at Flinders University in Adelaide. The substrates were prepared in a main chamber featuring a base pressure of <2 × 10⁻¹⁰ mbar, which included electron bombardment heating and Ar+ sputter treatment. Chemical vapour depositions (CVD) of ligated Ru3(CO)12 clusters were performed ex situ in a separate loading chamber, with a base pressure of <8 × 10⁻⁸ mbar. Further details on the CVD process are provided in the ESI.† These samples were transported from Flinders University to the University of Utah for CO-TPD analysis.
The Utah and Adelaide instruments use different sputter guns; the substrates for the CVD sample (Adelaide) was prepared using 3 keV Ar+, while the substrates for the CS samples (Utah) were prepared using 2 keV Ar+. The defects may extend deeper into the bulk for the CVD sample due to the higher Ar+ impact energy.33,34 This was not corrected for, and a slight variation in defects on the substrate was deemed not to be of critical importance for this experiment.
CO-temperature programmed desorption (CO-TPD)
CO-TPD is used to investigate the desorption of CO molecules from the various samples. CO molecules are typically first dosed onto a sample under UHV, but the technique can also be used to analyse the de-ligation of CO–ligated clusters such as Ru3(CO)12, where CO does not need to be dosed prior to measurements.12,19,20 When the CO dosing and temperature ramping procedure is repeated for multiple cycles, CO-TPD can show the effect of heating on the available CO binding sites on the surface, which can give insights into cluster/substrate interactions.For CO-TPD measurements (excluding CO de-ligation), the sample was dosed with isotopically labelled 13CO (mass 29) at 180 K. They were exposed to 10 L 13CO, which was above the saturation dose. CO exposure was through a dosing tube which terminated approximately 2 cm from the surface of the substrate; this increased the gas flux at the surface by a factor of approximately 10 compared to dosing the gas into the chamber without the tube. This increase factor was determined previously as per the method described by Kaden et al.56
For each substrate, CO-TPD measurements were performed before and after CS cluster depositions. After a deposition, the CO procedure was initiated as quickly as practicably possible. This is for all samples except the CVD sample which was not deposited in situ. The standard procedure for CO-TPD cycle is as follows. After CO dosing, the sample was positioned at a distance of 0.5 mm from the differentially pumped quadrupole mass spectrometer (QMS) entrance, which is a 2.5 mm diameter aperture in a skimmer cone. The temperature was then ramped at a rate of 3 K s−1 from 170 K to 800 K, while masses corresponding to CH3, O, H2O, 12CO, 13CO, O2, 12CO2, 13CO2 were monitored in 50 ms total cycles using a QMS made by UTI. Masses apart from 12CO and 13CO were only monitored for irregularities or unexpected reaction products. Between 700 K and 750 K the sample holder “degassed” CO resulting in a sharply increased background. Data points beyond this temperature and up to 800 K were therefore not considered for analysis. After the completion of a CO-TPD cycle, the sample was cooled again, and the cycle was repeated 3 to 4 times per sample. Additional details on the calibration of the QMS signal, integration of the CO-TPD spectra, and the accuracy of the measurement and calibration are provided in the ESI.†
The CO-TPD procedure for Ru3(CO)12/HDS-TiO2 was slightly different; the samples were cooled to 180 K and the CO-TPD heat ramping process was initiated with no further treatment (there were no samples of Ru3(CO)12 on NS-TiO2 or LDS-TiO2). The clusters were already saturated with 12CO ligands, and thus for the 1st cycle no 13CO was dosed, and 12CO was the mass of interest. As this sample had been exposed to atmosphere before measurements, there may have been a small component of the CO-TPD signal which was due to the desorption of adsorbed CO contamination. This was not corrected for but due to the large number of CO ligands measured desorbing in the 1st CO-TPD cycle, any effects from contamination were deemed minimal in comparison to the signal strength. The temperature was only ramped to 723 K on the 1st CO-TPD cycle. 13CO was dosed as per the standard procedure for the CO-TPD on the 2nd and 3rd cycles. An additional complication was that on the 1st cycle the CO desorption rate reached the maximum count limit of the QMS which caused two effects; the 12CO spectrum was distorted due to saturation, and the measured 13CO signal clearly was actually due to overlap of the adjacent 12CO mass peak signal. This detection of a small fraction of the overlapping 12CO signal at mass 29 allowed us to correct the 12CO spectrum for saturation by scaling the 13CO spectral intensities so that they matched the 12CO signal at low temperature, where the signal was well below the saturation level. Note that after the 1st TPD on the CVD sample, and in all TPD experiments with CS clusters, the 12CO signal was small, and unsaturated.
XPS methods
For XPS measurements of cluster-deposited samples (in Utah), the Ru 3d, C 1s and O 1s regions were measured for each sample, while the Ti 2p and Si 2p regions were additionally measured for TiO2 and SiO2 substrates, respectively. The Ru 3d and C 1s regions overlap and will be referred to as the Ru 3d/C 1s region. XPS of cluster samples was performed in situ (except for Ru3(CO)12/HDS-TiO2) using an Al Kα source and 10 eV pass energy. X-ray photons were incident to the surface at 54.7°, and ejected photoelectrons were measured normal to the sample. No evidence for charging was found for any sample. A hemispherical analyzer (HSA, Physical Electronics) was used; this featured an area-selective lens with a 1.1 mm diameter analysis area, which was optimised to measure cluster spots of 2 mm in diameter without XPS signal from the surrounding bare substrate. Binding energies were calibrated to C 1s = 285.0 eV. Details for the XPS data analysis including peak fitting, line shapes used for fitting (Table S2†) and uncertainties are provided in the ESI.†An XPS spectrum of an Ru reference material was measured on a separate XPS instrument (in Adelaide) with a Mg Kα excitation and a Phoibos 100 HSA (SPECS, Germany). The Ru reference sample was taken from a 99.9% pure Ru metal sample (Fig. S1, ESI†). A measurement was first performed with no surface treatment, and then again after heating to 1073 K for 10 minutes and sputtering with 3 keV Ar+ for 1 hour to remove the surface Ru oxide layer and any hydrocarbon contamination. The BE scale for these measurements was calibrated to the C 1s peak for the pre-treatment XPS spectrum before hydrocarbon removal. Additionally, an in situ measurement of the Ru3(CO)12/HDS-TiO2 was performed on the XPS same instrument before removing the sample from vacuum, to estimate the number of ligands on the clusters (results shown in ESI Table S3†).
Results
Temperature programmed desorption
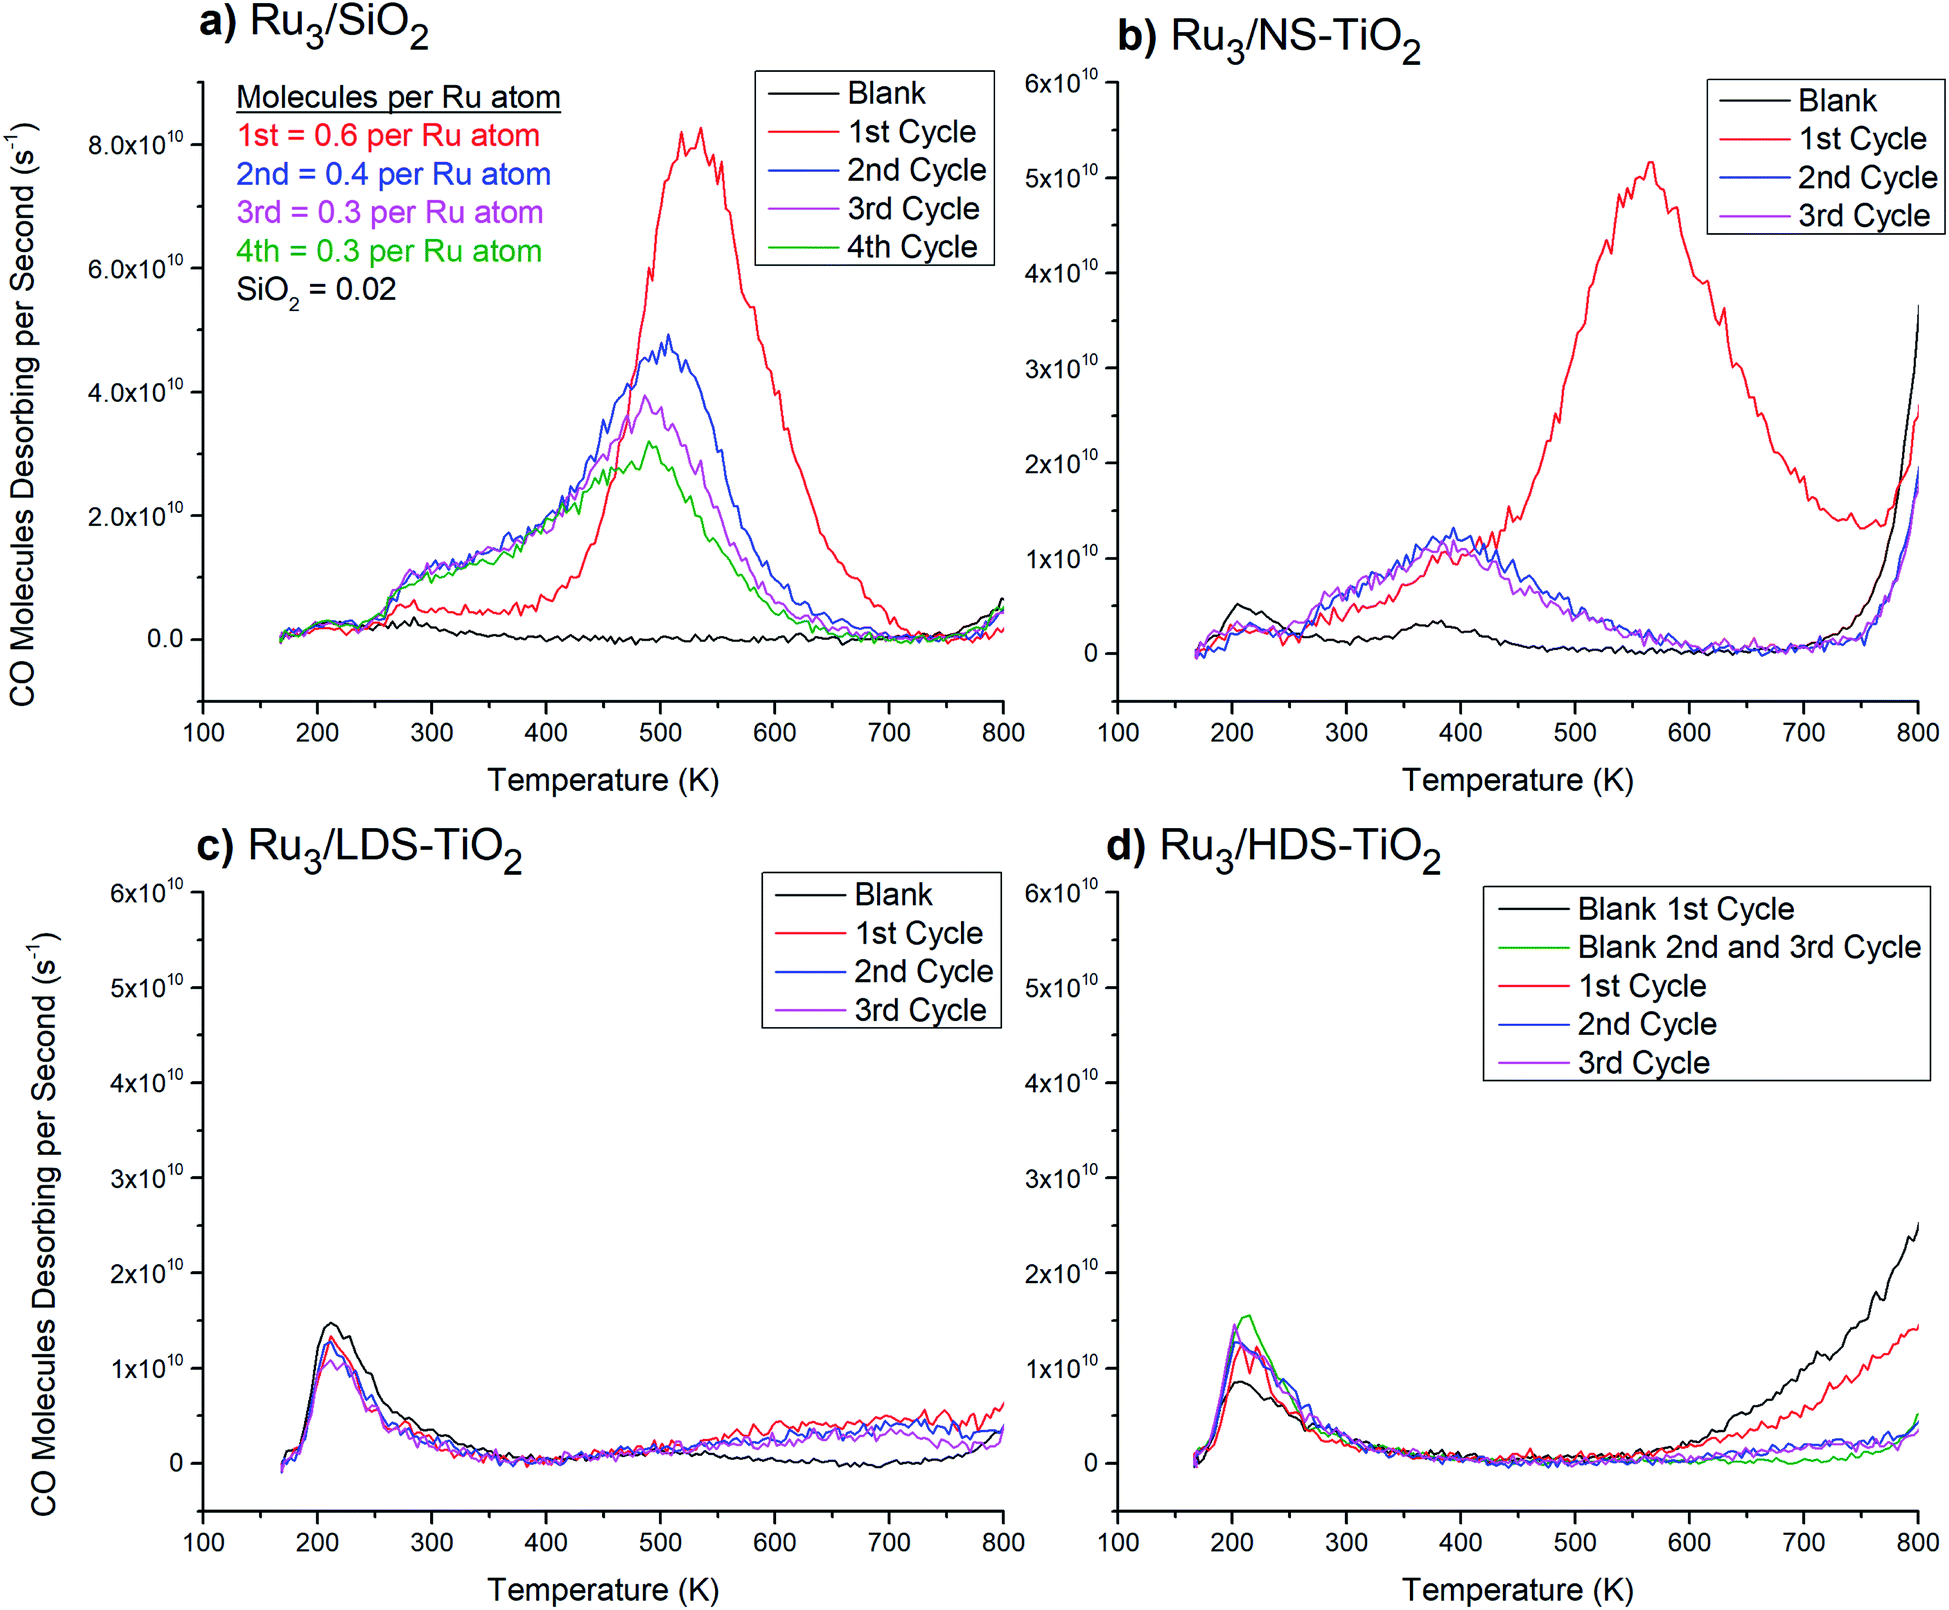 | ||
| Fig. 1 13CO-TPD from Ru3 CS-deposited onto various substrates. Blank measurements were performed before Ru3 deposition, and the spectra are averages of 3 blank cycles each where there were no noticeable changes (except for (d), discussed below). (a) Ru3/SiO2. Quantification of CO molecules desorbing per Ru atom is shown in the top left corner. For comparison purposes the quantified blank SiO2 desorption assumes the same number of Ru atoms were deposited as the cluster-loaded measurements. The uncertainty of CO molecules desorbing per atom is ∼50% (see ESI†). (b) Ru3/NS-TiO2. (c) Ru3/LDS-TiO2. (d) Ru3/HDS-TiO2. For HDS-TiO2 two blank measurements are shown: the 1st cycle and an average of the 2nd and 3rd cycles. There was presumably a change in the blank spectrum after the 1st cycle because the HDS-TiO2 blank featured more hydrocarbons adsorbed from the vacuum before the CO-TPD cycle, resulting from defected TiO2 being more reactive than pristine TiO2.30 | ||
Fig. 1a shows that very little CO has desorbed from blank SiO2, with two small features centred at 210 K and 285 K. Furthermore, there was no change between the blank measurements over 3 repeated TPD cycles (traces not shown in figure), indicating the affinity of the surface for CO was not strongly affected or changed by heating to 800 K. The 1st CO-TPD cycle for Ru3/SiO2 features a small peak at 210 K, which is related to desorption of CO from the SiO2 substrate. The remaining features in the spectrum are due to CO desorbing from Ru–CO binding sites. Notably, there is a small peak at 260 K and then a large, main desorption peak at 530 K. In this study, these two features will be treated as the reference Ru–CO desorption peaks for CO desorbing from supported Ru clusters which have not chemically reacted with the substrate or formed an SMSI state. In the 2nd to 4th cycles, the 260 K desorption feature increased in size (Fig. 1a). Also, the larger high temperature CO peak changed shape with successive CO-TPD cycles by decreasing in size and shifting to lower temperatures. By the 4th cycle the main desorption peak was at 500 K, and the total number of CO molecules desorbing had decreased to half the value in the 1st cycle.
The 2nd and 3rd heating cycles for Ru3/NS-TiO2 (Fig. 1b) have a consistent CO desorption shape which is different to that of the 1st cycle. They still have the 380 K feature from the 1st cycle, with a slightly increased height and width, but the 560 K main desorption peak has been completely removed. Thus, heating to 800 K caused the loss of the most strongly-binding and most numerous CO binding site on the Ru clusters. The increase in desorption of the 380 K peak after heating was not proportional to the loss in signal of the 560 K peak, indicating that after heating there were fewer CO binding sites available overall. The changes in the CO-TPD spectra cannot be associated with cluster agglomeration alone, because the result would be a CO desorption shape more like that of Ru3/SiO2 on the 2nd to 4th CO-TPD cycles (Fig. 1a), where agglomeration occurred but the peak was not lost completely. As such, agglomeration was ruled out as the sole cause for the change in CO desorption after the 1st cycle. The XPS results for the XPS samples provided further insights into the loss of the main desorption peak, by providing evidence that heating to 800 K caused a change in oxidation state of the clusters. It is likely that the clusters were oxidised by the surface when heated, which blocked the main Ru–CO binding site. This is discussed further in detail below. Some agglomeration may have also contributed to the loss of the peak, which cannot be ruled out with this data.
The blank CO-TPD spectra for the sputtered substrates, namely LDS-TiO2 and HDS-TiO2 (Fig. 1c and d respectively) feature one main peak at 210 K, which was larger than that for the blank NS-TiO2 (Fig. 1b). Because the CO desorption rate for the 210 K peak increased for sputtered TiO2, it is likely that this peak was related to CO adsorbed to defected surface regions on the blank TiO2. The second, 380 K peak present for the blank NS-TiO2 was not present on blank LDS-TiO2 or HDS-TiO2; however, the blank LDS-TiO2 spectrum has a second, wider desorption feature at 500 K which may be a shifted version of the 380 K peak seen for the blank NS-TiO2 sample (Fig. 1b). For the blank HDS-TiO2 spectrum (Fig. 1d) there is no such desorption feature, which may indicate the 380 K feature for blank NS-TiO2 was from CO binding sites on non-defected, pristine TiO2 regions, and the binding site was modified by sputtering (for LDS-TiO2) before being lost completely at a higher sputter dosage (for HDS-TiO2).
The CO-TPD spectrum for the Ru3/LDS-TiO2 sample (Fig. 1c) features a broad CO desorption peak for all cycles which was not seen for the blank sample, with deviation from blank at 550 K. For Ru3/HDS-TiO2 (Fig. 1d) there was a similar deviation from the blank sample above 550 K, although the exact shape was not the same. None of the characteristic CO desorption features seen in the Ru3/SiO2 sample were present for Ru3 on either sputtered TiO2 substrate. This means the clusters were interacting with the sputtered TiO2 in such a way that all Ru–CO binding sites were blocked, both before and after the sample was heated for CO-TPD. Although agglomeration and/or oxidation may have contributed to the loss of Ru–CO binding sites, the complete loss of all sites suggests a different mechanism for the blocking of sites on LDS-TiO2 and HDS-TiO2 substrates. The cause of site-blocking for these samples was most likely that the clusters were not present on the outermost layer of the sample. This is expanded upon in detail in the Discussion section. There was good repeatability between the three CO-TPD cycles for both Ru3/LDS-TiO2 and Ru3/HDS-TiO2, showing the resultant Ru/TiO2 systems were stable and not changed significantly by heating to 800 K.
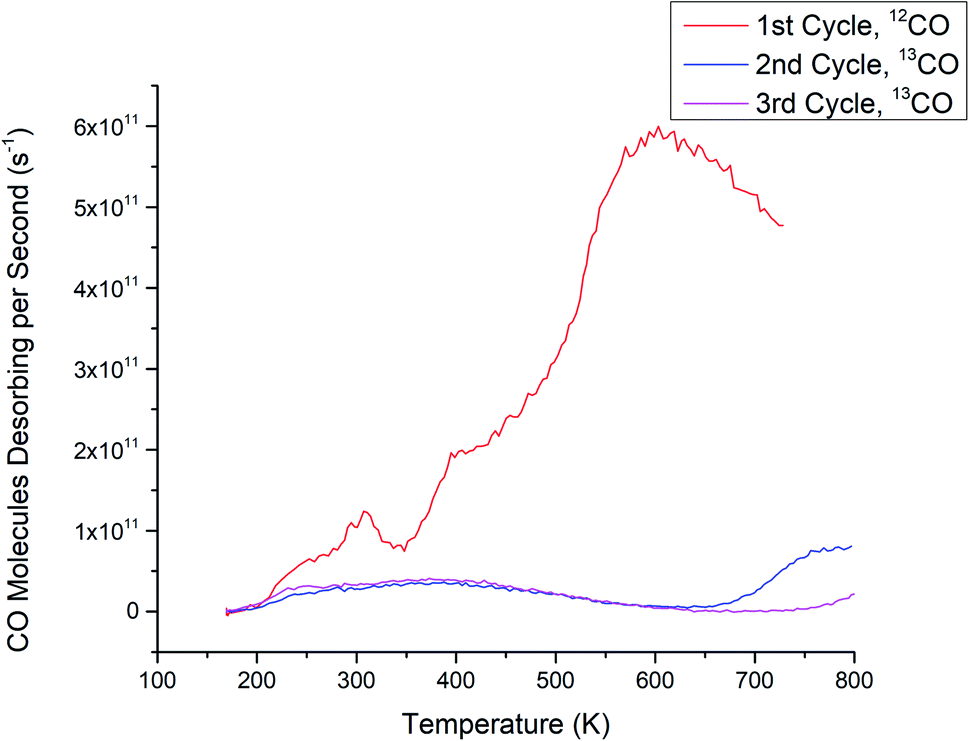 | ||
| Fig. 2 CO-TPD for Ru3(CO)12/HDS-TiO2. The 12CO spectrum (CO ligands) is shown for the 1st cycle and 13CO spectra (in situ dosed CO) are shown for the 2nd and 3rd cycles. 13CO was only dosed in vacuum for the 2nd and 3rd cycles. | ||
There are differences between the 1st cycle CO desorption spectra of Ru3(CO)12/HDS-TiO2 (Fig. 2) and the 1st cycle spectra of the previously discussed CS-deposited samples; Ru3/SiO2 (Fig. 1a) and Ru3/NS-TiO2 (Fig. 1b). The Ru3(CO)12/HDS-TiO2 sample low temperature peak was at 300 K, while Ru3/SiO2 and Ru3/NS-TiO2 featured desorption peaks at 260 K and 380 K, respectively. Another difference between the 1st cycle CO-TPD spectra of the samples is the temperatures of the main, higher-temperature desorption peaks: 600 K for Ru3(CO)12/HDS-TiO2, 560 K for Ru3/NS-TiO2, and 530 K for Ru3/SiO2. This indicates that although the Ru–CO binding sites were similar in these cases, the highest binding energy site was strongest for Ru3(CO)12/HDS-TiO2, followed by Ru3/TiO2, then Ru3/SiO2. However, the main peak starts at ∼400 K for each of these samples, and because the Ru3(CO)12/HDS-TiO2 sample extends to the highest temperature this may indicate it has a slightly wider range of binding sites with differing energies that were not individually resoled in the spectra. The difference in peak desorption temperatures for the large peak between the samples may be due to a combination of multiple effects. Firstly, the direct contact of clusters to the substrate for the bare Ru3 may alter the electron density in the clusters and weaken the bond with CO compared to the ligated sample. Secondly, this could be due to less CO binding to the bare CS clusters, which affects the Ru–CO binding energy. Lastly, because Ru3/SiO2 had the lowest peak temperature, it follows that the strong interaction between Ru3 and TiO2 stabilised the Ru–CO bonding when compared to the less strongly interacting SiO2 substrate.
A key difference comparing the full set of CO-TPD cycles for Ru3(CO)12/HDS-TiO2 (Fig. 2) to Ru3 on sputtered TiO2 (Ru3/LDS-TiO2 and Ru3/HDS-TiO2, see Fig. 1) was that for the bare CS samples, Ru–CO binding sites were completely blocked for the as-deposited samples, but for Ru3(CO)12 the sample needed to be heated in the CO-TPD procedure before Ru–CO sites were blocked. It would appear that the CO ligands on Ru3(CO)12 prevented the Ru–CO sites from being blocked by the HDS-TiO2 substrate until the ligands were removed by the heating process during the 1st CO-TPD cycle. That is to say, the cluster–substrate interaction which blocks the Ru–CO sites does not preferentially replace ligands which are already present on the clusters. The mechanism for this site blocking is discussed below in detail together with the CS-deposited samples. Since the clusters will pin to the defect sites on sputtered TiO2,48,49 these ligated Ru clusters were likely to be well-pinned to the substrate and present as unique, monodispersed cluster complexes before the ligands were removed due to heating. An additional difference is that the Ru3(CO)12/HDS-TiO2 was the only sample deposited ex situ and exposed to atmosphere. This caused the passivation of defect states in the titania due to interaction with atmospheric gasses (shown and discussed below in the XPS Results section). This most likely accounts for the differences in shape between the 2nd and 3rd cycle CO-TPD spectra between Ru3/HDS-TiO2 (has a small feature at high temperature) and Ru3(CO)12/HDS-TiO2 (has a much broader desorption feature starting at a lower temperature); even after the ligand removal, the differing cluster–surface interaction between the Ru and titania due to the passivated defects of the CVD sample changed the resultant available CO sites on the modified substrate.
XPS results
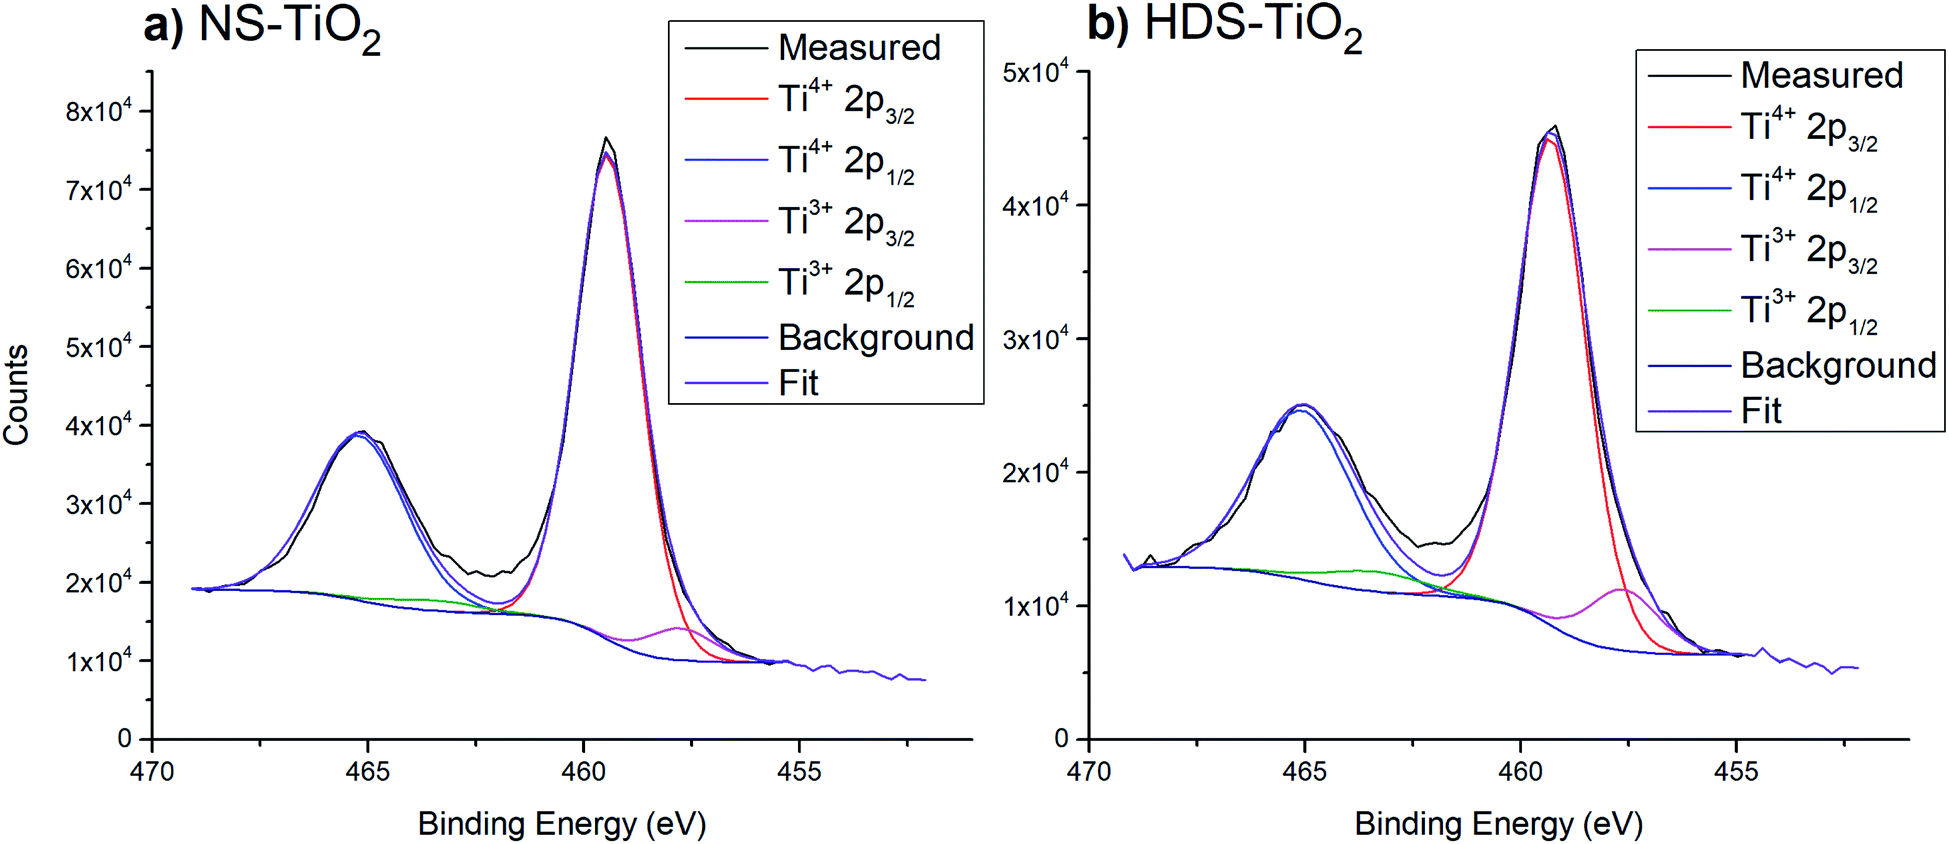 | ||
| Fig. 3 Example peak fittings for Ti 2p region, after heating samples to 800 K. (a) NS-TiO2. (b) HDS-TiO2. | ||
 . The uncertainty was ± 1% for Ti4+ at%, and ± 15% for both the Ti3+ at% and Ti3+/TiTotal ratio
| Deposition | Substrate | Sample treatment | Ti4+ at% | Ti3+ at% | Ti3+/TiTotal ratio (%) |
|---|---|---|---|---|---|
| Blank | NS-TiO2 | 800 K heating | 24.1 | 1.6 | 6 |
| CS Ru3 | NS-TiO2 | As-deposited | 22.2 | 0.8 | 3 |
| CS Ru3 | NS-TiO2 | 800 K heating | 23.1 | 0.8 | 3 |
| CS Ru3 | HDS-TiO2 | 800 K heating | 23.4 | 2.9 | 11 |
| CVD Ru3(CO)12 | HDS-TiO2 | As-deposited (ex situ) | 16.9 | 0.3 | 2 |
| CVD Ru3(CO)12 | HDS-TiO2 | 800 K heating | 23.2 | 1.0 | 4 |
| Deposition | Substrate | Ru at% | Surface coverage (% ML) | Method 1 | Method 2 | BE shift (eV) | ||
|---|---|---|---|---|---|---|---|---|
| Method | BE (eV) | Method | BE (eV) | |||||
| CS Ru3 | SiO2 | 0.55 | 4.0 | None | 280.7 | 800 K | 280.7 | 0.0 |
| CS Ru3 | NS-TiO2 | 0.43 | 3.1 | None | 280.2 | CO dose | 280.4 | 0.2 |
| CS Ru3 | NS-TiO2 | 0.41 | 3.0 | None | 280.3 | 800 K | 280.5 | 0.2 |
| CS Ru3 | HDS-TiO2 | 0.37 | 3.1 | 800 K | 280.5 | 800 K + CO dose | 280.5 | 0.0 |
| CVD Ru3(CO)12 | HDS-TiO2 | 1.48 | 10.7 | None | 282.0 | 800 K | 280.6 | −1.4 |
| CVD Ru3(CO)12 | HDS-TiO2 | 1.48 | 10.7 | 800 K | 280.6 | 800 K + CO dose | 280.6 | 0.0 |
 | ||
| Fig. 4 Example fitting for the Ru 3d/C 1s region; measurement of Ru3/HDS-TiO2 after heating to 800 K. | ||
 | ||
| Fig. 5 XPS spectra of Ru 3d/C 1s region for bare Ru3 (a–d) and Ru3(CO)12 (e–f) on different substrates. Different surface treatments are being compared with XPS, and some spectra are repetitive. The lower BE peaks at 280.2–282.0 eV are from Ru 3d5/2 and are the peak of interest to determine peak shifting. (a) Ru3/NS-TiO2 – as-deposited, and after heating to 800 K. (b) Ru3/NS-TiO2 – as-deposited, and after CO dose. (c) Ru3/HDS-TiO2 – after CO-TPD to 800 K, and after CO dose. (d) Ru3/SiO2 – as-deposited, and after heating to 800 K. (e) Ru3(CO)12/HDS-TiO2 – as-deposited, and after CO-TPD to 800 K. (f) Ru3(CO)12/HDS-TiO2 – after CO-TPD to 800 K, and after CO dose (performed in series with the measurement in (e)). | ||
Based on the ratio of CO 1s at% to Ru 3d at%, the ratio of CO ligands to Ru atoms per cluster for the Ru3(CO)12/HDS-TiO2 sample was calculated to be ∼1.3 after the cluster deposition (at% results for this are presented in the ESI†). This suggests an approximate average formula of Ru3(CO)4, indicating some ligands are lost during the CVD process. However, the atomic ratio should be treated as an estimation because it may be affected by any adventitious carbon adsorbed during the CVD process. The number of CO ligands remaining after CVD depositions will be analysed in more detail in a subsequent publication.
The surface coverage was greater for Ru3(CO)12/HDS-TiO2 than for all CS-deposited samples; for example, it is ∼3 times greater than Ru3/HDS-TiO2. However, all samples had only a fraction of a monolayer (ML) coverage (10.7% ML maximum). Due to the low coverages, it was assumed any cluster–cluster interactions were negligible and the differences in cluster loading would not have significantly affected the properties of the clusters when making comparisons between samples.
For Ru3/SiO2 the Ru 3d5/2 BE was at 280.7 eV ± 0.2 eV, and there was no peak shifting due to heating to 800 K, indicating there was no detectable change in oxidation state (see Table 3). For as-deposited Ru3/NS-TiO2, the Ru 3d5/2 peak is found at 280.3 ± 0.2 eV, and after heating to 800 K it is found at 280.5 ± 0.2 eV, thus shifting by +0.2 eV ± 0.1 eV (Table 3). The increase in BE indicated the clusters had become more positively charged, and the BE moved further away from the value for metallic Ru 3d5/2 which is 279.7 eV ± 0.2 eV. It should be noted that the relative error in peak position for the same sample before and after heating is smaller than the error for the absolute peak position. For Ru3/NS-TiO2 the as-deposited Ru 3d5/2 peak increases from 280.2 eV to 280.4 eV after dosing with CO, which indicates Ru–CO bonding is occurring (see Table 3). For Ru3/HDS-TiO2 the Ru 3d BE was compared after heating to 800 K, and then dosing with CO ligands. No shift in Ru 3d5/2 BE was detected which provides evidence Ru–CO binding sites were not available on this sample (see Table 3). If Ru–CO binding was occurring one would reasonably expect an increase in BE, as was the case for dosing CO onto Ru3/NS-TiO2. This is supported by the earlier CO-TPD results showing that there was no Ru–CO binding sites available for Ru3/HDS-TiO2 (Fig. 1d). For Ru3(CO)12/HDS-TiO2, the Ru 3d peak shifted by −1.4 eV ± 0.1 eV to a BE of 280.6 eV ± 0.2 eV after heating, due to the loss of CO ligands (see Table 3). When dosing CO onto the clusters after the 800 K heating, there was no detectable shift in the Ru 3d BE (see Table 3), indicating after heating the Ru–CO sites are also blocked for Ru3(CO)12/HDS-TiO2. This is supported by the earlier CO-TPD data which shows no characteristic Ru–CO desorption peaks for Ru3(CO)12/HDS-TiO2 after the 1st CO-TPD cycle (Fig. 2).
Discussion
As a brief summary of the results (vide supra), the adsorption of CO to CS-deposited Ru3 clusters was completely blocked when clusters were deposited onto LDS-TiO2 or HDS-TiO2, but this was not the case for SiO2 or NS-TiO2. After Ru3/SiO2 was heated to 800 K for a TPD cycle there was a decrease in temperature and size for the high temperature peak in the CO-TPD spectrum, while for Ru3/NS-TiO2 heating caused the complete loss of the high temperature CO desorption peak. In XPS the Ru 3d BE for Ru3/NS-TiO2 shifted to slightly higher energies after heating to 800 K, which is associated with a change in oxidation state of the clusters. The higher energy BE after heating to 800 K is shared is position by both Ru3 and Ru3(CO)12 on HDS-TiO2.Cluster agglomeration for Ru3/SiO2
For the Ru3/SiO2 sample the decrease in temperature and size for the high temperature CO-TPD peak (Fig. 1a) was also associated with a decrease in total CO desorbing. This decrease cannot be explained by the clusters detaching or travelling into the substrate. First, once the clusters have adsorbed they are not likely to detach due to heating to 800 K because the bulk Ru boiling point is 4423 K.70 Second, the clusters are unlikely to travel into the substrate because SiO2 is fairly inert and does not interact strongly with supported clusters30 or typically form an SMSI with supported metals at these temperatures and conditions.67 This decrease in CO desorption peak size is therefore attributed to cluster agglomeration. When clusters form larger aggregates the ratio of surface atoms to internal atoms for the clusters is reduced, thereby reducing the total number of CO binding sites on Ru clusters and agglomerated Ru clusters available in the system. A decrease in CO peak size due to cluster agglomeration has similarly been seen in other CO-TPD studies, such as studies by Anderson and co-workers on CS-deposited Pt7/alumina and various sized Ptn/silica;71,72 in these studies the CO-TPD spectra changed in shape with repeated TPD cycles to 700 K, where the higher temperature binding site similarly decreased in peak size and temperature. The agglomeration of Ru on SiO2 was not surprising and is most likely due to the weak cluster–surface interaction between Ru and SiO2; previous studies have also shown agglomeration of small clusters on SiO2 at temperatures below 800 K.63,73In addition to aggregation of the Ru clusters, there is also most likely a change in either the cluster structure (beyond agglomeration) or cluster–surface interaction with repeated CO-TPD cycles; this is evidenced by the peak CO desorption temperature decreasing with each CO-TPD cycle, meaning CO is adsorbing less strongly to the clusters after agglomeration. This is also supported by earlier studies by Anderson and co-workers,59,71,72 who have shown that for both Ptn/alumina (2 ≤ n ≤ 18) and Ptn/silica (n = 4, 7, 12, 24), the intensity of the high temperature CO-TPD peak increased as cluster size increased, but that repeated CO-TPD cycles caused the peak decrease in intensity and shift to lower temperatures. This provided evidence in the case of small Pt clusters that agglomeration produces different structures than those produced by deposition of larger size-selected clusters.
By making reasonable assumptions, the increase in cluster size over the four CO-TPD cycles for Ru3/SiO2 was estimated. The 4th cycle had 0.3 CO molecules desorbing per Ru atom compared to 0.6 CO per Ru atom in the 1st cycle (see Fig. 1a). Total CO desorption is proportional to the number of available CO binding sites. The simplest case to assume employs a model which disregards the individual atoms forming the clusters, instead considering hemispherical clusters pinned to the substrate where the number of binding sites is assumed to be proportional to the surface area (SA). If the bottom half of a hemispherical cluster is bound to the substrate and not available for binding to CO, then the available SA of the clusters would be given by eqn (1) for the surface area of a hemisphere.
| SA(hemisphere) = 2πr2 | (1) |
Utilising the number of CO desorbing per Ru atom in each cycle, and the assumption that available binding sites are proportional to the available SA, the increase in cluster radius is calculated as per eqn (2) and (3). Subscripts correspond to the SA or radius of clusters in the 1st or 4th cycle.
 | (2) |
By substituting in the relationship between SA and radius for each cycle from eqn (1) and simplifying the expression, the change in radius can be estimated.
| r(4th) = 1.4 × r(1st) | (3) |
The Ru cluster radius increases by an estimated factor of 1.4 after 4th CO-TPD cycles. Given that there would be a range of aggregated cluster sizes, this should be treated as an average size. The diameter of supported Ru3 is estimated to be 0.265 nm based on the interatomic Ru–Ru distance (bond length),74 and the clusters therefore increase to an average diameter of 0.37 nm after the 4th CO-TPD cycle. The assumptions made in this calculation are rather simplified and must be taken with caution. The assumption of a hemispherical cluster is a rather simple model and likely deviates from the true structure of the supported clusters and also ignores the finite size of the atoms forming the clusters. The calculation also ignores any effects of the cluster structure and size, or the number of binding sites available per SA. For example, another possibility to describe the reduction in CO bond sites is a change from a Ru3 cluster adsorbed flat on the surface into a 3-dimensional Ru6 cluster (two Ru3 clusters on top of each other) that prevents the lower 3 Ru atoms from being exposed to incoming CO.
Assigning binding sites to CO-TPD features
In the CO-TPD spectra, differences in temperatures for CO desorption could be due to the CO binding to chemically different parts of the cluster (i.e. a different binding site) or due to differing cluster–substrate interactions affecting the cluster–CO binding. The shape of the CO desorption trace between successive CO-TPD cycles can provide information about the location of the Ru–CO binding sites on the clusters. This has been attempted in similar experiments including a study by Labich et al.75 of Rh particles supported on TiO2/Mg where an on-top position (away from the substrate, highest temperature) and two-fold coordinated bridge position (cluster–substrate bridging, medium temperature), as well as a third high-coverage state (low temperature) were identified. This study did not have sufficient TPD resolution to identify exact peak positions for the desorption features, but highlights the fact that when on a substrate, cluster–substrate μ2 bridging bonds are also a possibility. This was also shown by Lee et al.76 for Au3 clusters on TiO2(110), who argued that CO was bound to the cluster–substrate interface when dosed under UHV because the low energy ion scattering spectroscopy (LEIS) signal for Au was not attenuated by CO adsorption. Regarding the nature of Ru–CO bonds, White et al.77 suggested via a DFT study that the optimised structure for Ru3(CO)1 features a 1.50 eV terminal μ1 bond (CO bound to one Ru atom) while Ru3(CO)2 features an additional bridging μ2 bond (CO bound to two Ru atoms) with a higher average Ru–CO bond energy of 1.79 eV. This calculation was performed in the gas phase and although not directly comparable to supported clusters it importantly indicates that μ1 and μ2 bonding are possible.The peaks will first be assigned for the Ru3/SiO2 sample, which is treated as the baseline for comparisons. As mentioned in the ESI,† the accuracy of the absolute TPD intensity calibration is estimated to be ∼50%. Fig. 1a shows that in the 1st cycle there was an average of 0.6 CO adsorbed per Ru atom, or 1.7 CO per Ru3 cluster. Given the ∼50% estimated accuracy, it is likely that most clusters had 2 CO per cluster after dosing. The clusters were agglomerated on SiO2 with each successive CO-TPD cycle, and the main 560 K CO desorption site decreased in size successively while the smaller 260 K desorption feature increased in size after one cycle and then stabilized. As the clusters agglomerate, the total number of CO “edge sites” available where the cluster meets the substrate is expected to decrease. Understanding this helps to assign the two main features in Fig. 1a. The 560 K peak is most likely from a μ2 cluster–substrate bridging site on the cluster edges; this is supported because the CO-TPD peak size decreases, due to a decrease in the number of edge sites that would occur on agglomeration (as discussed above), and because the higher binding energy of the site supports the likelihood of CO bonding to both the cluster and substrate. This peak also decreases in temperature, which provides evidence that the adsorption energy of CO to the cluster–substrate bridging sites decreases as clusters agglomerated, which would be related to a change in cluster charge density. The 260 K feature is most likely from an on-top binding site with μ1 and/or μ2 Ru–Ru bonding. The increase in the 260 K peak size after the 1st cycle may indicate that some amount of agglomeration promoted the number of on-top sites compared to edge sites. Regarding the CO-TPD samples on TiO2 substrates, for Ru3/NS-TiO2 the CO-TPD spectrum (Fig. 1b) is very similar to Ru3/SiO2 in the 1st cycle. The assignment of peaks is therefore the same as for Ru3/SiO2 but with the peaks shifted in temperature. For bare Ru3 on sputtered TiO2 surfaces (Fig. 1c and d), no Ru–CO peaks are observed and there are no CO binding sites to assign.
For the ligated sample, Ru3(CO)12/HDS-TiO2, the high temperature peak in the 1st cycle at 600 K appears to be a shifted version of the same feature as the high temperature peak for Ru3/NS-TiO2, and is assigned to cluster–substrate bridging sites. As previously discussed, this peak is wider in temperature than for the large desorption peak of either Ru3/NS-TiO2 or Ru3/SiO2, which may indicate a wider range of binding energies for bridging sites in this sample, possibly as a result of the larger number of CO molecules per Ru atom. The peak at 300 K (Fig. 2) is assigned to on-top CO with μ1 and/or μ2 bonding, the same as for the other samples. The 1st cycle CO-TPD spectrum of Ru3(CO)12/HDS-TiO2 (Fig. 2) is similar to what Zhao et al.19 previously measured for Ru3(CO)12 on TiO2(110) when deposited by CVD at 300 K. However, a key difference is the peaks for Zhao et al. were higher at ∼400 K and ∼650 K, and the higher peak had an extra low-temperature shoulder not seen in Fig. 2. It is likely these differences are related to differences in cluster–surface interaction between the TiO2(110) used in that study and HDS-TiO2 used in this study. Zhao et al.19 did not assign binding sites to the CO-TPD spectra, however they interestingly discovered that the large, broad high temperature CO desorption feature was not present when Ru3(CO)12 clusters were deposited by CVD onto a substrate at 100 K (instead of 300 K); the spectra instead had 5 smaller, narrow features.19 This further supports the notion that the high temperature peak is related to cluster–substrate bridging, because this kind of binding would most likely be promoted when depositing onto a higher temperature substrate which can more easily interact with the clusters.
Oxidation of Ru clusters
The Ru 3d BE for Ru3/NS-TiO2 shifted higher to 280.5 eV ± 0.2 eV after heating (Table 3), and is comparable to studies in the literature18,19 where O2 was dosed onto Ru3(CO)12 on TiO2(110) with heating to intentionally form oxidised clusters. In these cases, similar BE shifts were measured and absolute values for Ru 3d5/2 were reported as 280.6 eV by Zhao et al.19 and 280.8 eV by Rizzi et al.18 The similarity between these and the present study provides context for the previously discussed loss of the main 560 K CO desorption peak for Ru3/NS-TiO2 after heating to 800 K (Fig. 1b). The XPS peak shifting and CO-TPD results both point towards the oxidation of the Ru clusters, presumably due to an interaction with the oxygen in the supporting TiO2 (O2 was not dosed onto on the clusters). The blocked CO-TPD peak is assigned to cluster–substrate bridging sites, and thus oxygen is either binding to these sites or sterically hindering the access of CO to the sites. The shifted Ru 3d5/2 XPS peak is thus assigned to a partially oxidised form of the clusters. The increase in oxidation state can also be a reason for making Ru less attractive for binding to CO ligands. It should be noted that bulk Ru shows a BE shift of 1.6 eV upon oxidation69 and that the BEs reported in the literature for oxidised Ru clusters are lower than those typically reported for oxidised bulk Ru such as RuO2.69 Thus, it is difficult to determine the exact oxidation state for Ru clusters on Ru3/NS-TiO2.As-deposited XPS was not measured for Ru3/HDS-TiO2 but at 800 K. However the BE for Ru 3d5/2 at 800 K was 280.5 eV ± 0.2 eV, identical to that of Ru3/NS-TiO2 (Table 3). Thus, the clusters are most likely oxidised by the TiO2 surface upon heating to 800 K on HDS-TiO2 in the same way as NS-TiO2. The BE for Ru3(CO)12/HDS-RF-TiO2 after heating to 800 K is also the same as both Ru3/NS-TiO2 and Ru3/HDS-TiO2 within the experimental uncertainty, indicating that the initially-ligated clusters are also partially oxidised by the TiO2 substrate once their ligands had been removed by heating. The CO-TPD results for Ru3/SiO2 do not indicate any change in oxidation state of the clusters due to heating. It is also worth noting that in the case of Ru the cluster size does not seem to influence the BE, and thus the agglomeration discussed above on SiO2 did not result in a change in BE, which is different to other metals like gold.31,78–83 The lack of change in Ru oxidation state on SiO2 is most likely due to the fact that it is a non-reducible oxide, while TiO2 is a reducible oxide.65 The removal of O2− from non-reducible oxides such as SiO2 is energetically unfavourable and these oxides are more stoichiometrically stable and less reactive.65,66 Evidence of the substrate-dependent oxidation of clusters has been shown in other studies, and oxidation is typical of the SMSI for clusters on metal-oxide supports.33,84,85
It is likely that the mechanism of cluster oxidation on TiO2 is related to the minimisation of surface energy, where there is an energetic benefit for the system from the oxidation of Ru. The surface free energy of Ru at 298 K has been determined experimentally to be 3.409 J m−2,86 while the surface free energy of RuO2 was calculated in a separate DFT study as 1.1 J m−2 for RuO2(110) and 1.4 J m−2 for RuO2(100).87 These two studies used different calculation methods and are not quantitatively comparable for determining the precise change in surface free energy, however the lower surface free energy of RuO2 than Ru provides evidence for the surface-energy minimisation benefit of Ru oxidation. The reduction of surface free energy due to oxidation has been shown more explicitly using calculations for other transition metals.88 This mechanism can also be considered in terms of the negative enthalpy of formation for oxidised Ru; the energy of formation of transition metal oxides is typically negative, meaning there is an energetic benefit for oxidation and the clusters would lose energy to their surroundings when an oxide is formed.89,90 Both the surface energy and the enthalpy considerations have the same meaning.
Heating is required for Ru cluster oxidation on NS-TiO2. The as-deposited Ru3 clusters on NS-TiO2 showed the lowest oxidation state based on the XPS results, but the oxidation state increased upon heating to 800 K, even after the temperature was reduced. It is probable that for oxidation the transport of O2− anions on the substrate must be activated by heating such that they are mobilized and can be transported to the clusters; the idea of bulk TiO2 defects becoming mobile at elevated temperatures and interacting with supported metals has been suggested previously.30,33,91
Zhao et al.19 have previously deposited Ru3(CO)12 by CVD onto TiO2(110). After heating and ligand removal the authors found that the Ru 3d5/2 peak was located at 279.9 eV, which is comparable to bulk Ru. They found by dosing 400 L O2 under UHV at 600 K that the Ru peaks shifted higher to 280.6 eV, which they associated with oxidation of the clusters. The necessity for dosing O2 contrasts with our results on NS-TiO2 where the clusters were oxidised after only heating to 800 K under UHV. This serves to demonstrate the fact that the SMSI interaction depends greatly on the combination of cluster and substrate, even including different forms of the same material such as TiO2(100) in the work of Zhao et al.19 and RF-deposited TiO2 in this study. Zhao et al. estimated that the cluster coverage was 5% to 25% of a monolayer, which is comparable to this study, so surface coverage cannot be the reason for the difference in results.19 It is most likely that the different outcome is related to the differences between RF-deposited TiO2 and single crystal TiO2(110) substrates; it is possible that TiO2(110) is not as easily reducible, or that the surface energy is lower meaning there is less of a driving force for cluster oxidation in terms of surface energy minimization.
Complete blocking of Ru–CO binding sites
The blocking or changing of some Ru–CO sites seen in the CO-TPD data have been above attributed to both agglomeration and oxidation. However, for Ru3 on LDS-TiO2 and HDS-TiO2 all Ru–CO binding sites are completely blocked such that no CO is able to adsorb to the clusters when dosed under UHV. The Ru–CO blocking cannot be associated with agglomeration only as this would result in CO-TPD spectra like that of Ru3/SiO2 (Fig. 1a), or oxidation only as this would result in CO-TPD spectra like that of Ru3/NS-TiO2 (Fig. 1b). For Ru3(CO)12/HDS-TiO2, the Ru–CO sites were present in the 1st CO-TPD cycle (before the ligands were desorbed) but were completely blocked in the 2nd and 3rd cycles after heating to 800 K. This result also contrasts the previously mentioned study by Zhao et al.19 where XPS peak shifting was used to show Ru–CO binding was not blocked for Ru3(CO)12 on non-sputtered TiO2(110) even when heated to 700 K.For cases where Ru–CO sites are completely blocked there seems to be another reason for the complete loss of Ru–CO sites besides agglomeration or oxidation. The fact that Ru–CO sites were only completely blocked if RF-TiO2 was sputter treated, in addition to the differences between depositions onto RF-deposited TiO2 in this study and TiO2(110) in other studies,19 raises a question about the mechanism of site-blocking. Encapsulation is another phenomenon which can occur for metals supported on a reducible oxide like TiO2. This involves the mass transport of substrate material to the top of the clusters, effectively covering them. This has been shown in the literature for several types of clusters on TiO2 substrates, including the study by Fu et al.33 of 1.5 nm Pd clusters grown on TiO2(110) as well as many other examples over the past few decades.32,34,55,75,92–96 Encapsulation is related to the formation of an SMSI state, and there are various proposed reaction mechanisms for encapsulation in the literature, including thermodynamic drive to minimize the total surface energy of the system.33,75,92,93,96,97 This mechanism is most likely to occur when the surface energy of the metal is greater than the surface energy of the supporting oxide layer,33,75,93,97 which is the case for Ru and TiO2; as indicated above, the surface energy of Ru is 3.409 J m−2 and TiO2(110) has been calculated to be 1.78 J m−2.64,98
Given the propensity of TiO2 to encapsulate surface adsorbates, it is possible that the complete loss of Ru–CO binding sites for Ru3(CO)12/HDS-TiO2 is due to cluster encapsulation by the substrate material, possibly in combination with other phenomena such as oxidation and/or agglomeration. However, the occurrence of encapsulation is not entirely clear because the data does not directly show the encapsulation, only the indirect blocking of Ru–CO sites. From previous literature, varying conditions have been reported to induce cluster encapsulation which typically require high temperature reduction of the oxide substrate under UHV32–34,64,75,92–96,99,100 or H2.101–105 A notable similarity of the results here to encapsulation occurring in previous studies for Pd and Rh clusters on TiO2(110) is that sputtering of the substrate prior to cluster deposition was shown to be required for encapsulation.33,34 In the present study, Ru–CO binding sites were only completely blocked for Ru3 on sputtered TiO2, providing evidence that surface roughness and/or oxygen deficiency play a role in the state of Ru clusters on the surface. However, a key difference is that in the current study Ru–CO blocking occurs in as-deposited Ru3/HDS-TiO2 with no heating required.33,34 Thus, this may point towards a different site-blocking mechanism which is unique for the RF-deposited TiO2 substrate. Other causes for the site blocking may be sub-surface defects caused by sputter treatment34 which attract the clusters below the surface, or subsurface oxygen being more readily available for the Ru3 than surface oxygen and the subsurface oxygen similarly attracting the clusters. To the best of our knowledge there have been no previous measurements for the encapsulation of size-selected Ru clusters on TiO2 in the literature, although some encapsulation studies using similar Ru materials have been conducted.55,106 Further insight into the mechanisms of interactions of Ru clusters with TiO2 will be shown in a subsequent publication. It should be noted that the present work does not allow determining the change of the Ru cluster size due to the heating procedures applied. This will be subject to a subsequent publication.
The blocking of cluster–CO binding sites is not generally desired for catalytic purposes because CO adsorption capacity is reduced, which is the case for some samples in this study as well as other reports in the literature.33,34,75 As such the results discussed can provide a framework for how to achieve Ru clusters on TiO2 supports with available Ru–CO binding sites for the catalysis of reactions such as CO hydrogenation. While it is possible that conserving Ru–CO binding sites is important for catalytic activity, there have been cases which showed that if a covering layer is thin enough some combinations of cluster and covering layer can have an electronic structure which is suitable for catalysis without direct reactant–cluster contact.107–109 In these cases, there can be extra benefits for catalysis such as increasing resistance to cluster agglomeration,107,108 increasing catalytic reaction selectivity,109 or improving catalytic activity by hindering back reactions which remove reaction products.108 As such, catalysis measurements are necessary for experimental verification of this framework.
Conclusions
For Ru3 CS-deposited onto SiO2, heating the clusters to 800 K caused cluster agglomeration. Conversely, for Ru3 CS-deposited onto NS-TiO2, the clusters remained on the surface but were oxidised by the substrate when heated to 800 K, resulting in the loss of the main CO binding site. This indicated oxygen either bound to the same sites as CO or bound in such a way that CO was sterically hindered, or Ru was less attractive for binding to CO due to an increase in oxidation state. When the TiO2 substrate was Ar+ sputter treated before CS-depositions the Ru–CO binding sites on the clusters were completely blocked by the substrate as-deposited. For Ru3(CO)12/HDS-TiO2, the clusters retained their Ru–CO sites as-deposited but after heating to 800 K the ligands were removed, and the Ru–CO sites were completely blocked. It is possible given the lack of Ru–CO binding sites that the catalytic abilities of the small Ru clusters will be reduced when supported on sputtered TiO2.We have developed a set of deposition criteria for Ru3 clusters to retain their Ru–CO binding sites when supported on RF-deposited TiO2. For CS depositions the Ru–CO sites will be blocked if the substrate is sputter treated prior to deposition, but when depositing Ru3(CO)12 by CVD the CO ligands are retained on a sputtered substrate. In both cases heating to 800 K will cause cluster oxidation (a partial loss of CO sites) and/or complete Ru–CO blocking. The mechanism for complete Ru–CO blocking on sputtered TiO2 could not be precisely determined from the presented results, but comparisons to similar studies of metal/TiO2(100) interfaces point towards an interpretation that the clusters were encapsulated by a layer of substrate material. A key difference to previous studies was that no heating was required for Ru–CO blocking to occur, possibly pointing to a unique mechanism for site blocking by RF-deposited TiO2.
Conflicts of interest
There are no conflicts to declare.Acknowledgements
The work is supported by the US army project FA5209-16-R-0017. Part of the work is supported by the Australian Solar Thermal Research Institute (ASTRI), a project supported by the Australian Government, through the Australian Renewable Energy Agency (ARENA). The work at the University of Utah was partly supported by the Air Force Office of Scientific Research, under AFOSR grant FA9550-19-1-0261. The authors acknowledge the facilities, and the scientific and technical assistance, of Microscopy Australia (formerly known as AMMRF) and the Australian National Fabrication Facility (ANFF) at Flinders University. The authors acknowledge Flinders Microscopy and Microanalysis and their expertise.References
- D. Lee, R. L. Donkers, G. Wang, A. S. Harper and R. W. Murray, Electrochemistry and optical absorbance and luminescence of molecule-like Au38 nanoparticles, J. Am. Chem. Soc., 2004, 126, 6193–6199 CrossRef CAS PubMed.
- J. Jung, H. Kim and Y.-K. Han, Can an electron-shell closing model explain the structure and stability of ligand-stabilized metal clusters?, J. Am. Chem. Soc., 2011, 133, 6090–6095 CrossRef CAS PubMed.
- G. Ramakrishna, O. Varnavski, J. Kim, D. Lee and T. Goodson, Quantum-sized gold clusters as efficient two-photon absorbers, J. Am. Chem. Soc., 2008, 130, 5032–5033 CrossRef CAS PubMed.
- M. Valden, X. Lai and D. W. Goodman, Onset of catalytic activity of gold clusters on titania with the appearance of nonmetallic properties, Science, 1998, 281, 1647–1650 CrossRef CAS PubMed.
- C. Xu, X. Lai, G. Zajac and D. Goodman, Scanning tunneling microscopy studies of the TiO2 (110) surface: structure and the nucleation growth of Pd, Phys. Rev. B: Condens. Matter Mater. Phys., 1997, 56, 13464 CrossRef CAS.
- C. P. Joshi, M. S. Bootharaju and O. M. Bakr, Tuning properties in silver clusters, J. Phys. Chem. Lett., 2015, 6, 3023–3035 CrossRef CAS PubMed.
- A. Sanchez, S. Abbet, U. Heiz, W. D. Schneider, H. Hakkinen, R. N. Barnett and U. Landman, When gold is not noble: nanoscale gold catalysts, J. Phys. Chem. A, 1999, 103, 9573 CrossRef CAS.
- C. Moreno-Castilla, M. A. Salas-Peregrín and F. J. López-Garzón, Hydrogenation of carbon oxides by Ru/activated carbon catalysts obtained from Ru3(CO)12: effect of pretreatment on their dispersion, composition and activity, J. Mol. Catal. A: Chem., 1995, 95, 223–233 CrossRef CAS.
- P. Panagiotopoulou, Hydrogenation of CO2 over supported noble metal catalysts, Appl. Catal., A, 2017, 542, 63–70 CrossRef CAS.
- R. Mutschler, E. Moioli and A. Züttel, Modelling the CO2 hydrogenation reaction over Co, Ni and Ru/Al2O3, J. Catal., 2019, 375, 193–201 CrossRef CAS.
- G. D. Weatherbee and C. H. Bartholomew, Hydrogenation of CO2 on group VIII metals: IV. Specific activities and selectivities of silica-supported Co, Fe, and Ru, J. Catal., 1984, 87, 352–362 CrossRef CAS.
- K. Asakura and Y. Iwasawa, Surface structure and catalysis for CO hydrogenation of the supported Ru species derived from the Ru3(CO)12 inorganic oxides, J. Chem. Soc., Faraday Trans., 1990, 86, 2657–2662 RSC.
- F. Solymosi, A. Erdöhelyi and M. Kocsis, Methanation of CO2 on supported Ru catalysts, J. Chem. Soc., Faraday Trans., 1981, 1 77, 1003–1012 RSC.
- W. R. Hastings, C. J. Cameron, M. J. Thomas and M. C. Baird, Carbon monoxide and carbon dioxide hydrogenation catalyzed by supported ruthenium carbonyl clusters. A novel procedure for encapsulating triruthenium dodecacarbonyl within the pores of Na-Y zeolite, Inorg. Chem., 1988, 27, 3024–3028 CrossRef CAS.
- C. S. Kellner and A. T. Bell, Effects of dispersion on the activity and selectivity of alumina-supported ruthenium catalysts for carbon monoxide hydrogenation, J. Catal., 1982, 75, 251–261 CrossRef CAS.
- R. D. Gonzalez and H. Miura, Methanation and Fischer-Tropsch studies on potassium-promoted silica-supported Ru catalysts, J. Catal., 1982, 77, 338–347 CrossRef CAS.
- E. Kikuchi, H. Nomura, M. Matsumoto and Y. Morita, Fischer-tropsch synthesis of hydrocarbons on V2O3-supported ruthenium catalysts, Appl. Catal., 1983, 7, 1–9 CrossRef CAS.
- G. A. Rizzi, A. Magrin and G. Granozzi, Substitutional Ti(1-x)RuxO2 surface alloys obtained from the decomposition of Ru3(CO)12 on TiO2 (110), Phys. Chem. Chem. Phys., 1999, 1, 709–711 RSC.
- X. Zhao, J. Hrbek and J. A. Rodriguez, The decomposition and chemistry of Ru3(CO)12 on TiO2 (110) studied with X-ray photoelectron spectroscopy and temperature programmed desorption, Surf. Sci., 2005, 575, 115–124 CrossRef CAS.
- D. Meier, G. Rizzi, G. Granozzi, X. Lai and D. Goodman, Ru3(CO)12 adsorption and decomposition on TiO2, Langmuir, 2002, 18, 698–705 CrossRef CAS.
- T. Cai, Z. Song, Z. Chang, G. Liu, J. Rodriguez and J. Hrbek, Ru nanoclusters prepared by Ru3(CO)12 deposition on Au (111), Surf. Sci., 2003, 538, 76–88 CrossRef CAS.
- F. Yang, S. Kundu, A. B. Vidal, J. Graciani, P. J. Ramírez, S. D. Senanayake, D. Stacchiola, J. Evans, P. Liu and J. F. Sanz, Determining the Behavior of RuOx Nanoparticles in Mixed-Metal Oxides: Structural and Catalytic Properties of RuO2/TiO2 (110) Surfaces, Angew. Chem., Int. Ed., 2011, 50, 10198–10202 CrossRef CAS PubMed.
- K. Asakura, K.-K. Bando and Y. Iwasawa, Structure and behaviour of Ru3(CO)12 supported on inorganic oxide surfaces, studied by EXAFS, infrared spectroscopy and temperature-programmed decomposition, J. Chem. Soc., Faraday Trans., 1990, 86, 2645–2655 RSC.
- P. Serp, P. Kalck and R. Feurer, Chemical vapor deposition methods for the controlled preparation of supported catalytic materials, Chem. Rev., 2002, 102, 3085–3128 CrossRef CAS PubMed.
- J. A. Rodriguez, J. Dvorak, T. Jirsak and J. Hrbek, Formation of Mo and MoSx nanoparticles on Au (111) from Mo(CO)6 and S2 precursors: electronic and chemical properties, Surf. Sci., 2001, 490, 315–326 CrossRef CAS.
- R. Psaro and S. Recchia, Supported metals derived from organometallics, Catal. Today, 1998, 41, 139–147 CrossRef CAS.
- M. Xu and F. Zaera, Mechanistic studies of the thermal decomposition of metal carbonyls on Ni (100) surfaces in connection with chemical vapor deposition processes, J. Vac. Sci. Technol., A, 1996, 14, 415–424 CrossRef CAS.
- A. C. Papageorgiou, K. Diller, S. Fischer, F. Allegretti, F. Klappenberger, S. C. Oh, O. z. Sağlam, J. Reichert, A. Wiengarten and K. Seufert, In Vacuo Porphyrin Metalation on Ag(111) via Chemical Vapor Deposition of Ru3(CO)12: Mechanistic Insights, J. Phys. Chem. C, 2016, 120, 8751–8758 CrossRef CAS.
- E. Mohimi, Z. V. Zhang, S. Liu, J. L. Mallek, G. S. Girolami and J. R. Abelson, Area selective CVD of metallic films from molybdenum, iron, and ruthenium carbonyl precursors: Use of ammonia to inhibit nucleation on oxide surfaces, J. Vac. Sci. Technol., A, 2018, 36, 041507 CrossRef.
- U. Diebold, The surface science of titanium dioxide, Surf. Sci. Rep., 2003, 48, 53–229 CrossRef CAS.
- H. S. Al Qahtani, K. Kimoto, T. Bennett, J. F. Alvino, G. G. Andersson, G. F. Metha, V. B. Golovko, T. Sasaki and T. Nakayama, Atomically resolved structure of ligand-protected Au9 clusters on TiO2 nanosheets using aberration-corrected STEM, J. Chem. Phys., 2016, 144, 114703 CrossRef PubMed.
- R. Bennett, C. Pang, N. Perkins, R. Smith, P. Morrall, R. Kvon and M. Bowker, Surface structures in the SMSI state; Pd on (1×2) reconstructed TiO2 (110), J. Phys. Chem. B, 2002, 106, 4688–4696 CrossRef CAS.
- Q. Fu, T. Wagner, S. Olliges and H.-D. Carstanjen, Metal–oxide interfacial reactions: Encapsulation of Pd on TiO2 (110), J. Phys. Chem. B, 2005, 109, 944–951 CrossRef CAS PubMed.
- A. Berkó, I. Ulrych and K. Prince, Encapsulation of Rh nanoparticles supported on TiO2 (110)-(1×1) surface: XPS and STM studies, J. Phys. Chem. B, 1998, 102, 3379–3386 CrossRef.
- F. X. Xiao, S. F. Hung, J. Miao, H. Y. Wang, H. Yang and B. Liu, Metal-Cluster-Decorated TiO2 Nanotube Arrays: A Composite Heterostructure toward Versatile Photocatalytic and Photoelectrochemical Applications, Small, 2015, 11, 554–567 CrossRef CAS PubMed.
- I. X. Green, W. Tang, M. Neurock and J. T. Yates, Spectroscopic observation of dual catalytic sites during oxidation of CO on a Au/TiO2 catalyst, Science, 2011, 333, 736–739 CrossRef CAS PubMed.
- A. C. Reber, S. N. Khanna, F. S. Roberts and S. L. Anderson, Effect of O2 and CO Exposure on the Photoelectron Spectroscopy of Size-Selected Pd n Clusters Supported on TiO2 (110), J. Phys. Chem. C, 2016, 120, 2126–2138 CrossRef CAS.
- H. S. Al Qahtani, G. F. Metha, R. B. Walsh, V. B. Golovko, G. G. Andersson and T. Nakayama, Aggregation behavior of ligand-protected Au9 clusters on sputtered atomic layer deposition TiO2, J. Phys. Chem. C, 2017, 121, 10781–10789 CrossRef CAS.
- F. S. Roberts, S. L. Anderson, A. C. Reber and S. N. Khanna, Initial and Final State Effects in the Ultraviolet and X-ray Photoelectron Spectroscopy (UPS and XPS) of Size-Selected Pd n Clusters Supported on TiO2 (110), J. Phys. Chem. C, 2015, 119, 6033–6046 CrossRef CAS.
- J.-Y. Ruzicka, F. Abu Bakar, C. Hoeck, R. Adnan, C. McNicoll, T. Kemmitt, B. C. Cowie, G. F. Metha, G. G. Andersson and V. B. Golovko, Toward Control of Gold Cluster Aggregation on TiO2 via Surface Treatments, J. Phys. Chem. C, 2015, 119, 24465–24474 CrossRef CAS.
- K. Nakata, S. Sugawara, W. Kurashige, Y. Negishi, M. Nagata, S. Uchida, C. Terashima, T. Kondo, M. Yuasa and A. Fujishima, Cosensitization Properties of Glutathione-Protected Au25 Cluster on Ruthenium Dye-Sensitized TiO2 Photoelectrode, Int. J. Photoenergy, 2013, 2013, 456583 CrossRef.
- K. Katsiev, G. Harrison, Y. Al-Salik, G. Thornton and H. Idriss, Gold Cluster Coverage Effect on H2 Production over Rutile TiO2 (110), ACS Catal., 2019, 9, 8294–8305 CrossRef CAS.
- P. López-Caballero, A. W. Hauser and M. a. Pilar de Lara-Castells, Exploring the Catalytic Properties of Unsupported and TiO2-Supported Cu5 Clusters: CO2 Decomposition to CO and CO2 Photoactivation, J. Phys. Chem. C, 2019, 123, 23064–23074 CrossRef PubMed.
- I. Hadjoub, T. Touam, A. Chelouche, M. Atoui, J. Solard, M. Chakaroun, A. Fischer, A. Boudrioua and L.-H. Peng, Post-deposition annealing effect on RF-sputtered TiO2 thin-film properties for photonic applications, Appl. Phys. A, 2016, 122, 78 CrossRef.
- J. Daughtry, A. Alotabi, L. Howard-Fabretto and G. G. Andersson, Composition and Properties of RF-Sputter Deposited Titanium Dioxide Thin Films, Nanoscale Adv., 2020, 3, 1077–1086 RSC.
- Y. Fukamori, M. König, B. Yoon, B. Wang, F. Esch, U. Heiz and U. Landman, Fundamental Insight into the Substrate-Dependent Ripening of Monodisperse Clusters, ChemCatChem, 2013, 5, 3330–3341 CrossRef CAS.
- H. Jensen, A. Soloviev, Z. Li and E. G. Søgaard, XPS and FTIR investigation of the surface properties of different prepared titania nano-powders, Appl. Surf. Sci., 2005, 246, 239–249 CrossRef CAS.
- G. Krishnan, H. S. Al Qahtani, J. Li, Y. Yin, N. Eom, V. B. Golovko, G. F. Metha and G. G. Andersson, Investigation of Ligand-Stabilized Gold Clusters on Defect-Rich Titania, J. Phys. Chem. C, 2017, 121, 28007–28016 CrossRef CAS.
- E. Wahlström, N. Lopez, R. Schaub, P. Thostrup, A. Rønnau, C. Africh, E. Lægsgaard, J. Nørskov and F. Besenbacher, Bonding of Gold Nanoclusters to Oxygen Vacancies on Rutile TiO2 (110), Phys. Rev. Lett., 2003, 90, 026101 CrossRef PubMed.
- J. Sasaki, N. Peterson and K. Hoshino, Tracer impurity diffusion in single-crystal rutile (TiO2−x), J. Phys. Chem. Solids, 1985, 46, 1267–1283 CrossRef CAS.
- M. Li, W. Hebenstreit, U. Diebold, A. M. Tyryshkin, M. K. Bowman, G. G. Dunham and M. A. Henderson, The influence of the bulk reduction state on the surface structure and morphology of rutile TiO2 (110) single crystals, J. Phys. Chem. B, 2000, 104, 4944–4950 CrossRef CAS.
- T. Sekiya, T. Yagisawa, N. Kamiya, D. Das Mulmi, S. Kurita, Y. Murakami and T. Kodaira, Defects in anatase TiO2 single crystal controlled by heat treatments, J. Phys. Soc. Jpn., 2004, 73, 703–710 CrossRef CAS.
- V. E. Henrich, G. Dresselhaus and H. Zeiger, Observation of Two-Dimensional Phases Associated with Defect States on the Surface of TiO2, Phys. Rev. Lett., 1976, 36, 1335 CrossRef CAS.
- P. Lindan, N. Harrison, M. Gillan and J. White, First-principles spin-polarized calculations on the reduced and reconstructed TiO2 (110) surface, Phys. Rev. B: Condens. Matter Mater. Phys., 1997, 55, 15919 CrossRef CAS.
- T. Komaya, A. T. Bell, Z. Wengsieh, R. Gronsky, F. Engelke, T. S. King and M. Pruski, The influence of metal-support interactions on the accurate determination of Ru dispersion for Ru/TiO2, J. Catal., 1994, 149, 142–148 CrossRef CAS.
- W. E. Kaden, W. A. Kunkel, F. S. Roberts, M. Kane and S. L. Anderson, CO adsorption and desorption on size-selected Pdn/TiO2 (110) model catalysts: Size dependence of binding sites and energies, and support-mediated adsorption, J. Chem. Phys., 2012, 136, 204705 CrossRef PubMed.
- E. T. Baxter, M.-A. Ha, A. C. Cass, H. Zhai, A. N. Alexandrova and S. L. Anderson, Diborane Interactions with Pt7/Alumina: Preparation of Size-Controlled Borated Pt Model Catalysts, J. Phys. Chem. C, 2018, 122, 1631–1644 CrossRef CAS.
- T. J. Gorey, B. Zandkarimi, G. Li, E. T. Baxter, A. N. Alexandrova and S. L. Anderson, Preparation of Size and Composition-Controlled PtnSnx/SiO2 (n= 2, 4, 24) Bimetallic Model Catalysts Using Atomic Layer Deposition, J. Phys. Chem. C, 2019, 123(26), 16194–16209 CrossRef CAS.
- F. S. Roberts, M. D. Kane, E. T. Baxter and S. L. Anderson, Oxygen activation and CO oxidation over size-selected Pt n/alumina/Re (0001) model catalysts: correlations with valence electronic structure, physical structure, and binding sites, Phys. Chem. Chem. Phys., 2014, 16, 26443–26457 RSC.
- T. J. Gorey, Y. Dai, S. L. Anderson, S. Lee, S. Lee, S. Seifert and R. E. Winans, Selective growth of Al2O3 on size-selected platinum clusters by atomic layer deposition, Surf. Sci., 2020, 691, 121485 CrossRef CAS.
- M. Fauré, C. Saccavini and G. Lavigne, New insight into a convenient base-promoted synthesis of Ru3(CO)12, Chem. Commun., 2003, 1578–1579 RSC.
- G. Li, B. Zandkarimi, A. C. Cass, T. J. Gorey, B. J. Allen, A. N. Alexandrova and S. L. Anderson, Sn-modification of Pt7/alumina model catalysts: Suppression of carbon deposition and enhanced thermal stability, J. Chem. Phys., 2020, 152, 024702 CrossRef CAS PubMed.
- W. E. Kaden, W. A. Kunkel and S. L. Anderson, Cluster size effects on sintering, CO adsorption, and implantation in Ir/SiO2, J. Chem. Phys., 2009, 131, 114701 CrossRef CAS PubMed.
- M. Aizawa, S. Lee and S. L. Anderson, Deposition dynamics and chemical properties of size-selected Ir clusters on TiO2, Surf. Sci., 2003, 542, 253–275 CrossRef CAS.
- A. Ruiz Puigdollers, P. Schlexer, S. Tosoni and G. Pacchioni, Increasing oxide reducibility: the role of metal/oxide interfaces in the formation of oxygen vacancies, ACS Catal., 2017, 7, 6493–6513 CrossRef CAS.
- G. Pacchioni and H. Freund, Electron transfer at oxide surfaces. The MgO paradigm: from defects to ultrathin films, Chem. Rev., 2013, 113, 4035–4072 CrossRef CAS PubMed.
- T. Ueckert, R. Lamber, N. Jaeger and U. Schubert, Strong metal support interactions in a Ni/SiO2 catalyst prepared via sol-gel synthesis, Appl. Catal., A, 1997, 155, 75–85 CrossRef CAS.
- E. L. Strein and D. Allred, Eliminating carbon contamination on oxidized Si surfaces using a VUV excimer lamp, Thin Solid Films, 2008, 517, 1011–1015 CrossRef CAS.
- D. J. Morgan, Resolving ruthenium: XPS studies of common ruthenium materials, Surf. Interface Anal., 2015, 47, 1072–1079 CrossRef CAS.
- Y. Zhang, J. R. Evans and S. Yang, Corrected values for boiling points and enthalpies of vaporization of elements in handbooks, J. Chem. Eng. Data, 2011, 56, 328–337 CrossRef CAS.
- B. Zandkarimi, T. J. Gorey, G. Li, J. Munarriz, S. L. Anderson and A. N. Alexandrova, Alloying with Sn Suppresses Sintering of Size-Selected Sub-Nano Pt Clusters on SiO2 with and without Adsorbates, Chem. Mater., 2020, 32, 8595–8605 CrossRef CAS.
- E. T. Baxter, M.-A. Ha, A. C. Cass, A. N. Alexandrova and S. L. Anderson, Ethylene dehydrogenation on Pt4, 7, 8 clusters on Al2O3: Strong cluster size dependence linked to preferred catalyst morphologies, ACS Catal., 2017, 7, 3322–3335 CrossRef CAS.
- Y. Dai, T. J. Gorey, S. L. Anderson, S. Lee, S. Lee, S. Seifert and R. E. Winans, Inherent size effects on XANES of nanometer metal clusters: size-selected platinum clusters on silica, J. Phys. Chem. C, 2017, 121, 361–374 CrossRef CAS.
- L. Sutton, Tables of interatomic distances and configuration in molecules and ions, Chemical Society, 1965, 10 Search PubMed.
- S. Labich, E. Taglauer and H. Knözinger, Metal–support interactions on rhodium model catalysts, Top. Catal., 2000, 14, 153–161 CrossRef CAS.
- S. Lee, C. Fan, T. Wu and S. L. Anderson, CO oxidation on Au n/TiO2 catalysts produced by size-selected cluster deposition, J. Am. Chem. Soc., 2004, 126, 5682–5683 CrossRef CAS PubMed.
- R. White, T. Bennett, V. Golovko, G. G. Andersson and G. F. Metha, A Systematic Density Functional Theory Study of the Complete De–ligation of Ru3(CO)12, ChemistrySelect, 2016, 1, 1163–1167 CrossRef CAS.
- D. P. Anderson, J. F. Alvino, A. Gentleman, H. A. Qahtani, L. Thomsen, M. I. J. Polson, G. F. Metha, V. B. Golovko and G. G. Andersson, Chemically-synthesised, atomically-precise gold clusters deposited and activated on titania, Phys. Chem. Chem. Phys., 2013, 15, 3917 RSC.
- H. S. Al Qahtani, R. Higuchi, T. Sasaki, J. F. Alvino, G. F. Metha, V. B. Golovko, R. Adnan, G. G. Andersson and T. Nakayama, Grouping and aggregation of ligand protected Au9 clusters on TiO2 nanosheets, RSC Adv., 2016, 6, 110765–110774 RSC.
- D. P. Anderson, R. H. Adnan, J. F. Alvino, O. Shipper, B. Donoeva, J.-Y. Ruzicka, H. A. Qahtani, H. H. Harris, B. Cowie, J. B. Aitken, V. B. Golovko, G. F. Metha and G. G. Andersson, Chemically synthesised atomically precise gold clusters deposited and activated on titania. Part II, Phys. Chem. Chem. Phys., 2013, 15, 14806 RSC.
- Y. Kitsudo, A. Iwamoto, H. Matsumoto, K. Mitsuhara, T. Nishimura, M. Takizawa, T. Akita, Y. Maeda and Y. Kido, Final state effect for Au 4f line from gold-nano-particles grown on oxides and HOPG supports, Surf. Sci., 2009, 603, 2108–2114 CrossRef CAS.
- D.-C. Lim, C.-C. Hwang, G. Ganteför and Y. D. Kim, Model catalysts of supported Au nanoparticles and mass-selected clusters, Phys. Chem. Chem. Phys., 2010, 12, 15172–15180 RSC.
- C. C. Chusuei, X. Lai, K. Davis, E. Bowers, J. P. Fackler and D. Goodman, A nanoscale model catalyst preparation: Solution deposition of phosphine-stabilized gold clusters onto a planar TiO2 (110) support, Langmuir, 2001, 17, 4113–4117 CrossRef CAS.
- C. Vayenas, S. Brosda and C. Pliangos, The double-layer approach to promotion, electrocatalysis, electrochemical promotion, and metal–support interactions, J. Catal., 2003, 216, 487–504 CrossRef CAS.
- T. Ioannides and X. E. Verykios, Charge transfer in metal catalysts supported on doped TiO2: a theoretical approach based on metal–semiconductor contact theory, J. Catal., 1996, 161, 560–569 CrossRef CAS.
- L. Mezey and J. Giber, The surface free energies of solid chemical elements: calculation from internal free enthalpies of atomization, Jpn. J. Appl. Phys., 1982, 21, 1569 CrossRef CAS.
- Y. D. Kim, S. Schwegmann, A. P. Seitsonen and H. Over, Epitaxial growth of RuO2 (100) on Ru (1010): Surface structure and other properties, J. Phys. Chem. B, 2001, 105, 2205–2211 CrossRef CAS.
- A. Navrotsky, C. Ma, K. Lilova and N. Birkner, Nanophase transition metal oxides show large thermodynamically driven shifts in oxidation-reduction equilibria, Science, 2010, 330, 199–201 CrossRef CAS PubMed.
- D. R. Lide, CRC handbook of chemistry and physics: a ready-reference book of chemical and physical data, CRC press, 1995 Search PubMed.
- L. Wang, T. Maxisch and G. Ceder, Oxidation energies of transition metal oxides within the GGA+ U framework, Phys. Rev. B: Condens. Matter Mater. Phys., 2006, 73, 195107 CrossRef.
- E. Hebenstreit, W. Hebenstreit, H. Geisler, C. Ventrice Jr, P. Sprunger and U. Diebold, Bulk-defect dependent adsorption on a metal oxide surface: S/TiO2 (110), Surf. Sci., 2001, 486, L467–L474 CrossRef CAS.
- F. Pesty, H.-P. Steinrück and T. E. Madey, Thermal stability of Pt films on TiO2 (110): evidence for encapsulation, Surf. Sci., 1995, 339, 83–95 CrossRef CAS.
- Y. Gao, Y. Liang and S. Chambers, Thermal stability and the role of oxygen vacancy defects in strong metal support interaction—Pt on Nb-doped TiO2 (100), Surf. Sci., 1996, 365, 638–648 CrossRef CAS.
- O. Dulub, W. Hebenstreit and U. Diebold, Imaging cluster surfaces with atomic resolution: the strong metal-support interaction state of Pt supported on TiO 2 (110), Phys. Rev. Lett., 2000, 84, 3646 CrossRef CAS PubMed.
- H. R. Sadeghi and V. E. Henrich, Rh on TiO2: Model catalyst studies of the strong metal-support interaction, Appl. Surf. Sci., 1984, 19, 330–340 CrossRef CAS.
- H. R. Sadeghi and V. E. Henrich, Electronic interactions in the rhodium/TiO2 system, J. Catal., 1988, 109, 1–11 CrossRef CAS.
- Q. Fu and T. Wagner, Metal/oxide interfacial reactions: Oxidation of metals on SrTiO3 (100) and TiO2 (110), J. Phys. Chem. B, 2005, 109, 11697–11705 CrossRef CAS PubMed.
- A. Howard, C. Mitchell, D. Morris, R. Egdell and S. Parker, The surface structure of TiO2 (210) studied by atomically resolved STM and atomistic simulation, Surf. Sci., 2000, 448, 131–141 CrossRef CAS.
- R. Bennett, P. Stone and M. Bowker, Pd nanoparticle enhanced re-oxidation of non-stoichiometric TiO2: STM imaging of spillover and a new form of SMSI, Catal. Lett., 1999, 59, 99–105 CrossRef CAS.
- D. Mullins and K. Zhang, Metal–support interactions between Pt and thin film cerium oxide, Surf. Sci., 2002, 513, 163–173 CrossRef CAS.
- S. Tauster, S. Fung and R. L. Garten, Strong metal-support interactions. Group 8 noble metals supported on titanium dioxide, J. Am. Chem. Soc., 1978, 100, 170–175 CrossRef CAS.
- S. Tauster, S. Fung, R. Baker and J. Horsley, Strong interactions in supported-metal catalysts, Science, 1981, 211, 1121–1125 CrossRef CAS PubMed.
- G. L. Haller and D. E. Resasco, Metal–support interaction: Group VIII metals and reducible oxides, Advances in catalysis, Elsevier, 1989, pp. 173–235 Search PubMed.
- S. Bernal, F. Botana, J. Calvino, C. López, J. Pérez-Omil and J. Rodríguez-Izquierdo, High-resolution electron microscopy investigation of metal–support interactions in Rh/TiO 2, J. Chem. Soc., Faraday Trans., 1996, 92, 2799–2809 RSC.
- S. Bernal, J. Calvino, M. Cauqui, J. Gatica, C. L. Cartes, J. P. Omil and J. Pintado, Some contributions of electron microscopy to the characterisation of the strong metal–support interaction effect, Catal. Today, 2003, 77, 385–406 CrossRef CAS.
- T. Sham, T. Ohta, T. Yokoyama, Y. Kitajima, M. Funabashi, N. Kosugi and H. Kuroda, Ru L edge x-ray absorption studies of the electronic structure of Ru3(CO)12 adsorption and the formation of Ru–Cu bimetallics on Cu (111), J. Chem. Phys., 1988, 88, 475–477 CrossRef CAS.
- H. Feng, J. Lu, P. C. Stair and J. W. Elam, Alumina over-coating on Pd nanoparticle catalysts by atomic layer deposition: enhanced stability and reactivity, Catal. Lett., 2011, 141, 512–517 CrossRef CAS.
- W. Kurashige, R. Kumazawa, D. Ishii, R. Hayashi, Y. Niihori, S. Hossain, L. V. Nair, T. Takayama, A. Iwase, S. Yamazoe, T. Tsukuda, A. Kudo and Y. Negishi, Au25-Loaded BaLa4Ti4O15 Water-Splitting Photocatalyst with Enhanced Activity and Durability Produced Using New Chromium Oxide Shell Formation Method, J. Phys. Chem. C, 2018, 122, 13669–13681 CrossRef CAS.
- S. Vajda, M. J. Pellin, J. P. Greeley, C. L. Marshall, L. A. Curtiss, G. A. Ballentine, J. W. Elam, S. Catillon-Mucherie, P. C. Redfern and F. Mehmood, Subnanometre platinum clusters as highly active and selective catalysts for the oxidative dehydrogenation of propane, Nat. Mater., 2009, 8, 213–216 CrossRef CAS PubMed.
Footnote |
| † Electronic supplementary information (ESI) available. See DOI: 10.1039/d1na00181g |
| This journal is © The Royal Society of Chemistry 2021 |