
 Open Access Article
 This Open Access Article is licensed under a Creative Commons Attribution-Non Commercial 3.0 Unported Licence
Photo-tunable epsilon-near-zero behavior in a self-assembled liquid crystal – nanoparticle hybrid material†
Amit
Bhardwaj
ab,
Vimala
Sridurai
a,
Sachin A.
Bhat
a,
Channabasaveshwar V.
Yelamaggad
 a and
Geetha G.
Nair
*a
a and
Geetha G.
Nair
*a
aCentre for Nano and Soft Matter Sciences, Bengaluru-560013, India. E-mail: geeraj88@gmail.com
bManipal Academy of Higher Education, Manipal, Karnataka 576104, India
First published on 12th March 2021
Abstract
Dynamic tuning of electromagnetic response is an important parameter to realize exotic applications of optical metamaterials. Self-assembly achieved via the incorporation of soft materials is an attractive approach to achieve tunable optical properties. Among the soft materials, liquid crystals are highly sought after due to the inherent soft-stimuli responsiveness. This article reports experimental evidence of tunable epsilon-near-zero (ENZ) behavior brought about by an optical field in a self-assembled liquid crystal – nanoparticle system. The material consists of Au nanoparticles capped with a photo-active chiral liquid crystal ligand. In the liquid crystalline state, the system self-assembles into a helical lamellar superstructure, confirmed by polarizing optical microscopy, HRTEM, XRD, and circular dichroism studies. Upon irradiation with UV light, the localized surface plasmon resonance peak of Au red-shifts by ∼10 nm and gets restored with white light illumination. The effective permittivity of the system obtained from ellipsometry indicates ENZ behavior in the visible spectrum with a bandwidth of ∼45 nm which gets enhanced by a factor of 1.6 on UV illumination. Theoretical calculations, carried out using the effective medium approach, support the experimental findings, making the system an efficient ENZ metamaterial in the optical regime.
Introduction
Metamaterials are emerging materials where light–matter interactions are manipulated by tailoring the effective medium parameters like permittivity (ε) and permeability (μ).1 They are artificially engineered with building blocks known as ‘meta-atoms’ to realize properties such as negative refraction, epsilon-near-zero (ENZ), perfect lensing, and hyperbolicity, which are typically not achieved in naturally occurring systems.1,2 Materials exhibiting dielectric permittivity (ε) approaching zero at frequencies (ω) close to bulk plasmon frequency (ωp) are known as ENZ materials.3 The ENZ mode is a long-range plasmon mode, generally observed in thin films with a thickness less than the skin depth, and at least an order of magnitude smaller than the plasmon resonance wavelength.4 In such systems, near the plasmon resonance, the conduction current created by the drift of free electric charges effectively interacts with incident radiation as a continuous medium characterized by a Drude–Lorentz type dispersion, leading to ε values near-zero.3,4 At the ENZ wavelength, interesting phenomena such as diverging phase velocity, the consequent wavelength expansion (λENZ = λ0/neff, where λ0 is the free space wavelength, neff is the effective refractive index of the system), and a spatially uniform phase occur inside the material. ENZ materials find applications4–6 in super-coupling of light, waveguiding without loss, radiation shaping, and non-linear frequency conversion, to name a few. Recently Kharintsev et al. have demonstrated a ENZ based multimode superlens with potential application in Raman lasing.7 An even more elusive application proposed is ‘electric levitation’,8 although its experimental realization is challenging.ENZ behavior has been observed over a broad spectral regime, including microwave, infrared, visible, and ultraviolet, in a variety of materials4 such as metals, semi-metals, doped semiconductors, and photonic crystals. The early attempts to fabricate ENZ materials were to enhance antenna directivity in the microwave regime.9 A pioneering theoretical work done by Ziolkowski discusses an exciting prediction of how such zero-index materials can be used to transform a curved wavefront into a planar one.10 Engheta and coworkers have carried out extensive experimental and theoretical work on ENZ systems11,12 exhibiting interesting properties such as energy squeezing, tunneling, and radiation pattern shaping. The same group has demonstrated ENZ behavior in the optical regime using metal-dielectric nanostructures.13,14 Liu et al. have reported a photonic wire in the IR regime, an optical analogue of lumped circuit elements, using a hybrid semiconductor – metal system.15 Moitra et al. have demonstrated a zero-index optical metamaterial in an all-dielectric system to overcome the ohmic losses in metallic inclusions.16 The various systems cited above consist of nanostructures, the large-scale fabrication of which requires sophisticated and expensive techniques such as e-beam lithography, atomic layer deposition, focused ion beam milling, and pulsed laser ablation.
Self-assembly of nanoparticles into a periodic arrangement is a facile technique to realize metamaterial-based devices on a large scale. In recent years, periodic assembly of nanoparticles capped by suitable ligands is being pursued by several research groups towards achieving zero index behavior. Nanoparticles such as Au, Ag, and Al-doped ZnO (AZO) capped with organic ligands have been shown to exhibit ENZ in optical regime.17–19 Sheikholeslami et al. have achieved ENZ in a colloidal metamaterial, termed as ‘metafluid’, consisting of polystyrene and Ag nanoparticles connected via biotin-streptavidin linkage.20 More recently, a self-assembled system with SiO2 nanopillars has been demonstrated to exhibit ENZ in the mid-IR regime.21
However, in most of the systems cited in the literature, tunability of the ENZ properties is not done in situ. Although phase change materials such as VO2 and NaxWO3, are used for tuning the effective medium parameters,22,23 the technique is more intricate. On the other hand, soft materials such as polymers, colloidal dispersions, fluids, and liquid crystals offer immense scope in terms of processability and tunability.24 Among soft materials, liquid crystals (LCs) are preferred as materials of choice to bring about tunability in meta-properties25–27 due to their responsiveness to a wide range of stimuli, viz., thermal, mechanical, electrical, magnetic, and optical fields.28,29 Liquid crystal-nanoparticle hybrid systems are interesting materials to be used for this purpose.30,31 Lewandowski et al.32 have shown thermally tunable ENZ behavior in the optical regime in a self-assembled system of Ag nanoparticles capped with a LC ligand. However, thermal tunability still requires the sample to be cycled to high temperatures, which may be detrimental to the desired properties.
In the current work, we demonstrate the possibility to dynamically modify the metamaterial properties using an optical field applied to a photo-responsive sample at ambient temperatures. The system wherein Au nanoparticles (NPs) are capped with a photo-active LC ligand, forms a NP-LC hybrid structure. The self-assembly and the plasmonic behavior of the liquid crystal nanoparticle system are extensively studied. The system forms a soft metamaterial with a layered superstructure exhibiting ENZ behavior in the optical regime at room temperature. Further, the ENZ bandwidth is tuned efficiently by irradiating the material with actinic light.
Materials and methods
The system consists of gold nanoparticles (GNP for short) capped with a LC ligand. The ligand consists of a cholesteryl group attached to an azobenzene moiety and is denoted as ‘ALC’ hereafter. The azobenzene end of the ligand is attached to GNP by amine (–NH2) group. Azobenzene molecules are photo-responsive with the pristine state consisting of rod-like ‘trans’ isomers and the UV-induced state with bent ‘cis’ isomers.33 The effect of light on LC system consisting of azobenzene moiety either as a dopant or attached chemically is known to exhibit order to disorder transformation giving rise to isothermal phase transitions.34–36 The chemical structure of ALC is shown in Fig. S1, (ESI).†Synthesis of GNP-ALC
An aqueous solution of hydrogen tetrachloroaurate(III) (HAuCl4·3H2O) (10.2 mg, 30 mmol) dissolved in deionized water (∼8 ml) is prepared. This solution is added to ∼15 ml of dichloromethane (DCM) at room temperature to form an aqueous/organic liquid bilayer. The top aqueous phase of the resulting bilayer appears pale-yellow due to the presence of Au(III) ions. A solution of tetraoctylammonium bromide (TOAB) (27.3 mg, 50 mmol) dissolved in a minimum quantity of DCM is added to the liquid bilayer, and the mixture is hand-swirled vigorously. At this stage, the organic phase (DCM) gains an intense yellow color owing to the presence of Au(III) ions.A solution of ALC (145.3 mg, 6 equivalents) in DCM is slowly added, drop-wise, to a well-settled liquid bilayer while swirling the flask. The mixing is continued with hand-swirl for a while. The color of the organic layer turns deep-red, indicating the instant interaction between ALC ligands and Au(III) ions, resulting in the formation of gold nanoparticles capped with ALC (GNP-ALC, for short). The bilayer is allowed to settle, and the organic layer is collected separately and washed thoroughly with deionized water. The solvent is evaporated under a high vacuum, and the GNP-ALC material is obtained as a reddish-black mass. The material is purified by dissolving in hot ethanol, re-precipitating via centrifugation, followed by vacuum drying.
Thermogravimetric analysis (TGA)
TGA is carried out using a Thermogravimetric and Differential Thermal Analyzer (TGA/DTA) STA – 2500, NETZSCH. A weighed amount of GNP-ALC is placed on the sample pan, and the weight loss is obtained as a function of temperature.NMR studies
1H and 13C nuclear magnetic resonance (NMR) spectra are recorded using a Bruker AMX-400 spectrometer operating at 400 MHz for 1H and 100 MHz for 13C. Chemical shifts (δ) are reported in parts per million (ppm) relative to TMS using the residual CHCl3 peak in CDCl3 solution as internal standard (δ H 7.26 and δ C 77.0 relative to TMS). Multiplicities of the NMR peaks are presented as singlet, doublet, triplet, and multiplet. Coupling constants are given in Hertz (Hz).Polarizing optical microscopy (POM)
POM studies are carried out using an optical microscope (Leica, DM4500P) in conjunction with a hot stage (Mettler Toledo, HS82/HS1). The sample is sandwiched between two ITO coated glass plates treated for planar alignment, and microscopic textural changes are observed both in the heating and cooling cycles by ramping at 5 °C min−1.Differential scanning calorimetry (DSC)
The DSC thermograms are collected using the differential scanning calorimeter (Perkin Elmer DSC8000). The as synthesized sample is filled in an aluminum pan and hermetically sealed. The phase transition temperatures are obtained from the thermograms obtained both in heating and cooling cycles at a rate of 5 °C min−1.Circular dichroism (CD) studies
The CD spectra are recorded with the help of the Jasco J-810 spectropolarimeter. A thin film is prepared by inserting the material between a pair of quartz plates in the isotropic phase. The CD spectra are collected as a function of temperature on cooling the sample from the isotropic phase to the liquid crystalline phase (mesophase).HRTEM
The high-resolution transmission electron microscopy (HRTEM) is carried out using Thermo Fischer Scientific-TALOS F200S G2. For the measurements, the GNP-ALC is dissolved in DCM and is drop cast on the carbon-coated copper TEM grid (300 mesh). It is heated to ∼150 °C to evaporate the solvent and melt the sample to the mesophase. Subsequently, the sample is cooled quickly to room temperature for the thin film of the mesophase to form on the grid. The sample is left overnight at ambient temperatures to evaporate traces of DCM, if any.XRD
The X-ray diffraction (XRD) studies are performed in the transmission geometry by filling GNP-ALC in a 1 mm diameter glass capillary (Capillary Tube Supplies Ltd, UK). The Xenocs 2D image plate setup is used for the measurements. The sample is illuminated with Cu Kα (λ = 0.15406 nm) radiation from the source (GeniX3D, Xenocs) operating at 50 kV and 0.6 mA, in conjunction with a multilayer mirror for beam optics.UV-visible spectrometry
The absorption spectra of the sample are collected in the wavelength range 250–800 nm using UV-vis-NIR spectrophotometer (Perkin Elmer, Lambda 750). For solution state studies, GNP-ALC is dissolved in DCM and filled in a quartz cuvette (with 10 mm optical path). The data in the LC phase is collected by uniformly spreading a thin film on a quartz substrate. The actinic light (UV or white light) is irradiated ex-situ on the sample to study the photo-induced effect.Atomic force microscopy (AFM)
The thickness of GNP-ALC film, used for ellipsometry (described below), is determined by morphological studies using AFM (Agilent technologies, Model-5000).Ellipsometry
GNP-ALC is dissolved in DCM and spin-coated on boron-doped silicon substrate [111] to obtain a thin film of uniform thickness for the ellipsometry measurements. The uniformity is achieved by optimizing the spin parameters, such as rpm, duration, acceleration, and deceleration. The sample is heated to ∼150 °C and subsequently cooled at the rate of 5 °C min−1 to room temperature to obtain a uniform thin film. The thickness of the film measured using the AFM is found to be ∼20 nm (as discussed in ESI, Section S2 and Fig. S2†).The thin film formed on the silicon substrate is mounted onto the spectroscopic ellipsometer (J.A. Woollam, M2000X) stage. The amplitude (psi) and phase (delta) of the reflected light from the surface of the sample are acquired at the incidence angles of 55°, 60°, and 65°, in the wavelength range 250–1000 nm with a resolution of 1.6 nm per step. The effective permittivity (εeff) and optical constants (refractive index, neff and absorption coefficient, keff) are extracted by fitting the spectral dependence of psi and delta values to a model using the CompleteEASE software by minimizing the mean square of variance.
Numerical calculations
The effective medium permittivity of the GNP-ALC system is simulated analytically using in-house developed MATLAB codes with the Clausius–Mossotti approach.Results and discussion
Morphological and structural characterization
The GNP-ALC consists of Au nanoparticles that are chemically linked to ALC and thus forms an Au core and LC shell system. NMR studies (discussed in Section S3(i) of ESI†) confirm that the composition of the ligand ALC is retained in the compound GNP-ALC (see Fig. S3 and S4 in ESI† for the NMR data). TEM measurements reveal that the average size of the Au NPs is 3.2 nm, obtained by considering around 250 particles (see Fig. 1). Polarizing optical microscopy (POM) reveals that the as-synthesized material is crystalline at room temperature. Upon heating, the sample melts at 90.2 °C into a mesophase with a non-descript texture. On further heating, the mesophase gradually transforms to isotropic phase starting at 183.2 °C. The complete transition to isotropic takes place at 203.5 °C. Leaving the sample in the isotropic phase (200 °C and above) for long durations leads to degradation of the sample, and therefore, for most experimental studies, the sample is heated only up to ∼180 °C and not beyond this. On cooling from 180 °C, tiny batonnets starts appearing at 165 °C which on further cooling, transform to broken focal conic texture (Fig. 2a). The mesophase is stable up to room temperature. On second heating the onset to isotropic phase from the mesophase takes place directly. The POM corresponding to cooling/heating cycles at different temperatures are given in ESI (Fig. S5 and S6†).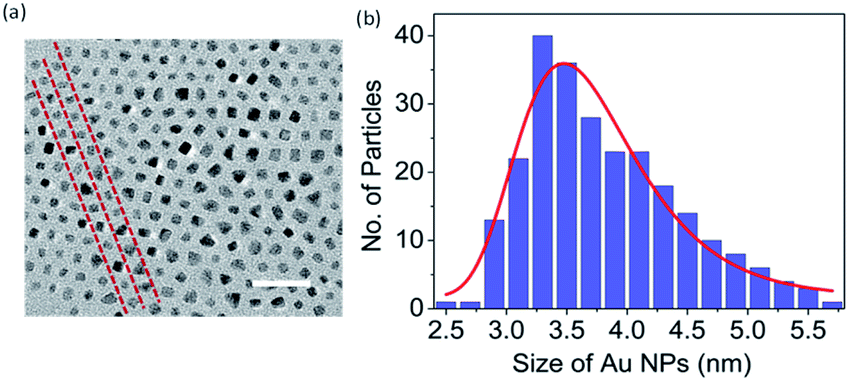 | ||
| Fig. 1 (a) HRTEM image and (b) size distribution of the Au nanoparticles of the GNP-ALC system. The dashed red lines in (a) are guide to eye to indicate the periodic arrangement of the Au nanoparticles. Scale bar in (a) is 25 nm. | ||
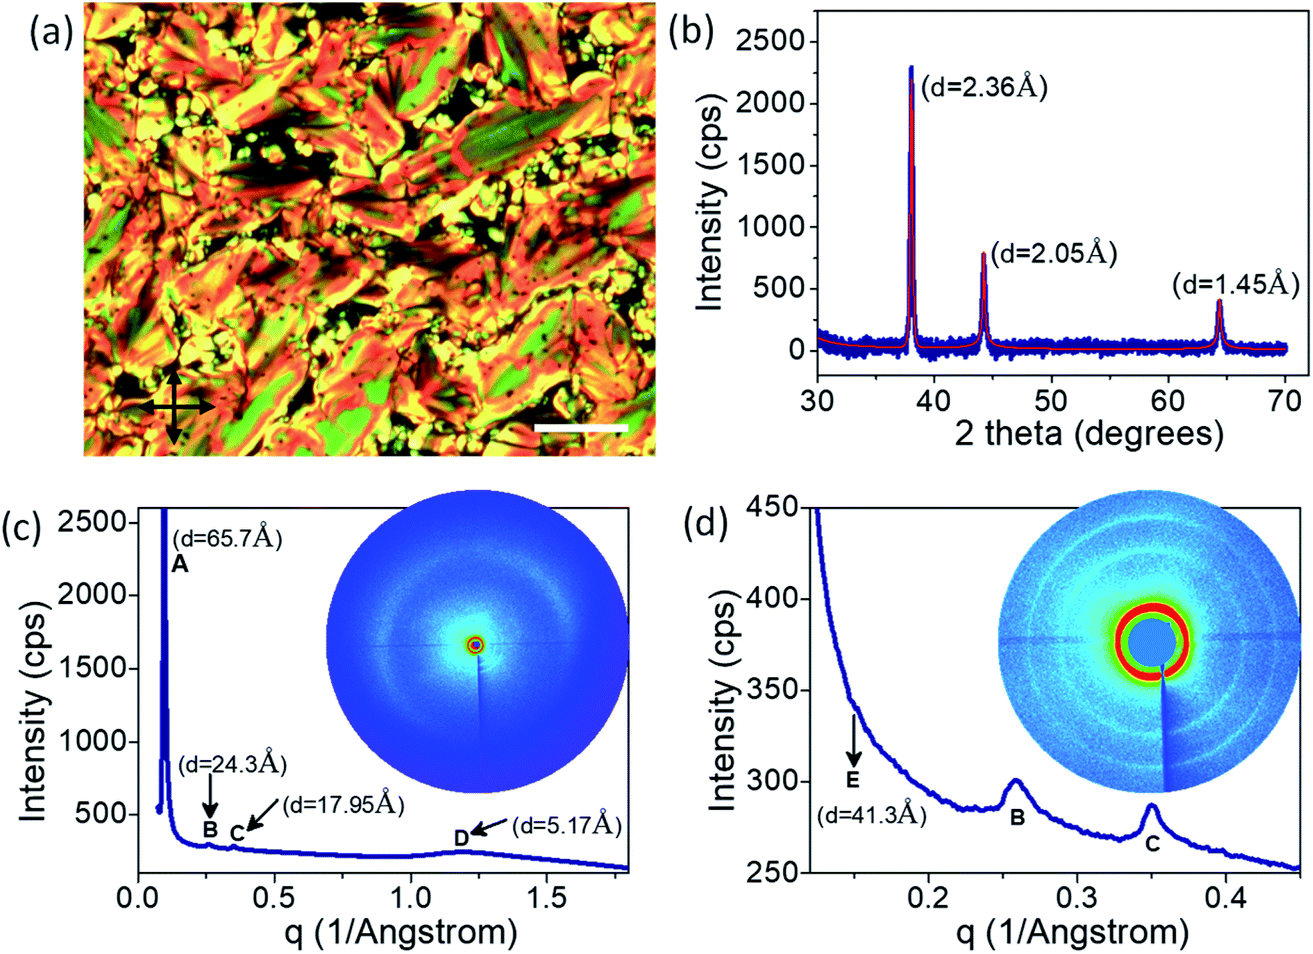 | ||
| Fig. 2 (a) POM texture obtained at ∼140 °C in the cooling cycle and (b) XRD profile of the GNP-ALC system at room temperature exhibiting (b) the Au peaks, (c) and (d) peaks corresponding to lamellar liquid crystalline phase. The corresponding d-spacing values are given next to the peak. Insets to (c) and (d) show the respective 2D XRD images. Scale bar in (a) is 25 μm. | ||
The thermal stability was examined with the help of thermogravimetric (TGA) analysis. The TGA profile shown in Fig. S8 (Section S3(ii), ESI†) reveals that the compound is stable up to ∼225 °C in compliance with POM observations. On further heating the sample gets decomposed slowly and complete degradation takes place at ∼400 °C leaving behind the gold moiety. Differential scanning calorimetric (DSC) studies also support POM observations and indicate that the sample melts into mesophase from ∼80 °C to 90 °C, and the mesophase is retained in the thermal range ∼150 °C to ∼25 °C in the cooling cycle. The DSC profiles and more detailed explanations are given in ESI (Section S3(iii), and Fig. S9†).
Thus, POM and DSC studies indicate that the mesophase is enantiotropic and is stable at ambient temperatures (∼25 °C) for at least two days. Further, the POM image obtained at room temperature clearly shows bands across the broken focal conic texture, indicating that the mesophase is a chiral layered phase (see Fig. 2a). It must be mentioned here that a thin film of the sample, when spin coated on silicon substrate (for ellipsometric studies, which will be discussed later), exhibits predominantly a homeotropic alignment as shown in Fig. S7.†
Circular dichroism (CD) experiments are carried out to confirm the chiral mesophase formation and determine the helical sense of GNP-ALC as well as the ligand, ALC. The temperature-dependent CD spectra are given in Fig. S10, ESI.† It is observed that CD activity (helicity) is present in the mesophase for both ALC and GNP-ALC. But unlike the ligand, the GNP-ALC shows helicity even at room temperature as the mesophase is stabilized at room temperature (see Fig. S10b†). A more detailed discussion on the CD studies is given in ESI, Section S4.†
The X-ray diffraction studies carried out at room temperature are shown in Fig. 2b–d. The three sharp peaks in the wide-angle scattering regime with d-spacing of 2.36 Å, 2.05 Å, and 1.45 Å correspond to the (111), (200), and (220) planes of Au face-centered cubic (FCC) lattice (Fig. 2b). The 2D-XRD image and the corresponding scattering vector dependence of the 1D profile of the liquid crystalline peaks are given in Fig. 2c and d. The broad peak with d-spacing of 5.2 Å (labelled as ‘D’ in Fig. 2c) corresponds to the intermolecular distance along the width of the ligands.37 Further, a sharp peak at d = 65.7 Å and two more strong peaks at d = 24.3 Å and 17.9 Å (labelled as ‘A,’ ‘B’ and ‘C’ in Fig. 2c and d) are observed in the low angle regime. The ratio of their scattering vector values is ∼1![[thin space (1/6-em)]](https://www.rsc.org/images/entities/char_2009.gif) :2:3, clearly indicating the presence of a lamellar phase with a layer spacing of 65.7 Å.31,38,39 Additionally, a weak peak at d = 41.3 Å (labelled ‘E’ in Fig. 2d) is observed in the low angle regime, which is attributed to the interparticle spacing between GNP within each layer.32
:2:3, clearly indicating the presence of a lamellar phase with a layer spacing of 65.7 Å.31,38,39 Additionally, a weak peak at d = 41.3 Å (labelled ‘E’ in Fig. 2d) is observed in the low angle regime, which is attributed to the interparticle spacing between GNP within each layer.32
The length of the ALC molecule, as calculated from the Avogadro software (ver. 1.2.0) is 36.02 Å. As the GNP-ALC system consists of Au nanoparticles attached with ALC ligands, the layer spacing for the lamellar phase is calculated to be 104.04 Å given by the formula a + 2dL, where ‘a’ and ‘dL’ correspond to the nanoparticle size (32 Å) and ligand length (36.02 Å) respectively. But, experimentally, the layer spacing as obtained from XRD studies is 65.7 Å (see Fig. 2c). The reduction in the layer spacing, indicates the intercalation of ALC molecules in the adjacent layers.39,40 Further, the circular dichroism studies (see ESI Section S4†) indicate the mesophase to be a left-handed chiral system. Thus, the GNP-ALC system forms a self-assembled chiral intercalated lamellar superstructure as depicted in Fig. 3.
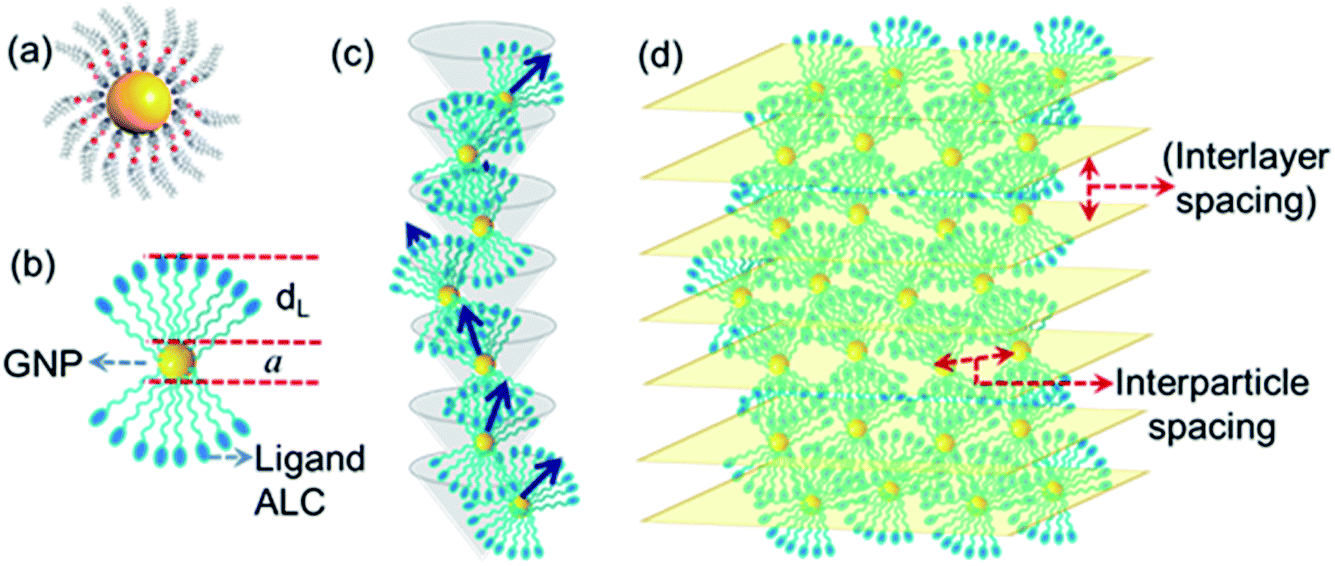 | ||
| Fig. 3 Schematic representation of (a and b) a single molecule of GNP-ALC, (c) the left-handed helical arrangement, and (d) the chiral lamellar superstructure formed due to self-assembly of the molecules. | ||
Optical tuning of plasmon resonance
The UV-visible absorption spectra for the thin film of GNP-ALC deposited on quartz plate is shown in Fig. 4a. The two peaks at 380 and 450 nm correspond to π–π* and n–π* transitions of the azobenzene group present in the LC ligand. Similar spectral behaviour is obtained for the sample in DCM (solution state), as shown in Fig. S11a (ESI, Section S5†). It is well known that upon UV irradiation (365 nm) the peak corresponding to π–π* weakens owing to the conversion of ‘trans’ isomers to the high energy ‘cis’ isomers. The effect due to the photo-isomerization is evident from the spectra shown in Fig. 4b. When white light (∼450 nm) is irradiated, the strength of the 380 nm peak is regained, indicating reverse photo-isomerization from ‘cis’ to ‘trans’ isomers.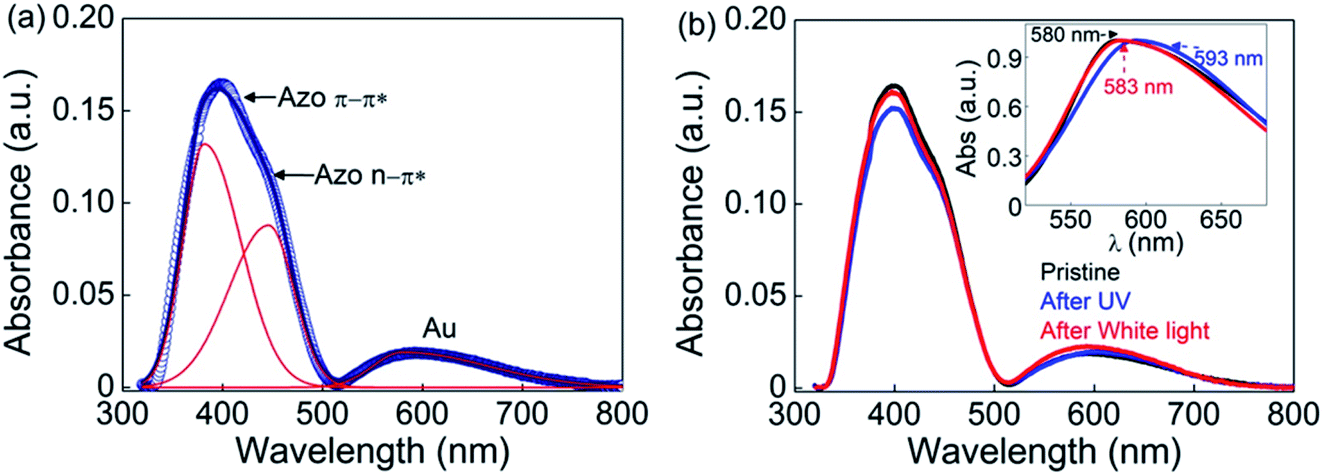 | ||
| Fig. 4 UV-vis absorbance spectra in the (a) pristine state and (b) pristine, UV-irradiated and white light illuminated states for the thin film of GNP-ALC. Inset to (b) shows the normalised profiles of the Au peak in the three states. | ||
In addition to the azobenzene peaks discussed above, a third strong peak is seen at 580 nm, which corresponds to the localized surface plasmon resonance (LSPR) peak of gold (see Fig. 4a). It must be noted that in DCM, the LSPR peak appears at ∼520 nm (see Fig. S11†). The difference in the peak position can be understood as follows: in the solution form, all the Au NPs (capped with the ligand) are randomly dispersed in DCM, and the LSPR arises due to the collective response from the freely suspended Au NPs. Whereas in the thin film (of the mesophase), due to the self-assembly of the GNP-ALC molecules, the distance between the Au particles in the adjacent layers and within the layer of the lamellar superstructure gets fixed. This increases the damping force for the plasmon oscillations, leading to a red-shift of the LSPR peak in the mesophase.41
When the thin film of GNP-ALC is irradiated with UV (2.5 mW for 15 min), the LSPR peak of Au at 580 nm gets red-shifted to 593 nm, as shown in the inset to Fig. 4b. The photo-isomerization from ‘trans’ to ‘cis’ state leads to an increase in the dipole moment of the azobenzene moieties, and hence the dielectric permittivity of the ALC ligand.33 Additionally, due to the bent-shape of cis isomers, the interlayer spacing, and also the interparticle distance between the Au NPs decreases.42 The above factors contribute to the red-shifting of LSPR peak with UV irradiation.41 Upon white light irradiation (for ∼15 minutes), the LSPR peak reverts to its original position (∼582 nm) (see Fig. 4b), again, due to the reverse photo-isomerization. Thus, an optical field-induced tuning of the LSPR peak wavelength by ∼10 nm is obtained in the visible regime. The red-shift of LSPR peak with UV irradiation is also seen in the solution state (see Fig. S11b, ESI†). A similar shift (∼15 nm) in the plasmonic peak of gold nanoparticles is reported43 in a system composed of ‘spiropyran’ based photoactive molecules, which also exhibits a change in dipole moment in the ‘cis’ state. Thus, the enhancement in plasmonic peak shift possibly could be achieved either by altering the molecular conformation and/or the dipole moment.
Epsilon-near-zero behavior
The real and imaginary parts of effective permittivity (εeff) extracted from the fit are given in Fig. 5. The εeff exhibits a harmonic oscillator-like behavior with the real part of permittivity, Re(εeff), featuring a dip followed by a peak, while the imaginary part, Im(εeff) showing a peak in the same regime. In the pristine state, the Re(εeff) crosses zero (goes from +ve to −ve) at 522 nm. The ENZ regime extends up to 565 nm with an approximate bandwidth of 43 nm, as seen from Fig. 5a. For the UV irradiated case, εeff extracted using the same model exhibit the following features: the Re(εeff) crosses zero at 508 nm itself, with the ENZ behavior extending to 576 nm. Hence the effective ENZ bandwidth is increased to 68 nm, as shown in Fig. 5b. Thus, UV irradiation enhances the ENZ range by a factor of ∼1.6 compared to that of the pristine case. Also note that, in the UV induced state, the Re(εeff) dips to a much lower value of −0.57 compared to −0.24 in the pristine state. For the sake of completion, the effective optical constants, i.e., refractive index (neff) and absorption coefficient (keff) are also extracted from the psi and delta profiles (see Fig. S13, ESI†). From the wavelength dependence of εeff and optical constants (Fig. 5 and S13†), it is clear that in the ENZ regime, even though the ‘neff’ values are above unity, ‘keff’ values are much greater than neff leading to negative Re(εeff) according to the relation Re(εeff) = (neff)2 − (keff)2.
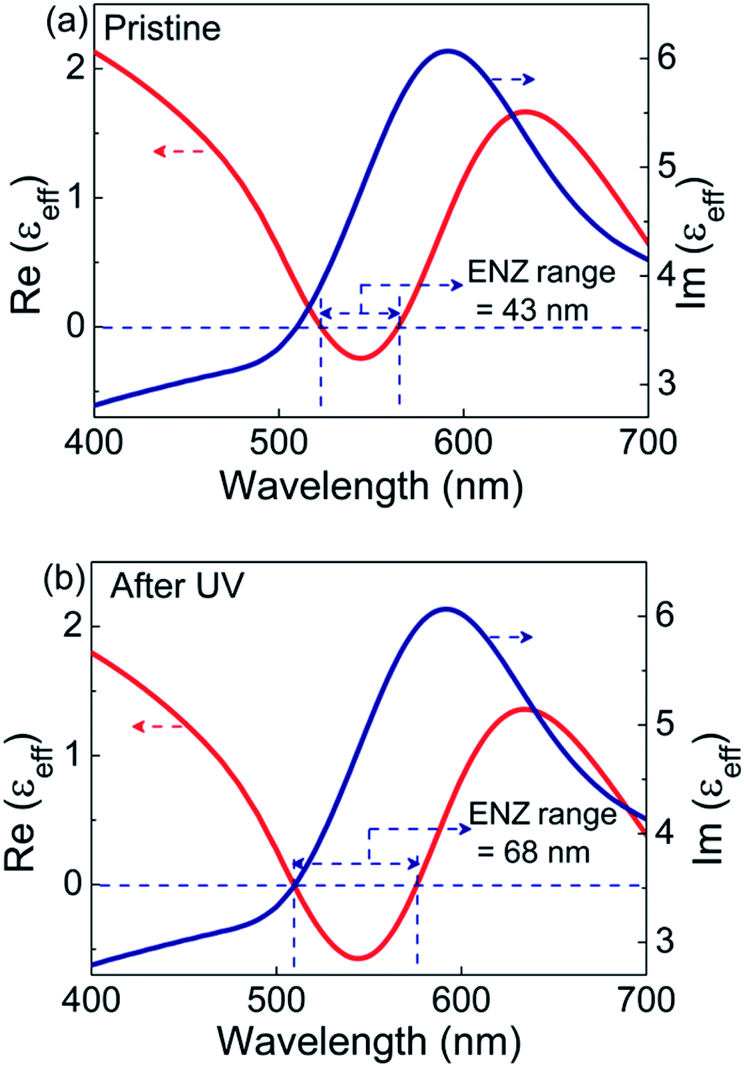 | ||
| Fig. 5 The real and imaginary parts of the effective permittivity (εeff) extracted from the psi and delta values obtained from ellipsometry in the (a) pristine and (b) UV irradiated states. | ||
where, f = (4πr3)/(3L3) is the volume fraction occupied by the Au nanospheres. The lattice constant ‘L’ in the pristine state is 4.1 nm, taken from the interparticle distance obtained from XRD studies (see Fig. 2c, d and 3). In the UV irradiated state, ‘L’ is estimated to be 4 nm, based on the calculated molecular lengths in the trans and cis states of ALC (see ESI, Section S7† for the details of the calculation). ‘kp’ = 2πnp/λ is the wave vector of the Au NP. εr = εp/εm, where εp and εm are the permittivity of the Au NPs and the surrounding medium (ALC), respectively. Here, ‘F’ is a function defined as: [2
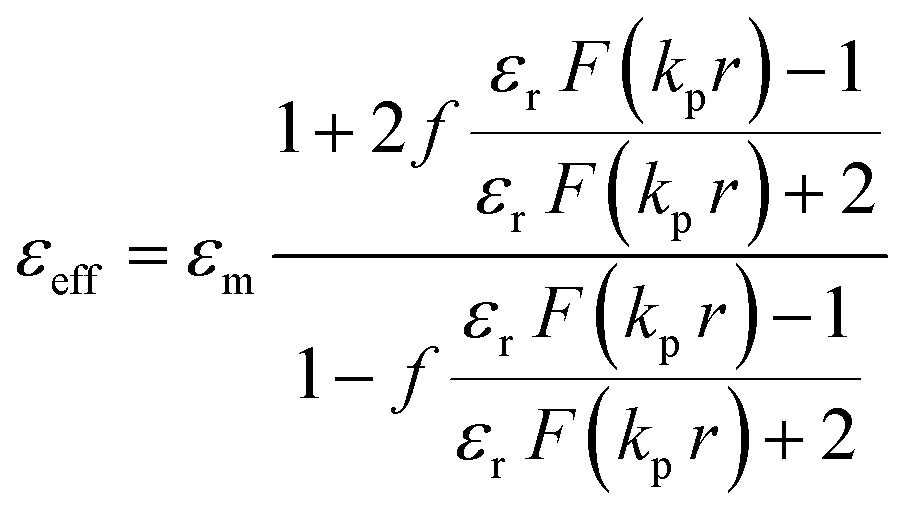 sin(x) − xcos(x)]/[xcos(x) + (x2 − 1)sin(x)], where x = kpr.
The spectral dependence of effective permittivity of the GNP-ALC system, thus calculated, is plotted in Fig. 6. The Re(εeff) and Im(εeff) exhibit spectral dependence similar to what is obtained from the ellipsometry data (see Fig. 5). In the pristine state, the ENZ occurs from 530 to 561 nm with a bandwidth of 31 nm. For the UV-irradiated state, the ENZ regime extends from 523 to 586 nm with a bandwidth of 53 nm. Thus, the ENZ spectral regime is enhanced by a factor of 1.7, which is in good agreement with ellipsometry results. Further, the Re(εeff) dips to a lower value of −0.14 in the UV-irradiated state compared to the pristine state, i.e., −0.02, once again in agreement with the ellipsometry data. However, the theoretical calculations show a slight deviation from the experimental profile in the blue spectral regime possibly because the effect of anisotropy and the dispersion in refractive index of the LC medium are not considered. It must be mentioned here that a similar theoretical approach was successfully employed in a system reported by Górecka's group32 to model the ENZ behaviour.
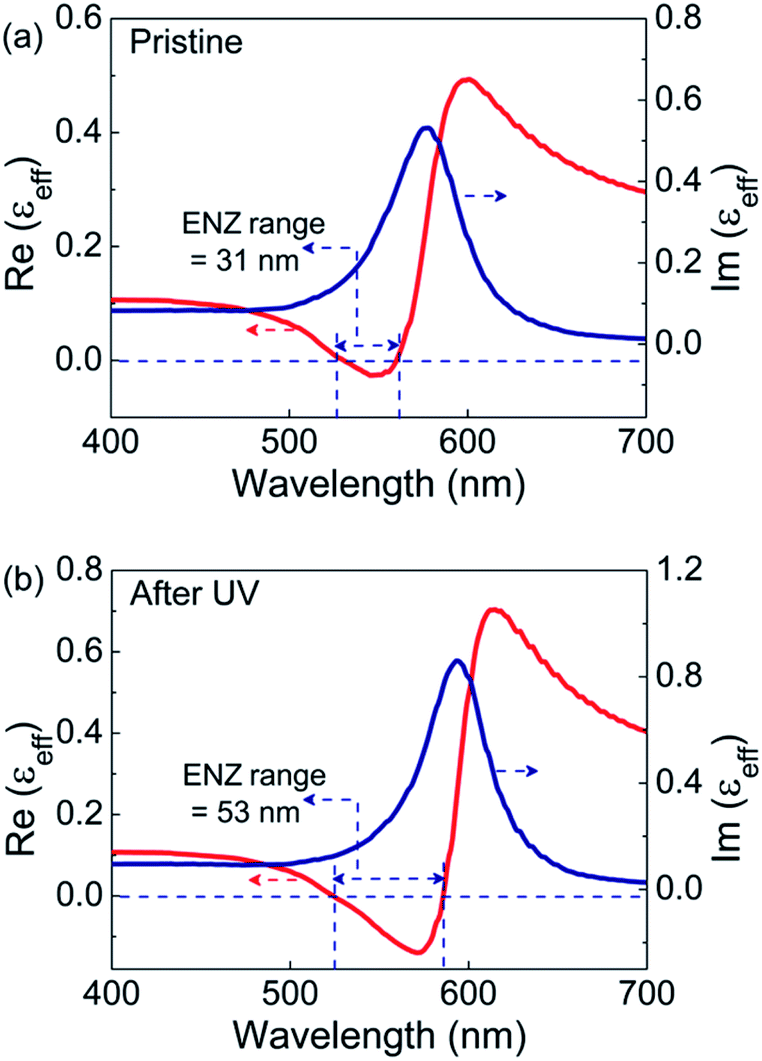 | ||
| Fig. 6 The real and imaginary parts of the effective permittivity (εeff) calculated from numerical simulations in the (a) pristine and (b) UV irradiated states. | ||
Thus, GNP-ALC system, with a chiral lamellar superstructure leading to periodic self-assembly of Au nanoparticles, exhibits a tunable LSPR, and ENZ behavior in the optical regime. The LSPR tunability brought about by the photo-induced effect augments the ENZ bandwidth at room temperature.
Conclusion
A photo-active liquid crystal – nanoparticle hybrid system is synthesized with Au nanoparticle capped with a chiral liquid crystal ligand. Due to the liquid crystalline nature of the ligand, the system self-assembles into a left-handed helical intercalated lamellar superstructure, confirmed by polarizing optical microscopy, XRD, HRTEM and circular dichroism studies. The presence of the azobenzene moiety in the ligand makes the system photo-responsive due to which the LSPR peak wavelength of Au is tuned (red-shifted) by ∼10 nm upon UV irradiation. The peak wavelength reverts to its original value when illuminated with white light. The experimentally obtained psi and delta values from the ellipsometry are fitted to an effective medium model to extract the real and imaginary permittivity values. The data clearly shows the evidence of ENZ (epsilon dropping below zero) behavior indicating that the system has the characteristics of a soft-metamaterial. Further the ENZ bandwidth gets enhanced by a factor of 1.6 upon UV irradiation leading to an optical-field induced tunable ENZ behavior. Theoretical simulations carried out using the Clausius–Mossotti effective medium approach support the experimental findings. Thus, GNP-ALC is an efficient tunable ENZ metamaterial in the optical regime with potential applications in waveguiding, super-coupling, directional emission, and optical signal modulation.Conflicts of interest
There are no conflicts to declare.Acknowledgements
GGN and VS express their gratitude for the funding from Thematic Project in Frontiers of Nano S&T “Chemical Physics of Functional Nanostructures and Interfaces” (TPF Nano Mission Project: SR/NM/TP-25/2016), Nano Mission, Department of Science and Technology (DST), New Delhi, India. The authors acknowledge the Central Research Facility, Centre for Nano and Soft Matter Sciences, for the TGA, DSC, CD, TEM, UV-vis, and AFM experimental facilities. The authors also acknowledge Central Manufacturing Technology Institute (CMTI), Bengaluru, for the ellipsometry measurements.References
- C. Wenshan and V. Shalaev, Optical Metamaterials: Fundamentals and Applications, Springer, 2010 Search PubMed.
- A. M. Urbas, Z. Jacob, L. D. Negro, N. Engheta, A. D. Boardman, P. Egan, A. B. Khanikaev, V. Menon, M. Ferrera and N. Kinsey, et al. , J. Opt., 2016, 18, 093005 CrossRef.
- M. G. Silveirinha, A. Alù, B. Edwards and N. Engheta, URSI General Assembly: IL, 2008, 44 Search PubMed.
- N. Kinsey, C. Devault, A. Boltasseva and V. Shalaev, Nat. Rev. Mater., 2019, 4, 742–760 CrossRef CAS.
- M. Z. Alam, S. A. Schulz, J. Upham, I. De Leon and R. W. Boyd, Nat. Photonics, 2018, 12, 79–83 CrossRef CAS.
- X. Niu, X. Hu, S. Chu and Q. Gong, Adv. Opt. Mater., 2018, 1701292 CrossRef.
- S. S. Kharintsev, A. V. Kharitonov, A. M. Alekseev and S. G. Kazarian, Nanoscale, 2019, 11, 7710–7719 RSC.
- F. J. R. Fortuño, A. Vakil and N. Engheta, Phys. Rev. Lett., 2014, 112, 033902 CrossRef PubMed.
- S. Enoch, G. Tayeb, P. Sabouroux, N. Guérin and P. Vincent, Phys. Rev. Lett., 2002, 89, 213902 CrossRef PubMed.
- R. W. Ziolkowski, Phys. Rev. E: Stat., Nonlinear, Soft Matter Phys., 2004, 70, 046608 CrossRef PubMed.
- B. Edwards, A. Alù, M. E. Young, M. Silveirinha and N. Engheta, Phys. Rev. Lett., 2008, 100, 033903 CrossRef PubMed.
- A. Alù, M. G. Silveirinha, A. Salandrino and N. Engheta, Phys. Rev. B: Condens. Matter Mater. Phys., 2007, 75, 155410 CrossRef.
- E. J. R. Vesseur, T. Coenen, H. Caglayan, N. Engheta and A. Polman, Phys. Rev. Lett., 2013, 110, 013902 CrossRef PubMed.
- R. Maas, J. Parsons, N. Engheta and A. Polman, Nat. Photonics, 2013, 7, 907–912 CrossRef CAS.
- R. Liu, C. M. Roberts, Y. Zhong, V. A. Podolskiy and D. Wasserman, ACS Photonics, 2016, 3(6), 1045–1052 CrossRef CAS.
- P. Moitra, Y. Yang, Z. Anderson, I. I. Kravchenko, D. P. Briggs and J. Valentine, Nat. Photonics, 2013, 7, 791–795 CrossRef CAS.
- H. Alisafaee and M. A. Fiddy, J. Nanophotonics, 2014, 8, 083898 CrossRef.
- J. Fontana, J. Naciri, R. Rendell and B. R. Ratna, Adv. Opt. Mater., 2013, 1, 100–106 CrossRef.
- K. L. Young, M. B. Ross, M. G. Blaber, M. Rycenga, M. R. Jones, C. Zhang, A. J. Senesi, B. Lee, G. C. Schatz and C. A. Mirkin, Adv. Mater., 2014, 26, 653–659 CrossRef CAS PubMed.
- S. N. Sheikholeslami, H. Alaeian, A. L. Koh and J. A. Dionne, Nano Lett., 2013, 13(9), 4137–4141 CrossRef CAS PubMed.
- K. Ito, Y. Yamada, A. Miuraa and H. Iizuka, RSC Adv., 2019, 9, 16431–16438 RSC.
- M. J. Dicken, K. Aydin, I. M. Pryce, L. A. Sweatlock, E. M. Boyd, S. Walavalkar, J. Ma and H. A. Atwater, Opt. Express, 2009, 17(20), 18330–18339 CrossRef CAS PubMed.
- Z. Fusco, M. Taheri, R. Bo, T. T. Phu, H. Chen, X. Guo, Y. Zhu, T. Tsuzuki, T. P. White and A. Tricoli, Nano Lett., 2020, 20(5), 3970–3977 CrossRef CAS PubMed.
- Y. Chen, B. Ai and Z. J. Wong, Nano Convergence, 2020, 7, 18 CrossRef CAS PubMed.
- C. M. Soukoulis and M. Wegener, Nat. Photonics, 2011, 5, 523–528 CrossRef CAS.
- A. Bhardwaj, V. Sridurai, N. M. Puthoor, A. B. Nair, T. Ahuja and G. G. Nair, Adv. Opt. Mater., 2020, 8(11), 1901842 CrossRef CAS.
- A. Bhardwaj, N. M. Puthoor and G. G. Nair, J. Phys. Chem. C, 2020, 124(34), 18698–18706 CrossRef CAS.
- Q. Li, Liquid crystals beyond displays, Wiley, New Jersey, Canada, 2012 Search PubMed.
- P. G. de Gennes and J. Prost, The physics of Liquid Crystals, Oxford University Press, Newyork, 2nd edn, 1993 Search PubMed.
- G. L. Nealon, R. Greget, C. Dominguez, Z. T. Nagy, D. Guillon, J.-L. Gallan and B. Donnio, J. Org. Chem., 2012, 8, 349–370 CAS.
- W. Lewandowski, D. Constantin, K. Walicka, D. Pociecha, J. Mieczkowskia and E. Górecka, Chem. Commun., 2013, 49, 7845 RSC.
- W. Lewandowski, M. Fruhnert, J. Mieczkowski, C. Rockstuhl and E. Górecka, Nat. Commun., 2015, 6, 6590 CrossRef PubMed.
- G. S. Hartley, Nature, 1937, 140, 281 CrossRef CAS.
- Y. Zhao and T. Ikeda, Smart light-responsive materials: Azobenzene containing polymers and liquid crystals, Wiley, New Jersey (NJ), 2009 Search PubMed.
- G. G. Nair, S. K. Prasad and C. V. Yelamaggad, J. Appl. Phys., 2000, 87(5), 2084–2089 CrossRef CAS.
- H. K. Bisoyi and Q. Li, Chem. Rev., 2016, 116(24), 15089–15166 CrossRef CAS PubMed.
- S. Kumar, Liquid Crystals: Experimental study of physical properties and phase transitions, Cambridge University Press, Cambridge, UK, 2001 Search PubMed.
- S. Dai, Z. Cai, Z. Peng, Z. Wang, B. Tong, J. Shi, S. Gan, Q. He, W. Chen and Y. Dong, Mater. Chem. Front., 2019, 3, 1105 RSC.
- W. Lewandowski, T. Łojewska, P. Szustakiewicz, J. Mieczkowskia and D. Pociechaa, Nanoscale, 2016, 8, 2656–2663 RSC.
- R. J. Mandle and J. W. Goodby, Soft Matter, 2016, 12, 1436–1443 RSC.
- T. Sannomiya, J. Junesch and P. Rajendran, J. Opt. Res., 2013, 15, 73–92 Search PubMed.
- A. Zep, M. M. Wojcik, W. Lewandowski, K. Sitkowska, A. Prominski, J. Mieczkowski, D. Pociecha and E. Gorecka, Angew. Chem., 2014, 53, 13725–13728 CrossRef CAS PubMed.
- P. K. Kundu, D. Samanta, R. Leizrowice, B. Margulis, H. Zhao, M. Börner, T. Udayabhaskararao, D. Manna and R. Klajn, Light-controlled self-assembly of non-photoresponsive nanoparticles, Nat. Chem., 2015, 7, 646–652 CrossRef CAS PubMed.
- C. M. Herzinger, B. Johs, W. A. McGahan and J. A. Woollam, J. Appl. Phys., 1998, 83, 3323 CrossRef CAS.
- D. E. Aspnes and A. A. Studna, Phys. Rev. B: Condens. Matter Mater. Phys., 1983, 27, 985–1009 CrossRef CAS.
- L. V. Rodríguez-de Marcos, J. I. Larruquert, J. A. Méndez and J. A. Aznárez, Opt. Mater. Express, 2016, 6, 3622–3637 CrossRef.
- S. Steshenko, F. Capolino, P. Alitalo and S. Tretyakov, Phys. Rev. E: Stat., Nonlinear, Soft Matter Phys., 2011, 84, 016607 CrossRef PubMed.
- E. F. Kuester, N. Memic, S. Shen, A. Scher, S. Kim, K. Kumley and H. Loui, Prog. Electromagn. Res. B, 2011, 33, 175–202 CrossRef.
- T. W. H. Oates, H. Wormeester and H. Arwin, Prog. Surf. Sci., 2011, 86, 328–376 CrossRef CAS.
- S. Mühlig, C. Rockstuhl, J. Pniewski, C. R. Simovski, S. A. Tretyakov and F. Lederer, Phys. Rev. B: Condens. Matter Mater. Phys., 2010, 81, 075317 CrossRef.
- P. B. Johnson and R. W. Christy, Phys. Rev. B: Solid State, 1972, 6, 4370 CrossRef CAS.
Footnote |
| † Electronic supplementary information (ESI) available: Chemical structure of the photoactive liquid crystal ligand, AFM studies, chemical characterization of the GNP-ALC system, circular dichroism studies, UV-visible spectroscopy in solution state, ellipsometry and effective medium parameters. See DOI: 10.1039/d0na01039a |
| This journal is © The Royal Society of Chemistry 2021 |