 Open Access Article
Influence of surface charge of graphene quantum dots on their uptake and clearance in melanoma cells†
Lakshmi Narashimhan
Ramana
*a,
Le N. M.
Dinh
b and
Vipul
Agarwal
 *b
*b
aMultidisciplinary Clinical and Translational Research Group (MCTR), Translational Health Science and Technology Institute (THSTI), Faridabad, Haryana 121001, India. E-mail: lnramana@thsti.res.in
bCentre for Advanced Macromolecular Design (CAMD), School of Chemical Engineering, University of New South Wales, Sydney, NSW 2052, Australia. E-mail: agarwalvipul84@gmail.com
First published on 15th April 2021
Abstract
Graphene quantum dots (GQDs) continue to draw interest in biomedical applications. However, their efficacy gets compromised due to their rapid clearance from the body. On one hand, rapid clearance is desired and considered advantageous in terms of their cytocompatibility, but on the other hand, it is a major limitation for their prolonged use as imaging and therapeutic probes. The uptake and clearance of GQDs have been described in vivo, however, their clearance in vitro is still not understood, one of the main reasons being that their uptake and clearance are a cell type-dependent phenomena. Studies on other types of quantum dots revealed the importance of surface charge in their uptake and retention in different cell types. However, the role of surface chemistry in GQD uptake and clearance has not been described previously. Here, we studied the influence of surface charge on GQDs (anionic and cationic) on their uptake and clearance in melanoma cells. Both cationic and anionic GQDs were synthesized using a hydrothermal method to have a relatively consistent size with an aim to study the role of surface charge in their uptake and clearance in isolation by avoiding size-dependent uptake bias. Both GQDs exhibited excellent biocompatibility with cell viability over 90% even at a high concentration of 200 μg mL−1. Using confocal microscopy and flow cytometry, we observed significantly faster and higher uptake of cationic GQDs compared to anionic GQDs. Consequently, relatively rapid clearance was observed in cells treated with anionic GQDs compared to those treated with cationic GQDs, highlighting the role of surface charge on GQDs in their uptake and clearance. Raman analysis of the cleared exocytosed GQDs revealed no sign of biodegradation of either type.
Introduction
Carbon allotropes have been attracting significant research attention due to their tunable and exciting physicochemical, mechanical and electronic properties. This has motivated more than a decade of research in these materials with applications spanning across various fields including (bio)sensing, electronics, EMI shielding, and biomedical engineering, including drug delivery and diagnostic imaging.1–5 Despite the numerous studies, biological efficacy of most explored carbon allotropes (i.e. graphene (oxide) and carbon nanotubes (CNTs)) is not entirely clear, with conflicting evidence presented in the literature.6–11 The perceived toxicity of graphene (oxide) and CNTs has been attributed to their accumulation in main organs with low to no specific clearance pathway, similar to other types of two dimensional layered materials.12–15To circumvent the potential toxicity of graphene (oxide), ultra-small graphene derivatives have been developed, known as graphene quantum dots (GQDs). In the last five years, there has been a considerable drive to determine the cytocompatibility and uptake of GQDs.16–19 Despite the conflicting reports regarding the biocompatibility of GQDs, the major consensus draws toward their superior biocompatibility when compared to graphene oxide (GO) or graphene.20 The biocompatibility of GQDs has been shown to be dependent on various factors including synthesis method, size, morphology, surface chemistry and chemical doping.21 More recently, surface chemistry in terms of functional groups has emerged as an important parameter governing the uptake and toxicity of GQDs.21–23
It has been shown that carboxylic acid functionalized (anionic) GQDs (aGQDs, obtained using glucose as a precursor) exhibit greater cytocompatibility (>80% cell viability) against human umbilical vein endothelial cells (HUVEC) compared to unfunctionalised GQDs at relatively high concentrations (≥300 μg mL−1).24 At 300 μg mL−1, HUVEC and red blood cells (RBCs) treated with unfunctionalised GQDs were significantly stressed and exhibited altered or damaged morphology. Similar aberrant morphology was reported by Wang et al.25 in the case of RBCs treated with nitrogen-doped graphene quantum dots (N-GQDs). N-GQD-induced morphological damage was attributed to their interference with cell membrane lipids, causing disturbance in their order and secondary conformation.25 However, no hemolysis or ATP release was observed when RBCs were treated with N-GQDs, both of which are indicative of cell damage. Recently, cGQDs have been shown to induce nuclear membrane damage in rat alveolar macrophages (NR8383) at a concentration of 200 μg mL−1.16 This could be attributed to relatively longer retention of these GQDs in the cytoplasm and nucleus of NR8383 cells even after 48 h clearance period at a concentration of 200 μg mL−1. Overall, in all these studies, no toxicity was observed at lower concentrations of GQDs, irrespective of the specific surface functional groups.
In order to discern the role of functional groups in GQD biocompatibility, Yuan et al. studied the cytotoxic effect of GQDs with different functional groups (NH2, COOH, and CO–N(CH3)2) on human A549 lung carcinoma cells and human neural glioma C6 cells.26 They observed good biocompatibility at high concentration of 200 μg mL−1 regardless of the surface functional groups on GQDs. In addition, they observed random distribution of GQDs (independent of surface functional groups) in the cytoplasm of both cell types with no diffusion in the nucleus.26 However, this study did not explore the uptake and clearance of these functionalized GQDs.
Lately, considerable attention has been focused on clearance mechanism of different kinds of quantum dots primarily driven by the low retention of quantum dots within cells.22,23,27,28 This has been a major limitation behind the clinical translation of quantum dots as imaging and therapeutic (photothermal, photodynamic) probes. The surface chemistry of quantum dots (mainly inorganic quantum dots) has been shown to exhibit different clearance kinetics in different cell types including cancer cells.22,23 For example, positively charged CdSe quantum dots exhibited relatively quicker uptake and slower clearance when compared to zwitterionic and anionic quantum dots in human embryonic kidney (Hek293) cells and human hepatocellular carcinoma (HepG2) cells.23 However, the role of surface chemistry of GQDs in their cellular clearance has not been explored.
Although greater understanding of the clearance mechanism of GQDs (from major organs) has been established in vivo,20,29 their elimination from specific cells is still not entirely understood. Considering that there are marked differences between the clearance mechanism in vivo and in vitro, where the in vivo clearance of GQDs is executed through two primary pathways (urinary excretion and hepatobiliary and fecal excretion)30 and in vitro clearance occurs primarily via exocytosis, it is important to develop further understanding of the clearance of GQDs in different cell types, particularly, in cancer cells where the efficacy of GQDs has been well-established as an imaging and therapeutic probe.
In this present work, we fabricated two types of GQDs (anionic and cationic) to study the role of surface chemistry in the clearance of these GQDs in vitro. By combining confocal microscopy and flow cytometry, we studied the fluorescence of the internalized GQDs over time to estimate the extent of their clearance from the cells. The cleared GQDs were subsequently characterized using Raman spectroscopy to determine their potential for biodegradation. We observed the role of surface chemistry in the internalization and clearance of GQDs, which agrees with the widely accepted notion that the surface charge of nanoparticles and bioscaffolds regulates cellular behaviour and biochemical machinery.
Materials and methods
Materials
Trypsin–EDTA solution, phosphate buffer saline, MTT reagent (3-(4,5-dimethylthiazol-2-yl)-2,5-diphenyltetrazolium bromide), DMEM (Dulbecco's modified Eagle's medium), L-arginine, and fetal bovine serum were purchased from Sigma Aldrich.Synthesis of cationic GQDs (cGQDs)
cGQDs were prepared by hydrothermal treatment using L-arginine as the source. L-Arginine (100 mL, 1% solution in water) was autoclaved at 90 °C for 1 h. The solution turned brown in color, which was then centrifuged at 1000 rpm to remove large particles. The supernatant was further purified by dialysis using a dialysis membrane (1 kDa cutoff) and DI water to remove impurities. The dialyzed solution was lyophilized to obtain the slightly brown color powder of cGQDs.Synthesis of anionic GQDs (aGQDs)
aGQDs were prepared by hydrothermal treatment according to the protocol previously reported by us.31,32 Briefly, sulfuric acid was added to an aqueous solution of dextrose (1 wt%), which was subsequently hydrothermally treated for 6 h in an autoclave at 200 °C. The pH of the obtained solution was neutralised using NaOH (0.1 M), dialysed (1 kDa cutoff) against DI water, and lyophilised to obtain purified aGQD powder.Physicochemical characterization of graphene quantum dots
Both aGQDs and cGQDs were thoroughly characterized using various physicochemical characterization techniques. The surface morphology of the GQDs was determined by dispersing the respective dots in DI water, dropcasting them on a copper grid, which was then dried under ambient conditions and analysed using a high-resolution transmission electron microscope (HRTEM, FEI Tecnai F30 S-TWIN, Netherland). DLS and zeta potential measurements were conducted on a Malvern particle size analyser by dispersing the GQDs in DI water. Raman analysis of the GQDs was conducted using a LabRAM HR (Horiba) equipped with an argon laser. The samples were excited at a wavelength of 532 nm. The obtained data were subjected to further analysis using the Origin software where peak analysis was conducted by fitting the obtained spectra with Lorentzian function to obtain the ID/IG ratios. Photoluminescence (PL) analysis was conducted on a Perkin Elmer Luminescence spectrometer (LS-55, USA) after dispersing the dots (50 μg mL−1) in DI water. UV/vis analysis was conducted using a UV visible spectrophotometer (Nano drop, ND1000, Thermo Scientific, Wilmington, DE, USA) under the same concentration of dots as that used in PL analysis. The specific functional groups of GQDs were characterized using a Fourier transform infrared spectrometer (FTIR, Bruker, Germany) with an average of 32 scans and a wavelength ranging from 400 to 4000 cm−1 at a resolution of 4 cm−1. XPS was conducted with monochromatic Al X-rays (1486.6 eV) at 225 W (15 kV, 15 mA) using a Kratos Axis ULTRA XPS under the operating conditions reported by us previously.33–35Photostability of GQDs
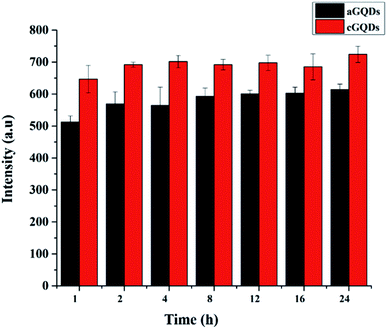
GQDs (20 μg mL−1) in water were exposed to normal sunlight for different time intervals (1, 2, 4, 8, 12, 16 and 24 h). At a stipulated time point, GQD solution was analysed using PL spectroscopy at 488 nm excitation wavelength and 505 nm emission wavelength.In vitro studies
Melanoma cell lines SK-Mel-2 (ATCC @ HTB-67) were cultured in DMEM with 10% fetal calf serum and 1% antibiotic penicillin/streptomycin at 37 °C under 5% CO2 in a humidified incubator and were used for further experiments. Trypsin–EDTA was used for the subculture experiments.In vitro cytotoxicity of graphene quantum dots
Cell toxicity studies were conducted using the MTT assay as per the manufacturer's protocol and reported by us previously.36 Melanoma SK-Mel-2 cells were seeded at a density of 1 × 10⁴ cells per well in a 96-well plate and incubated with different concentrations of both cationic and anionic GQDs (50, 100, 150, 200 and 250 μg mL−1) for 1 h in a humidified incubator at 37 °C and under 5% CO2 to promote internalization of the quantum dots. The cells were then washed with PBS and were subsequently incubated for 24 h in a humidified incubator and then subjected to the MTT assay. Untreated cells were used as the control group to determine the cytotoxicity of the quantum dots. Data are presented as mean ± standard deviation (n = 5).Cellular uptake analysis using confocal microscopy
The cellular uptake of both aGQDs and cGQDs was analysed using a confocal microscope LSM 710 (Carl Zeiss Micro imaging Inc., Thornwood, USA). Melanoma SK-Mel-2 cells (5 × 10⁵ cells per well) were seeded on the coverslips in the 24-well plate and incubated with either cGQDs or aGQDs at a concentration of 100 μg mL−1 (in PBS) for 1 h. The cells were subsequently washed with 3× PBS to remove the excess and surface adsorbed quantum dots. The washed cells were further incubated at various time intervals of 2, 4, 8, 12, 16 and 24 h in a growth medium (DMEM with FCS (10%) and antibiotic (1%)) at 37 °C under 5% carbon dioxide in a humidified incubator. At a stipulated time point, cells were washed with 3× PBS, fixed with 4% paraformaldehyde for 5 min and imaged using the confocal microscope at an excitation wavelength of 405 nm with the associated emission peak at 488 nm. All experiments were conducted in duplicate.Cellular uptake analysis using a flow cytometer
Melanoma SK-Mel-2 cells were seeded at a density of 1 × 10⁴ cells per well in a 96-well plate and were incubated with different concentrations of cGQDs and aGQDs (50, 100 μg mL−1) for 1 h in a humidified incubator at 37 °C and under 5% CO2 to allow internationalization of the GQDs. The GQD treated cells were washed with PBS to remove excess non-internalized GQDs. The washed cells were further incubated for different time intervals (2, 4, 8, 12, 16 and 24 h) in a humidified incubator at 37 °C and under 5% CO2. Untreated cells were used as the control group. At the specified time points, GQD internalized cells were subjected to flow cytometry. The fluorescence intensity of GQD internalized cells was measured at an excitation wavelength of 495 nm and with an emission peak at 520 nm. The fluorescence of the treated samples and control group were subtracted to obtain the amount of fluorescence inside the cells. Data are presented as mean ± standard deviation (n = 3).Raman spectra of excreted GQDs
To determine the state of the excreted GQDs, the cell culture growth media from the confocal study (experimental details mentioned above) using the cells exposed to 100 μg mL−1 of GQDs for 16 h were subjected to centrifugation at 20![[thin space (1/6-em)]](https://www.rsc.org/images/entities/char_2009.gif) 000 rpm followed by dialysis of the supernatant using a dialysis membrane (1 kDa cut-off) against water. The solution outside the dialysis membrane was collected and lyophilized to obtain purified excreted GQDs which were subjected to Raman analysis.
000 rpm followed by dialysis of the supernatant using a dialysis membrane (1 kDa cut-off) against water. The solution outside the dialysis membrane was collected and lyophilized to obtain purified excreted GQDs which were subjected to Raman analysis.
Results and discussion
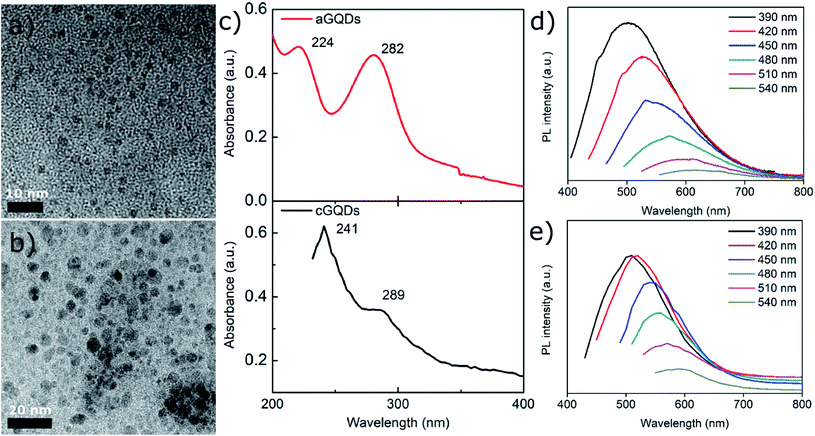
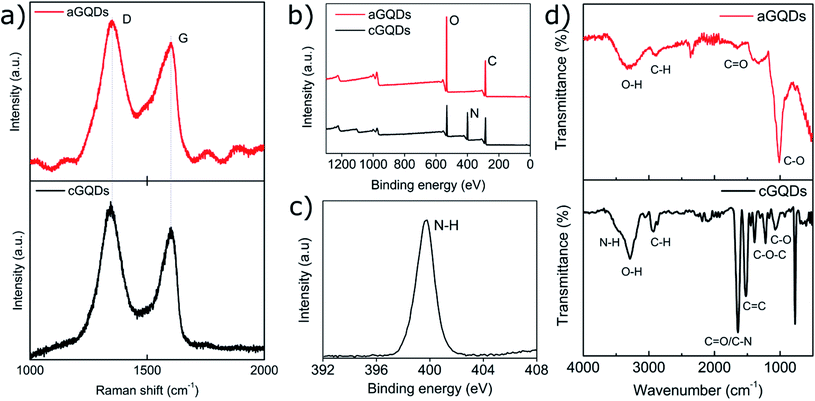
Positively charged cGQDs (GQD-NH2) and negatively charged aGQDs (GQD-COOH) were hydrothermally synthesised using L-arginine and dextrose, respectively as precursors. Transmission electron microscopy (TEM) analysis illustrated their spherical morphology with particle size around 3.8 ± 0.7 nm (average ± standard deviation, n = 44) for aGQDs and 4.9 ± 1.1 nm in diameter for cGQDs (Fig. 1a and b, and ESI, Fig. S1†). The z-average hydrodynamic diameter of cGQDs as determined from DLS was 7 ± 2 nm which is in agreement with TEM data. In the case of aGQDs, the z-average hydrodynamic diameter was 5 ± 2 nm. As expected cGQDs were positively charged (amine functional groups) with a zeta potential value of 26 ± 5 mV while a value of −32 ± 4 mV was obtained for aGQDs due to the presence of carboxylic acid functional groups on the surface. UV/vis analysis of cGQDs (Fig. 1c) exhibited two prominent peaks at 241 and 289 nm, characteristic of π–π* transition and n–π* transition, respectively, while aGQDs exhibited the respective peaks at 224 and 282 nm, respectively, indicating a marginal blue shift in the peak positions.37,38 Photoluminescence (PL) analysis shown in Fig. 1d and e showed the excitation-dependent emission of the dots that was similar to that in other reports due to different surface emissive traps and heterogeneous size distribution.39 Raman analysis revealed the characteristic D and G bands at 1351 and 1606 cm−1 for cGQDs, and 1354 and 1573 cm−1 for aGQDs, respectively (Fig. 2a). The ID/IG ratio was 1.14 and 1.27 for cGQDs and aGQDs, respectively. XPS analysis of cGQDs confirmed the presence of nitrogen, as can be observed from the survey spectrum (Fig. 2b). Further analysis of the N 1s spectrum confirmed the presence of a single peak which was attributed to N–H (399.7 eV, 26.83 at%). The presence of the oxygen peak in the cGQD survey spectrum can be attributed to the presence of oxygen functionality remaining from the L-arginine precursor (Fig. 2c).FTIR analysis of dried cGQDs, the results of which are shown in Fig. 2d, exhibited a peak at 3464 cm−1 corresponding to N–H stretching vibrations,40,41 a peak at 3294 cm−1 for O–H stretching vibrations, a medium peak at 2937 cm−1 for C–H stretching vibrations,42 a strong peak at 1645 cm−1 for C![[double bond, length as m-dash]](https://www.rsc.org/images/entities/char_e001.gif) O/C–N, 1524 cm−1 for C
O/C–N, 1524 cm−1 for C![[double bond, length as m-dash]](https://www.rsc.org/images/entities/char_e001.gif) C stretching vibrations,39,43–45 a strong peak at 1223 cm−1 for epoxy (C–O–C) and a peak at 1076 cm−1 corresponding to alkoxy (–C–O) stretching vibrations, respectively.46,47 Similar analysis of aGQDs revealed characteristic peaks at 3250 cm−1 due to O–H stretching vibrations, 2850 cm−1 for C–H stretching, 1650 cm−1 for C
C stretching vibrations,39,43–45 a strong peak at 1223 cm−1 for epoxy (C–O–C) and a peak at 1076 cm−1 corresponding to alkoxy (–C–O) stretching vibrations, respectively.46,47 Similar analysis of aGQDs revealed characteristic peaks at 3250 cm−1 due to O–H stretching vibrations, 2850 cm−1 for C–H stretching, 1650 cm−1 for C![[double bond, length as m-dash]](https://www.rsc.org/images/entities/char_e001.gif) O, and 1040 cm−1 for C–O stretching vibrations.
O, and 1040 cm−1 for C–O stretching vibrations.
Next the cytocompatibility of the two GQDs were evaluated on the melanoma SK-Mel-2 cells at various concentrations. Both c- and aGQDs exhibited good biocompatibility up to a concentration of 200 μg mL−1 after 24 h incubation (Fig. 3). This was in line with the results of the previously published reports.18,26 Further increase in the concentration of dots to 250 μg mL−1 induced a reduction in cell viability in the case of cGQDs, which was lower than what was observed for aGQDs. However, this difference in cell viability (at 250 μg mL−1) between the two GQDs was not significant. This relatively lower cell viability observed for cGQDs (250 μg mL−1) was postulated to be caused by the loss of cell membrane integrity.48
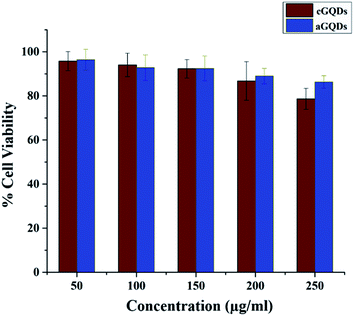 | ||
| Fig. 3 Cell viability assay showing percentage cell viability in the culture post incubation with both GQDs. Data are presented as average ± standard deviation (n = 5). | ||
The cellular uptake of GQDs was evaluated in the melanoma SK-Mel-2 cells at various time points (1, 2, 4, 8, 12 and 24 h). We employed confocal microscopy and flow cytometry to estimate cellular intake of GQDs both qualitatively and quantitatively, respectively. At 1 h after incubation with GQDs, confocal images revealed higher uptake of cGQDs in cells compared to aGQDs (Fig. 4 and ESI, Fig. S2†). The higher uptake of cGQDs can be ascribed to electrostatic interaction between quantum dots and negatively charged plasma membrane lipids. At 2 h and 4 h after incubation, greater uptake was observed, along with uniform distribution within the cytoplasm of the cells, for both types of GQDs.26,49 However, higher fluorescence was observed in the case of cGQDs as compared to aGQDs. Such differential difference between the two GQDs can be attributed to the charge difference or the functional groups present on the surface of these quantum dots. Moreover, the observed uptake differences could be due to the different internalisation mechanisms regulating these GQDs. In the case of cGQDs the mechanism of uptake is mainly dominated by the micropinocytosis,50–52 while aGQDs mediate through caveolae mediated and clathrin mediated endocytosis.53 After 8 h of incubation, cGQDs were homogenously distributed within the cytoplasm of the cells along with a few cells showing dots in their nuclei.16 Contrarily, relatively lower overall fluorescence intensity was observed in the case of aGQD treated cells after 8 h incubation. The longer incubation time (12, 16 and 24 h) exhibited further reduction in the fluorescence intensity relative to the increasing incubation time for both GQDs, primarily due to the clearance or exocytosis (ESI, Fig. S2†). Furthermore, it can be observed from confocal images that cGQDs were retained for longer time with considerable fluorescence observed even after 24 h incubation compared to aGQDs. It can be deduced from the confocal study that clearance of GQDs is dependent on the surface chemistry of the quantum dots, which is in agreement with a previously published report on CdSe QDs.23 The longer retention of cGQDs is in accordance with a published report where a low level of positive surface charge on carbon quantum dots (cCQDs, +4.12 mV) was sufficient to increase the stability of cCQDs in human umbilical cord derived mesenchymal stem cells (hUCMSCs) compared to negatively charged CQDs.22
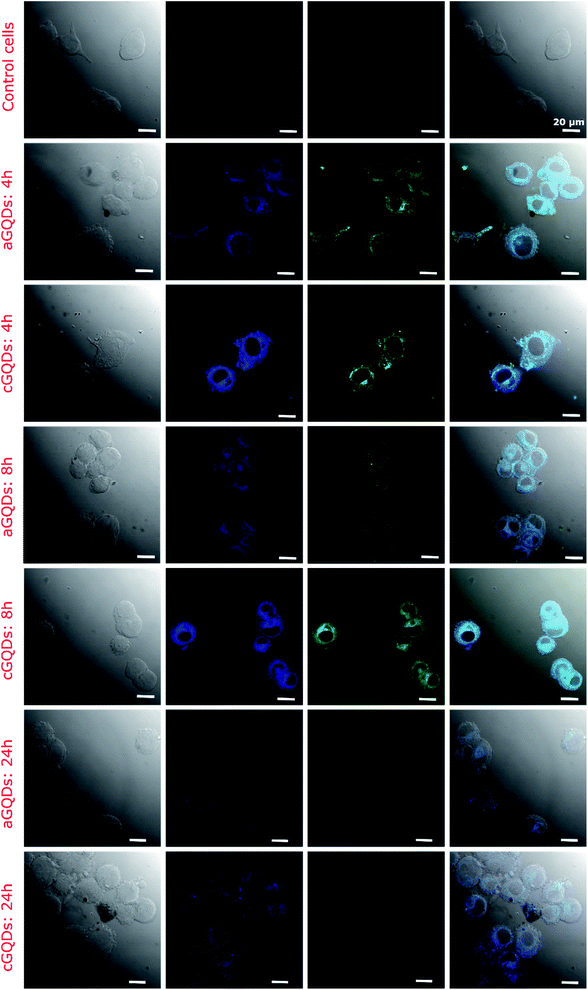 | ||
| Fig. 4 Confocal fluorescence images of SK-Mel-2 cells showcasing the uptake of both types of GQDs (a- and c-GQDs) at different time points (all different time points including those mentioned in this figure are shown in Fig. S2† for clarity). Control cells represent the untreated group. The fluorescence observed in the blue and green channels indicate excitation-dependent emission of both types of GQDs. The first column shows a phase contrast image, second shows blue channel, third shows green channel and fouth column shows merged image. | ||
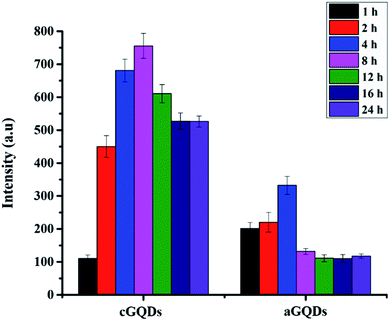
Next, we conducted flow cytometry to study the kinetics of GQD (at two different concentrations – 50 and 100 μg mL−1) uptake and retention by melanoma cells. Fig. 5 and S3 (ESI†) show the flow cytometry data. It can be seen from Fig. 5 that cGQDs exhibited time-dependent uptake which significantly increased with incubation time, reaching the maximum at 8 h, as observed from the increasing fluorescence intensity, which reduced gradually with increasing incubation time. As expected relatively higher fluorescence intensity was observed in the case of the higher concentration of cGQDs (100 μg mL−1) compared to 50 μg mL−1 (Fig. 5, and ESI, Fig. S3†), although changes in fluorescence intensity followed a similar trend at both concentrations. The reduction in the fluorescence intensity in flow cytometry corroborated with the trend observed in confocal analysis. Notably, a significant proportion of cGQDs were retained within the cells even after 24 h incubation. However, the reduction in fluorescence for cGQDs was more gradual (∼15% reduction at 24 h compared to maximum fluorescence measured at 8 h) compared to aGQDs (∼35% reduction at 24 h compared to maximum fluorescence measured at 4 h) (Fig. 5, and ESI, Fig. S3†).
In order to ascertain that the observed reduction in fluorescence intensity is not due to photobleaching of the GQDs, we conducted control experiments by exposing both types of GQDs to sunlight over a period of 24 h (keeping the time points consistent with those of confocal and flow cytometry studies) and analysing them using PL spectroscopy. Fig. 6 shows the stability of both c- and aGQDs over the period of 24 h under sunlight. We observed no change in the PL signal for either of the two GQDs at any of the time points studied, confirming their stability over time. Based on the photostability of the GQDs, it can be concluded that the loss of fluorescence intensity in confocal and flow cytometry analysis is indeed caused by exocytosis of GQDs and not a consequence of degradation or photobleaching of the GQDs.
Next, we analysed exocytosed GQDs obtained after 16 h of incubation with cells using Raman spectroscopy. Raman analysis of exocytosed GQDs yielded two characteristic peaks at 1354 cm−1 (D band) and 1597 cm−1 (G band) for cGQDs and at 1347 and 1593 cm−1 for aGQDs, with a ID/IG ratio of 1.05 and 1.36, respectively (Fig. 7). The similarity in the peak positions and ID/IG ratios between pure and exocytosed c- and aGQDs supports the notion that both of these – (i) are resistant to extracellular and intracellular degradation, and (ii) get exocytosed without biodegradation. However, zeta potential (ζ) measurements on excreted GQDs revealed zeta potential values of 21 ± 1.6 mV and −15 ± 4 mV for cGQDs and aGQDs, respectively. Comparison between the zeta potential values of pure GQDs and excreted GQDs revealed a considerable change in the zeta values (Δζ ≃ −17 mV) of aGQDs, while no noticeable change was observed for cGQDs. The significant Δζ value for aGQDs is presumed to have been caused by the surface adsorption of (serum) proteins and components from intracellular compartments, which could be the reason behind their relatively faster clearance compared to cGQDs as observed from confocal analysis.
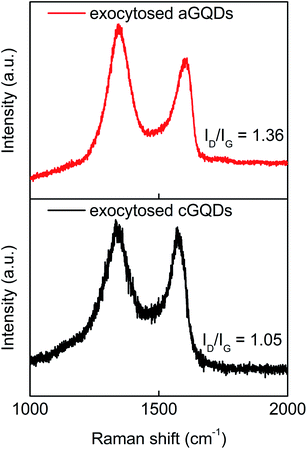 | ||
| Fig. 7 Raman analysis of exocytosed GQDs showcasing the characteristic D and G peaks and associated ID/IG values. | ||
Conclusions
In summary, we synthesized two types of GQDs with similar sizes (∼5–8 nm) but carrying different surface charges (cationic and anionic) using the hydrothermal method. Both GQDs exhibited relatively high biocompatibility in melanoma SK-Mel-2 cells even at high concentrations (≥200 μg mL−1). Confocal microscopy and flow cytometry revealed time-dependent uptake of both types of GQDs reaching the maximum level at ∼8 h for cGQDs and ∼4 h for aGQDs independent of the concentration of GQDs used. Moreover, these studies also exhibited slow clearance for cGQDs over time compared to relatively rapid clearance observed for aGQDs. The reduction in fluorescence observed via confocal and flow cytometry studies was due to the clearance (exocytosis) of the GQDs rather than their intracellular degradation. Raman studies on both types of exocytosed GQDs revealed no sign of any degradation with ID/IG values similar to pure GQDs. The observations from this study highlight the potential of surface chemistry in manipulating the retention and clearance of GQDs in cancer cells with a profound impact on their application as imaging and therapeutic probes.Conflicts of interest
There are no conflicts to declare.Acknowledgements
LNR acknowledges UGC, India for financial assistance provided in the form of a Dr D. Kothari Post-Doctoral Fellowship (BL/14-15/0172). VA acknowledges the National Health and Medical Research Council (NHMRC), Australia, for an Early Career Fellowship (GNT1139060), and UNSW for UNSW-India Collaborative Research Seed Grant and UNSW-MAHE Collaborative Research Seed Grant. The authors would like to thank Prof Per Zetterlund, UNSW, for his mentorship and Dr Cui Ying Toe for assistance with PL measurements of pure aGQDs. The authors also acknowledge The Mark Wainwright Analytical Centre (MWAC) at UNSW for providing access to analytical and microscopy facilities.References
- A. M. Pinto, I. C. Goncalves and F. D. Magalhaes, Colloids Surf., B, 2013, 111, 188–202 CrossRef CAS PubMed.
- A. T. Lawal, Biosens. Bioelectron., 2019, 141, 111384 CrossRef CAS PubMed.
- S. K. Krishnan, E. Singh, P. Singh, M. Meyyappan and H. S. Nalwa, RSC Adv., 2019, 9, 8778–8881 RSC.
- N. Bagotia, V. Choudhary and D. Sharma, Polym. Adv. Technol., 2018, 29, 1547–1567 CrossRef CAS.
- R. Kumar, R. Singh, D. Hui, L. Feo and F. Fraternali, Composites, Part B, 2018, 134, 193–206 CrossRef CAS.
- S. Gurunathan, M. Arsalan Iqbal, M. Qasim, C. H. Park, H. Yoo, J. H. Hwang, S. J. Uhm, H. Song, C. Park and J. T. Do, Nanomaterials, 2019, 9, 969 CrossRef CAS PubMed.
- M. d'Amora, A. Lamberti, M. Fontana and S. Giordani, JPhys Mater., 2020, 3, 034008 CrossRef.
- J. Zhao, Y. Li, X. Cao, C. Guo, L. Xu, Z. Wang, J. Feng, H. Yi and B. Xing, Environ. Sci.: Nano, 2019, 6, 1909–1920 RSC.
- J. Yao, H. Wang, M. Chen and M. Yang, Microchim. Acta, 2019, 186, 395 CrossRef PubMed.
- D. Mohanta, S. Patnaik, S. Sood and N. Das, J. Pharm. Anal., 2019, 9, 293–300 CrossRef PubMed.
- K. B. Narayanan, H. D. Kim and S. S. Han, Colloids Surf., B, 2020, 185, 110579 CrossRef CAS PubMed.
- V. Agarwal and P. B. Zetterlund, Chem. Eng. J., 2021, 405, 127018 CrossRef CAS.
- V. Agarwal and K. Chatterjee, Nanoscale, 2018, 10, 16365–16397 RSC.
- K. P. Wen, Y. C. Chen, C. H. Chuang, H. Y. Chang, C. Y. Lee and N. H. Tai, J. Appl. Toxicol., 2015, 35, 1211–1218 CrossRef CAS PubMed.
- H. Ali-Boucetta and K. Kostarelos, Adv. Drug Delivery Rev., 2013, 65, 2111–2119 CrossRef CAS PubMed.
- L. Xu, Y. Dai, Z. Wang, J. Zhao, F. Li, J. C. White and B. Xing, Part. Fibre Toxicol., 2018, 15, 45 CrossRef CAS PubMed.
- C. Wang, C. Wu, X. Zhou, T. Han, X. Xin, J. Wu, J. Zhang and S. Guo, Sci. Rep., 2013, 3, 2852 CrossRef PubMed.
- J. Qiu, R. Zhang, J. Li, Y. Sang, W. Tang, P. R. Gil and H. Liu, Int. J. Nanomed., 2015, 10, 6709 CAS.
- T. Henna and K. Pramod, Mater. Sci. Eng., C, 2020, 110, 110651 CrossRef CAS PubMed.
- Y. Chong, Y. Ma, H. Shen, X. Tu, X. Zhou, J. Xu, J. Dai, S. Fan and Z. Zhang, Biomaterials, 2014, 35, 5041–5048 CrossRef CAS PubMed.
- S. Wang, I. S. Cole and Q. Li, RSC Adv., 2016, 6, 89867–89878 RSC.
- J. Yan, S. Hou, Y. Yu, Y. Qiao, T. Xiao, Y. Mei, Z. Zhang, B. Wang, C.-C. Huang, C.-H. Lin and G. Suo, Colloids Surf., B, 2018, 171, 241–249 CrossRef CAS PubMed.
- N. A. Al-Hajaj, A. Moquin, K. D. Neibert, G. M. Soliman, F. M. Winnik and D. Maysinger, ACS Nano, 2011, 5, 4909–4918 CrossRef CAS PubMed.
- C. Yan, X. Hu, P. Guan, T. Hou, P. Chen, D. Wan, X. Zhang, J. Wang and C. Wang, J. Mater. Sci., 2020, 55, 1198–1215 CrossRef CAS.
- T. Wang, S. Zhu and X. Jiang, Toxicol. Res., 2015, 4, 885–894 CrossRef CAS.
- X. Yuan, Z. Liu, Z. Guo, Y. Ji, M. Jin and X. Wang, Nanoscale Res. Lett., 2014, 9, 108 CrossRef PubMed.
- L. Dong, W. Li, L. Yu, L. Sun, Y. Chen and G. Hong, ACS Appl. Mater. Interfaces, 2020, 12, 42558–42566 CrossRef CAS PubMed.
- H. C. Fischer, L. Liu, K. S. Pang and W. C. Chan, Adv. Funct. Mater., 2006, 16, 1299–1305 CrossRef CAS.
- M. Nurunnabi, Z. Khatun, K. M. Huh, S. Y. Park, D. Y. Lee, K. J. Cho and Y.-k. Lee, ACS Nano, 2013, 7, 6858–6867 CrossRef CAS PubMed.
- G. Yang, S. Z. F. Phua, A. K. Bindra and Y. Zhao, Adv. Mater., 2019, 31, 1805730 CrossRef PubMed.
- L. N. Dinh, L. N. Ramana, V. Agarwal and P. B. Zetterlund, Polym. Chem., 2020, 11, 3217–3224 RSC.
- L. N. Dinh, L. N. Ramana, R. P. Kuchel, V. Agarwal and P. B. Zetterlund, Polym. Chem., 2020, 11, 5790–5799 RSC.
- Y. Cai, Y. Fadil, F. Jasinski, S. C. Thickett, V. Agarwal and P. B. Zetterlund, Carbon, 2019, 149, 445–451 CrossRef CAS.
- N. Maslekar, R. A. Mat Noor, R. P. Kuchel, Y. Yao, P. B. Zetterlund and V. Agarwal, Nanoscale Adv., 2020, 2, 4702–4712 RSC.
- Y. Fadil, L. N. M. Dinh, M. O. Y. Yap, R. P. Kuchel, Y. Yao, T. Omura, U. A. Aregueta-Robles, N. Song, S. Huang, F. Jasinski, S. C. Thickett, H. Minami, V. Agarwal and P. B. Zetterlund, ACS Appl. Mater. Interfaces, 2019, 11, 48450–48458 CrossRef CAS PubMed.
- V. Agarwal, P. Toshniwal, N. E. Smith, N. M. Smith, B. Li, T. D. Clemons, L. T. Byrne, F. Kakulas, F. M. Wood, M. Fear, B. Corry and K. Swaminathan Iyer, Chem. Commun., 2016, 52, 327–330 RSC.
- M. J. Deka and D. Chowdhury, RSC Adv., 2017, 7, 53057–53063 RSC.
- S. Kang, Y. K. Jeong, J. H. Ryu, Y. Son, W. R. Kim, B. Lee, K. H. Jung and K. M. Kim, Appl. Surf. Sci., 2020, 506, 144998 CrossRef CAS.
- J. Ju and W. Chen, Biosens. Bioelectron., 2014, 58, 219–225 CrossRef CAS PubMed.
- Y. Shi, C. Sun, X. Gao, W. Zhao and N. Zhou, Molecules, 2019, 24, 4136 CrossRef CAS PubMed.
- V. Agarwal, D. McLean, J. Horne, D. Richardson and K. Stack, J. Appl. Polym. Sci., 2013, 127, 3970–3979 CrossRef CAS.
- S. R. Anand, A. Bhati, D. Saini, Gunture, N. Chauhan, P. Khare and S. K. Sonkar, ACS Omega, 2019, 4, 1581–1591 CrossRef CAS.
- M. Rong, Y. Feng, Y. Wang and X. Chen, Sens. Actuators, B, 2017, 245, 868–874 CrossRef CAS.
- S. R. K. Meka, V. Agarwal and K. Chatterjee, Mater. Sci. Eng., C, 2019, 94, 565–579 CrossRef CAS PubMed.
- V. Agarwal, A. G. Panicker, S. Indrakumar and K. Chatterjee, Int. J. Biol. Macromol., 2019, 133, 382–390 CrossRef CAS PubMed.
- K. M. Tripathi, A. Singh, A. Bhati, S. Sarkar and S. K. Sonkar, ACS Sustainable Chem. Eng., 2016, 4, 6399–6408 CrossRef CAS.
- N. Izza Taib, V. Agarwal, N. M. Smith, R. C. Woodward, T. G. St. Pierre and K. S. Iyer, Mater. Chem. Front., 2017, 1, 2335–2340 RSC.
- Y. Dondelinger, W. Declercq, S. Montessuit, R. Roelandt, A. Goncalves, I. Bruggeman, P. Hulpiau, K. Weber, C. A. Sehon and R. W. Marquis, Cell Rep., 2014, 7, 971–981 CrossRef CAS PubMed.
- M. K. Kumawat, M. Thakur, R. B. Gurung and R. Srivastava, ACS Sustainable Chem. Eng., 2017, 5, 1382–1391 CrossRef CAS.
- Y. Wei, X. Jin, T. Kong, W. Zhang and B. Zhu, Cell Proliferation, 2019, 52, e12586 CrossRef PubMed.
- T. Kong, L. Hao, Y. Wei, X. Cai and B. Zhu, Cell Proliferation, 2018, 51, e12488 CrossRef PubMed.
- O. Harush-Frenkel, E. Rozentur, S. Benita and Y. Altschuler, Biomacromolecules, 2008, 9, 435–443 CrossRef CAS PubMed.
- A. Halder, M. Godoy-Gallardo, J. Ashley, X. Feng, T. Zhou, L. Hosta-Rigau and Y. Sun, ACS Appl. Bio Mater., 2018, 1, 452–461 CrossRef CAS.
Footnote |
| † Electronic supplementary information (ESI) available. See DOI: 10.1039/d0na00935k |
| This journal is © The Royal Society of Chemistry 2021 |

