
 Open Access Article
 This Open Access Article is licensed under a Creative Commons Attribution-Non Commercial 3.0 Unported Licence
Chromatin hierarchical branching visualized at the nanoscale by electron microscopy†
Zhongwu
Zhou
 ab,
Rui
Yan
cd,
Wen
Jiang
*c and
Joseph M. K.
Irudayaraj
*ae
ab,
Rui
Yan
cd,
Wen
Jiang
*c and
Joseph M. K.
Irudayaraj
*ae
aBindley Bioscience Center, Department of Agricultural and Biological Engineering, Purdue University, West Lafayette, IN 47907, USA
bThe University of Texas at Austin, NHB 4.120, 100 E. 24th St. Austin, TX 78712, USA
cMarkey Center for Structural Biology, Department of Biological Science, Purdue University, West Lafayette, IN 47907, USA. E-mail: jiang12@purdue.edu
dHoward Hughes Medical Institute, Janelia Research Campus, 19700 Helix Drive, Asburn, Virginia 20147, USA
eCancer Center at Illinois, Department of Bioengineering, College of Engineering, University of Illinois at Urbana-Champaign, Urbana, IL 61801, USA. E-mail: jirudaya@illinois.edu
First published on 13th November 2020
Abstract
Chromatin is spatially organized in a hierarchical manner by virtue of single nucleosomes condensing into higher order chromatin structures, conferring various mechanical properties and biochemical signals. These higher order chromatin structures regulate genomic function by organization of the heterochromatin and euchromatin landscape. Less is known about its transition state from higher order heterochromatin to the lower order nucleosome form, and there is no information on its physical properties. We have developed a facile method of electron microscopy visualization to reveal the interphase chromatin in eukaryotic cells and its organization into hierarchical branching structures. We note that chromatin hierarchical branching can be distinguished at four levels, clearly indicating the stepwise transition from heterochromatin to euchromatin. The protein–DNA density across the chromatin fibers decreases during the transition from compacted heterochromatin to dispersed euchromatin. Moreover, the thickness of the chromatin ranges between 10 to 270 nm, and the controversial 30 nm chromatin fiber exists as a prominent intermediate structure. This study provides important insights into higher order chromatin organization which plays a key role in diseases such as cancer.
Introduction
The condensation and spatial organization of the genome inside the nuclei are tightly regulated to control DNA-related activities such as transcription, replication, recombination and repair during interphase.3 Diploid cells in the human body package ∼6 billion base pairs (bp) of DNA in the nuclei with a diameter of 5–10 μm. The first level of packaging is to form a double helix DNA, which comprises two strands of Watson–Crick B-DNA (2 nm in diameter and 3.4 nm per pitch), accounting for a total length of about one meter when linearized.6,7 Though the genome is extremely long compared to the diameter of the nuclei, naked DNA when treated as a simple cylinder only occupies ∼1.2% of the nucleus volume (Table 1). The second level of genomic compaction is comprised of nucleosome disks with a diameter of ∼11 nm. These disks are comprised of 147 bp of DNA wrapped around an octamer of four pairs of core histone (H2A, H2B, H3 and H4) proteins.1,2,8 As many as 2 × 10⁷ nucleosomes might exist inside the nucleus forming the beads-on-a-string structure.9 While these nucleosomes effectively shorten the DNA 5-fold, the nuclear volume of the genome increases to ∼2.2% (Table 1). The third level may be the controversial 30 nm chromatin fiber.10–13 From past work, the “double double helix” model,14 the 30 nm chromatin fiber has been hypothesized to consist of 12 nucleosomes per pitch with 12 × 187 bp of DNA with a diameter of 29.9 nm and a length 27.0 nm. If the genome was packaged in the form of the Li-Zhu style 30 nm chromatin fiber, it would occupy ∼9.6% of the nuclear volume (Table 1). Higher order chromatin organization beyond 30 nm chromatin fiber is largely unknown. Hence, there is ample space in the nucleus for the organization of the eukaryotic genome; however, it is essential for the genome to hierarchically fold into higher order chromatin structures depending upon the biophysical material properties to conform in the nucleus.15 These higher order chromatin structures are essential for the dynamic transition between euchromatin and heterochromatin to regulate transcription, where euchromatin is dispersed and not readily stainable and the heterochromatin appears as condensed and darkly stained with irregular size under electron microscopy.| Unit | Unit shape | Unit parameters | Max units in nuclei | Volume (nm3) | Fraction of nuclear volume | |
|---|---|---|---|---|---|---|
| DNA double helix | Base-pair | Cylinder | 10 bps per pitch, 2 nm in diameter, 3.4 nm in length (B-DNA) | 6 × 10⁸ | 6.4 × 10⁹ | 1.2% |
| Beads-on-a-string | Nucleosome | Cylinder | 147 bps per nucleosome, 11 nm in diameter, 6 nm in length | 2 × 10⁷ | 1.14 × 10¹⁰ | 2.2% |
| 30 nm chromatin fiber | 12-Nucleosome | Cylinder | 12 × 187 bps per unit, 29.9 nm in diameter, 27.0 nm in length | 2.6 × 10⁶ | 2.5 × 10¹⁰ | 9.6% |
| Nucleus | Nuclei | Sphere | 10 μm in diameter | 1 | 5.2 × 10¹¹ | 1 |
In addition to biochemical factors, physical factors also contribute to chromatin packaging that impact sensitivity to gene expression.16 Early findings have proposed a hierarchical model for chromatin organization inside the nucleus.17,18 These models suggest that DNA-nucleosome fibers with a thickness of ∼10 nm can fold step-wise into higher order fibers with thickness ranging between 30–700 nm.19 While advanced imaging technologies including light microscopy, electron microscopy (EM) and atomic force microscopy (AFM) have been utilized to visualize the 3D organization of chromatin fibers for several decades, direct visualization of hierarchically packed chromatin structure in the interphase is rare, perhaps due to the requirements of sample handling and preparation. Chromosome territories visualized by fluorescence in situ hybridization (FISH) failed to resolve chromatin at a finer scale due to the crowding environment of interphase nuclei and the limit of resolution of light microscopy.5,20 Using super-resolution microscopy such as stochastic optical reconstruction microscopy (STORM), Ricci et al. found that chromatin is organized into discrete “nucleosomal clutches” with various sizes and densities when imaging the core histone protein H2B inside nuclei.4 Interestingly, when imaging the Edu-incorporated DNA of single interphase chromosome by direct STORM, Fang et al. found that a three-level hierarchical chromatin structure exists: dispersed chromatin, well-defined nanodomains containing several kilobases (kb) of DNA whose spatial extent ranges over tens of nanometers, and clusters of these nanodomains.21 Reconstituted nucleosomal arrays using defined components provide fundamental insights on chromatin organization in vitro.14,22 However, this may not accurately represent the chromatin inside the nucleus which has a significantly longer length, complex compositions, and modifications of chromatin associated DNA and proteins. The thin layer of sectioned nuclei (∼100 nm in thickness) produced by cryosectioning or focused ion beam (FIB) trimming allows for easier penetration of the electrons to facilitate direct visualization of chromatin in its native state.23 However, these processes result in random cutting of the chromatin and it is highly likely that these cause structural damage and information loss. ChromEM and multitilt EMT (ChromEMT), an electron-microscopy-tomography technique, provides sectioned eukaryotic interphase chromatin structure at nano-scale resolution, revealing that chromatin is flexible and has a disordered 5–24 nm granular chain in interphase nuclei.24 However, ChromEMT provides no evidence of whether hierarchical chromatin organization exists.
Direct visualization of isolated native chromatin under physiological conditions will provide a unique opportunity to understand the overall architecture of these higher order structures as well as the mechanism by which they assemble and disassemble in response to biological stimuli. Previously, we demonstrated a method utilizing salicylic acid coated magnetic nanoparticles to isolate interphase chromatin to minimize the harsh treatment of samples.25 By applying a simple buffer alignment procedure to immobilize and align isolated chromatin we have shown that high resolution imaging of chromatin is possible.26 In the present study, we show that the aligned chromatin exhibits a hierarchical branching structure. We termed this structure as “chromatin hierarchical branching structure” analogous to the hierarchical branching of branches in a tree. We present several levels of hierarchy, highlighting the interphase chromatin with stepwise transition from heterochromatin to euchromatin. Thickness and relative protein–DNA density distribution analysis of these chromatin fibers reveals that the chromatin thickness ranges from 10–270 nm, and the 30 nm chromatin fiber exists as an intermediate structure. Our studies provide important insights into the higher order chromatin organization that plays a key role in DNA related processes.
Experimental section
Native chromatin extraction from various mammalian cells
Human MCF7, Hela cells and mouse neural stem cells were cultured using standard protocols and were further synchronized at interphase by serum starvation. Human white blood cells were obtained from healthy donors. Native interphase chromatin was isolated using the solid phase reversible immobilization (SPRI) method with slight modifications.26 In short, the mammalian cells were either enriched by centrifugation or captured by salicylic acid coated magnetic nanoparticles (SAMNPs), and further lysed in buffer which consists of 25 mM SDS, 1 mM EDTA, 1 mM PMSF, 0.5 mM EGTA and 2% protease inhibitor Cocktail in PBS buffer. The mixture was gently pipetted up and down 20 times and further incubated for 10 min at room temperature. Isopropanol was added to the mixture to form nucleic acids–SAMNPs complexes and incubated for another 5 min. The chromatin–SAMNPs complexes were isolated by an external magnetic force, and quickly washed once with PBS buffer. Chromatin was eluted in 50 μL of PBS buffer containing 1 mM MgCl2 after a 4 h incubation period at RT or overnight incubation at 4 °C. The released chromatin in supernatant was collected after an extra magnetic separation step. The concentration of chromatin was determined from DNA absorbance at 260 nm by NanoDrop Spectroscopy.Positive staining EM sample preparation and data collection
Isolated native chromatin (∼50 ng μL−1) was briefly incubated with gold nanoparticles before preparing positive staining electron microscopy grids. An aliquot of the mixture was adsorbed onto glow-discharged 200 mesh continuous carbon coated TEM grids (Ted Pella, INC, CA, USA) for 1 min, manually blotted by placing a piece of filter paper on the edge of the grid, and stained with 4 μL of uranyl acetate (UA, 2%) for 10 s. After removing the UA, the grids were briefly washed and air dried. The grids were transferred into a FEI T20 electron microscope (FEI, Eindhoven) equipped with LaB6 filament and operated at 200 kV. Positively stained micrographs of chromatin samples were obtained using a Gatan CCD camera at magnifications in accordance to the size of different chromatin fibers.Cryo-EM grid preparation and data collection
The isolated native chromatin samples with a concentration of 220 ng μL−1 were used for CryoEM grid preparation. A mixture solution of native chromatin and gold nanoparticles was added onto glow-discharged 400 mesh Lacey carbon holey grids (Ted Pella, INC, CA, USA) for 1 min, and then manually blotted using a piece of #1 filter paper at the edge of the grid. The grids were allowed to stand for 30–60 s before plunging into liquid ethane cooled by liquid nitrogen inside a FEI Vitrobot Mark III (FEI, Eindhoven). It should be noted that the evaporation time for Cryo-EM sample preparation is sensitive to atmospheric humidity and the preparation time should be experimentally determined.Chromatin relative protein–DNA density analysis
Chromatin protein–DNA density was analyzed by the EMAN2 e2display.py program using the positive stain electron microscopy images.27 The probe size was set to 6 pixels in the “probe” window. In each individual image, ∼10 gold nanoparticles and 10 locations on the background carbon film were identified on the chromatin fiber-free region and their corresponding density were recorded and further averaged. The density of chromatin fiber was individually recorded using the same probe size. The relative protein–DNA density along the chromatin fibers was further calculated using the density of carbon film and gold nanoparticles (details provided in Results and discussion).Results and discussion
Nanomanipulation of chromatin on EM grids
Proper alignment of these long polymer-like chromatin materials can significantly facilitate high resolution imaging. The concept of aligning chromatin for high resolution imaging originated from naked DNA immobilization and stretching studies, which involve end-tethering, in combination with optical or magnetic tweezers, stretching on polydimethylsiloxane (PDMS) stamps, and adsorption onto a modified surface under flow, shear flow, and nanoconfinement.28–37 Few methods have been demonstrated that allow the immobilization of isolated native chromatin molecules without disrupting their complex structure when imaged by TEM or AFM.36 In order to facilitate high resolution imaging by EM, we developed a simple and robust method to immobilize and align isolated native chromatin on both continuous carbon coated TEM grids for positive staining EM and on holey grids for CryoEM, as shown in Fig. 1, allowing finer details of chromatin to be visualized at nanoscale resolution.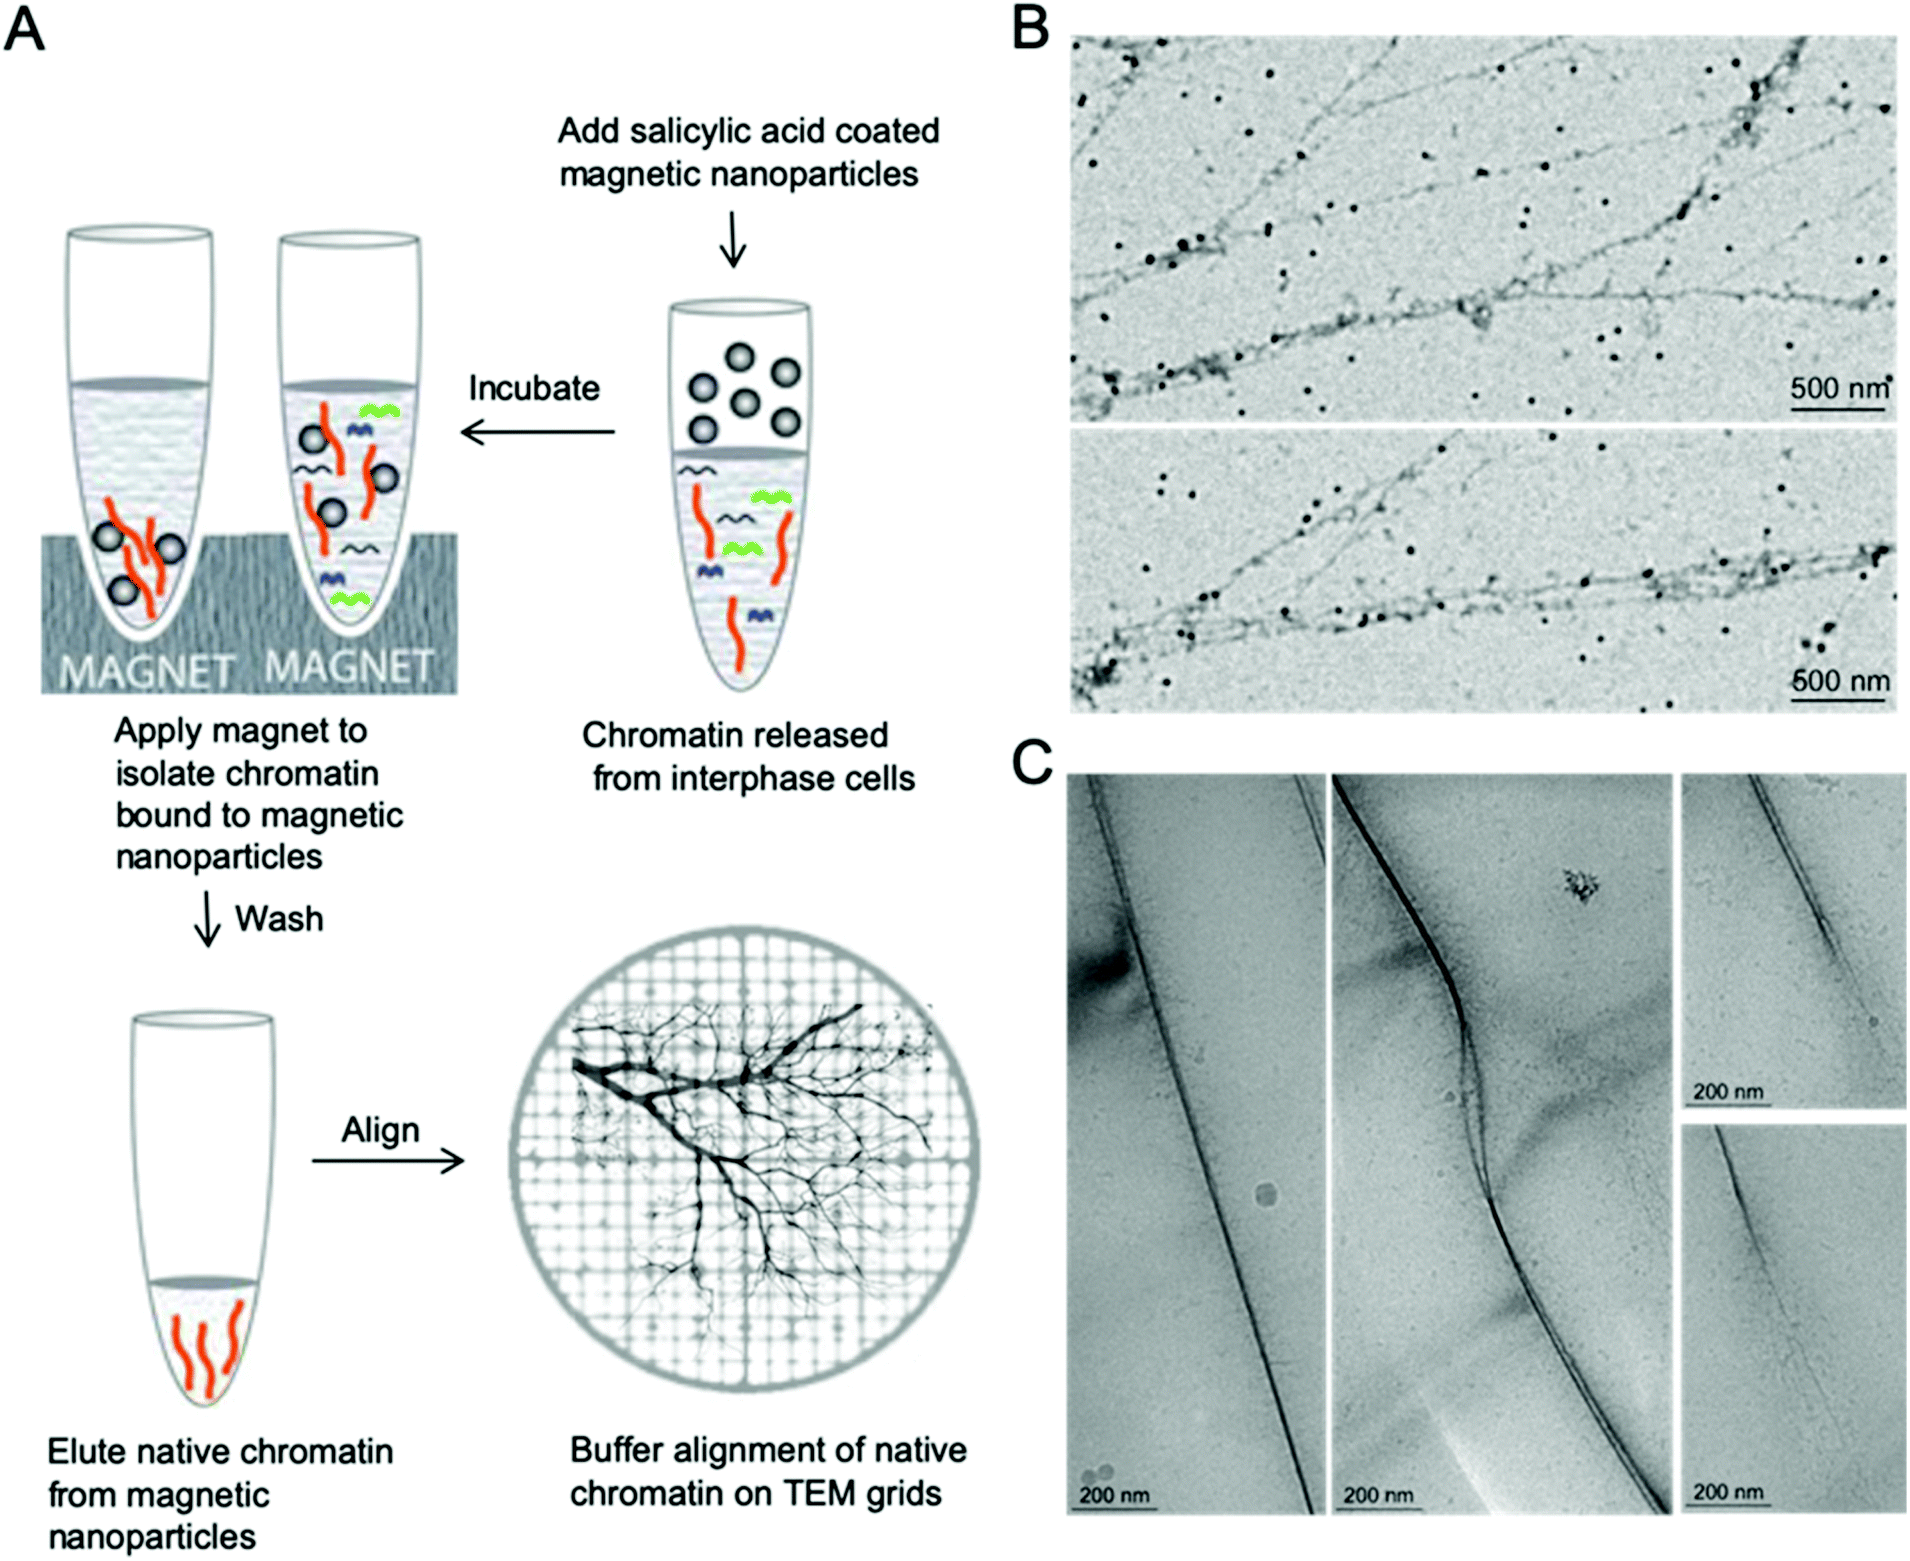 | ||
| Fig. 1 Nanomanipulation using buffer aligned native chromatin on TEM grid. (A) Scheme for native chromatin isolation from interphase eukaryotic cells by magnetic nanoparticles and buffer alignment of chromatin on EM grids. (B) Buffer aligned interphase MCF7 chromatin on the continuous carbon coated EM grids for positive staining EM. (C) Buffer aligned native MCF7 chromatin in vitreous ice for CryoEM. | ||
After depositing a drop of chromatin solution on the carbon support film of the TEM grid and allowing it to attach to the carbon support film, a piece of filter paper was placed on the edge of the grid to absorb the buffer while the chromatin remains attached to the carbon substrate due to the stronger affinity between them. During the buffer edge-blotting process, the liquid-flow induces the attached chromatin to be fully extended and well aligned on the moist carbon surface. More sample preparation details can be found in the ESI.† The chromatin was either further stained with 2% uranyl acetate (UA) for room temperature EM study or vitrified by plunging into liquid ethane for Cryo-EM studies, as shown in Fig. 1. In both cases, the chromatin has a darker contrast compared to the surroundings. On the continuous carbon coated TEM grids, Fig. 1B, the extension of a single fragment of interphase MCF7 chromatin by the receding interface leads to the alignment of chromatin that are longer than 10 μm. The effect of buffer alignment on the samples attached to holey carbon TEM grids (Fig. 1C) clearly indicates that two parallel chromatin fibers are immobilized in vitreous ice. Two chromatin fibers are stacked together in Fig. 1C (left panel) or they form a bubble-like structure as shown in Fig. 1C (middle panel). Some hair-like fibers were noted, branching out of chromatin which are probably decondensed chromatin, as shown in Fig. 1C (right panel). This decondensed chromatin observed at the ends of the thicker chromatin is similar to the previously reported transitional 30 nm chromatin branching structure.26
The force exerted by the liquid-flow on the polymer-like chromatin material is strong enough to extend and align it but too weak to disrupt the ionic interaction between the chromatin and the carbon surface. Thus, chromatin can remain on the carbon surface after buffer alignment. Surface tension force was evaluated by, F = γπD, where the surface tension γ = 7 × 10⁻² N m−1 for the air–water interface.28 The linker DNA between adjacent nucleosomes with a diameter D = 2 nm, which is the most susceptible point to be broken or damaged due to the force of the surface tension exerted during the receding interface, was estimated to be 4 × 10⁻¹⁰ N. This surface tension force is two orders of magnitude greater than the entropic forces (∼1 × 10⁻¹⁴ N) keeping the chromatin molecule in a random coil configuration and is thus enough to fully extend and align the chromatin, but it is smaller than the force required to break a covalent bond (on the order of 10−9 N).28 Our empirical observation, depicted in Fig. S2,† indicates that the linker DNAs in the chromatin beads-on-a-string structure were intact.26 While we cannot preclude the possibility that the receding interface could cause weakly associated chromatin binding proteins to be stripped from the chromatin, we seldom observed unbound protein or protein complex in the TEM images and only occasionally observed fragmented chromatin. The possible reason for random fragmentation is believed to be a result of the shear stress during pipetting and handling.
Our studies show that the buffer alignment process is an excellent fit for high-resolution TEM imaging of isolated polymer-like chromatin. The action of the buffer flow and the receding interface localized at the air–water junction is independent of the length and conformation of the native chromatin. The local action of the receding interface is identical to all of the chromatin in solution. The process of global alignment rules out the possibility of producing an artificially generated twisted chromatin structure. Compared to other techniques, the buffer flow aligned chromatin developed in our work is (i) found in the same plane in the linearized and dispersed state on the carbon support film, facilitating direct high resolution TEM imaging or TEM tomographic imaging without further transferring process, (ii) available for further evaluation, such as staining by UA or plunge freezing by liquid ethane, and (iii) uniquely distinguishable from the background (carbon film or vitreous ice) without any further labeling process. Finally, the canonical chromatin beads-on-a-string structure and the replication fork-like chromatin structure is apparent with high resolution TEM imaging downstream of our buffer alignment process. This has allowed the direct observation of the transitional 30 nm chromatin branching structure, which indicates that the conformation of chromatin is well preserved.26 While our methodology has clear advantages over other techniques, the question regarding the native chromatin structure between its compact in vivo state and the highly dispersed state necessary for EM at nucleosome resolution still needs to be resolved, since the chromatin structure depends on changes in ionic strength and the events at the air–water interface. It is worth noting that although the concentrated chromatin sample could be buffer aligned on continuous carbon coated TEM grids (Fig. S3†), identification of individual chromatin fiber or the classic bead-on-a-string structure in this crowded environment was infrequent. Thus, we conclude that the combination of native chromatin isolation and chromatin alignment on EM grid, to the largest extent, preserves the native higher order chromatin structure and enables their ultrastructure to be determined by TEM.
Quantitative analysis of protein–DNA density on chromatin fibers
Chromatin associated proteins and DNA are densely packed along the chromatin fibers to form higher order chromatin structures inside the nucleus. This high-density packaging makes visualization of the local chromatin structure particularly difficult. We overcame these difficulties by gently aligning the isolated native chromatin in a dispersed state, which is needed for TEM imaging at nucleosome resolution. On both positive staining EM and CryoEM images of the aligned interphase MCF7 chromatin, we noticed that the protein–DNA density varies along the chromatin fibers in addition to the thickness of chromatin fiber. In order to perform quantitative analysis of the protein–DNA density, we focused on UA stained chromatin samples since (i) compared to CryoEM, visualization of a small fragment of chromatin in the vitreous hole (1–5 μm), positive staining EM can visualize chromatin more than 100 μm in length on the continuous carbon grid allowing for the examination of whole organization of chromatin as well as detailed localized structure at different magnification; (ii) the contrast of chromatin is stronger in positive staining EM compared to CryoEM; (iii) chromatin in positive staining conditions can tolerate a higher electron dose allowing for the collection of multiple images; (iv) UA with grain size ∼4–5 Å act as a fixative preserving many protein interactions at the millisecond time scale.38Positive staining in EM enables direct visualization of aligned chromatin across a critical range of structural and biologically relevant scales from the beads-on-a-string structure (∼103−4 base pairs, bp) to “replication fork-like” structure (104–5 bp) to the transitional 30 nm chromatin branching structure (105–6 bp) and to the heavily stained heterochromatin (>106 bp), as shown in Fig. 2A(a–d). This bridges the resolution gap in the chromatin biology field, from a single nucleosome at atomic resolution to chromosome territory at sub-micrometer resolution.1,2,4,5 The protein–DNA density is directly linked to its corresponding brightness in the image, thus the protein–DNA density difference along the chromatin fibers can be directly estimated by its corresponding brightness values. Similar to the transitional 30 nm chromatin branching structure, the protein–DNA electron density decreases on the chromatin branching structure (from left to right), as shown in Fig. 2B, and the thickness of chromatin fibers also decreases. The heavily stained region, which we termed as the trunk, indicates a greater density of protein–DNA complex, while the lightly stained region, which we termed as branches, indicates the presence of a lower density of protein–DNA complex.
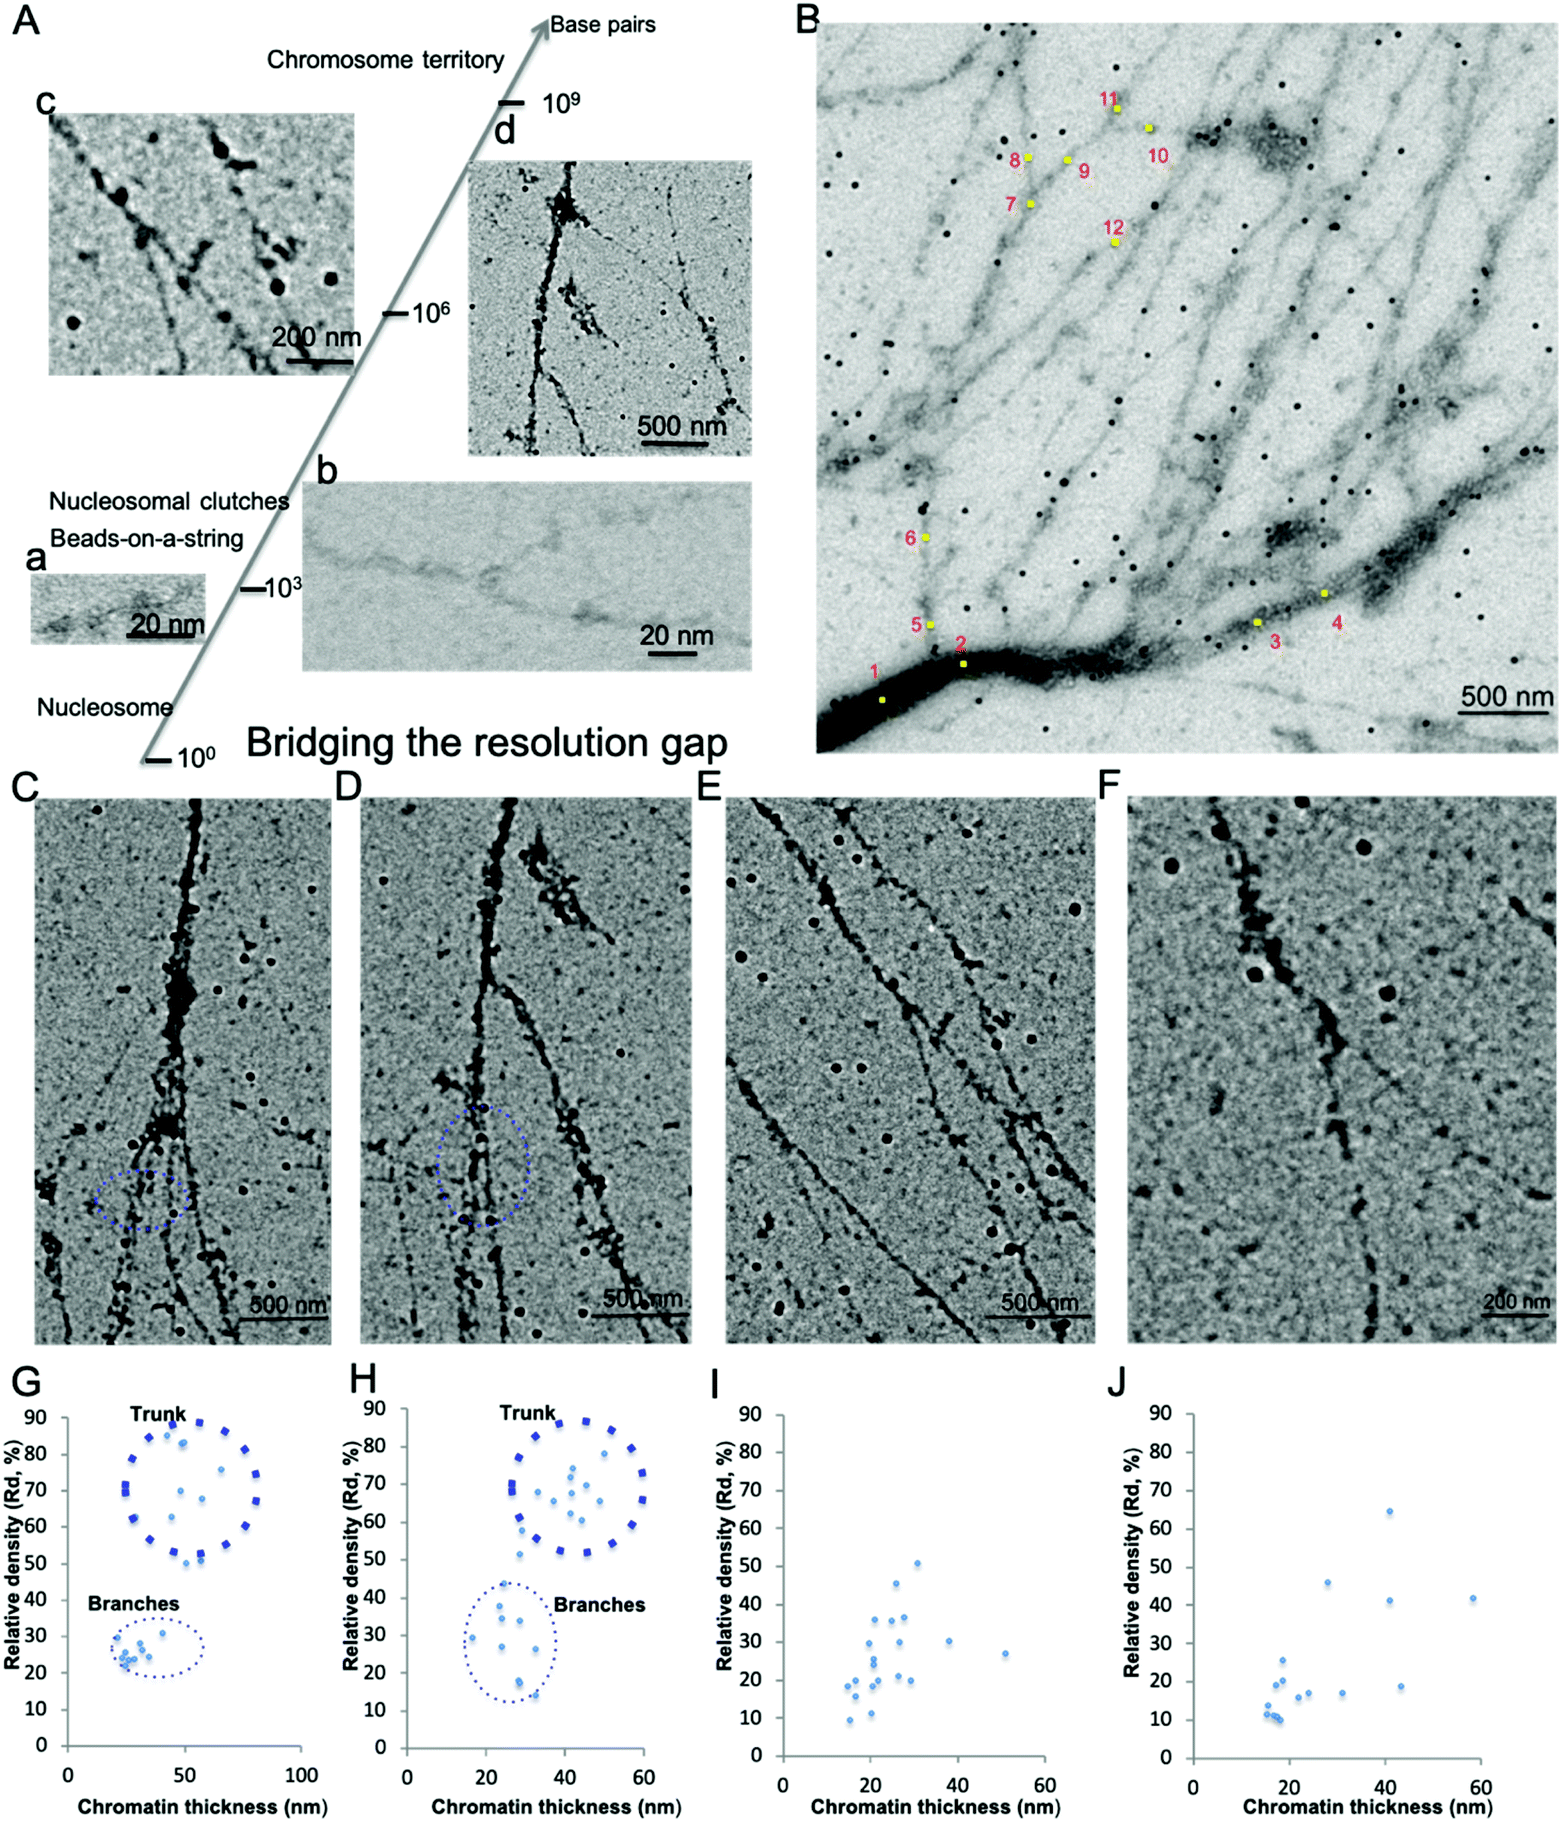 | ||
| Fig. 2 Interphase chromatin contains fibers packed together at different densities. (A) Positive staining EM enables the visualization of the 10 nm beads-on-a-string (a), “replication fork-like” structure (b), transitional 30 nm chromatin fiber (c), and chromatin fiber >200 nm (d) to be resolved at different magnification. This bridges the resolution gap in the chromatin biology field from the single nucleosome at atomic resolution1 to beads-on-a-string structure2 to “nucleosome clutches”4 to chromosome territories5 at sub-micrometer resolution. (B) The DNA–protein density along the chromatin branching structure (from left to right) decreases as well as its thickness. Twelve positions along the chromatin fibers were selected for further analysis of chromatin fiber thickness and corresponding relative protein–DNA density (Table 2). (C–F) Different levels of chromatin branching structures were observed. Scale bars are included in the individual images. (G) Chromatin thickness and relative protein/DNA density (Rd) analysis of (C); and (H) for (D); (I) for (E); (J) for (F). | ||
In order to quantitatively analyze the protein–DNA (electron) density on the chromatin fibers, we utilized gold nanoparticles (GNPs, 34 ± 4 nm in diameter, ∼16 pixels in Fig. 2B) as an internal reference due to the observation that while the protein–DNA electron density changes along the chromatin fibers, the electron density of the well-distributed GNPs is consistent (Fig. 2B). The electron dose and magnification might vary in different imaging conditions causing variation in brightness, but the GNPs can always be used as an internal reference to determine the relative protein–DNA density along chromatin fibers. The Relative density (Rd) is determined by:
| Rdprotein–DNA = (dF − dC) ÷ (dG − dC) |
| Position | Chromatin fiber thickness (nm) | Relative density (Rd) (%) |
|---|---|---|
| 1 | 216 | 107.4 |
| 2 | 152 | 93.1 |
| 3 | 119 | 44.4 |
| 4 | 100 | 42.7 |
| 5 | 59 | 27.1 |
| 6 | 50 | 24.0 |
| 7 | 139 | 23.6 |
| 8 | 57 | 21.8 |
| 9 | 59 | 27.0 |
| 10 | 97 | 43.0 |
| 11 | 76 | 41.8 |
| 12 | 47 | 14.5 |
Besides the chromatin branching structure at the 200 nm level corresponding to the trunk thickness, we also observed chromatin branching structures with different trunk thickness, as shown in Fig. 2C–F. The corresponding chromatin fiber thickness and relative density were also analyzed (Fig. 2 G–J). The chromatin alignment process not only enables individual chromatin chains at the end of the branching structure to be resolved, but also enables the trunk and branches to be distinguishable from each other. For example, in Fig. 2C and its corresponding chromatin thickness and Rd distribution analysis (Fig. 2G), the trunk has a thickness of ∼50 nm with Rd ∼70%, while the branches have a thickness of ∼30 nm with Rd ∼25%. Similar results were observed in Fig. 2D and the corresponding Fig. 2H. It is worth pointing out that when the trunk thickness decreases to the 30 nm range (20–40 nm), the boundary between trunk and branch Rd is not clear (Fig. 2E and F). This might be because various chromatin associated proteins bound to the branches cause the thickness and Rd values to vary. The data from Fig. 2B–J suggests that the native chromatin is organized into branching structures. Moreover, these chromatin branching structures and the previously reported transitional 30 nm chromatin branching structure indicates that the higher order heterochromatin, i.e. constitutive heterochromatin, transforms into lower order heterochromatin stepwise, i.e. facultative heterochromatin, or euchromatin.26
Thus, the aligned chromatin imaged by positive staining EM indicates that the protein–DNA density along the chromatin branching structure varies. The density variation is accompanied by a change in the thickness of chromatin fiber. Our findings are consistent with our previous reports with EM imaging of the transitional 30 nm chromatin fibers and other studies.19,22 ChromEMT study suggests that a granular chain is present in the short pieces of chromatin in sectioned nuclei packed together at different densities.19 The STORM study of whole nuclei in live cells suggests that nucleosomes inside the nucleus are organized into nucleosome clutches,22 which are discontinued in the nucleosome depletion region, consistent with our findings. Lastly, Fig. 2B–F also shows that there is a higher order chromatin structure beyond the 30 nm chromatin fiber, suggesting a branching structure.
Chromatin fiber thickness analysis suggests the 30 nm chromatin fiber exists
The 30 nm chromatin fiber is one of the most important determinants in the regulation of eukaryotic transcription.39,40 The chromatin hierarchical folding model also predicts that the 30 nm chromatin fiber is one of the two predominant structural forms inside the nucleus. However, previous experimental investigations could not substantiate the existence of the 30 nm chromatin fiber in vivo/in situ, which poses a challenge in our understanding of the epigenetic machinery and its role in higher order chromatin structure formation and regulation of gene expression. Very recently, we used a cryogenic electron tomography method to resolve the transitional 30 nm chromatin branching structure from compact heterochromatin to open translatable chromatin in interphase, providing the first observation connecting chromatin structure to its function.26 Here using the aligned chromatin, we directly analyzed its thickness and found that the 30 nm chromatin fiber exists and serves as the predominant intermediate structure between 10–270 nm chromatin fibers. In Fig. 3A, chromatin fibers with lengths ∼8000 nm were imaged, from which several chromatin branching structures (Fig. 3B–E) were detected.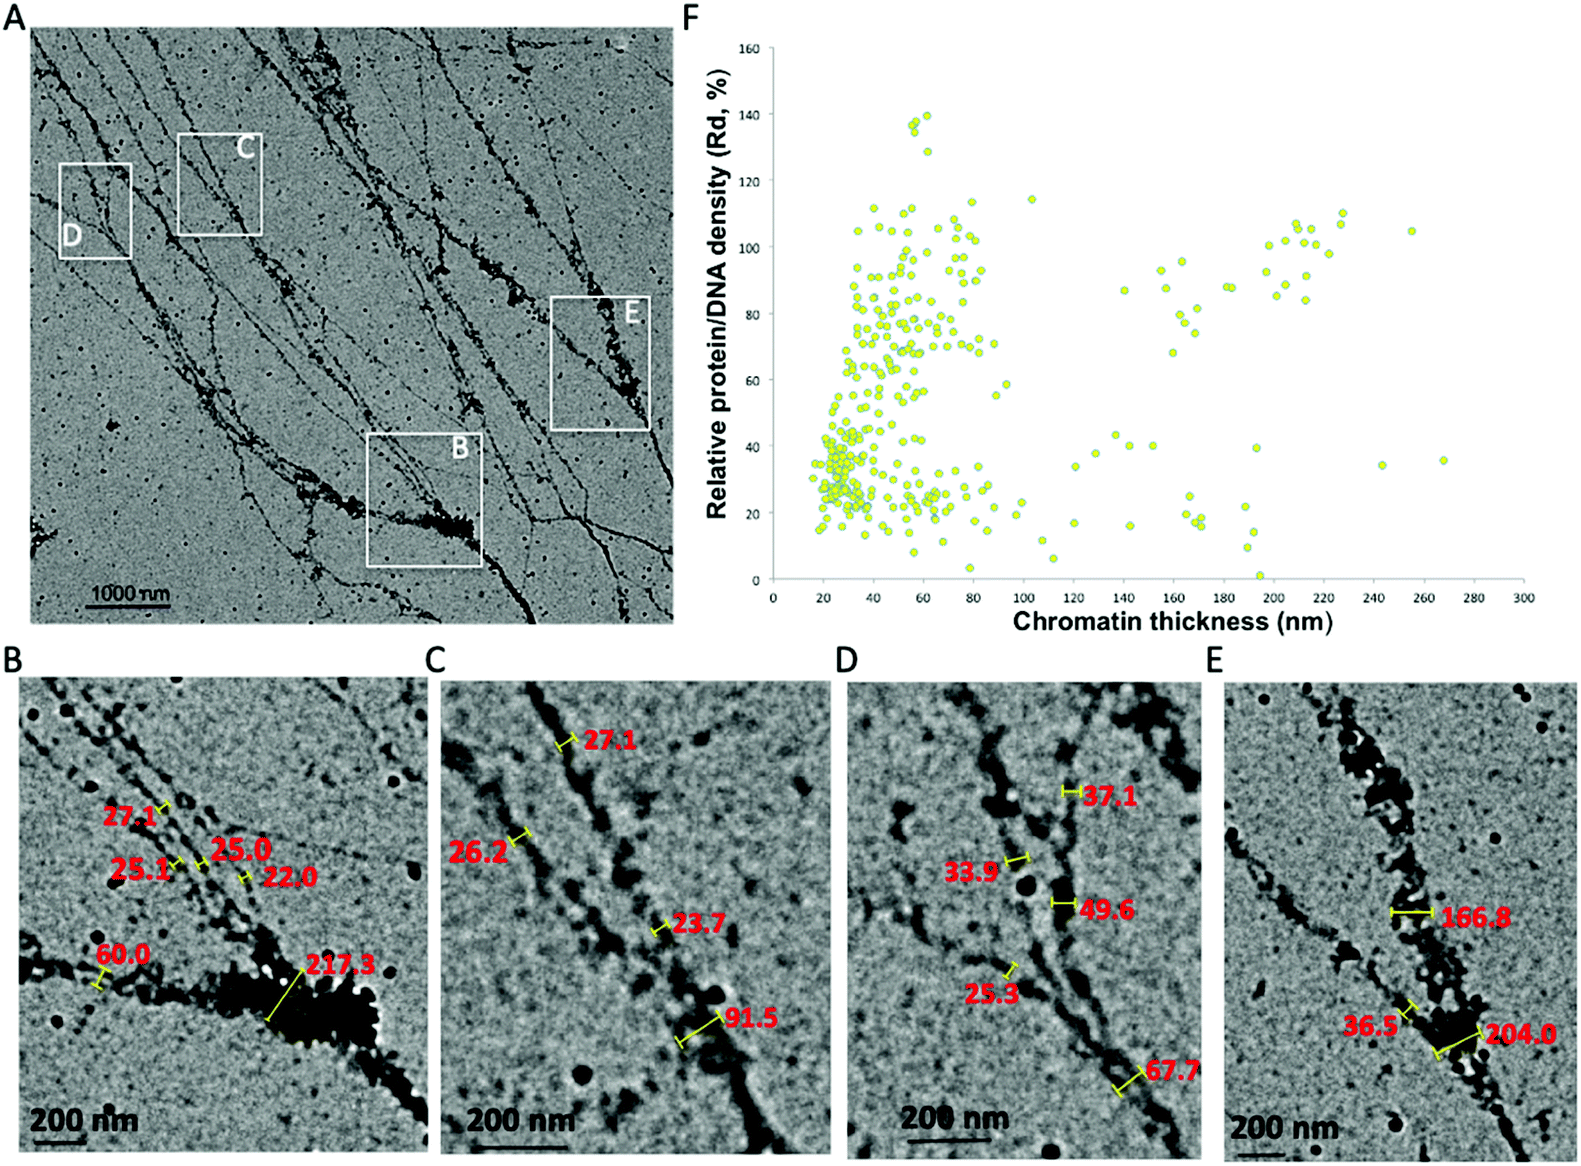 | ||
| Fig. 3 The 30 nm chromatin fiber exists as an intermediate structural form in the isolated native chromatin. (A) Chromatin fiber thickness ranges from 25 nm to 217 nm. The chromatin consists of ∼5.3 million DNA (the upper limit of TAD size) bases with several branching structures, indicated by insets B, C, D, E. (B–E) Manual measurement of chromatin fiber thickness on the branching structures. The 30 nm chromatin fiber exists as a branch after thicker chromatin bifurcating into thinner fibers. (F) Chromatin thickness and relative protein/DNA density distribution analysis of collected images containing tens of TAD-size chromatin. The chromatin thickness ranges from 10 nm to 270 nm with predominant distribution in the range of 20–40 nm. | ||
Measurements of the trunk and thickness of the branches indicate that chromatin thickness varies between 25 nm and 217 nm (Fig. 3B–E). In the region immediately prior, the chromatin bifurcates into thinner fibers, and we observe a distinct increase in the protein–DNA density, possibly indicating that this region is either heavily regulated, or requires additional protein to maintain the trunk structure (Fig. 3B and E). The thickness of the fibers branched off from the trunk varies between 20 nm and 40 nm, which is within the acceptable range of the 30 nm chromatin fiber.12,41 Our observation clearly demonstrates that the 30 nm chromatin fiber exists and acts as a structural intermediate. It is worth mentioning that the chromatin isolation buffer contains 1 mM magnesium chloride (MgCl2), as an additive, not to induce chromatin compaction but to stabilize the nucleosomes on the chromatin fibers.22 From the trunk of the chromatin in Fig. 3B to branches in both Fig. 3C and D, we observe eight 30 nm chromatin fibers. Per the Li-Zhu style 30 nm chromatin structure model, the 30 nm chromatin fibers contain 12 × 187 bps of DNA per 12 nucleosomes with a length of 27 nm,14 the chromatin consisting of branching structures in Fig. 3B–Dcontains ∼5.3-million bps of DNA, which is equivalent to the upper limit size of topologically associated domains (TADs, ranging from hundreds of kilo bases to several million bases in length).42–46
We analyzed chromatin thickness and the corresponding protein–DNA density in the collected images which contain tens of TAD-size chromatin (Fig. 3F). The chromatin thickness ranges from 10 nm to 270 nm with a predominant distribution of 20–80 nm. This further supports the existence of the 30 nm chromatin fiber in the native chromatin. Moreover, the Rd of these 30 nm chromatin fibers varies between 15% and 90%. Our observations suggest that, (i) some 30 nm chromatin fibers with higher protein density could be dedicated to regulate DNA function, (ii) some 30 nm chromatin with higher DNA density bifurcates into thinner chromatin fibers, which can be seen in the transitional 30 nm chromatin branching structure, (iii) the 30 nm chromatin with lower protein–DNA density might be the euchromatin, which is open to other chromatin remodelers to access. We also noticed that chromatin fibers with thickness ranging between 40–80 nm also fall into two distinct Rd distributions. The population of chromatin fibers with Rd values above 50%, as observed in the trunk in Fig. 2C and D, can further undergo bifurcation into 30 nm chromatin fibers, while populations with Rd values below 40%, as seen in Fig. 2B (point 5, 6, 8, and 9), did not undergo further bifurcation and thus terminate as branches. Thus, if a given chromatin fiber has a thickness no less than 30 nm, on one hand, it is possible that this could indicate a branch from higher order chromatin branching structure, for example, the branching structure in Fig. 3B–E; while on the other hand, it could act as the trunk which can further bifurcate into multiple nucleosome arrays, for example, the transitional 30 nm chromatin branching structure. We seldom observed chromatin branching structures with a trunk thickness less than 20 nm. However, the molecular mechanism of how to set up the trunk, which most likely is the facultative heterochromatin, still needs to be addressed. Our data together support the observation that the 30 nm chromatin fiber is one of the intermediate chromatin structural forms between the characterized 10 nm beads-on-a-string and the thickest chromatin fibers observed here at 270 nm. As the smallest trunk in the chromatin branching structures, the 30 nm chromatin fiber directly connects heterochromatin and euchromatin. Thus, the transitional 30 nm chromatin branching structure could constitute the basic regulatory hub of genome function, which would make it the most important structural form during eukaryotic transcription.
Chromatin hierarchical branching structure generally exists
In addition to the observed chromatin branching structures with different trunk thickness (Fig. 2 and 3), several previous studies have also indicated the existence of chromatin branching structures. Chromatin isolated from yolk granules beneath the blastoderm mounted on TEM grids, clearly shows several branching structures.47 Atomic force microscopy (AFM) can achieve nucleosome scale resolution when chromatin samples are deposited on mica. Chromatin from chicken erythrocytes, deposited on mica, has a higher-order structure, in which both 30 nm chromatin fibers and tightly coiled chromatin fibers were observed.48 Our recent work using AFM characterization of chromatin extracted from non-neoplastic S1 HMT-3522 human mammary epithelial cells also indicate that chromatin has fibers with various thicknesses and holds a branching structure,25 consistent with this study.These observed chromatin branching structures clearly demonstrate the transition from thick chromatin fibers to thinner forms. Moreover, when imaging at a relatively high magnification we observed that chromatin fiber with thickness ∼100 nm hierarchically branched at the least at four levels, and the transitional 30 nm chromatin structure is the second to the last of the bifurcation events.26 Thus, it is reasonable to suspect that chromatin utilizes a hierarchical branching pattern to organize the heterochromatin and euchromatin landscape to regulate genome functions such as transcription. Indeed, when visualizing the aligned chromatin from Hela cells at lower magnification by TEM to ascertain branching structures thicker than 100 nm, we noticed that the interphase Hela chromatin also has higher order branching structures (Fig. 4A and B), which we termed as “chromatin hierarchical branching” analogous to the “hierarchical branching structure of branches in a tree”. Three distinct chromatin fibers spread from the left to right in Fig. 4A, as the trunk in each individual chromatin, decondensed in a stepwise manner from thick fibers to thinner forms. One of the trunks, indicated by the black arrows in Fig. 4A, had a length of ∼10 μm, which is equal to the average size of the diameter of the nucleus. One of the branching structures, indicated by the white rectangle in Fig. 4A, imaged at higher magnification, is shown in Fig. 4B. Clearly, four levels of chromatin hierarchical branching structure can be seen, indicated by the yellow circles (Fig. 4B). The trunk thickness was determined at 294 nm, 186 nm, 68 nm and 57 nm, respectively. Most of the chromatin branching structures have a branching factor ranging from 2–4. Both the protein–DNA density and fiber thickness were different among the branches after chromatin bifurcates from the trunk, indicating that the DNA distributes unevenly among the branches with the exception of the 57 nm (trunk thickness) chromatin branching structure. The thickness of the branches in the 57 nm branch was 37 nm, which is in the 30 nm chromatin fiber range. One of the two branches further bifurcated into two thinner chromatin fibers (Fig. S4†), indicating that it might be the trunk of the transitional 30 nm chromatin branching structure. Thus, the chromatin is compacted at several levels in a stepwise manner, from the transitional 30 nm chromatin branching structure, to fibers with trunk thickness ranging from 60–290 nm.
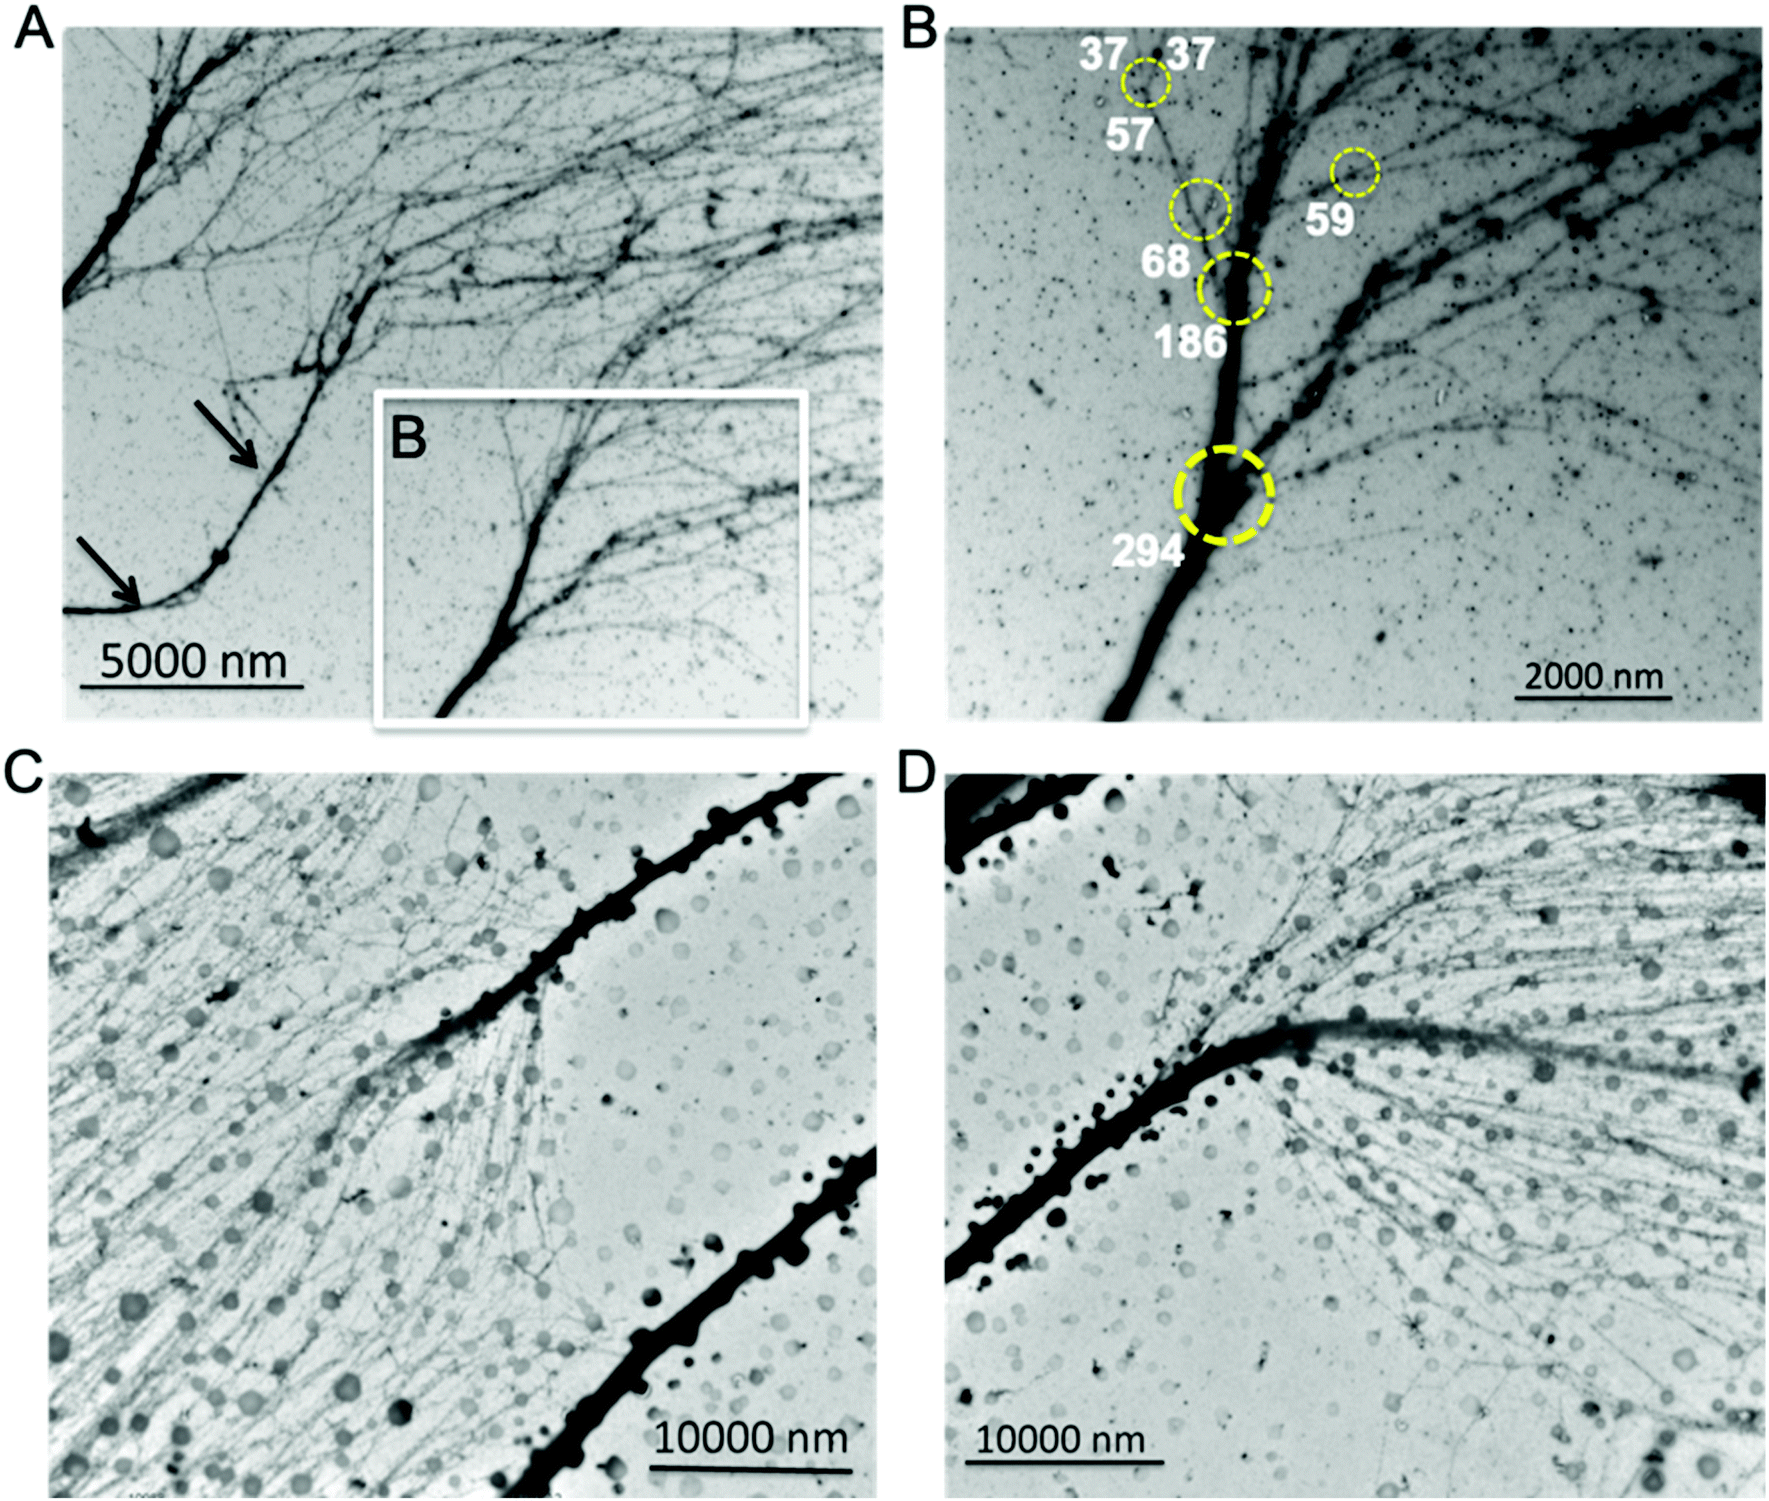 | ||
| Fig. 4 Chromatin hierarchical branching structure shared in interphase eukaryotic cells. Isolated interphase Hela chromatin organized into a hierarchical branching manner (A&B). (A) Three positively stained Hela chromatin parallelly located on continuous carbon coated TEM grids. (B) The Hela chromatin contains four levels of hierarchical branching structure, indicated by the yellow circles. This indicates that chromatin compacted in a stepwise manner, from the transitional 30 nm chromatin branching structure, to fibers with trunk thickness ranging from 60–290 nm. The thicknesses of chromatin fibers are labelled (nm). Isolated interphase leukocytes chromatin organized into a hierarchical branching manner (C&D). Leukocytes have thicker trunks with length ∼20 μm. The branching factor of leukocyte chromatin was larger than twenty and the DNA was distributed evenly among the branches. | ||
Next, we asked the question of whether the branching structure was a nuclear morphological artifact from the in vitro cultured MCF7 or Hela cells. To address this question, we isolated and analyzed chromatin from leukocytes which are highly differentiated and do not undergo cell division in the bloodstream at the G0 phase. As expected, leukocyte chromatin also reveals a hierarchical branching structure (Fig. 4C and D). In contrast to the Hela cells, we observed that leukocytes have thicker trunks with length ∼20 μm. Interestingly, the branching factor of leukocyte chromatin was extremely large (>20) and the DNA was distributed evenly among these branches. In addition, we also analyzed chromatin from mouse neural stem cells (NSC, Fig. S5†). Although the chromatin fibers are different with respect to the origin of species and disease state, they all hold the hierarchical branching structure.
Super resolution dSTORM optical microscopy has also been used to image individual human subchromosomal regions in the nucleus.21 Three different levels of DNA compaction were suggested: (i) dispersed chromatin arrays; (ii) nanodomain containing a few kilobases of DNA with length at tens of nanometers; and (iii) clusters of nanodomains. Although this in vivo study indicated a hierarchical organization, consistent with our in vitro EM studies, the resolution of electron microscopy achieved in our work was not possible by super resolution microscopy. Moreover, chromatin spreading from the nucleus to the glass slides, which preserves its structural integrity, also informs that chromatin has a branching structure.49
Conclusions
We have identified a comprehensive experimental strategy to directly observe higher order chromatin structures by combining a unique buffer alignment methodology to isolate native chromatin on carbon coated EM grids for high-resolution electron microscopy imaging. We find that interphase eukaryotic chromatin shares a common hierarchical branching organization, highlighting the stepwise transition from heterochromatin to euchromatin. We also confirm that the 30 nm chromatin fiber is one of the intermediate chromatin structural forms. Our work sets the stage for further studies on the specific function of chromatin associated proteins and chromatin associated RNAs in these nanodomains, and its relation to DNA related genomic processes such as replication, recombination and repair that can potentially impact cell function with implications in cancer and other disorders.Conflicts of interest
There are no conflicts to declare.Acknowledgements
We thank A. Stein and C. Woodcock for their helpful discussions during the experimental design and manuscript preparation. This project was partly funded by the W. M. Keck Foundation grant and the Indiana Clinical and Translational Sciences Institute funded in part by Grant Number (TR000006) from the NIH. Assistance from the Cancer Center at Illinois is appreciated.References
- K. Luger, A. W. Mäder, R. K. Richmond, D. F. Sargent and T. J. Richmond, Nature, 1997, 389, 251–260 CrossRef CAS.
- A. L. Olins and D. E. Olins, Science, 1974, 183, 330 CrossRef CAS.
- J. J. Parmar, M. Woringer and C. Zimmer, Annu. Rev. Biophys., 2019, 48, 231–253 CrossRef CAS.
- M. A. Ricci, C. Manzo, M. F. García-Parajo, M. Lakadamyali and M. P. Cosma, Cell, 2015, 160, 1145–1158 CrossRef CAS.
- T. Cremer and C. Cremer, Nat. Rev. Genet., 2001, 2, 292–301 CrossRef CAS.
- J. D. Watson and F. H. Crick, Nature, 1953, 171, 737–738 CrossRef CAS.
- S. Harteis and S. Schneider, Int. J. Mol. Sci., 2014, 15, 12335–12363 CrossRef.
- A. R. Cutter and J. J. Hayes, FEBS Lett., 2015, 589, 2914–2922 CrossRef CAS.
- B. van Steensel, EMBO J., 2011, 30, 1885–1895 CrossRef CAS.
- G. Felsenfeld and J. D. McGhee, Cell, 1986, 44, 375–377 CrossRef CAS.
- E. Fussner, R. W. Ching and D. P. Bazett-Jones, Trends Biochem. Sci., 2011, 36, 1–6 CrossRef CAS.
- P. J. J. Robinson, L. Fairall, V. A. T. Huynh and D. Rhodes, Proc. Natl. Acad. Sci. U. S. A., 2006, 103, 6506 CrossRef CAS.
- M. Eltsov, K. M. MacLellan, K. Maeshima, A. S. Frangakis and J. Dubochet, Proc. Natl. Acad. Sci. U. S. A., 2008, 105, 19732–19737 CrossRef CAS.
- F. Song, P. Chen, D. Sun, M. Wang, L. Dong, D. Liang, R.-M. Xu, P. Zhu and G. Li, Science, 2014, 344, 376 CrossRef CAS.
- K. van Holde and J. Zlatanova, J. Biol. Chem., 1995, 270, 8373–8376 CrossRef CAS.
- R. K. A. Virk, W. Wu, L. M. Almassalha, G. M. Bauer, Y. Li, D. VanDerway, J. Frederick, D. Zhang, A. Eshein, H. K. Roy, I. Szleifer and V. Backman, Sci. Adv., 2020, 6, eaax6232 CrossRef CAS.
- T. Sexton and G. Cavalli, Cell, 2015, 160, 1049–1059 CrossRef CAS.
- J. H. Gibcus and J. Dekker, Mol. Cell, 2013, 49, 773–782 CrossRef CAS.
- J. C. Hansen, M. Connolly, C. J. McDonald, A. Pan, A. Pryamkova, K. Ray, E. Seidel, S. Tamura, R. Rogge and K. Maeshima, Biochem. Soc. Trans., 2018, 46, 67 CrossRef CAS.
- M. Cremer and T. Cremer, Genes, Chromosomes Cancer, 2019, 58, 427–436 CrossRef CAS.
- K. Fang, X. Chen, X. Li, Y. Shen, J. Sun, D. M. Czajkowsky and Z. Shao, ACS Nano, 2018, 12, 4909–4918 CrossRef CAS.
- K. Maeshima, R. Rogge, S. Tamura, Y. Joti, T. Hikima, H. Szerlong, C. Krause, J. Herman, E. Seidel, J. DeLuca, T. Ishikawa and J. C. Hansen, EMBO J., 2016, 35, 1115–1132 CrossRef CAS.
- M. Eltsov, D. Grewe, N. Lemercier, A. Frangakis, F. Livolant and A. Leforestier, Nucleic Acids Res., 2018, 46, 9189–9200 CrossRef CAS.
- H. D. Ou, S. Phan, T. J. Deerinck, A. Thor, M. H. Ellisman and C. C. O’Shea, Science, 2017, 357, eaag0025 CrossRef.
- Z. Zhou and J. Irudayaraj, Analyst, 2015, 140, 938–944 RSC.
- Z. Zhou, K. Li, R. Yan, G. Yu, C. J. Gilpin, W. Jiang and J. M. K. Irudayaraj, Nanoscale, 2019, 11, 13783–13789 RSC.
- G. Tang, L. Peng, P. R. Baldwin, D. S. Mann, W. Jiang, I. Rees and S. J. Ludtke, J. Struct. Biol., 2007, 157, 38–46 CrossRef CAS.
- A. Bensimon, A. Simon, A. Chiffaudel, V. Croquette, F. Heslot and D. Bensimon, Science, 1994, 265, 2096 CrossRef CAS.
- R. M. Zimmermann and E. C. Cox, Nucleic Acids Res., 1994, 22, 492–497 CrossRef CAS.
- T. T. Perkins, D. E. Smith, R. G. Larson and S. Chu, Science, 1995, 268, 83 CrossRef CAS.
- S. B. Smith, Y. Cui and C. Bustamante, Science, 1996, 271, 795 CrossRef CAS.
- D. E. Smith, H. P. Babcock and S. Chu, Science, 1999, 283, 1724 CrossRef CAS.
- J. Guan and L. J. Lee, Proc. Natl. Acad. Sci. U. S. A., 2005, 102, 18321 CrossRef CAS.
- C. H. Reccius, S. M. Stavis, J. T. Mannion, L. P. Walker and H. G. Craighead, Biophys. J., 2008, 95, 273–286 CrossRef CAS.
- A. Cerf, B. R. Cipriany, J. J. Benítez and H. G. Craighead, Anal. Chem., 2011, 83, 8073–8077 CrossRef CAS.
- A. Cerf, H. C. Tian and H. G. Craighead, ACS Nano, 2012, 6, 7928–7934 CrossRef CAS.
- X. Wang, S.-I. Takebayashi, E. Bernardin, D. M. Gilbert, R. Chella and J. Guan, Biomed. Microdevices, 2012, 14, 443–451 CrossRef CAS.
- F.-Q. Zhao and R. Craig, J. Struct. Biol., 2003, 141, 43–52 CrossRef CAS.
- G. Li and P. Zhu, FEBS Lett., 2015, 589, 2893–2904 CrossRef CAS.
- G. Li and D. Reinberg, Curr. Opin. Genet. Dev., 2011, 21, 175–186 CrossRef CAS.
- V. A. T. Huynh, P. J. J. Robinson and D. Rhodes, J. Mol. Biol., 2005, 345, 957–968 CrossRef CAS.
- J. R. Dixon, D. U. Gorkin and B. Ren, Mol. Cell, 2016, 62, 668–680 CrossRef CAS.
- J. R. Dixon, S. Selvaraj, F. Yue, A. Kim, Y. Li, Y. Shen, M. Hu, J. S. Liu and B. Ren, Nature, 2012, 485, 376–380 CrossRef CAS.
- D. A. Jackson and A. Pombo, J. Cell Biol., 1998, 140, 1285 CrossRef CAS.
- Q. Szabo, D. Jost, J.-M. Chang, D. I. Cattoni, G. L. Papadopoulos, B. Bonev, T. Sexton, J. Gurgo, C. Jacquier, M. Nollmann, F. Bantignies and G. Cavalli, Sci. Adv., 2018, 4, eaar8082 CrossRef.
- B. Bintu, L. J. Mateo, J.-H. Su, N. A. Sinnott-Armstrong, M. Parker, S. Kinrot, K. Yamaya, A. N. Boettiger and X. Zhuang, Science, 2018, 362, eaau1783 CrossRef.
- G. Wang, Protein Cell, 2010, 1, 315–318 CrossRef.
- R. L. Qian, Z. X. Liu, M. Y. Zhou, H. Y. Xie, C. Jiang, Z. J. Yan, L. M. Qian, Y. Zhang and J. Hu, Cell Res., 1997, 7, 143–150 CrossRef CAS.
- Y. Wang, S. Maharana, M. D. Wang and G. V. Shivashankar, Sci. Rep., 2014, 4, 4477 CrossRef.
Footnote |
| † Electronic supplementary information (ESI) available. See DOI: 10.1039/d0na00359j |
| This journal is © The Royal Society of Chemistry 2021 |