Niobium pentoxide based materials for high rate rechargeable electrochemical energy storage

Fei Shen a, Zhongti Sun ab, Qinggang He *c, Jingyu Sun abd, Richard B. Kaner *e and Yuanlong Shao *abd
aCollege of Energy, Soochow Institute for Energy and Materials InnovationS (SIEMIS), Jiangsu Provincial Key Laboratory for Advanced Carbon Materials and Wearable Energy Technologies, Soochow University, 215006 Suzhou, P. R. China. E-mail: ylshao@suda.edu.cn
bSUDA-BGI Collaborative Innovation Center, Soochow University, Suzhou 215006, P. R. China
cCollege of Chemical and Biological Engineering, Zhejiang University, Hangzhou, Zhejiang 310027, China. E-mail: qghe@zju.edu.cn
dBeijing Graphene Institute (BGI), 100095 Beijing, P. R. China
eDepartment of Chemistry and Biochemistry, Department of Materials Science and Engineering, California NanoSystems Institute (CNSI), University of California, Los Angeles, Los Angeles, California 90095, USA. E-mail: kaner@chem.ucla.edu

Received 14th September 2020 , Accepted 9th December 2020

First published on 9th December 2020


Abstract

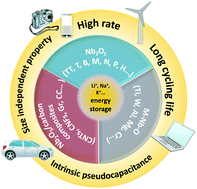
The demand for high rate energy storage systems is continuously increasing driven by portable electronics, hybrid/electric vehicles and the need for balancing the smart grid. Accordingly, Nb2O5 based materials have gained great attention because of their fast cation intercalation faradaic charge storage that endows them with high rate energy storage performance. In this review, we describe the crystalline features of the five main phases of Nb2O5 and analyze their specific electrochemical characteristics with an emphasis on the intrinsic ion intercalation pseudocapacitive behavior of T-Nb2O5. The charge storage mechanisms, electrochemical performance and state-of-the-art characterization techniques for Nb2O5 anodes are summarized. Next, we review recent progress in developing various types of Nb2O5 based fast charging electrode materials, including Nb2O5 based mixed metal oxides and composites. Finally, we highlight the major challenges for Nb2O5 based materials in the realm of high rate rechargeable energy storage and provide perspectives for future research.


image file: d0mh01481h-p1.tif

Fei Shen

Dr Fei Shen received her MSc in Food Science from Jilin University in 2015 and PhD in Chemistry from Technical University of Denmark in 2019. Her PhD thesis explored enzymatic biofuel cells and biosupercapacitors. She is currently a postdoctoral researcher at College of Energy, Soochow University. Her research work focuses on developing new anode materials for fast-charging batteries and exploring the charge storage mechanisms of the electrodes.

image file: d0mh01481h-p2.tif

Qinggang He

Dr Qinggang He obtained his PhD from the Department of Chemistry and Chemical Biology, Northeastern University in 2010. Currently, he is a Distinguished Research Fellow at the College of Chemical and Biological Engineering, Zhejiang University. His research interests focus on renewable electrochemical energy systems and electrode reaction kinetics, and the characterization of key interfacial features by in situ spectroscopy and microscopy technologies.

image file: d0mh01481h-p3.tif

Richard B. Kaner

Prof. Richard B. Kaner holds the Dr Myung Ki Hong Endowed Chair in Materials Innovation at UCLA. After receiving his PhD in inorganic chemistry from the University of Pennsylvania in 1984 and postdoctoral research at UC Berkeley, he joined UCLA in 1987 as an Assistant Professor, earned tenure in 1991, became a full Professor in 1993 and was given the title Distinguished Professor in 2012. Prof. Kaner is a Fellow of the American Association for the Advancement of Science, the American Chemical Society, the American Physical Society, the Materials Research Society and the Royal Society of Chemistry. According to the most recent Clarivate Analytic rankings, he is among the world's most highly cited authors. Professor Kaner has received awards from the Dreyfus, Fulbright, Guggenheim, Packard and Sloan Foundations, along with the Award in the Chemistry of Materials from the American Chemical Society, the MRS Medal from the Materials Research Society, and the Centenary Prize from the Royal Society of Chemistry for his work on refractory materials, including new synthetic routes to ceramics, superhard metals, conducting polymers, and nanostructured carbon.

image file: d0mh01481h-p4.tif

Yuanlong Shao

Prof. Yuanlong Shao is a full professor in the energy college of Soochow University. He studied materials science at Donghua University, where he earned his PhD in 2016. He carried out collaborative research with Prof. Kaner as a visiting PhD student from 2013 to 2015. He then joined Cambridge University as a postdoctoral research associate in 2016 working with Prof. Andrea Ferrari and Prof. Clare Grey. Before joining Soochow University, he worked as a research scientist in KAUST in collaboration with Prof. Vincent Tung. His research interests focus on graphene/biomass hybrid fibers, wearable energy storage devices, and high-rate electrochemical charge storage systems.


1. Introduction

Due to the increasing demand for rapid charging and high power delivery for portable electronics and electric vehicles, high rate energy storage systems (ESSs) that can store/release charge in minutes have attracted increasing attention.1 In addition, with the substantial growth of clean energy, including solar, wind, and tide energy, the intermittency of their intrinsic electricity output triggers an increased need for high performance ESS with high power density and great current fluctuation tolerance.2–4

For various ESSs, batteries and electrochemical capacitors (ECs) are the two main categories of energy storage devices that are widely used in our daily life. While batteries deliver high energy density (∼300 W h kg−1) with limited output power density and relatively long charging times of a few hours,5,6 ECs, also known as supercapacitors, can provide ultrafast charging speeds (minutes or even seconds) and high power density, which could provide a complementary component to that of batteries.7–11 ECs can store charge via either electrostatic (electrical double layer capacitors, EDLCs) or faradaic (pseudocapacitors) processes to yield a long cycle life (millions of cycles), as well as fast charge and high-power output features.12–16 EDLCs generally store charge electrostatically at the interface between high surface areas of carbon materials and a liquid electrolyte with only a few angstroms thickness of charge separation.12 In contrast to EDLCs, pseudocapacitors store charge via faradaic processes that originate from a fast sequence of electrosorption, reversible faradaic redox reactions, or ion intercalation processes. The pseudocapacitance generation process is accompanied by a faradaic process involving a near-surface or even bulk dimensional electron charge-transfer at the interface of the electrolyte and the electrode. Thus, pseudocapacitance usually exhibits a one or two order of magnitude higher value than that of the active materials of EDLCs with the same surface area, thus significantly increasing the energy density.17 In 1971, the pseudocapacitive mechanism was first discovered by Conway et al. in RuO2 which involved a redox active reaction.18,19 Although the nature of the RuO2 based redox pseudocapacitive process is a faradaic charge-transfer reaction, the electrochemical features are close to that of EDLCs.20 Overall, according to the formation process, pseudocapacitive charge storage mechanisms can be divided into three categories: (1) underpotential deposition, (2) redox pseudocapacitance and (3) intercalation pseudocapacitance.8,21,22 Underpotential deposition is a phenomenon of electrodepositing a metal cation onto a noble metal surface at a potential less negative than its reduction potential.23 The poor reversibility and narrow stable potential window of underpotential deposition based pseudocapacitive materials limit their applications in the charge storage realm. Redox pseudocapacitive charge storage processes occur at the surface or near surface of a pseudocapacitive electrode, such as RuO2 or MnO2, with a reversible redox reaction.24–26 Intercalation pseudocapacitance involves the intercalation of cations or anions into the bulk of a redox material by a faradaic charge-transfer process without any obvious crystalline phase transition.27–30 Intercalation pseudocapacitive materials have been exploited for fast energy storage through cation intercalation (Li+, Na+ and K+)27,31,32 or anion intercalation (O2−).29

Pseudocapacitive materials can store and deliver large amounts of energy with an operation time of tens of seconds to minutes.20,21 The fast redox charge storage characteristics endow pseudocapacitive materials with the merits of higher energy density than typical EDLC supercapacitors and better rate performance than classical batteries. In particular, intrinsic pseudocapacitive materials, which exhibit inherent capacitor-like charge storage behavior independent of particle size and morphology, have received growing interest recent years.20 The transition metal oxide Nb2O5, particularly its orthorhombic phase (T), is a typical intrinsic intercalation pseudocapacitive material. T-Nb2O5 exhibits an incredibly high Li-ion intercalation speed due to its unique facile Li diffusion in its two-dimensional (2D) crystal structure.27,33 In 2013, the Dunn group reported that T-Nb2O5 exhibits typical Li-ion intercalation pseudocapacitive behavior without any phase transformation even for a thick film electrode (∼40 μm).27 Niobium oxides together with their composites therefore have been widely used for supercapacitors, high-rate rechargeable lithium ion batteries (LIBs) and hybrid capacitors.34–37 Compared to the low working potential of a traditional graphite anode material (<0.2 V vs. Li+/Li),38 niobium oxides generally exhibit a Li ion intercalation/de-intercalation potential higher than 1.0 V (vs. Li+/Li),36 thus overcoming the severe safety concerns including electrolyte reduction and lithium-dendrite formation that plague most LIBs. Thanks to the rich redox chemistry of elemental niobium (Nb5+/Nb4+, Nb4+/Nb3+) and Li+ intercalation capacitance, Nb2O5 shows a theoretical capacity of ∼200 mA h g−1 (∼600 F g−1) and some TiNbxO2+2.5x compounds offer even higher capacity (close to ∼400 mA h g−1),39 superior to other intercalation electrode materials, like TiO2 (168 mA h g−1)40 and Li4Ti5O12 (175 mA h g−1).41 Thus, niobium based oxides are very promising to serve as active materials for next-generation high rate rechargeable ESSs, including both ion intercalation pseudocapacitors and high rate batteries.

Based on increasing research efforts and intensive progress in this field, a few recent reviews have covered different aspects of niobium oxides for electrochemical energy storage.36,42–45 For example, Yu et al. systematically describe the structural features of Nb2O5, niobium based alloy compounds and their applications in Li/Na-ion intercalation type batteries.36 Recently, Ma et al. provided a comprehensive review focused on Li/Na-ion hybrid capacitors.44 Although these reviews provide good discussions on orthorhombic Nb2O5 and its use in intercalation type charge storage applications, these papers do not provide a deep understanding of the relationship between the structural features and electrochemical charge storage mechanism for various phases of Nb2O5 and their analogues. In addition, state-of-the-art characterization techniques, especially the latest in situ and operando approaches, are critical for thoroughly studying the structural evolution during the electrochemical processes and their effects on charge storage performance.

Therefore, in this review, we first highlight the high-rate performance of niobium related oxides and then provide an in-depth discussion to demonstrate the structure-driven mechanisms of fast Li+ diffusion in specific niobium related oxides even at the micrometer scale. We elaborate on a wide range of Nb2O5 polymorphs, including their structural chemistry and electrochemical features. The latest advanced characterization techniques, including synchrotron X-ray adsorption/diffraction spectroscopy, scanning/transmission electron microscopy and nuclear magnetic resonance spectroscopy, are systematically presented along with their basic characterization mechanism and applications including in situ and operando analyses. The effects of the crystallinity of various polymorphs of Nb2O5 on their charge storage behavior are then explored both experimentally and theoretically. Next, we summarize the recent progress in developing Nb2O5 based high rate electrode materials, such as titanium or tungsten mixed metal oxide alloys, heteroatom doped Nb2O5 compounds, and carbonaceous hybrid materials. In addition, we look at the latest research on Nb2O5 based materials for high rate charge storage systems, even beyond Li-ion, such as K-ion and Na-ion. Finally, the critical challenges and prospects for future promising research directions for Nb2O5 based high-rate rechargeable materials are provided. This review aims to deliver a comprehensive introduction to Nb2O5 polymorphs as well as their derivatives and composites, exploring their structure dominated electrochemical charge storage behavior. This will shed light on prospects for future research on niobium-based electrodes for high rate rechargeable energy storage systems.

2. Niobium pentoxide electrodes

Niobium, earlier known as columbium, is a typical transition metal in Group 5 (formerly Group VB) with the symbol Nb and atomic number 41 in the periodic table of elements. It can form into a series of niobium oxide compounds, such as NbO, Nb2O3, NbO2 and Nb2O5, in which the chemical valences of niobium are +2, +3, +4 and +5, respectively.36 Niobium pentoxide (Nb2O5) is the most thermodynamically stable compound in the niobium–oxygen system, which is of great interest for its applications in energy storage devices with valence changes from +5 to +4 or even +3 during redox reactions.36,46 Stoichiometric Nb2O5 is a typical insulator (conductivity of ∼3.4 × 10⁻⁶ S cm−1 at 300 K), which becomes an n-type semiconductor (conductivity of ∼3 × 10⁻³ S cm−1) with a decrease in oxygen stoichiometry.47–49 With an oxidation state of +5 in Nb2O5, all the Nb 4d electrons are bonded to the 2p-band of oxygen, verifying the fact that Nb2O5 has a low electrical conductivity.47 Although the intrinsically poor electrical conductivity hinders their rate performance and cycling stability to some extent, the analogous ReO3-type Wadsley–Roth shear crystal structure induced fast metal-ion transport channels endow Nb2O5, especially the orthorhombic phase, with fascinating electrochemical energy storage performance.

Fig. 1 summarizes the timeline of Nb2O5 based anode materials for fast charging electrochemical energy storage. The study of Nb2O5, TiNb2O7 and Ti2Nb10O29 began in the 1980s.50,51 The electrochemical pioneer, Bard and Zahurak et al. studied Li-ion insertion electrochemistry during this period. Afterwards, Kumagai et al. carried out a great deal of research investigating the electrochemical and crystal structural characteristics of Nb2O5 in rechargeable lithium batteries.52–55 In 2011, Goodenough et al. introduced TiNb2O7, a typical material in the titania–niobia system, as an anode for LIBs.56 In 2013, the Dunn group found that orthorhombic Nb2O5 (T-Nb2O5) exhibits high-rate electrochemical energy storage through Li+ intercalation pseudocapacitance.27,28 Since then, Nb2O5 related anode materials once again have received extensive attention, according to their promising applications in fast-charging energy storage devices.


image file: d0mh01481h-f1.tif
Fig. 1 The development timeline of Nb2O5 based materials for energy storage.

Generally, Li-ions are inserted/extracted into/from the Nb2O5 crystal structure in the potential range higher than 1 V (>1 V vs. Li+/Li), which is well matched to the lowest unoccupied molecular orbital (LUMO) of carbonate organic electrolytes. Thus, it can prevent the formation of an SEI film and lithium dendrites without reducing the organic electrolytes, which could significantly improve the safety of fast charging batteries.42,57 In addition, according to the rich redox chemistry of elemental Nb, Nb2O5 exhibits an intrinsic theoretical capacity of 726 C g−1 or ∼200 mA h g−1, which is significant higher than the commercialized fast charging Li-ion anode materials, TiO2 (168 mA h g−1) and Li4Ti5O12 (175 mA h g−1).28 After being decorated with other metallic atoms, such as titanium, the mixed oxide alloy (TiNb2O7) can even achieve a theoretical capacity of ∼401 mA h g−1, based on the two-electron redox reaction of elemental Nb and Ti (Nb5+/Nb4+, Nb4+/Nb3+, Ti4+/Ti3+). Although Nb2O5 exhibits poor electronic conductivity at room temperature, it surprisingly demonstrates about three orders of magnitude increase during the electrochemical lithiation due to electron delocalization, which is a key factor for T-Nb2O5 to realize high rate and high stability in the absence of conductive additives.28 Based on its high-speed kinetics for Li ion intercalation/de-intercalation, the charge storage process for Nb2O5 is mainly dominated by ion intercalation pseudocapacitance. Therefore, we focus the charge storage mechanism of Nb2O5 related electrodes based on their electrochemical behavior rather than the device type (batteries vs. ECs). Overall, the electrochemical features of Nb2O5 related electrodes, including the astonishingly fast ion migration and superior stable cycling capability are mainly based on the unique crystal structure. We will therefore emphasize the relationship between the crystal structure and electrochemical characteristics of Nb2O5 and its analogues in the following sections.

2.1 Crystal chemistry of niobium pentoxides

The crystal structure of Nb2O5 is one of the most complex among binary transition metal oxides. The specific phase structure of Nb2O5 varies depending on the annealing temperature, precursors and synthesis procedures. There are 15 polymorphic forms of Nb2O5 that have been reported so far. The most common crystal forms are the pseudo-hexagonal TT phase, the orthorhombic T phase and the monoclinic H phase (from the German Tief–Tief, Tief and Hoch, meaning low–low, low and high) according to the annealing temperature during the synthesis process.46,58 Generally, the structures of polymorphic niobium pentoxides are based on NbO6 octahedra that are more or less distorted. Their unique “room-and-pillar” NbO6 framework structure provides a stable host for Li-ion intercalation.33 TT-Nb2O5, T-Nb2O5, B-Nb2O5 and H-Nb2O5 are the four dominant phases of Nb2O5, which can be synthesized from NbO2 by gradually elevating the oxidation temperature. Fig. 2a provides systematic X-ray diffraction (XRD) patterns of NbO2 revealing the four dominant Nb2O5 polymorphs. The first observed is the TT-Nb2O5 phase that emerges at ∼300 °C. Due to the metastable phase of TT-Nb2O5, the XRD patterns exhibit mixed phases of TT-Nb2O5 and T-Nb2O5 at an annealing temperature range from 450–500 °C. The nearly pure T-Nb2O5 phase is found from ∼550–600 °C. As the annealing temperature is increased, the B-Nb2O5 is observed at ∼700–850 °C, while H-Nb2O5 is detected above 900 °C. Both the capacity and rate performance of the low temperature bronze-phase TT- and T-polymorphs of Nb2O5 possess the inherent properties of the bulk crystal structure. All these structures can be considered as derivatives of the ReO3 parent structure, which is comprised of corner-sharing regular ReO6 octahedra (Fig. 2b).59 Nb2O5 with a metal valence less than +6 cannot form a perfect ReO3-type arrangement so that they adopt an anion-deficient nonstoichiometry.
image file: d0mh01481h-f2.tif
Fig. 2 (a) XRD patterns dominated by NbO2, TT-Nb2O5, T-Nb2O5, B-Nb2O5, and H-Nb2O5, respectively. Reprinted with permission from ref. 33. Copyright 2016, American Chemical Society. (b–g) Crystal structures of ReO3, H, M, B, T and TT-Nb2O5. The arrow indicates that these five Nb2O5 polymorphs were obtained from low to high annealing temperatures.

The H phase is the most thermodynamically stable crystal phase of Nb2O5, which is usually obtained by annealing at temperatures above 900 °C.33,60 Its crystalline structure matches the Joint Committee for Powder Diffraction Standards (JCPDS) reference card no. 37-1468 (JCPDS is now known as the International Centre for Diffraction Data – ICDD). The high-temperature phase H shows a monoclinic crystal structure (Fig. 2c) formed by condensation of the ReO3 parent structure with shear motion and conversion of corner-sharing octahedra to edge-sharing octahedra. Thus, the H phase of Nb2O5 is also called a crystallographic shear phase or a Wadsley–Roth phase.59 Generally, H-Nb2O5 consists of 14 formula units per unit cell with two different size blocks of 3 × 4 and 3 × 5 layers. As shown in Fig. 2c, these two corner-sharing octahedral blocks are connected by edge-sharing with a shift of a half unit cell dimension along the c-axis.58

In addition, Nb2O5 exhibits several medium-temperature phases (650–950 °C) occurring in monoclinic (B, N, R) or tetragonal structures (M, P).61 Distinct from the three different higher temperature phases TT, T, and H, the polymorphs of B, N and R are named according to their particle shapes (from the German Blätter, Nadeln and Prismen, meaning leaves/plates, needles and prisms).46 These polymorphs of Nb2O5 are less studied in the energy storage field, compared to the other temperature phases. Here B and M were chosen as representatives of the medium-temperature phases to give a brief comparison with the TT, T, and H phases in the energy storage field. This information is provided in the next section, while the other medium-temperature phases are omitted from this review. M-Nb2O5 has 6 formula units per unit cell with 4 × 4 blocks of corner sharing octahedra interlinked by edge sharing octahedra to the adjacent blocks,62 whereas B-Nb2O5 contains 4 formula units per unit cell, where blocks of distorted NbO6 octahedra are connected by edge-sharing (each block linked in a zigzag fashion by corner-sharing)46 as illustrated in Fig. 2d and e, respectively.

T-Nb2O5 (JCPDS 30-0873) is the most commonly studied phase among various polymorphs usually obtained at temperatures between 550 and 750 °C. As presented in Fig. 2f, the T phase contains 8.4 formula units per unit cell exhibiting an orthorhombic structure, where distorted octahedral and pentagonal bipyramids are connected by both corner and edge-sharing in the ab-plane and by corner-sharing along the c-axis.46,58 Interestingly, the structure of T-Nb2O5 is similar to tungsten oxide bronze, which was originally observed in NaxWO3 by Wöhler in 1824.59,63 The composition of an intact bronze structure can be expressed as My′M′′zO3(−x) where M′ is an intercalant ion with variable stoichiometry y, while M′′ is a redox-active transition metal cation with fixed stoichiometry z.59 Bronze-like compounds usually possess high electrical conductivity (either metallic or semiconducting), intense color, metallic luster (in crystalline form), chemical inertness and sequences of solid phases.64 A bronze in the absence of intercalant M′, the Mz′′O3(−x) is simply a host structure with M′′ in its highest oxidation state.59 The structural similarity of lithiated T-Nb2O5 with the bronze structure likely explains its conductivity enhancement compared with its original insulating T phase.

TT-Nb2O5 (JCPDS 28-317) can be described as a pseudo-hexagonal or monoclinic crystal structure, but its structural details have not yet been fully refined.46 The TT phase is commonly considered as a less crystalline form of the T phase, caused by oxygen vacancies or impurities, such as OH or Cl.61,65 TT-Nb2O5 and T-Nb2O5 have similar X-ray diffraction (XRD) patterns as shown in Fig. 2a. The main difference is that TT-Nb2O5 produces broad diffraction peaks (20–26°) compared to split peaks for T-Nb2O5. The reason may be attributed to Nb atoms in the T phase being fixed in one of two crystallographically similar sites, while being allowed to occupy the position between these sites in the TT phase crystalline structure.65

The lattice parameters and space groups of the aforementioned five polymorphic phases are summarized in Table 1. The crystal information of other phases together with a deeper understanding of the phase stability and formation energies has been reported and summarized by J. M. Osorio-Guillén and C. Nico with their colleagues.46,61 The chemical and physical properties of niobium pentoxides are closely associated with their crystal structure features. The electrochemical behaviors of these five typical phases of Nb2O5 will be comprehensively analyzed in the next section.

Table 1 Crystallographic parameters of niobium pentoxides
Phase Space group Lattice parameters Ref.
a (Å) b (Å) c (Å) β (°)
H P2/m (No. 10) 21.153 3.8233 19.356 119.80 66
M I4/mmm (No. 139) 20.44 20.44 3.832 90 62
B C2/c (No. 15) 12.740 4.8830 5.5609 105.02 67
T Pbam (No. 55) 6.175 29.175 3.930 90 68
TT P6/mmm (No. 191) 7.191 7.191 3.831 120 69


2.2 Electrochemical features of niobium pentoxides

In 1981, Bard et al. found that Li+ can be reversibly intercalated/de-intercalated into/out of the Nb2O5 crystal structure within a topochemical reaction accompanied by a reversible phase transition.50 The possible reaction on discharge and recharge is shown in eqn (1).
 
Nb2O5 + xLi+ + xe ↔ LixNb2O5(1)

Next, Kumagai and collaborators confirmed this Li+ intercalation reaction. However, they found that the insertion of Li+ into the T-Nb2O5 crystal lattice only resulted in a volume change of crystal domains without a structural phase transition.52,53 Nb2O5 electrodes with different lattice structures give diverse Li-ion intercalation chemistry responses.28,33,54,55,70,71 In general, the theoretical capacity of Nb2O5 is calculated by using eqn (2) based on a two-electron redox reaction:

 
image file: d0mh01481h-t1.tif(2)
where n is the number of electrons involved in the reaction, F is Faraday's constant, Mw is the molecular weight of the active material and 3.6 is a conversion factor between coulombs (C) and the conventional milliampere-hours (mA h). Next, we will focus on the Li-ion storage performance of five Nb2O5 polymorphs (H, B, M, T and TT) with an emphasis on T-Nb2O5, which is one of the most widely studied phases for high-rate Li+ intercalation/de-intercalation.

The H-Nb2O5 electrode displays the highest intercalation capacity of 235 mA h g−1 on its first cycle, which drops quickly during cycling as shown in Fig. 3a. The reason that the H phase gains a higher capacity than its theoretical value is that partial Nb5+ in H-Nb2O5 undergoes a two-electron reduction from Nb5+ to Nb3+.71 In this case, the theoretical capacity of H-Nb2O5 could be increased to 403 mA h g−1. In contrast, B-Nb2O5 stores the lowest capacity of only 20 mA h g−1 on its first discharge, but retains this capacity without diminution over all the entire recorded cycle range. The discharge–charge curves of H-Nb2O5 show three distinct regions with a few potential plateaus (Fig. 3b) and a two-phase equilibrium in the range from x = 0.8 to 1.8 in LixNb2O5.54 The phase transition during the Li+ insertion/extraction process leads to the poor cycling stability of H-Nb2O5.54 As shown in Fig. 3c, the differential capacity plots reveal the (de)lithiation behavior with more detailed information about the faradaic active potential peaks. H-Nb2O5 possesses four pairs of reversible peaks centered at 2.05, 1.67, 1.42, and 1.22 V with a significant amount of charge stored at intermediate potentials between the peaks, while B-Nb2O5 exhibits only one pair of small peaks at 1.68 V with a tiny amount of charge storage capacity. Despite the poor rate performance, H-Nb2O5 has attracted increasing attention due to its high capacity. Recent studies have shown that combining H-Nb2O5 with conductive materials such as a carbon coating layer or a conductive NbO2 phase can remarkably enhance the rate capability and cycling stability.72,73 Interestingly, another medium-temperature phase, M-Nb2O5 has recently been shown to display similar cyclic voltammetric characteristics and high initial capacity at small discharge currents comparable to H-Nb2O5; while its high rate capability and cycling stability outperform those of H-Nb2O5, and are even better than those of T-Nb2O5.74,75


image file: d0mh01481h-f3.tif
Fig. 3 Electrochemical responses of the Nb2O5 polymorphs (H, B, T and TT). (a) Cycling performance tests at either 1C (T, TT) or C/10 (B, H). (b) Galvanostatic discharge/charge profiles obtained at a rate corresponding to C/10. (c) Differential capacity plots derived from the discharge/charge profiles. Reprinted with permission from ref. 33. Copyright 2016, American Chemical Society.

The T and TT-Nb2O5 electrodes gave similar electrochemical responses in their charge/discharge curves (Fig. 3b) due to their structural similarity. Their first cycle capacity produced around 175 mA h g−1, and then they retained a capacity of ∼160 mA h g−1 after 100 cycles. The first cycle loss of ∼15 mA h g−1 can be attributed to the reduction of electrolyte and the SEI layer formation. Both T and TT-Nb2O5 show close-to-linear sloping potential profiles with no obvious plateau. During the long-term (de)lithiation cycles, both of the two active electrodes exhibit great capacity retention without marked capacity degradation.54 There are other studies reporting that TT-Nb2O5 exhibits a bit lower capacity and less stability than that of the T-Nb2O5 phase.70,71 Ganesh et al. studied the origin of the fast pseudocapacitive Li-ion storage behavior of T-Nb2O5 by using theoretical methods.76 They found that the unique structural derived open channels of the layered niobium oxide crystal lattice could lead to a low Li-ion diffusion barrier. The stable and effective ion transport channels could result in unhindered Li-ion solid-state diffusion, along with negligible volume expansion. More theoretical analysis of Li-ion storage and transport will be presented in the next section.

2.2.1 Li-ion storage and transport mechanisms of niobium pentoxides. Computational approaches provide possible solutions to understand the intrinsic mechanism(s) of the charge-storage processes in Nb2O5 electrodes. According to the atomic configuration, the Nb atoms in Nb2O5 are surrounded by either six or seven O atoms, constituting the edge/corner-sharing distorted NbO6 and NbO7 polyhedra.33 The Li ions diffuse along the channels comprised by conventional vacancy hopping between neighboring Li+ sites.78 The simulated migration pathways for Li+ in TT-Nb2O5, T-Nb2O5, and H-Nb2O5 are demonstrated in Fig. 4. Recently, Mai et al.70 systematically studied the Li-ion transport behavior of TT-Nb2O5 and T-Nb2O5 by both experimental and theoretical approaches. They found that TT-Nb2O5 and T-Nb2O5 exhibit similar Li+ transport trajectories. In addition, the Li-ion transport channels of these two Nb2O5 phases are parallel to the a- and b-axes, which lead to quasi-2D diffusion pathways within the ab plane as indicated by a series of DFT calculations. Moreover, the small energy differences among the migration pathways (less than 0.2 eV) lead to efficient Li+ insertion into the layered crystalline structure of TT-Nb2O5 and T-Nb2O5, resulting in smoothly sloping capacity–voltage curves. Grey et al.33 came to similar conclusions through bond valence sum (BVS) mapping of T-Nb2O5. They found that T-Nb2O5 provides a continuous iso-surface (001 plane) for Li+ diffusion within a “room and pillar” framework. The Li+ migration kinetic feature was also verified through semi-grand canonical Monte Carlo simulations, together with a cluster-expansion model, proposed by Lubimtsev et al.76 They obtained an experimentally accessible voltage range of 2.4–1.3 V with a smoothly sloping capacity–voltage profile, indicating no phase transformation and pseudocapacitance behavior during the Li-ion intercalation. On the other hand, H-Nb2O5 displays 3D tortuous pathways for long-range Li+ migration and a large difference and high value of Li+ transport energies, indicating relatively slow Li+ diffusion kinetics and an increased energy barrier for Li-ion intercalation. Thus, it presents a clear voltage platform in the electrochemical galvanostatic charge/discharge curves during the Li ion intercalation/de-intercalation.70 The BVS simulation of H-Nb2O5 revealed that there were large spaces in it for Li+ to reside in, but breaks in the iso-surface between the 3 × 4 and 3 × 5 layers, providing a possible explanation for the high capacity but poor rate performance of H-Nb2O5.33
image file: d0mh01481h-f4.tif
Fig. 4 Simulated Li+ migration pathways viewed from different lattice planes and their corresponding migration energy profiles of (a) TT-Nb2O5, (b) T-Nb2O5, (c) H-Nb2O5, respectively. Reprinted with permission from ref. 70. Copyright 2019, WILEY-VCH Verlag GmbH & Co. KGaA, Weinheim. Reprinted with permission from ref. 77. Copyright 2017 American Chemical Society.

A detailed model of Li+ storage and transport in T-Nb2O5 is shown in Fig. 4b.77 During intercalation, Li-ions prefer to reside in the loosely packed 4 g layer (formed by ∼40% of oxygen ions located at the 4 g Wyckoff positions of the space group Pbam) rather than the closely packed 4 h layer (formed by the other ∼60% of oxygen ions located at the 4 h Wyckoff positions of the space group Pbam together with niobium ions), because of the least steric effect and minimal repulsion from positively charged Nb atoms. One Li-ion in the 4 g layer can coordinate with two oxygen atoms in alternating 4 h layers accompanied by a reduction of the niobium and the oxidation of Li-ions, forming a stable linear O4h–Li–O4h bridge. During the migration process, each intercalated Li+ can be transported from its original site to four neighboring oxygen bonding sites (sites 1 to 4), through two different pathways according to the bonding structure of the bridged O4h with neighboring NbOx (x = 6 or 7). Li+ migration among the sites that are coordinated with edge-shared O4h ions is defined as Path A, whereas corner-shared O4h structure induced Li+ transport is labeled Path B. As there is little difference in migration barriers between the two pathways, both transport pathways can provide direct and spacious channels for Li+ diffusion without any obvious steric hindrance or repulsion from Nb or O atoms. The sum of these diffusion pathways comprises the quasi-2D network for fast Li-ion transport as mentioned in the previous paragraph.

2.2.2 Electrochemical kinetics of T-Nb2O5. T-Nb2O5 is a typical intrinsic pseudocapacitive material, which allows fast Li ion intercalation in both near-surface and bulk regions accompanied by a faradaic charge-transfer process without crystallographic phase transformation.20,21 The overall capacity (Q) of T-Nb2O5 consists of two parts, including a diffusion-controlled process contributed charge (Qd) and a surface-controlled or capacitive process contributed charge (Qs), as shown in eqn (3):79
 
Q = Qd + Qs = constant(v−1/2) + Qv=∞(3)
where v is the scan rate. Qd is linearly proportional to v−1/2, while the capacitive Qs is independent of the scan rate. A plot of capacity vs. v−1/2 yields a straight line whose y-intercept is Qs or the infinite-sweep rate capacity (v = ∞). As polarization at high scan rates may cause deviations when fitting a straight line, intermediate scan rates are therefore selected to extrapolate the y-intercept.80

The dependence of current i on scan rate v follows a power-law relationship expressed as eqn (4):81

 
i = avb(4)
where a is a constant coefficient and b is a power-law exponent. The b value can be calculated from the slope of the plot of log(i) vs. log(v) from the cathodic and anodic peak currents. The kinetics of the charge-storage process can be qualitatively analyzed according to the b value. A b-value close to 0.5 indicates a diffusion-controlled process, while a b-value of 1 indicates a surface-controlled process, i.e. capacitive charge storage behavior. In accordance with the relationship between i and v, the current response at a fixed potential is contributed to by two parts: surface-controlled and diffusion-controlled charge-storage processes expressed as eqn (5):82,83
 
i = k1v + k2v1/2(5)
where k1 and k2 represent the proportionality constants corresponding to the surface-controlled and diffusion-controlled charge-storage processes, respectively. The values of k1 and k2 can be obtained from the slope and y-intercept by plotting i/(v1/2) vs. v1/2 at a fixed potential with various scan rates (eqn (6)).
 
image file: d0mh01481h-t2.tif(6)

This is a qualitative approach that offers an indication of current fractions only contributed by these two processes. This method is not applicable if other faradaic reactions are involved in the charge storage process.

In 2013, Dunn et al. investigated the electrochemical kinetics of T-Nb2O5 using cyclic voltammetry (CV) curves as shown in Fig. 5.27,28 The current response increased dramatically below 2.2 V vs. Li+/Li, giving broad anodic and cathodic peaks. Accompanied with an increase in scan rates, the peak separation is notably enlarged. The b value was calculated according to the peak currents and scan rates from 0.1 to 500 mV s−1 for both cathodic and anodic peaks. For scan rates ranging from 0.1 to 20 mV s−1, corresponding to charging times of >60 s, the b value approaches 1, indicating that surface control dominates the charge-storage mechanism, and thus fast kinetics. At scan rates higher than 20 mV s−1, the b value starts to decrease, indicating a growing contribution from the diffusion-controlled capacity. Except for the diffusion constraints, an increase in the ohmic contribution (active material resistance, solid–electrolyte interphase resistance) also limits the rate capability.84 A profile of the relationship between capacity and scan rate provides a similar conclusion as obtained from the b value. A plot of Q vs. v−1/2 includes two typical different regions (Fig. 5c). In region 1, where the scan rates are below 20 mV s−1, the capacity is around 130 mA h g−1 (∼65% of the theoretical value based on a one-electron transfer per transition metal with Nb2O5). In this range, the capacity is mostly independent of scan rate so that the solid-state Li+ diffusion is not the rate-limiting step for charge storage. In region 2, where scan rates are above 50 mV s−1, the capacity decreases linearly with v−1/2, which means diffusion control dominates the charge-storage mechanism. The capacitive (or surface-controlled) contributions and diffusion-controlled contributions at different scan rates are presented in Fig. 5d. In conclusion, for charging times longer than 1 min, the electrochemical behavior of T-Nb2O5 is similar to that of EC electrodes, whereas, for the process with charging times shorter than 20 s, solid state ion diffusion becomes the dominate factor limiting rate performance.


image file: d0mh01481h-f5.tif
Fig. 5 Kinetic behavior of T-Nb2O5. (a) Cyclic voltammograms from 5 to 100 mV s−1. (b) b-Value determination from the anodic and cathodic peak currents. (c) Normalized capacity as a function of sweep rate−1/2. Reprinted with permission from ref. 27. Copyright 2013, Macmillan Publishers Limited. (d) Total capacity from capacitive and diffusion contributions at different sweep rates. Reprinted with permission from ref. 28. Copyright 2012, WILEY-VCH Verlag GmbH & Co. KGaA, Weinheim. (e) The Nyquist plots of carbon confined TT-, T- and H-Nb2O5. (f) The GITT curve of carbon confined T-Nb2O5 at a current density of 50 mA g−1 and a time interval of 30 min in the potential range from 1.1 to 3.0 V. Reprinted with permission from ref. 70. Copyright 2019, WILEY-VCH Verlag GmbH & Co. KGaA, Weinheim.

In addition to the cyclic voltammetry technique, step potential electrochemical spectroscopy (SPECS) has also been recently developed to distinguish the surface-controlled and diffusion-controlled storage mechanisms of materials and to determine their corresponding contribution ratios. Forghani and Donne85 compared these two techniques experimentally in an MnO2 pseudocapacitive system, and concluded that both techniques were suitable for characterizing the different charge storage mechanisms over the full range of sweep rates, while SPECS offered more precise information about the kinetic behavior of the electrochemical system especially at high scan rates. Recently, Lin et al. proposed a multiple potential step chronoamperometry (MUSCA) technique, which allows for the reconstruction of cyclic voltammograms with a considerably lower ohmic drop contribution.86 They successfully applied this technique to analyze the electrochemical behavior of pseudocapacitive Ti3C2Tx MXene materials, especially at high scan rates. Therefore, SPECS and MUSCA can be regarded as promising methods to characterize the electrochemical kinetics of Nb-based pseudocapacitive materials in future research.

The diffusion coefficient (D) is a valuable parameter, which implies the rate of ions transferring in the electrode materials. Electrochemical impedance spectroscopy (EIS) and the galvanostatic intermittent titration technique (GITT) are the two most commonly used techniques to study the diffusion kinetics of intercalated ions in Nb2O5 electrodes. Nyquist plots (Fig. 5e) can be obtained from the EIS test by applying a small amplitude signal over a wide range of alternating current (AC) frequencies to the electrochemical cells. The diffusion coefficient of lithium ions in Nb2O5 can be calculated through the following two equations:70

 
image file: d0mh01481h-t3.tif(7)
 
Z′ = RD + RL + σω−1/2(8)
where R is the gas constant, T is the absolute temperature, A is the surface area of the electrode, n is the number of transferred electrons, F is Faraday's constant, C is the concentration of lithium ions and σ is the Warburg factor which can be obtained using eqn (8). The σ value can be calculated from the slope by fitting Z′ and ω−1/2.

GITT, as a chronopotentiometric technique, was proposed by Weppner and Huggins.87 Constant current pulses are applied to the cell for a limited time (τ), each followed by a relaxation process recovering to the steady-state. This procedure is repeated over the entire voltage range of the charge/discharge cycles. The corresponding potential of the cell is then recorded as a function of time, which can provide information to calculate the diffusion coefficient through the following equation:88

 
image file: d0mh01481h-t4.tif(9)
where mB is the mass of active material on the electrode, VM is the molar volume, MB is the molar mass, and A is the electrode area. ΔEs and ΔEτ represent the change of steady-state voltages and total voltage change during the galvanostatic charge pulse deducting the IR-drop, respectively, as shown in Fig. 5f. Mai et al.70 compared the lithium diffusion kinetics of carbon confined TT-, T- and H-Nb2O5 (TT-, T- and H-Nb2O5@C) through both EIS and GITT measurements, and they found that T-Nb2O5@C displayed the fastest diffusion kinetics. The DLi+ of single crystalline T-Nb2O5 nanorods was calculated in the range of 10−9 to 10−8 cm2 s−1,89 which is higher than other fast-charging anodic materials such as Li4Ti5O12, TiO2 and TiNb2O7 (10−12 to 10−15 cm2 s−1).90

2.3 Structural characterization techniques for niobium pentoxides

To better understand the crystal structure and ion intercalation-type of pseudocapacitive charge storage mechanism of Nb2O5 during the charge storage process, various characterization methods have been used to analyze Nb2O5 and their structural evolution. These techniques can be broadly classified into four categories: X-ray techniques, electron microscopy, Raman spectroscopy and nuclear magnetic resonance (NMR) spectroscopy. Moreover, the combination of in situ/operando analysis with these techniques enables the real-time study of the structural and chemical changes of Nb2O5 electrodes during electrochemical reactions. We will briefly introduce these characterization techniques in combination with some specific examples.
2.3.1 X-Ray techniques. When a substance encounters X-rays they are scattered by electrons around the nucleus of atoms in the substance; these X-rays are generated either from laboratory or synchrotron radiation facilities.91 The scattering induced by periodically spaced atoms in a crystalline specimen results in an X-ray diffraction (XRD) pattern, which offers abundant information, such as crystal phase, unit cell size, crystallinity and defect density. Thus, XRD is a powerful technique for resolving the crystal structure of Nb2O5 electrode materials. Grey et al.33 carried out a systematic XRD investigation on four polymorphs of Nb2O5 as shown in Fig. 2. In comparison to lab-based X-rays, synchrotron X-ray radiation provides higher spatial and transient resolution, therefore allowing subtle and instantaneous structural characterization.92 X-Ray absorption spectroscopy (XAS), usually performed at synchrotron radiation facilities, is a widely used technique for investigating the local geometric and electronic structure of metal ions in electrode materials, since it can reveal details of local atomic and electronic structure of detected sample. The absorption spectra feature two main regions, an X-ray absorption near edge structure (XANES) and an extended X-ray absorption fine structure (EXAFS). The former region provides chemical information about oxidation state and coordination symmetry, while the later offers structural information about coordination number and bond distance.92 It is worth noting that in situ X-ray techniques coupled with electrochemical characterization are extremely significant and commonly used methods to capture real-time chemical and structural changes of electrode materials during charge/discharge processes. For example, by carrying out in situ XRD of T-Nb2O5, Simon et al. observed obvious blue shifts of the (001) and (002) diffraction peaks toward lower diffraction angles, indicating an increase in the interplanar distances due to the larger radius of Nb4+ cations compared to Nb5+ cations in combination with Li+ intercalation into the empty sites of the crystalline structure. These results are consistent with the foregoing computational calculations that Li+ cations prefer to reside and be transported within the ab plane.93 Kumagai et al.55 reported on in situ synchrotron radiation XANES and EXAFS measurements of orthorhombic Nb2O5, which revealed that Nb2O5 maintained its crystal lattice with only a small volume change during intercalation, while the Nb oxidation state continuously varied from 5+ to 4+ accompanied by a significant rearrangement of the Nb–O octahedra (Fig. 6a–c).
image file: d0mh01481h-f6.tif
Fig. 6 (a) In situ XRD patterns of LixNb2O5. Reprinted with permission from ref. 93. Copyright 2014, The Electrochemical Society. (b) In situ Nb K-edge EXAFS spectra and (c) XANES spectra of LixNb2O5. Reprinted with permission from ref. 55. Copyright 2006, IOP publishing. (d) Ex situ XPS spectra of the Nb 3d peaks and corresponding voltage profiles of Nb2O5 during electrochemical operation. Reprinted with permission from ref. 94. Copyright 2016, American Chemical Society. (e–h) SEM image, TEM images and selected area electron diffraction (SAED) pattern of T-Nb2O5 nanorods. Reprinted with permission from ref. 95. Copyright 2017, WILEY-VCH Verlag GmbH & Co. KGaA, Weinheim.

X-Ray photoelectron spectroscopy (XPS) is a surface-sensitive spectroscopic technique for analyzing the elemental composition, empirical formula, chemical state and electronic state of electrode materials. By irradiating a sample surface with a beam of X-rays, an XPS spectrum can be recorded through counting emitted electrons over a range of electron kinetic energies from the top 1–10 nm depth of the sample. The energies and intensities of the photoelectron peaks enable the identification and quantification of the elements based on the photoelectric effect. Here, XPS was used to analyze the oxidation state changes of Nb during the charge/discharge process. Yu et al.94 recorded the XPS spectra of Nb atoms at different depths of charge and discharge during the sodium de-/insertion process as shown in Fig. 6d. In the beginning, the Nb 3d3/2 and Nb 3d5/2 peaks were located at 209.8 and 207.1 eV, verifying the formation of Nb2O5. Accompanied by the discharge of the Nb2O5 electrode, the peaks gradually shifted to lower binding energies, implying a change in the valence state of the Nb atoms from 5+ to 4+. After being fully charged to 3.0 V, the Nb2O5 electrode peak positions and intensities recovered, indicating a reversible redox reaction for the Nb5+/Nb4+ couple.

2.3.2 Electron microscopy. Electron microscopy, including scanning electron microscopy (SEM) and transmission electron microscopy (TEM), are typical techniques for acquiring high-resolution images to observe the nanoscale or even atomic-scale structure of electrode materials. As the wavelength of an electron is nearly 100[thin space (1/6-em)]000 times shorter than that of visible light photons, electron microscopes have a much higher resolution than optical microscopes. Liu et al.95 observed the surface morphology and crystal structure of T-Nb2O5 nanorods by using SEM and TEM as shown in Fig. 6e–h. The images indicate that the nanorods are around 100 nm in length and 20 nm in diameter and they exhibit single-crystallinity with interspaces of 0.393 nm (corresponding to the (001) plane) and 0.927 nm (three times the (200) plane). Recently, in situ/operando TEM has become a powerful approach to explore the ionic transport kinetics and phase transformation of electrode materials during the lithiation/de-lithiation process.96,97 For example, Wang et al.98 reported on the real-time tracking of Li+ migration in a fast-charging Li4Ti5O12 anode by using operando electron energy-loss spectroscopy (EELS), which provides a promising method for investigating the fundamental mechanism of energy conversion processes occurring in high-rate electrode materials like Nb2O5.
2.3.3 Raman spectroscopy. Raman spectroscopy is a spectroscopic technique typically used to determine vibrational modes of molecules based on the inelastic scattering of monochromatic light interacting with the specimens.99 The challenge for analyzing a material with complex structures as T-Nb2O5 through Raman spectroscopy is that the vibrational structures are so complex that it is exceedingly difficult to directly associate a single vibrational band with a specific structural change in the material. Therefore, Liu et al.77 employed operando Raman spectroscopy to systematically probe the detailed structural information of a T-Nb2O5 electrode by using a homemade in situ Raman electrochemical cell (Fig. 7a), together with a comprehensive theoretical analysis of the vibrational structures. As shown in Fig. 7b, the Raman spectra at each potential stage can be divided into three groups: a high-wavenumber band group (νHi) ranging from 570 to 770 cm−1, a mid-wavenumber band group (νMid) ranging from 180 to 360 cm−1, and a low wavenumber band group (νLo) ranging from 80 to 160 cm−1. During the discharging process, the evolution of the three band groups can be summarized as follows: an intensity decrease in νHi, a band split of νMid and a blue shift of νLo; while during the reverse process, the three band groups displayed the inverse behavior. To correlate the structural changes of T-Nb2O5 with its Raman spectroscopic evolution, the authors proposed a model depicting the mechanism of Li+ storage, which showed that Li+ ions were located near the loosely packed layers and preferred to form bridging coordination with oxygen in the densely packed layers when inserting/extracting into/from the T-Nb2O5. The dense-loose atomic arrangement of T-Nb2O5 offered a low-hindrance diffusion pathway for fast Li+ transport.
image file: d0mh01481h-f7.tif
Fig. 7 (a) Detailed construction of the operando Raman cell. (b) Operando Raman spectroscopic evolution of the T-Nb2O5 thin-film electrode. Reprinted with permission from ref. 77. Copyright 2017, American Chemical Society. 6,7Li MAS NMR of LixNb2O5. (c and d) 7Li spectra at 9 kHz MAS and 4.7 T and 6Li spectra at 9 kHz MAS and 16.4 T. Reprinted with permission from ref. 33. Copyright 2017, American Chemical Society.
2.3.4 Nuclear magnetic resonance (NMR) spectroscopy. NMR spectroscopy is a powerful approach to probe local chemical environments via the resonant frequencies of spin-active nuclei in a static magnetic field, which are sensitive to interactions with other nuclei, the local electron density, and the electric field gradient at the nucleus. With regard to the energy storage mechanism(s) of Nb2O5, the NMR technique is generally applied to study nuclei such as 6,7Li, 23Na or 39K, to gain insights into electronic, structural changes, and ion diffusion dynamics in Nb2O5 electrodes.100 Grey et al.33 carried out high-resolution magic angle spinning (MAS) 6,7Li solid-state NMR spectroscopy of T-Nb2O5, which indicated that there were two distinct lithium spin resonances, a small initial rigid population at low lithiation levels and a major part located at mobile distribution lithium sites (Fig. 7c and d). The variable-temperature NMR relaxation and exchange measurements revealed an activation barrier for microscopic Li-ion diffusion in a range of 60–100 meV, which illustrates the high ionic mobility and minimal strain for Li-ion intercalation into layered T-Nb2O5. The chemical shifts in temperature-dependent NMR at high Li-ion intercalation content suggest delocalized conduction electrons and clarify its high rate performance from the electronic aspect. In addition to structural information, NMR spectroscopy is capable of measuring ion dynamics across many timescales that match the magnitude of the interactions present. The central transition linewidth, satellite transition linewidth, spin–lattice relaxation time (T1), and spin–spin (T2) relaxation time are all interaction-dependent, sensitive probes of ionic motion indicating the ion dynamics inside the Nb2O5 electrode. For example, Grey et al. performed variable-temperature (VT) 6,7Li MAS NMR and two-dimensional exchange spectroscopy (EXSY) to quantify the Li ion transport in T-Nb2O5.33 Based on the qualitative results obtained from EXSY measurements, the increased off-diagonal intensity indicates that the exchange occurs on a shorter time scale at high Li-ion intercalation concentrations. This further demonstrates the fast Li-ion intercalation kinetics of T-Nb2O5.

3. Niobium based composite electrodes

Although T-Nb2O5 displays a high energy density at high rates in some cases, its poor intrinsic electronic conductivity hinders the achievement of fast charge-transfer reactions with thick electrodes. Moreover, the relatively narrow operating voltage (≤ 2 V) for rechargeable lithium batteries limits the power output and the theoretical capacity to ∼200 mA h g−1 based on a two-electron transfer reaction per Nb2O5, which is not sufficiently high compared with the most commonly used Li-ion anode, graphite (372 mA h g−1).5 In order to extend the energy density of Nb2O5, intensive research efforts have been dedicated to solve the aforementioned problems. One possible solution is introducing chemical dopants to regulate the electronic or ionic conductivity of the active materials. In addition, nanostructuring of Nb2O5 powders could efficiently increase the interfacial surface area between the active materials and electrolytes, as well as shorten the electronic pathways to the current collectors, therefore overcoming the poor conductivity extrinsically. Moreover, adding conductive materials is another way to improve the conductivity of electrodes.

3.1 Niobium based compounds

3.1.1 Niobium–titanium mixed oxides. Introducing TiO2 into Nb2O5 can form solid solutions under high temperature calcinations due to the similar atomic radii of niobium and titanium.42 The TiO2–Nb2O5 family (can be expressed as TiNbxO2+2.5x or Ti2Nb2xO4+5x) not only inherits the intrinsic pseudocapacitive features of T-Nb2O5 (Fig. 8b–e), but also offers a higher theoretical capacity close to 400 mA h g−1 compared to Nb2O5 (202 mA h g−1) or TiO2 (168 mA h g−1).36,39,40 Therefore, the TiO2–Nb2O5 family holds great promise for high rate and enhanced energy density for charge storage.
image file: d0mh01481h-f8.tif
Fig. 8 (a) A temperature vs. composition phase diagram for the TiO2–Nb2O5 system at ambient pressure. Reprinted with permission from ref. 101. Copyright 2017, American Chemical Society. Electrochemical behavior of TiNb2O7: (b) CV curves, (c) plots of log (peak current) as a function of log (sweep rate), (d) CV curve with the detailed pseudocapacitive contribution at 0.05 mV s−1, (e) ratios of pseudocapacitive contributions at different sweep rates.102 Reprinted with permission from ref. 102. Copyright 2017, Elsevier. Structural changes of LixTiNb2O7 during the Li+ insertion–extraction.

The crystal structure and phase equilibrium relationships of various phases in the titania–niobia system were first reported in the 1950s.103,104 At least seven different compounds have been reported in the titania-niobia family so far, including TiNb2O7, Ti2Nb2O9, TiNb6O17, Ti2Nb10O29, TiNb24O62, TiNb38O97 and TiNb52O132.105–111 They are composed of ReO3-like blocks of metal–oxygen octahedra occurring in two forms – orthorhombic or monoclinic. The suggested equilibrium diagram of the TiO2–Nb2O5 system is shown in Fig. 8a.101 TiNb38O97 and TiNb52O132 can be considered as the intergrowth phases of Nb2O5–TiNb24O62 at high temperature, and their detailed crystal structures are difficult to clearly identify.109 The theoretical capacities of TiNb2O7, TiNb6O17, Ti2Nb10O29 and TiNb24O62 are 388, 397, 396 and 401 mA h g−1, respectively.107,111–113 These values are almost double that of Nb2O5, because of three redox reactions (Ti4+/Ti3+, Nb5+/Nb4+, and Nb4+/Nb3+). Dai et al.114 characterized the structural and valence-state changes of TiNb2O7 during Li+ insertion and extraction as shown in Fig. 9. According to the in situ XRD patterns, the discharge process can be divided into three regions. A solid-solution reaction (S1) takes place at the initial discharge stage corresponding to Li0TiNb2O7 to Li1TiNb2O7. A two-phase co-existence region then follows with significant peak broadening. A second solid solution reaction (S2) occurs at the end of the discharging process, which corresponds to the transition from Li1.75TiNb2O7 to Li3.6TiNb2O7. The Li-ion insertion leads to a volume expansion of 7.22% and the lattice parameter “b” in the (010) plane increases by 0.3 Å. XANES characterization revealed that the valence states of Ti4+ and Nb5+ in TiNb2O7 are reduced to Ti3.2+ and Nb3.6+ after lithiation. First principle calculations and variable-temperature NMR measurements have demonstrated that the ReO3-like blocks of octahedra in TiNb2O7 allow facile Li diffusion with low activation barriers of <100 meV at lithium concentrations below one lithium per transition metal.105 Although the activation barriers increased at above one-electron redox capacities, the addition of lithium ions promoted n-type doping of TiNb2O7, which increased the electronic conductivity of the host by about seven orders of magnitude. The GITT test of lithium kinetics showed similar results to that of lithium diffusion in lithium-rich concentrations (>one lithium per transition metal) with a nearly two order of magnitude slower diffusion with lithium-dilute concentrations.


image file: d0mh01481h-f9.tif
Fig. 9 Structural changes of LixTiNb2O7 during the Li+ insertion–extraction. (a) In situ XRD patterns collected during initial discharge and charge processes. (b) The unit cell volume “V” and lattice parameter “b” calculated from “Le Bail fitting” as a function of “x” in LixTiNb2O7. (c) In situ Ti K-edge and Nb K-edge XANES spectra collected during the discharge process. (d) Oxidation state variations of Ti and Nb during the initial discharge estimated from the Ti and Nb XANES edge positions. Reprinted with permission from ref. 105. Copyright 2014, The Royal Society of Chemistry.

Despite the intrinsic pseudocapacitance and high theoretical capacity, the TiO2–Nb2O5 system still suffers from poor conductivity since both Ti4+ and Nb5+ are at their highest oxidation states, therefore the Ti4+ and Nb5+ cannot offer free 3d/4d electrons for electronic conductivity. In order to compensate for this inherent problem, Xia et al. attempted to introduce oxygen deficiency, nitrogen dopants or/and conductive networks into Ti2Nb10O29.115–121 As a result, the Ti2Nb10O29 composites achieved a significantly enhanced electrochemical performance, including improved ionic and electronic conductivity, enlarged Li+ diffusion pathways and better structural stability.

3.1.2 Niobium–tungsten mixed oxides. The Nb2O5–WO3 family is another promising candidate for a high-rate charge storage system because of its open host lattice structure serving as favorable rapid Li+ ion diffusion channels. Particularly, researchers found that micrometer-sized niobium–tungsten oxide-based electrodes could achieve extremely high rates, even up to 100C (Fig. 10). Grey et al.122 reported on two composite niobium tungsten oxides—Nb16W5O55 and Nb18W16O93, which adopt crystallographic shear and bronze-like structures, respectively. They found that the Li+ ion diffusion coefficients in both complexes are greater than 1 × 10⁻¹³ m2 s−1 at room temperature, several orders of magnitude higher than those in typical commercial electrode materials such as Li4+xTi5O12 or LixTiO2 (about 10−16–10−15 m2 s−1). Liu et al.90 synthesized micrometer-sized Nb14W3O44 through a facile and scalable solution-combustion method. The Nb14W3O44 exhibited an open and interconnected tunneling framework, which provides three-dimensional interconnected highways for both ionic and electronic transport. The Nb14W3O44 electrode shows good rate performance (half of the maximum capacity retention at 20C) and electrochemical reversibility (98.1% capacity retention after 200 cycles at 0.5C).
image file: d0mh01481h-f10.tif
Fig. 10 (a) Crystal structure, particle morphology and galvanostatic discharge and charge curves and dQ/dV plots (Q, capacity; V, voltage) of Nb16W5O55 (a–d) and Nb18W16O93 (e–h). Reprinted with permission from ref. 122. Copyright 2018, Nature.
3.1.3 Other niobium based compounds. Besides the two above-mentioned solid-solution families, some other mixed metal Nb2O5 materials have emerged for Li+ ion storage in recent years. Zhao et al.123 synthesized AlNb11O29 particles and nanowires via solid-state reactions and solvothermal methods, respectively. In situ XRD was used to systematically study the Li+ intercalation mechanism in AlNb11O29 and revealed its high structural stability after cycling. In order to improve the electronic and ionic transport efficiency, Guo et al.124 prepared highly conductive Cr0.5Nb24.5O62 nanowire electrodes by an electrospinning technique, which exhibited an increased electrical conductivity of ∼3.6 × 10⁻² S cm−1, owing to the effects of the unpaired 3d electrons in the Cr3+ ions. Moreover, the novel Mg2Nb34O87 structure can also be regarded as a potential anode material for Li+ ion storage.125 It exhibited a Wadsley–Roth shear structure built by 3 × 4 × ∞ ReO3-type blocks. The theoretical capacity of this compound can reach as high as 396 mA h g−1. Simultaneously, due to the larger ionic radius of Mg2+ (0.72 Å) than those of other ions like Ti4+ (0.605 Å) and Cr3+ (0.615 Å), Mg2Nb34O87 showed an extended unit-cell volume, which implies broadened pathways for Li ion migration.

3.2 Niobium hybrid electrodes

It is widely accepted that the inherently poor electrical conductivity of Nb2O5 limits its electrochemical energy storage applications for high-rate capability and cycling lifespan. To conquer this obstacle, carbonaceous materials such as carbon nanotubes (CNTs), graphene, carbon nanosheets and so on, are regarded as ideal conductive additives for improving the electronic conductivity of these electrodes to achieve favorable electrochemical performances. Generally, the possible superiorities of carbonaceous materials can be summarized as follows: (1) increasing the electronic conductivity; (2) diminishing the charge transfer resistance; (3) mitigating volume changes during cycling; (4) preventing structural pulverization; and (5) inhibiting mutual aggregation.
3.2.1 Nb2O5/CNTs composites. Nano-sized carbon coatings can be considered as an effective strategy to remedy the poor conductivity of Nb2O5.126 Owing to their inherently high electrical conductivity and good chemical stability, CNTs often serve as effective electron carriers to improve the electrochemical performance of electrode materials. Han et al.127 utilized a one-pot solvothermal method to coat CNTs with a layer of amorphous Nb2O5 (CNT@A-Nb2O5), followed by annealing at 700 °C for 3 h to crystallize Nb2O5, leading to a CNT@T-Nb2O5 sponge as demonstrated in Fig. 11a. Compared to a pure CNT sponge, the CNT@A-Nb2O5 and CNT@T-Nb2O5 sponges exhibited shape change and volume shrinkage after the solvothermal process (Fig. 11b). SEM images show that the T-Nb2O5 coats onto the CNT skeleton discontinuously (Fig. 11c and d) because the uniform layer of amorphous Nb2O5 breaks down during the annealing process. The synthesized CNT@T-Nb2O5 electrode exhibits excellent cycling stability for Li+ ion storage. A reversible capacity of 230 mA h g−1 at the 100th cycle can be delivered, which is much higher than that of pure T-Nb2O5 (50 mA h g−1). Specifically, the discharge capacity decreases from 162 to 133 mA h g−1 at 1000 mA g−1 after 1000 cycles with a capacity retention of 82%. Furthermore, the electrochemical impedance spectroscopy (EIS) measurements of the three electrodes (Fig. 11g) clearly indicate that the charge transfer resistance of the CNT@A-Nb2O5 (130 Ω) and CNT@T-Nb2O5 (95 Ω) sponges are much smaller than that of the pure Nb2O5 electrode (220 Ω), owing to the presence of a highly conductive CNT framework within the sponge. Similar to CNTs, CNFs are also considered as novel carbon matrices. For example, Yang's group applied T-Nb2O5/CNFs as an insertion-type electrode by electrospinning, which exhibited favorable rate performance and cycling performance with a coulombic efficiency of approximately 100% after 5000 cycles.128
image file: d0mh01481h-f11.tif
Fig. 11 (a) Schematic illustration of the fabrication of CNT@T-Nb2O5 sponge by a solvothermal process. (b) Photos of the pure CNT sponge, CNT@A-Nb2O5 sponge, and CNT@T-Nb2O5 sponge. A SEM image of (c) a CNT@T-Nb2O5 sponge, and (d) an enlarged view of a CNT@T-Nb2O5 sponge. (e) Specific capacity of T-Nb2O5, CNT@A-Nb2O5 sponge and CNT@T-Nb2O5 sponge at 50 mA g−1, respectively. (f) Specific capacity of CNT@T-Nb2O5 sponge over 1000 cycles. (g) EIS plots of the T-Nb2O5, CNT@A-Nb2O5 sponge, and CNT@T-Nb2O5 sponge, respectively. Reprinted with permission from ref. 127. Copyright 2017, Elsevier.
3.2.2 Nb2O5/graphene composites. The strategy to combine Nb2O5 with graphene not only improves the contacts between the electrode material and the electrolyte, but also provides favorable pathways for electron transport. Li's group prepared a sandwich-like G@m-Nb2O5 with a single layer of graphene caught between two layers of mesoporous Nb2O5.130 This G@m-Nb2O5 electrode exhibits more advantageous charge storage capability and higher specific capacity with excellent cycling stability than pure m-Nb2O5 and commercial Nb2O5 electrodes. Nanostructure-based electrodes show extraordinary promise for electrochemical energy storage. However, the nanosize particles are usually limited to low mass loadings (∼1.0 mg cm−1) because of the increasing ion diffusion limitations in thick electrodes. Duan et al.129 reported the design of a 3D holey graphene framework/T-Nb2O5 (T-Nb2O5/HGF) composite for ultra high-rate Li ion storage at practical levels of mass loading (>10 mg cm−1). As shown in Fig. 12, it is obvious that a high loading electrode can dramatically change the galvanostatic charge–discharge characteristics of Nb2O5/G. The voltage-capacity curves exhibit an increasingly steeper slope and larger voltage drop with increasing mass loading. This response can be ascribed to an increasingly larger internal resistance that in turn leads to higher overpotentials and lower capacities. As for the optimized Nb2O5/HGF-2.0 electrode, it exhibits a relatively small voltage drop and capacity loss, with increasing mass loading (Fig. 12c). A capacity of 139 mA h g−1 was maintained even with a loading of 11 mg cm−2 at 10C. This phenomenon indicates that the HGF architecture offers a much lower internal resistance, resulting in much less capacity degradation induced by mass loading at rates from 1–100C.
image file: d0mh01481h-f12.tif
Fig. 12 (a) Illustration of the two-step synthetic procedure to prepare a 3D T-Nb2O5/HGF composite. Galvanostatic charge–discharge curves of (b) the Nb2O5/G electrode, and (c) the Nb2O5/HGF-2.0 electrode at 10.0C for mass loadings of 1, 6, and 11 mg cm−2, respectively. (d) Comparison of the rate performance between 1.0C and 100.0C for Nb2O5/HGF-2.0 and Nb2O5/G electrodes under different mass loadings. Reprinted with permission from ref. 129. Copyright 2017, Science.
3.2.3 Nb2O5/Other nanostructured carbon composites. Coating a carbon layer on the Nb2O5 surface could be an efficient method not only to improve the electronic conductivity, but also to maintain the crystalline structure of the metal oxide during ion insertion/extraction processes. Lee et al. proposed a facile one-pot synthesis method using a water-in-oil microemulsion system to fabricate a range of Nb2O5@carbon core–shell composites and explored their charge storage capability as anode materials.131–134 The synthetic procedures for making Nb2O5@carbon core–shell composites are shown in Fig. 13. A niobium precursor wrapped by surfactants in domains of oil, was reacted with an aqueous catalyst solution in a pool of water, forming the microemulsion system.132 The as-prepared Nb2O5@carbon core–shell nanocrystals showed uniform size and anti-agglomerating ability. The T-Nb2O5@carbon anode exhibited a reversible capacity of ∼180 mA h g−1 at 0.05 A g−1 and excellent rate performance (∼90 mA h g−1 at 5 A g−1) within a potential range from 1.1 to 3.0 V (vs. Li+/Li). A hybrid supercapacitor with the T-Nb2O5@carbon as an anode and activated carbon as a cathode exhibited outstanding electrochemical performance (maximum energy and power densities of ∼63 W h kg−1 and ∼16[thin space (1/6-em)]528 W kg−1, respectively). Moreover, Zhang et al.135 reported T-Nb2O5 confined within mesoporous carbon (T-Nb2O5@MC) with hollow core–shell nanostructures by using silica template precursors. The carbon shells with accessible mesopores (∼6 nm) provide high specific surface area and fast Li+ ion diffusion channels, enabling a high-rate property. In addition, Gogotsi et al. constructed a hierarchical T-Nb2O5/carbon/Nb2CTx composite, which took advantage of the fast rate and intrinsic pseudocapacitive responses of T-Nb2O5, the high electronic conductivity and layered 2D structure of the Nb2CTx MXene, and the fast charge transfer pathways provided by the disordered carbon.136
image file: d0mh01481h-f13.tif
Fig. 13 (a) A schematic diagram of the synthesis procedures for the Nb2O5@carbon composites. (b) TEM image of the T-Nb2O5@carbon. (c) CV curves and (d) cycle stability and rate capability of the hybrid supercapacitor with the T-Nb2O5@carbon as an anode and activated carbon as a cathode. Reprinted with permission from ref. 132. Copyright 2015, American Chemical Society.

To improve the electrochemical performance of Nb2O5, recently other forms of nanostructure carbon (such as carbon nanosheets and carbon quantum dots (CQDs)) have also been introduced into Nb2O5 based electrodes. Wang et al. employed graphene-like carbon nanosheets (GCNs) as a support to incorporate T-Nb2O5.137 The GCNs can be easily derived from cellulose-based precursors, reducing the cost relative to pure graphene. A high-performance Li-ion capacitor with T-Nb2O5/GCN as the anode and GCN as the cathode exhibited a remarkable energy density of 129 W h kg−1 and a high power density 32 kW kg−1. As a novel branch of carbon with high surface area, carbon quantum dots (CQDs) can also improve the conductivity of Nb2O5 electrodes, and prevent them from aggregation.138

3.3 Niobium energy storage systems beyond Li-ion

The unevenly distributed and limited lithium resources in the Earth's crust have raised increasing demands for developing battery systems beyond LIBs.37 This concern has accelerated the development of high natural abundance and low cost sodium/potassium-ion batteries (SIBs/KIBs) for large-scale energy storage applications. Compared to LIBs, SIBs/KIBs generally exhibit lower redox potentials, which provides wider operating voltages with higher energy density. However, the larger ionic radii size of Na-ions (1.02 Å) and K-ions (1.38 Å) than Li-ions (0.76 Å) might lead to larger volume expansion and sluggish kinetics during the electrochemical energy storage process.128 Thanks to its chemical stability and intrinsic structural merit, T-Nb2O5 can be considered as a potential anode material for SIBs/KIBs. More importantly, a large interplanar spacing of 3.9 Å for the (001) planes in T-Nb2O5 could accommodate a certain amount of sodium or potassium ions.42 Interestingly, T-Nb2O5 could exhibit a more negative potential range versus Na or K metal than the Li-ion battery system.

An in situ encapsulation strategy was developed to directly grow few-layer graphene over T-Nb2O5 nanowires (Gr–Nb2O5 composites) via a plasma-enhanced chemical vapor deposition (PECVD) method by Sun's group (Fig. 14a and b).37 Unlike the amorphous carbon coatings and rGO wrappings, this PECVD-derived graphene shell displays a highly tunable defect density, giving the inner Nb2O5 nanowires robust electrical conductivity. Additionally, the ample topological defects on the ultrathin graphene enables rapid electrolyte penetration and fast Na+ transport, ensuring rapid pseudocapacitive processes at the interface of Nb2O5 and the electrolyte. As displayed in a Ragone plot (Fig. 14c), the assembled Gr–Nb2O5//active carbon (AC) sodium-ion hybrid supercapacitor (Na-HSCs) device is markedly superior to that of other reported Nb2O5-based Na-HSC systems at both power density and energy density. Furthermore, the as-manufactured Na-HSC device was successfully employed to light a commercial LED indicator under flat and distinctly bent states. In addition, a self-supported 3D porous reticular Nb2O5@carbon (Nb2O5@3D PRS) was successfully synthesized through an electrostatic spray deposition (ESD) process by Yu's group139 (Fig. 14d) for sodium ion storage. The porous reticular structure of Nb2O5@3D PRS carbon hybrid electrode before and after 500 charge/discharge cycles shows no obvious change, revealing a commendable structural stability during the sodium ion insertion/extraction processes. As depicted in Fig. 14e, the sodium ion induced faradaic active reaction was occurred at the potential range of 0.5–1.1 V vs. Na/Na+. The reversible capacity maintained 130 mA h g−1 at a high current rate of 10C even after 7500 cycles (Fig. 14f), which reflects the long-life cycling performance of the Nb2O5@3D PRS electrode.


image file: d0mh01481h-f14.tif
Fig. 14 (a) An in situ encapsulation strategy to directly grow ultrathin graphene shells over T-Nb2O5 nanowires (Gr–Nb2O5 composites) by plasma-enhanced chemical vapor deposition. (b) The SEM image of the Gr–Nb2O5 composites. (c) A Ragone plot based the Gr–Nb2O5 in comparison with results from other state-of-the-art Na-HSCs. Reprinted with permission from ref. 37. Copyright 2018, WILEY-VCH Verlag GmbH & Co. KGaA, Weinheim. (d) Schematic illustration of the electrostatic spray deposition process and (b) ion/electron conduction in the Nb2O5@3D PRS. (e) CV curves for the first four cycles of Nb2O5@3D PRS//Na batteries at a scan rate of 0.1 mV s−1. (f) Long-term performance at 10C. Reprinted with permission from ref. 139. Copyright 2018, Elsevier Ltd.

Apart from carbonaceous materials, the incorporation of non-metal elements including H, S and F into Nb2O5 is also an efficient approach to address the problems of low electrical conductivity and sluggish charge storage kinetics for sodium-ion storage. For example, Yu's group explored the introduction of H and S into Nb2O5, which offers oxygen defects and enhanced electronic conductivity, therefore leading to an improved sodium storage performance.31,140 Simultaneously, Zhao et al. synthesized fluorine-substituted T-Nb2O5 as a host anode material for sodium-ion storage. They found that the incorporation of highly electronegative fluorine atoms into transition metal oxyfluorides changed the electronic structure, narrowed down the bandgap energy and facilitated Na+ diffusion. As a result, the as-prepared orthorhombic niobium oxyfluoride/carbon nanobelt composite exhibited significantly improved electrochemical properties with sodium ion storage capacity as high as 292 mA h g−1 at 0.05 A g−1, along with excellent cycling stability over 10[thin space (1/6-em)]000 cycles at 1 A g−1.141

As for K-ion storage, Tang et al.32 prepared a hierarchical urchin-liked T-Nb2O5 as an anode, and investigated the potassium intercalation/de-intercalation mechanism of intercalation-pseudocapacitive behavior of the T-Nb2O5 (Fig. 15). The favorable long cycling stability was evaluated by a galvanostatic charge/discharge test at 20C for over 1000 cycles (Fig. 15d). Moreover, the crystal structural of the T-Nb2O5 anode can be well maintained after 1000 cycles according to the XRD patterns (Fig. 15e), which also explains its good cycling stability.


image file: d0mh01481h-f15.tif
Fig. 15 (a) SEM image of the T-Nb2O5 nanostructure and (b) a high-resolution TEM image of one isolated T-Nb2O5 nanowire. (c) Schematic illustration of the working mechanism of a KIB based on the T-Nb2O5 anode and EG cathode. (d) Long-term cycling stability of the KIB for 1000 cycles at 20.0C. (e) Ex situ XRD patterns of the T-Nb2O5 anode in the KIB at different cycles. Reprinted with permission from ref. 32. Copyright 2018, The Royal Society of Chemistry.

4. Conclusions and perspectives

In conclusion, Nb2O5 based electrode materials exhibit unique properties of fast charging rate capability that can even be comparable to fast kinetic electrochemical capacitors while maintaining impressive energy density. Theoretical calculations and experimental results indicate that the orthorhombic structure of T-Nb2O5 provides a quasi-2D pathway for fast Li+ diffusion, which generates high-rate capability and good cycling performance even at the micrometer scale. The intrinsic crystalline structural properties endow Nb2O5 based materials with fast electrochemical kinetics and size independence for Li+, Na+ and K+ ion storage. The high potential windows of Nb2O5 based materials in LIBs or Li-capacitors prevent the formation of an SEI layer and inhibit the growth of lithium dendrites, enhancing the operational safety at the expense of energy density. Moreover, low cost aluminum foil can be used as the anode current collector instead of copper foil, since lithium does not form an Al–Li alloy until 0.3 V vs. Li+/Li. Table 2 summarizes the electrochemical performances of recently developed Nb2O5 based materials for Li+, Na+ and K+ ion storage. Despite the aforementioned merits, some challenges need to be addressed for Nb2O5 based electrode materials before they can be applied to commercial energy-storage.
Table 2 Electrochemical performance of Nb2O5-based materials for Li+, Na+ and K+ ion storage
Materials Potential window (V) Capability (mA h g−1) (C-rates) Cycling life Published year
TT-Nb2O5 1.2–3 (V vs. Li+/Li) 165 (1C) ∼100% retention after 100 cycles (1C) 201633
T-Nb2O5 160 (1C) ∼100% retention after 100 cycles (1C)
B-Nb2O5 20 (0.1C) ∼100% retention after 100 cycles (0.1C)
H-Nb2O5 235 (0.1C) 74.5% retention after 100 cycles (0.1C)
Ti2Nb10O29 0.5–2.5 (V vs. Li+/Li) 241 (10C) 89.2% retention after 500 cycles (10C) 2017107
TiNb6O17 0.8–3 (V vs. Li+/Li) 383 (0.1C) 95.6% retention after 100 cycles (5C) 2015111
TiNb24O62 0.8–3 (V vs. Li+/Li) 296 (0.1C) 90% retention after 500 cycles (10C) 2016113
TiNb2O7 1–3 (V vs. Li+/Li) 281 (0.1C) 84% retention after 1000 cycles (5C) 2014114
Nb14W3O44 1–3 (V vs. Li+/Li) 221.3 (0.5C) ∼96.5% retention after 4000 cycles (10C) 202090
AlNb11O29 0.5–3 (V vs. Li+/Li) 266 (0.1C) 96.3% retention after 500 cycles (10C) 2019123
Cr0.5Nb24.5O62 0.5–3 (V vs. Li+/Li) 344 (0.1C) 92.8% retention after 1000 cycles (10C) 2017124
Mg2Nb34O87 0.5–3 (V vs. Li+/Li) 338 (0.1C) 93.1% retention after 500 cycles (10C) 2018125
CNT@T-Nb2O5 1–3 (V vs. Li+/Li) 230 (0.05 A g−1) 82% retention after 1000 cycles (5C) 2017127
3D T-Nb2O5/HGF 1.1–3 (V vs. Li+/Li) ∼190 (1C) 90% retention after 10[thin space (1/6-em)]000 cycles (10C) 2017129
T-Nb2O5@mesoporous carbon 1–3 (V vs. Li+/Li) 113 (1 A g−1) 85% retention after 10[thin space (1/6-em)]000 cycles (0.2 A g−1) 2018135
Nb2O5/CQDs 0.01–3 (V vs. Li+/Li) 395 (0.1 A g−1) ∼100% retention after 600 cycles (0.1 A g−1) 2018138
T-Nb2O5/CNFs 0.01–2.8 (V vs. Na+/Na) 229 (0.1 A g−1) ∼100% retention after 5000 cycles (1 A g−1) 2017128
G@m-Nb2O5 0–2.5 (V vs. Na+/Na) 293 (0.05 A g−1) ∼89% retention after 2000 cycles (2 A g−1) 2018130
Gr–Nb2O5 0–3 (V vs. Na+/Na) 284.5 (0.25C) ∼100% retention after 1000 cycles (20C) 201837
Nb2O5@3D PRS 0.01–3 (V vs. Na+/Na) 302 (0.5C) ∼100% retention after 7500 cycles (10C) 2018139
T-Nb2O5 0–3 (V vs. K+/K) 104 (0.4 A g−1) 86.2% retention after 1000 cycles (20C) 201832


There are still two critical challenges that limit the electrochemical performance of Nb2O5 based electrodes. First, the inherent conductivity of Nb2O5 is far from satisfactory due to its intrinsic wide band gap, which leads to poor electron transport efficiency within the electrode. Combining or coating conductive carbon materials can improve the conductivity of the electrodes extrinsically. Simultaneously, it may result in a certain extent of capacity loss due to the tiny capacity contribution from the carbon additives. Therefore, the strategies of carbon additive decoration should be carefully designed with structure and loading mass optimization. In addition to niobia based carbon composites, chemical doping is another desirable method to regulate the intrinsic conductivity of Nb2O5 by adding free electrons or adjusting the band gap.

The second challenge is the relatively low theoretical capacity and energy density of Nb2O5. The pristine crystalline structure of T-Nb2O5 has limited space for accommodating cations, while H-Nb2O5 offers more sites for cations in spite of its poor rate capability. Thus, optimizing the spatial structure of niobia composites is a very promising way to enhance their capacity. TiO2–Nb2O5 solid-solutions show great promise as electrode materials due to their high theoretical capacity. Exploring other Nb2O5 based solid solutions could be an effective approach to solving the second problem. Nevertheless, extensive efforts are still needed to investigate the structure–property relationships between the crystal structural and the electrical/electrochemical properties.

Furthermore, the redox potential of Nb2O5vs. Li+/Li is relatively high, which significantly limits the working voltage and energy density. Na+ and K+ ions could be considered as attractive alternatives to Li+ ions due to their much lower ion (de-)intercalation potential in Nb2O5, which is able to significantly extend the potential windows (Table 2). However, the large ionic radii of Na+ and K+ cause a series of concerns, including large volume expansion of electrode materials and sluggish kinetics for ion diffusion. In addition, as T-Nb2O5 has a large interplanar spacing of 3.9 Å, it has been suggested through simulations that T-Nb2O5 can accommodate the intercalation of magnesium ions with a low energy barrier. Therefore, T-Nb2O5 could also serve as a promising electrode material candidate for Mg-ion batteries. Overall, based on the unique structural features of fascinating tunnels for fast ion transport, Nb-based oxides and their related alloys and composites are very attractive for next-generation fast charging and long cycling energy storage applications.

Conflicts of interest

There are no conflicts to declare.

Acknowledgements

This project was financially supported by: a start-up research grant for a distinguished professor at Soochow University (Y. S.), the National Natural Science Foundation of China No. 52003188 (Y. S.), the Natural Science Foundation of Jiangsu Province No. BK2020043448 (Y. S.), Open Research Fund for Jiangsu Provincial Key Laboratory for Advanced Carbon Materials and Wearable Energy Technologies (Y. S.), the China Post-doctoral Foundation Grant No. 7131705619 (Z. S.), the National Natural Science Foundation of China Grant No. U1732111, 21676241 and 21978260 (Q. H.) and the Dr Myung Ki Hong Endowed Chair in Materials Innovation at UCLA (R. B. K.).

References

  1. Y. Liang, C. Zhao, H. Yuan, Y. Chen, W. Zhang, J. Huang, D. Yu, Y. Liu, M. Titirici, Y. Chueh, H. Yu and Q. Zhang, InfoMat, 2019, 1, 6–32 CrossRef CAS.
  2. M. Z. Jacobson, M. A. Delucchi, Z. A. F. Bauer, S. C. Goodman, W. E. Chapman, M. A. Cameron, C. Bozonnat, L. Chobadi, H. A. Clonts, P. Enevoldsen, J. R. Erwin, S. N. Fobi, O. K. Goldstrom, E. M. Hennessy, J. Liu, J. Lo, C. B. Meyer, S. B. Morris, K. R. Moy, P. L. O’Neill, I. Petkov, S. Redfern, R. Schucker, M. A. Sontag, J. Wang, E. Weiner and A. S. Yachanin, Joule, 2017, 1, 108–121 CrossRef.
  3. S. Chu and A. Majumdar, Nature, 2012, 488, 294–303 CrossRef CAS.
  4. Z. Yang, J. Zhang, M. C. W. Kintner-meyer, X. Lu, D. Choi and J. P. Lemmon, ECS Meet. Abstr., 2011, 3577–3613 CAS.
  5. M. Li, J. Lu, Z. Chen and K. Amine, Adv. Mater., 2018, 30, 1800561 CrossRef.
  6. C. Delmas, Adv. Energy Mater., 2018, 8, 1–9 Search PubMed.
  7. T. M. Gür, Energy Environ. Sci., 2018, 11, 2696–2767 RSC.
  8. Y. Shao, M. F. El-Kady, J. Sun, Y. Li, Q. Zhang, M. Zhu, H. Wang, B. Dunn and R. B. Kaner, Chem. Rev., 2018, 118, 9233–9280 CrossRef CAS.
  9. P. Simon and Y. Gogotsi, Nat. Mater., 2008, 7, 845–854 CrossRef CAS.
  10. L. Borchardt, M. Oschatz and S. Kaskel, Mater. Horiz., 2014, 1, 157–168 RSC.
  11. J. Wang, T. Park, J. W. Yi, B. Ding, J. Henzie, Z. Chang, H. Dou, X. Zhang and Y. Yamauchi, Nanoscale Horiz., 2019, 4, 526–530 RSC.
  12. R. Kötz and M. Carlen, Electrochim. Acta, 2000, 45, 2483–2498 CrossRef.
  13. Y. Wang, Y. Song and Y. Xia, Chem. Soc. Rev., 2016, 45, 5925–5950 RSC.
  14. G. Wang, L. Zhang and J. Zhang, Chem. Soc. Rev., 2012, 41, 797–828 RSC.
  15. Z. Lin, E. Goikolea, A. Balducci, K. Naoi, P. L. Taberna, M. Salanne, G. Yushin and P. Simon, Mater. Today, 2018, 21, 419–436 CrossRef CAS.
  16. Y. Gogotsi and R. M. Penner, ACS Nano, 2018, 12, 2081–2083 CrossRef CAS.
  17. B. E. Conway, Electrochemical Supercapacitors: Scientific Fundamentals and Technological Applications, Kluwer Academic/Plenum Publishers, New York, 1999 Search PubMed.
  18. S. Trasatti and G. Buzzanca, J. Electroanal. Chem., 1971, 29, A1–A5 CrossRef.
  19. B. E. Conway, J. Electrochem. Soc., 1991, 138, 1539 CrossRef CAS.
  20. V. Augustyn, P. Simon and B. Dunn, Energy Environ. Sci., 2014, 7, 1597–1614 RSC.
  21. C. Choi, D. S. Ashby, D. M. Butts, R. H. DeBlock, Q. Wei, J. Lau and B. Dunn, Nat. Rev. Mater., 2020, 5, 5–19 CrossRef.
  22. B. E. Conway, V. Birss and J. Wojtowicz, J. Power Sources, 1997, 66, 1–14 CrossRef CAS.
  23. V. Sudha and M. V. Sangaranarayanan, J. Phys. Chem. B, 2002, 106, 2699–2707 CrossRef CAS.
  24. C. C. Hu, K. H. Chang, M. C. Lin and Y. T. Wu, Nano Lett., 2006, 6, 2690–2695 CrossRef CAS.
  25. R. R. Bi, X. L. Wu, F. F. Cao, L. Y. Jiang, Y. G. Guo and L. J. Wan, J. Phys. Chem. C, 2010, 114, 2448–2451 CrossRef CAS.
  26. M. Toupin, T. Brousse and D. Bélanger, Chem. Mater., 2004, 16, 3184–3190 CrossRef CAS.
  27. V. Augustyn, J. Come, M. A. Lowe, J. W. Kim, P. L. Taberna, S. H. Tolbert, H. D. Abruña, P. Simon and B. Dunn, Nat. Mater., 2013, 12, 518–522 CrossRef CAS.
  28. J. W. Kim, V. Augustyn and B. Dunn, Adv. Energy Mater., 2012, 2, 141–148 CrossRef CAS.
  29. J. T. Mefford, W. G. Hardin, S. Dai, K. P. Johnston and K. J. Stevenson, Nat. Mater., 2014, 13, 726–732 CrossRef CAS.
  30. H. S. Kim, J. B. Cook, H. Lin, J. S. Ko, S. H. Tolbert, V. Ozolins and B. Dunn, Nat. Mater., 2017, 16, 454–462 CrossRef CAS.
  31. J. Ni, W. Wang, C. Wu, H. Liang, J. Maier, Y. Yu and L. Li, Adv. Mater., 2017, 29, 1605607 CrossRef.
  32. N. Li, F. Zhang and Y. Tang, J. Mater. Chem. A, 2018, 6, 17889–17895 RSC.
  33. K. J. Griffith, A. C. Forse, J. M. Griffin and C. P. Grey, J. Am. Chem. Soc., 2016, 138, 8888–8899 CrossRef CAS.
  34. X. Wang, G. Li, Z. Chen, V. Augustyn, X. Ma, G. Wang, B. Dunn and Y. Lu, Adv. Energy Mater., 2011, 1, 1089–1093 CrossRef CAS.
  35. L. Kong, C. Zhang, S. Zhang, J. Wang, R. Cai, C. Lv, W. Qiao, L. Ling and D. Long, J. Mater. Chem. A, 2014, 2, 17962–17970 RSC.
  36. Q. Deng, Y. Fu, C. Zhu and Y. Yu, Small, 2019, 15, 1804884 CrossRef.
  37. X. Wang, Q. Li, L. Zhang, Z. Hu, L. Yu, T. Jiang, C. Lu, C. Yan, J. Sun and Z. Liu, Adv. Mater., 2018, 30, 1800963 CrossRef.
  38. S. S. Zhang, J. Power Sources, 2006, 161, 1385–1391 CrossRef CAS.
  39. L. Hu, L. Luo, L. Tang, C. Lin, R. Li and Y. Chen, J. Mater. Chem. A, 2018, 6, 9799–9815 RSC.
  40. H. Ren, R. Yu, J. Wang, Q. Jin, M. Yang, D. Mao, D. Kisailus, H. Zhao and D. Wang, Nano Lett., 2014, 14, 6679–6684 CrossRef CAS.
  41. T. Yuan, Z. Tan, C. Ma, J. Yang, Z. F. Ma and S. Zheng, Adv. Energy Mater., 2017, 7, 1601625 CrossRef.
  42. L. Yan, X. Rui, G. Chen, W. Xu, G. Zou and H. Luo, Nanoscale, 2016, 8, 8443–8465 RSC.
  43. X. Zhang, N. Peng, T. Liu, R. Zheng, M. Xia, H. Yu, S. Chen, M. Shui and J. Shu, Nano Energy, 2019, 65, 104049 CrossRef CAS.
  44. J. Liao, W. Ni, C. Wang and J. Ma, Chem. Eng. J., 2020, 391, 123489 CrossRef CAS.
  45. J. Ma, X. Guo, H. Xue, K. Pan, C. Liu and H. Pang, Chem. Eng. J., 2020, 380, 122428 CrossRef CAS.
  46. C. Nico, T. Monteiro and M. P. F. Graça, Prog. Mater. Sci., 2016, 80, 1–37 CrossRef CAS.
  47. M. R. N. Soares, S. Leite, C. Nico, M. Peres, A. J. S. Fernandes, M. P. F. Graça, M. Matos, R. Monteiro, T. Monteiro and F. M. Costa, J. Eur. Ceram. Soc., 2011, 31, 501–506 CrossRef CAS.
  48. D. D. A. B. Filho, D. W. Franco, P. P. A. Filho and O. L. Alves, J. Mater. Sci., 1998, 33, 2607–2616 CrossRef.
  49. R. Brayner and F. Bozon-Verduraz, Phys. Chem. Chem. Phys., 2003, 5, 1457–1466 RSC.
  50. B. Reichman and A. J. Bard, J. Electrochem. Soc., 1981, 6–8 Search PubMed.
  51. R. J. Cava, D. W. Murphy and S. M. Zahurak, J. Electrochem. Soc., 1983, 130, 2345 CrossRef CAS.
  52. N. Kumagai, I. Ishiyama and K. Tanno, J. Power Sources, 1987, 20, 193–198 CrossRef CAS.
  53. N. Kumagai, K. Tanno, T. Nakajima and N. Watanabe, Electrochim. Acta, 1983, 28, 17–22 CrossRef CAS.
  54. N. Kumagai, Y. Koishikawa, S. Komaba and N. Koshiba, J. Electrochem. Soc., 1999, 146, 3203–3210 CrossRef CAS.
  55. R. Kodama, Y. Terada, I. Nakai, S. Komaba and N. Kumagai, J. Electrochem. Soc., 2006, 153, A583 CrossRef CAS.
  56. J. T. Han, Y. H. Huang and J. B. Goodenough, Chem. Mater., 2011, 23, 2027–2029 CrossRef CAS.
  57. J. Y. Cheong, C. Kim, J. W. Jung, K. R. Yoon, S. H. Cho, D. Y. Youn, H. Y. Jang and I. D. Kim, Small, 2017, 13, 1603610 CrossRef.
  58. R. A. Rani, A. S. Zoolfakar, A. P. O’Mullane, M. W. Austin and K. Kalantar-Zadeh, J. Mater. Chem. A, 2014, 2, 15683–15703 RSC.
  59. K. J. Griffith, PhD thesis, University of Cambridge, 2017.
  60. H. Schäfer, R. Gruehn and F. Schulte, Angew. Chem., Int. Ed. Engl., 1966, 5, 40–52 CrossRef.
  61. C. Valencia-Balvín, S. Pérez-Walton, G. M. Dalpian and J. M. Osorio-Guillén, Comput. Mater. Sci., 2014, 81, 133–140 CrossRef.
  62. R. G. W. Mertin and S. Andersson, J. Solid State Chem., 1970, 1, 419–424 CrossRef.
  63. F. Wöhler, Ann. Phys., 1824, 78, 345–358 CrossRef.
  64. P. G. Dickens and M. S. Whittingham, Q. Rev., Chem. Soc., 1968, 22, 30–44 RSC.
  65. E. I. Ko and J. G. Weissman, Catal. Today, 1990, 8, 27–36 CrossRef CAS.
  66. K. Kato, Acta Crystallogr., Sect. B: Struct. Crystallogr. Cryst. Chem., 1976, 32, 764–767 CrossRef.
  67. T. S. Ercit, Mineral. Petrol., 1991, 43, 217–223 CrossRef CAS.
  68. F. Laves, W. Petter and H. Wulf, Naturwissenschaften, 1964, 51, 633–634 CrossRef CAS.
  69. A. Fukumoto and K. Miwa, Phys. Rev. B: Condens. Matter Mater. Phys., 1997, 55, 11155–11160 CrossRef CAS.
  70. J. Meng, Q. He, L. Xu, X. Zhang, F. Liu, X. Wang, Q. Li, X. Xu, G. Zhang, C. Niu, Z. Xiao, Z. Liu, Z. Zhu, Y. Zhao and L. Mai, Adv. Energy Mater., 2019, 9, 1802695 CrossRef.
  71. A. Le Viet, M. V. Reddy, R. Jose, B. V. R. Chowdari and S. Ramakrishna, J. Phys. Chem. C, 2010, 114, 664–671 CrossRef CAS.
  72. Z. Song, H. Li, W. Liu, H. Zhang, J. Yan, Y. Tang, J. Huang, H. Zhang and X. Li, Adv. Mater., 2020, 32, 1–9 Search PubMed.
  73. H. Park, D. Lee and T. Song, J. Power Sources, 2019, 414, 377–382 CrossRef CAS.
  74. Z. Hu, Q. He, Z. Liu, X. Liu, M. Qin, B. Wen, W. Shi, Y. Zhao, Q. Li and L. Mai, Sci. Bull., 2020, 65, 1154–1162 CrossRef CAS.
  75. L. Kong, X. Cao, J. Wang, W. Qiao, L. Ling and D. Long, J. Power Sources, 2016, 309, 42–49 CrossRef CAS.
  76. A. A. Lubimtsev, P. R. C. Kent, B. G. Sumpter and P. Ganesh, J. Mater. Chem. A, 2013, 1, 14951–14956 RSC.
  77. D. Chen, J. H. Wang, T. F. Chou, B. Zhao, M. A. El-Sayed and M. Liu, J. Am. Chem. Soc., 2017, 139, 7071–7081 CrossRef CAS.
  78. J. M. Clark, S. I. Nishimura, A. Yamada and M. S. Islam, Angew. Chem., Int. Ed., 2012, 51, 13149–13153 CrossRef CAS.
  79. S. Ardizzone, G. Fregonara and S. Trasatti, Electrochim. Acta, 1990, 35, 263–267 CrossRef CAS.
  80. D. Baronetto, N. Krstajic and S. Trasatti, Electrochim. Acta, 1994, 39, 2359–2362 CrossRef CAS.
  81. H. Lindstrom, S. Sodergren, A. Solbrand, H. Rensmo, J. Hjelm, A. Hagfeldt and S. Lindquist, J. Phys. Chem. B, 1997, 101, 7717–7722 CrossRef.
  82. T.-C. Liu, W. G. Pell, B. E. Conway and S. L. Roberson, J. Electrochem. Soc., 1998, 145, 1882–1888 CrossRef CAS.
  83. J. Wang, J. Polleux, J. Lim and B. Dunn, J. Phys. Chem. C, 2007, 111, 14925–14931 CrossRef CAS.
  84. M. Park, X. Zhang, M. Chung, G. B. Less and A. M. Sastry, J. Power Sources, 2010, 195, 7904–7929 CrossRef CAS.
  85. M. Forghani and S. W. Donne, J. Electrochem. Soc., 2018, 165, A664–A673 CrossRef CAS.
  86. H. Shao, Z. Lin, K. Xu, P.-L. Taberna and P. Simon, Energy Storage Mater., 2019, 18, 456–461 CrossRef.
  87. W. Weppner and R. A. Huggins, J. Electrochem. Soc., 1977, 124, 1569–1578 CrossRef CAS.
  88. X. H. Rui, N. Yesibolati, S. R. Li, C. C. Yuan and C. H. Chen, Solid State Ionics, 2011, 187, 58–63 CrossRef CAS.
  89. L. Qin, Y. Liu, S. Xu, S. Wang, X. Sun, S. Zhu, L. Hou and C. Yuan, Small Methods, 2020, 2000630 CrossRef.
  90. Y. Yang, H. Zhu, J. Xiao, H. Geng, Y. Zhang, J. Zhao, G. Li, X. L. Wang, C. C. Li and Q. Liu, Adv. Mater., 2020, 32, 1905295 CrossRef CAS.
  91. Y. Waseda, E. Matsubara and K. Shinoda, X-Ray Diffraction Crystallography; Introduction, examples and solved problems, 2011 Search PubMed.
  92. S. Hwang and E. A. Stach, J. Phys. D: Appl. Phys., 2020, 53, 113002 CrossRef CAS.
  93. J. Come, V. Augustyn, J. W. Kim, P. Rozier, P.-L. Taberna, P. Gogotsi, J. W. Long, B. Dunn and P. Simon, J. Electrochem. Soc., 2014, 161, A718–A725 CrossRef CAS.
  94. H. Li, Y. Zhu, S. Dong, L. Shen, Z. Chen, X. Zhang and G. Yu, Chem. Mater., 2016, 28, 5753–5760 CrossRef CAS.
  95. B. Deng, T. Lei, W. Zhu, L. Xiao and J. Liu, Adv. Funct. Mater., 2018, 28, 1704330 CrossRef.
  96. Z. Fan, L. Zhang, D. Baumann, L. Mei, Y. Yao, X. Duan, Y. Shi, J. Huang, Y. Huang and X. Duan, Adv. Mater., 2019, 31, 1900608 CrossRef.
  97. X. Liu and L. Gu, Small Methods, 2018, 2, 1800006 CrossRef.
  98. W. Zhang, D. H. Seo, T. Chen, L. Wu, M. Topsakal, Y. Zhu, D. Lu, G. Ceder and F. Wang, Science, 2020, 367, 1030–1034 CrossRef CAS.
  99. P. P. R. M. L. Harks, F. M. Mulder and P. H. L. Notten, J. Power Sources, 2015, 288, 92–105 CrossRef CAS.
  100. O. Pecher, J. Carretero-Gonzalez, K. J. Griffith and C. P. Grey, Chem. Mater., 2017, 29, 213–242 CrossRef CAS.
  101. K. J. Griffith, A. Senyshyn and C. P. Grey, Inorg. Chem., 2017, 56, 4002–4010 CrossRef CAS.
  102. S. Lou, X. Cheng, Y. Zhao, A. Lushington, J. Gao, Q. Li, P. Zuo, B. Wang, Y. Gao, Y. Ma, C. Du, G. Yin and X. Sun, Nano Energy, 2017, 34, 15–25 CrossRef CAS.
  103. E. A. Durbin, H. E. Wagner and C. G. Harmer, Properties of some columbium oxide-basis ceramics to United States Atomic Energy Commission, Oak Ridge, Tenn., U.S. Atomic Energy Commission, Technical Information Service, 1952 Search PubMed.
  104. R. S. Roth and L. W. Coughanour, J. Res. Natl. Bur. Stand., 1934, 1955(55), 209 Search PubMed.
  105. K. J. Griffith, I. D. Seymour, M. A. Hope, M. M. Butala, L. K. Lamontagne, M. B. Preefer, C. P. Koçer, G. Henkelman, A. J. Morris, M. J. Cliffe, S. E. Dutton and C. P. Grey, J. Am. Chem. Soc., 2019, 141, 16706–16725 CrossRef CAS.
  106. J. F. Colin, V. Pralong, M. Hervieu, V. Caignaert and B. Raveau, Chem. Mater., 2008, 20, 1534–1540 CrossRef CAS.
  107. X. Xia, S. Deng, S. Feng, J. Wu and J. Tu, J. Mater. Chem. A, 2017, 5, 21134–21139 RSC.
  108. R. S. Roth and A. D. Wadsley, Acta Crystallogr., 1965, 18, 724–730 CrossRef CAS.
  109. A. M. Anthony, J. S. Anderson and J. L. Hutchison, J. Solid State Chem., 1977, 21, 233–241 CrossRef CAS.
  110. J. G. Allpress, J. Solid State Chem., 1969, 1, 66–81 CrossRef CAS.
  111. C. Lin, G. Wang, S. Lin, J. Li and L. Lu, Chem. Commun., 2015, 51, 8970–8973 RSC.
  112. K. Tang, X. Mu, P. A. Van Aken, Y. Yu and J. Maier, Adv. Energy Mater., 2013, 3, 49–53 CrossRef CAS.
  113. C. Yang, S. Deng, C. Lin, S. Lin, Y. Chen, J. Li and H. Wu, Nanoscale, 2016, 8, 18792–18799 RSC.
  114. B. Guo, X. Yu, X. G. Sun, M. Chi, Z. A. Qiao, J. Liu, Y. S. Hu, X. Q. Yang, J. B. Goodenough and S. Dai, Energy Environ. Sci., 2014, 7, 2220–2226 RSC.
  115. Y. Tang, S. Deng, S. Shi, L. Wu, G. Wang, G. Pan, S. Lin and X. Xia, Electrochim. Acta, 2020, 332, 135433 CrossRef CAS.
  116. S. Shen, S. Zhang, X. Cao, S. Deng, G. Pan, Q. Liu, X. Wang, X. Xia and J. Tu, Energy Storage Mater., 2020, 25, 695–701 CrossRef.
  117. Z. Yao, X. Xia, S. Zhang, C. Zhou, G. Pan, Q. Xiong, Y. Wang, X. Wang and J. Tu, Energy Storage Mater., 2020, 25, 555–562 CrossRef.
  118. S. Deng, H. Zhu, G. Wang, M. Luo, S. Shen, C. Ai, L. Yang, S. Lin, Q. Zhang, L. Gu, B. Liu, Y. Zhang, Q. Liu, G. Pan, Q. Xiong, X. Wang, X. Xia and J. Tu, Nat. Commun., 2020, 11, 132 CrossRef CAS.
  119. X. Zhang, S. Deng, Y. Zeng, M. Yu, Y. Zhong, X. Xia, Y. Tong and X. Lu, Adv. Funct. Mater., 2018, 28, 1805618 CrossRef.
  120. S. Deng, Y. Zhang, D. Xie, L. Yang, G. Wang, X. S. Zheng, J. Zhu, X. Wang, Y. Yu, G. Pan, X. Xia and J. Tu, Nano Energy, 2019, 58, 355–364 CrossRef CAS.
  121. Z. Yao, X. Xia, Y. Zhang, D. Xie, C. Ai, S. Lin, Y. Wang, S. Deng, S. Shen, X. Wang, Y. Yu and J. Tu, Nano Energy, 2018, 54, 304–312 CrossRef CAS.
  122. K. J. Griffith, K. M. Wiaderek, G. Cibin, L. E. Marbella and C. P. Grey, Nature, 2018, 559, 556–563 CrossRef CAS.
  123. X. Lou, R. Li, X. Zhu, L. Luo, Y. Chen, C. Lin, H. Li and X. S. Zhao, ACS Appl. Mater. Interfaces, 2019, 11, 6089–6096 CrossRef CAS.
  124. C. Yang, S. Yu, C. Lin, F. Lv, S. Wu, Y. Yang, W. Wang, Z. Z. Zhu, J. Li, N. Wang and S. Guo, ACS Nano, 2017, 11, 4217–4224 CrossRef CAS.
  125. X. Zhu, Q. Fu, L. Tang, C. Lin, J. Xu, G. Liang, R. Li, L. Luo and Y. Chen, ACS Appl. Mater. Interfaces, 2018, 10, 23711–23720 CrossRef CAS.
  126. S. Hemmati, G. Li, X. Wang, Y. Ding, Y. Pei, A. Yu and Z. Chen, Nano Energy, 2019, 56, 118–126 CrossRef CAS.
  127. Y. Chen, Y. Wang, M. Yousaf, Z. Ma, M. Zou, A. Cao and R. P. S. Han, Mater. Res. Bull., 2017, 93, 1–8 CrossRef CAS.
  128. L. Yang, Y. E. Zhu, J. Sheng, F. Li, B. Tang, Y. Zhang and Z. Zhou, Small, 2017, 13, 1702588 CrossRef.
  129. H. Sun, L. Mei, J. Liang, Z. Zhao, C. Lee, H. Fei, M. Ding, J. Lau, M. Li, C. Wang, X. Xu, G. Hao, B. Papandrea, I. Shakir, B. Dunn, Y. Huang and X. Duan, Science, 2017, 356, 599–604 CrossRef CAS.
  130. Z. Tong, S. Liu, Y. Zhou, J. Zhao, Y. Wu, Y. Wang and Y. Li, Energy Storage Mater., 2018, 13, 223–232 CrossRef.
  131. H. Kim, E. Lim, C. Jo, G. Yoon, J. Hwang, S. Jeong, J. Lee and K. Kang, Nano Energy, 2015, 16, 62–70 CrossRef CAS.
  132. E. Lim, C. Jo, H. Kim, M. H. Kim, Y. Mun, J. Chun, Y. Ye, J. Hwang, K. S. Ha, K. C. Roh, S. Yoon and J. Lee, ACS Nano, 2015, 9, 7497–7505 CrossRef CAS.
  133. E. Lim, J. Changshin, M. S. Kim, M. H. Kim, J. Chun, H. Kim, J. Park, K. C. Roh, K. Kang, S. Yoon and J. Lee, Adv. Funct. Mater., 2016, 26, 3711–3719 CrossRef CAS.
  134. E. Lim, H. Kim, C. Jo, J. Chun, K. Ku, S. Kim, H. I. Lee, I. S. Nam, S. Yoon, K. Kang and J. Lee, ACS Nano, 2014, 8, 8968–8978 CrossRef CAS.
  135. S. Zhang, J. Wu, J. Wang, W. Qiao, D. Long and L. Ling, J. Power Sources, 2018, 396, 88–94 CrossRef CAS.
  136. C. Zhang, M. Beidaghi, M. Naguib, M. R. Lukatskaya, M. Q. Zhao, B. Dyatkin, K. M. Cook, S. J. Kim, B. Eng, X. Xiao, D. Long, W. Qiao, B. Dunn and Y. Gogotsi, Chem. Mater., 2016, 28, 3937–3943 CrossRef CAS.
  137. D. Li, J. Shi, H. Liu, C. Liu, G. Dong, H. Zhang, Y. Yang, G. Lu and H. Wang, Sustainable Energy Fuels, 2019, 3, 1055–1065 RSC.
  138. J. Lin, Y. Yuan, Q. Su, A. Pan, S. Dinesh, C. Peng, G. Cao and S. Liang, Electrochim. Acta, 2018, 292, 63–71 CrossRef CAS.
  139. H. Yang, R. Xu, Y. Gong, Y. Yao, L. Gu and Y. Yu, Nano Energy, 2018, 48, 448–455 CrossRef CAS.
  140. F. Liu, X. Cheng, R. Xu, Y. Wu, Y. Jiang and Y. Yu, Adv. Funct. Mater., 2018, 28, 1800394 CrossRef.
  141. Y. Wu, X. Fan, Y. Chen, R. R. Gaddam, F. Yu, C. Xiao, C. Lin, Q. Zhao, X. Sun, H. Wang, C. Liu, J. Li and X. S. Zhao, J. Mater. Chem. A, 2019, 7, 20813–20823 RSC.

This journal is © The Royal Society of Chemistry 2021