
 Open Access Article
 This Open Access Article is licensed under a
 Creative Commons Attribution 3.0 Unported Licence
On the estimation of the molecular inaccessible volume and the molecular accessible surface of a ligand in protein–ligand systems†
Konstantinos
Konstantinidis
 a,
Ioannis
Karakasiliotis
a,
Kostas
Anagnostopoulos
b and
Georgios C.
Boulougouris
*c
a,
Ioannis
Karakasiliotis
a,
Kostas
Anagnostopoulos
b and
Georgios C.
Boulougouris
*c
aLaboratory of Biology, Department of Medicine, Democritus University of Thrace, Alexandroupolis, Greece
bLaboratory of Biochemistry, Department of Medicine, Democritus University of Thrace, Alexandroupolis, Greece
cLaboratory of Computational Physical Chemistry, Department of Molecular Biology and Genetics, Democritus University of Thrace, Alexandroupolis, Greece. E-mail: gbouloug@mbg.duth.gr
First published on 12th August 2021
Abstract
In this paper, a novel approach is proposed based on the accurate computation of the inaccessible volume and the corresponding surface area which is defined by the locus of points where a ligand molecule can be placed so that it “touches” a protein molecule at a preset minimum interatomic distance without resulting in overlaps between the atoms of the protein and the atoms of the ligand. The proposed approach can be considered an extension of the widely used concept of the solvent accessible surface area (SASA). The SASA is defined as the surface where a solvent molecule can be in contact with the initial one without any overlaps. This excluded volume interaction is evaluated by treating atoms as hard core spheres, with the limitation of the solvent molecule being represented as a single sphere. In the proposed concepts of the molecular accessible surface (MASA) and the molecular inaccessible volume (MIV) we have practically removed this limitation and all atoms, both in the initial and the “inserted” molecules, are represented as hard spheres. In this paper we focus our examples on biological systems, especially on studying protein–ligand systems, since we expect that this will be one of the most promising fields of applications where the MASA and MIV extensions of the SASA will be of practical and immediate use. Therefore, the MASA and MIV are evaluated based on the surface generated by the ligand while it is being rolled over on all the atoms of the protein without penetrating them. Identification of the inaccessible volume of each candidate protein–ligand pair is also provided in the context of this study, along with the boundary surface where the ligand can be placed so as to be in “contact” with the protein. The proposed concepts of the MASA and MIV are expected to significantly enhance the ability to investigate specific protein–drug interactions by explicitly taking into account the polyatomic nature of a ligand. Several trials have been conducted using the analytical method of Dodd and Theodorou leading to accurate volume and surface area measurements of an arbitrary set of fused spheres in systems of various scales.
Design, System, ApplicationThe concept of the solvent accessible surface (SAS) has been widely used in order to depict the surface that bounds the excluded volume around a biomolecule. Despite the fact that the SAS treats all potential ligand molecules as a single sphere, it is a powerful tool that is widely used especially in the field of drug design, where identification of possible binding sites of a potential ligand to a protein is essential. The proposed extension of the concept to a molecular accessible surface allows the estimation of the surface that is accessible to any polyatomic ligand molecule by estimating the locus of points where the placement of the ligand will result in an overlap with the biomolecule. As in the case of the SAS, we expect that the proposed estimation of the molecular accessible surface will prove to be a powerful tool not only in the fields of drug discovery and drug design, but also in the field of material design. Potential applications of the proposed method are expected to include development of new sampling algorithms that further facilitate: a) identifying potential docking sites, or b) performing accurate estimations of binding affinities via novel free energy schemes. |
Introduction
Contributing to the cell's structure, metabolism, cycle, communication or response to stimuli, molecular interactions lie at the core of all fundamental biological processes. The scientific community has put great effort into investigating such interactions, especially among molecules like proteins, also known as protein–protein interactions (PPIs), or between small molecules (ligands) and proteins, highlighting computational methods besides experimental techniques (e.g. X-ray crystallography, NMR). In the growing field of molecular modeling, molecular (Connolly) and accessible surfaces have spurred the interest of the scientific community over the past few years in order to elucidate molecular interactions and putative drug binding phenomena. Notably, using the keywords “accessible surface area” or “molecular surface area” in Google scholar search yields more than 5.5 million results overall, a number which indicates the large amount of studies and research conducted upon the accessible and molecular surface areas of molecules to date. Similarly, “accessible surface area calculation” and “molecular surface area calculation” are stated in a plethora of publications (over 3 million results in total), which include proposed methods and developed algorithms dealing with several biological problems.In this work, our aim is to extend the notion of the solvent accessible surface area (SASA) by explicitly taking into account the confirmation of potential ligands and thus provide an alternative tool for methodologies, that up to now had to rely on a spherical approximation of the contact molecule in order to estimate the accessible surface around a protein. The concept of the accessible surface area was firstly described by Lee & Richards1 in 1971 as the solvent accessible surface area (SASA). The SASA traces the geometrical locus derived from the centre of a hypothetical probe-sphere rolling on the van der Waals surface of the molecule without penetrating its atoms. It is also equivalent to the van der Waals surface, with the difference that the atomic radii ri have been substituted with the sum of ri + rp (rp is equal to the atomic radius of the hypothetical probe-sphere, typically 1.4 Å). Various approaches have been developed for calculating accessible surface areas, with the “rolling ball” algorithm by Shrake–Rupley2 being one of the earliest and most popular methods among others. Additional improvements to these methods delimited the solvent-excluded surface (SES) or widely known molecular/Connolly surface3,4 which consists of two segments. The first one is the contact surface (part of the van der Waals surface of the atoms), tangent to the hypothetical “rolled-over” probe sphere. The second one is the reentrant surface, which comprises the inward-facing surface of the probe sphere when it is simultaneously tangent to two or more atoms. Analytical calculation of Connolly surfaces is founded upon numerical algorithms retrieving data from the atomic coordinates, van der Waals radii and probe radius, thus generating finite sets of points constructing a network of convex, saddle-shaped and concave faces defined in terms of vertices, circular arcs, spheres and tori so as to compute the solvent-excluded surface.
Apart from the classical Lee–Richards1 and Shrake–Rupley2 approaches, the solvent accessible surface area (SASA) can also be calculated analytically5 using analytical equations plus their first and second derivatives6–8 or by various other approximations.9–12 Additionally, computational tools are able to predict the SASA in the unfolded state of the examined molecules incorporating methods such as the artificial neural network (ANN),13–15 Markov chain model,16 PredAcc17 and PSAIA (protein structure and interaction analyzer).18 In Table 1, a list summarizing some of the available computational tools and online servers that provide SASA calculations based on Lee and Richards' fundamental definition1 is presented.
| Program | Specification | URL |
|---|---|---|
| PoreBlazer19,20 | Fortran implementation for structural characterization of porous materials including calculation of SASA | https://github.com/SarkisovGroup/PoreBlazer |
| Molecularvolume21 | Voxel-based volume calculations for molecular systems via Python interface | https://github.com/ajd98/molecularvolume |
| Jmol22 | Free open source viewer of molecular structures providing SASA and molecular volume calculations | http://jmol.sourceforge.net/ |
| VMD23 | Molecular visualization program for analyzing biomolecular systems including calculation of SASA | https://www.ks.uiuc.edu/Research/vmd/ |
| DSSP24,25 | Database of secondary structure assignments for Protein Data Bank (PDB) entries providing SASA estimation | http://swift.cmbi.ru.nl/gv/dssp/ |
| GETAREA5 | Analytical calculation of SASA, atomic solvation energies and their gradients based on Monte Carlo simulation | http://curie.utmb.edu/getarea.html |
| TRIFORCE10 | Semi-analytical tessellation approach of SASA and derivatives | http://dillgroup.io/ |
| PDBePISA26 | Interactive tool for the exploration of macromolecular interfaces including SASA calculation | https://www.ebi.ac.uk/msd-srv/prot_int/cgi-bin/piserver |
| NACCESS27 | Fortran implementation of the Lee & Richards approximation for SASA calculation of atoms and residues constituting proteins and nucleic acids | http://www.bioinf.manchester.ac.uk/naccess/ |
| FreeSASA28 | Command line tool incorporating C-library and Python module for macromolecular SASA calculation | https://freesasa.github.io/ |
| CCP4-AreaMol29–31 | Supported program of CCP4 for SASA calculation of individual residues and proteins | https://www.ccp4.ac.uk/html/areaimol.html |
| ProtSA32,33 | Web application for sequence-specific SASA calculation in the unfolded state | http://webapps.bifi.es/protSA/ |
Estimations of the SASA, using tools such as the ones described in Table 1, serve as the basis for several computational tools and methods that have been designed to assist in a variety of more complex problems, with the most prominent being that of estimating free energy differences and protein structure-folding prediction,34 or even aid in simulations and design of novel molecular structures by predicting physical and chemical properties of polymers prior to synthesis.35 To a large extent, applications of the SASA contribute to characterizing relationships between the structural and biological properties of chemical compounds via quantitative structure–activity relationship (QSAR) models as well as quantifying molecular lipophilicity (log![[thin space (1/6-em)]](https://www.rsc.org/images/entities/char_2009.gif) P), a highly significant pharmacokinetic factor in medicinal chemistry, essential for drug discovery.36–38 Another important application of the SASA has been visualization, with molecular visualization tools like Jmol,22 VMD23 and PyMOL39 capable of providing visual representations of “cavities” and “pockets”, as potential candidates for binding sites in proteins. Estimation of the SASA can also be used as part of a “docking” strategy, with docking computation being considered a significant approach for studying protein–protein or protein–ligand interactions, guided by several theories behind binding phenomena, such as the “lock-key” model,40 the “induced-fit” theory,41 the “conformational selection” mechanism42 and similar established approaches. Development of structure-based virtual screening and construction of novel therapeutic agents via computer-aided drug design (CADD) have all been achieved by molecular docking software applications.43 Sampling algorithms implemented in docking software programs like DOCK,44 FLOG,45 FlexX,46 Hammerhead,47 SLIDE,48 DIVALI49 or DARWIN50 are intended to predict the structure via conformational ensemble. Scoring algorithms can also predict the binding affinity of the tested biomolecules during their interactions by scoring functions under certain docking methodologies such as GOLD,51 AutoDock,52 LUDI,53 PLP,54–56 DrugScore57 or CScore58 programs. These algorithms rely on a variety of theoretical, chemical and geometrical approaches to visualize molecular structures and processes. Interactions are handled based on the properties of the amino acid residues found on the surface of molecules. Examination of amino acid charge, polarity, shape, potential for intercalation with other molecules, high evolutionary conservation of surface amino acids and estimated energy of molecular interactions constitute the primary elements for the functional interpretation and calculation of molecular surfaces. Molecular surfaces may have dual use; their graphical representations can provide a prediction of the possible functions and interactions which may take place by visualizing the shape, electron distribution or evolutionary conservation of molecular surface sequences. Moreover, quantification of surfaces is mainly used as a descriptor in an attempt to quantify the binding Gibbs free energy.
P), a highly significant pharmacokinetic factor in medicinal chemistry, essential for drug discovery.36–38 Another important application of the SASA has been visualization, with molecular visualization tools like Jmol,22 VMD23 and PyMOL39 capable of providing visual representations of “cavities” and “pockets”, as potential candidates for binding sites in proteins. Estimation of the SASA can also be used as part of a “docking” strategy, with docking computation being considered a significant approach for studying protein–protein or protein–ligand interactions, guided by several theories behind binding phenomena, such as the “lock-key” model,40 the “induced-fit” theory,41 the “conformational selection” mechanism42 and similar established approaches. Development of structure-based virtual screening and construction of novel therapeutic agents via computer-aided drug design (CADD) have all been achieved by molecular docking software applications.43 Sampling algorithms implemented in docking software programs like DOCK,44 FLOG,45 FlexX,46 Hammerhead,47 SLIDE,48 DIVALI49 or DARWIN50 are intended to predict the structure via conformational ensemble. Scoring algorithms can also predict the binding affinity of the tested biomolecules during their interactions by scoring functions under certain docking methodologies such as GOLD,51 AutoDock,52 LUDI,53 PLP,54–56 DrugScore57 or CScore58 programs. These algorithms rely on a variety of theoretical, chemical and geometrical approaches to visualize molecular structures and processes. Interactions are handled based on the properties of the amino acid residues found on the surface of molecules. Examination of amino acid charge, polarity, shape, potential for intercalation with other molecules, high evolutionary conservation of surface amino acids and estimated energy of molecular interactions constitute the primary elements for the functional interpretation and calculation of molecular surfaces. Molecular surfaces may have dual use; their graphical representations can provide a prediction of the possible functions and interactions which may take place by visualizing the shape, electron distribution or evolutionary conservation of molecular surface sequences. Moreover, quantification of surfaces is mainly used as a descriptor in an attempt to quantify the binding Gibbs free energy.
Theoretical basis
Extending the typical approaches for calculating the accessible surface area and volume confined to the use of probe-spheres, this paper proposes a novel approach based on the analytical calculation of the accessible volume area of a hard-sphere poly-atomic molecule. The core idea was originally developed as part of the staged particle deletion (SPD) method,59 in an effort to accurately estimate the free energy of cavity formation and its contribution to the chemical potential of small molecules in molecular simulations. For the case of a monatomic molecule that is modeled as a single hard-sphere into a system composed of atoms (represented also as hard spheres), the excluded volume limns the geometric locus of points where a hypothetical insertion hard-sphere center would cause an overlap with any of the existing hard spheres in the system. More specifically, this geometric locus is a set of fused spheres, whose centers coincide with those of the spheres of the atoms in the system but with radii augmented by the radius of the inserted hard-sphere. Provided that a single sphere is inserted and the system consists of molecules made of atoms modeled as spheres, the accessible volume calculation can formally be mapped to the evaluation of the volume of fused spheres, even when periodic boundary conditions are implemented. This approach works irrespective of the presence of intermolecular connectivity, whereas the computational task is expected to depend mainly on the number of atoms in the system and the actual size of the spheres. Furthermore, the estimation of the accessible volume can become quite demanding computationally as the size of the system increases and the actual accessible volume starts to diminish, including the case of inserting a monatomic molecule. On the other hand, what may not be so straightforward is the ability to estimate the inaccessible and in extension the accessible volume after insertion of an arbitrary polyatomic molecule in a similar way.59 Upon rationalizing the process, a possible solution is to consider the interaction of each sphere in the system with the inserted polyatomic molecule under fixed internal degrees of freedom. It turns out that59 the volume of the loci of points where a trial insertion of the chain molecule will result in an overlap can also be estimated as the volume of a set of fused spheres.As it turns out, the problem of estimating the locus of points where a molecule can be inserted without overlapping is very similar to the estimation of the SASA with the main difference being that in the SASA one has to consider where to insert a single sphere by estimating the surface and the volume of a set of “inflated” fused spheres (one for each atom in the system), whereas when a polyatomic molecule is considered, one has to estimate the surface and not the volume of a set of auxiliary fused spheres like we describe in the next paragraph. Once the set of auxiliary spheres has been created the problem of estimating the surfaces and volumes of fused spheres can be handled by any program that has been developed for the SASA. On the other hand, what is probably one of the most accurate ways of estimating the surface and the volumes of any set of fused spheres is the method of Dodd and Theodorou8 that we have chosen to implement in our calculations.
In this work we propose the extension of the notion of the SASA around a protein molecule to the proposed notions of the molecular accessible surface area (MASA) and the corresponding molecular inaccessible volume (MIV) by explicitly taking into account the polyatomic nature of a ligand molecule that is to be placed in contact with the protein without overlapping. To achieve this, one has to create an “auxiliary” sphere for each intermolecular pair of atoms and define the range of the overlap by setting the minimum intermolecular distance that this pair of atoms can reach without overlapping. This minimum intermolecular distance is then set at the radius of the auxiliary sphere creating a set of fused spheres. The difference with the SASA is that the number of fused spheres is no longer equal to the number of atoms in the protein, but is equal to the product of the number of atoms in the protein and the number of atoms in the ligand, and that the radii of the spheres now depend on a pair of atoms, with one belonging to the protein molecule and one belonging to the ligand molecule. As is described in the following paragraph, the process of creating the necessary set of auxiliary spheres whose surface and volume correspond to the proposed notions of the molecular accessible surface area (MASA) and the corresponding molecular inaccessible volume (MIV) is relatively simple and can be summarized in the following steps as have been used in all calculations reported in this work:
Step 1. Define the minimum intermolecular distance dij between a possible pair of atoms:
For a given pair of protein–ligand configurations (i.e. the set of positions r and types of all atoms) both the MASA and MIV are a function of the minimum interatomic distance dij between the possible pairs, consisting of protein atom i and ligand atom j. In our paper we have chosen to express this minimum interatomic distance dij as a function of the type of atom i, j. By assigning a value for the hard core radius Rα of each atom α based on the types of both protein and ligand molecules, we express dij as the sum of the hard core radii scaled by a common factor fR (i.e. dij = fR × (Ri + Rj)). In all calculations reported in this paper, the hard core radius Rα for each type has been based on the van der Waals radius used in Jmol in order to have a common reference. Future application may require to either extend the set of types or even to define the minimum distance between pairs of atoms dij differently. This can be achieved by changing the values of the radius for the auxiliary spheres and should be reported along with the estimation of the MASA and MIV.
Step 2. Generate the set of auxiliary spheres whose surface and volume are the MASA and MIV:
Given a relative orientation of the two molecules, the positions ri and the type of atom in the system (protein atoms) and the position rj and the type of inserted atom (atoms in the ligand) create an auxiliary sphere at ri − (rj − rref) with radius dij for each pair of atoms i, j, where rref can be chosen as an arbitrary reference point. The operation ri − (rj − rref) practically translates each protein atom i, by a vector −(rj − rref) for each ligand atom j. Although the choice of the reference point can be arbitrarily selected in the local coordinate framework of the ligand, it is preferable to be either the center of the mass of the ligand molecule or the position of one of the atoms in the molecule. Another way of selecting the reference point is by setting the origins for a local coordinate framework of the ligand configuration. In the protein coordinate framework, the proposed molecular accessible surface is defined as the locus of points where, placing this referee point and positioning all ligand atoms relative to the point, the ligand will touch without overlapping the protein. In this work we have chosen as a reference position rref, the position of the first atom in the ligand (highlighted in Fig. 1) and as a consequence, the surface of auxiliary spheres corresponds to the locus of points for which the placement of the first atom of the ligand will guarantee that all possible distances between any pair of protein (i) and ligand (j) atoms will be bigger or equal to dij, with at least one distance being exactly equal. Finally, different relative orientations can be examined via rigid rotation of either the protein or the ligand model before the creation of the auxiliary spheres.
 | ||
| Fig. 1 (a) Graphical representation of the molecular accessible surface volume methodology in Jmol. An illustration of the test system consisting of two molecules, an ethane60 representing the protein molecule of the system and a methane61 displaying the inserted ligand molecule distinguished by its cyan haloed atoms. (b) The generated pink auxiliary spheres surrounded by their created 3D isosurface. (c) An illustration of the excluded volume around the ethane molecule of the test system, where the generated gray surface points coincide with the center of the first atom (yellow highlighted sphere) of the inserted methane ligand in opaque color and cyan halos. Two additional ligand molecules colored semi-transparently while maintaining all the same orientations are positioned according to their first atom also highlighted in yellow at the minimum interatomic distance. | ||
Step 3. Evaluate the surface and the volume of the set of fused auxiliary spheres:
The molecular inaccessible volume i.e. the volume of the locus of points where the ligand cannot be placed due to the presence of the protein can be evaluated from the set of auxiliary spheres defined in steps 1 and 2 using any algorithm capable of estimating the volume of fused spheres. Similarly, the molecular accessible surface can then be estimated using any algorithm capable of estimating the surface of fused spheres. Although we strongly recommend the use of the Dodd and Theodorou approach in estimating both the surfaces and volumes, we also provide as part of the ESI† scripts that can utilize the available “approximate” tools in Jmol and VMD for the cases that accuracy is not essential. Following the proposed steps, the problem of estimating the molecular inaccessible volume (MIV) and accessible surface area (MASA) is now being expressed as a problem of evaluating the volume and surface of a set of fused spheres similar to that of the SASA with the main difference being in the number of fused spheres that one has to consider, which is now equal to the number of atoms in the system, times the number of atoms of the inserted molecule.
In Fig. 1, a graphical representation of the basic concept is depicted, referring to a simple molecular system of ethane60 and methane,61 with the former acting as the protein molecule of the system and the latter as the inserted ligand molecule. The developed method is founded upon creating multiple images of the inserted atoms by maintaining the internal degrees of freedom and relative orientation. The algorithm generates 40 (40 = 8 “protein” atoms × 5 “ligand” atoms) auxiliary spheres (32 of them depicted in pink plus the remaining 8 which are placed at the same position as the protein molecule in the system). The gray 3D surface created by the 40 auxiliary spheres delineates the geometrical locus where the center of the first atom, as ordered in the inserted molecule (here the hydrogen atom as a yellow highlighted sphere), can be placed so that the two molecules of the system can be in “touch”. Additionally, placing the center of the first atom of the inserted methane molecule (translucent methane molecules with cyan halos) in different positions on the generated gray 3D surface surrounding the auxiliary atoms brings the hypothetical ligand and protein molecules in contact without overlap. According to step 1, the annotated distances are equal to the sum of the corresponding atomic radii multiplied by the algorithm's scaling factor fR (here adjusted at 1.0). This scaling factor is used to describe the excluded volume interactions of the closest atoms between the inserted and native molecule of the system. In this example, hydrogen–carbon and carbon–carbon atoms are found in the minimum interatomic distance and those distances are equal to the sum of Rhydrogen (= 1.2 Å) + Rcarbon (= 1.95 Å) and Rcarbon (= 1.95 Å) + Rcarbon (= 1.95 Å) atomic radii times the scaling factor fR (= 1.0), respectively. Notably, the connectivity between the inserted atoms does not add significant complication at this computational stage. This allows the insertion of two or more molecules simultaneously, as long as the relative position between atoms is maintained during the geometrical calculation and the relative intermolecular degrees of freedom are sampled in an outer loop. Furthermore regarding the SASA, the proposed method is expected to be used in ensembles, where the system configurations are created based on desirable statistical ensembles. Similarly, the internal degrees of freedom of the ligand could be sampled by simulating the inserted molecule under ideal gas conditions. The geometrical calculation would then be performed over a double nested loop over the configurations of the ligand and the system ensembles.
In most calculations reported in this work, the relative protein–ligand orientation has been kept to its original value based on the pdb configuration file downloaded from the web. In the cases that we examine the effect of the relative orientation in our calculations, we have performed random rigid body relations using quaternions. More precisely, the generation of random molecular orientations has been based on the Marsaglia G. method,62 implemented as follows:
- First, two numbers x1 and y1 are selected from a random uniform distribution between (−1, 1), until s1 = x12 + y12 < 1 is satisfied.
- Similarly, two more numbers x2 and y2 are selected respectively from a random uniform distribution between (−1, 1), until s2 = x22 + y22 < 1 is satisfied.
- The generated values of s1 and s2 are used for the production of a random unit quaternion q as 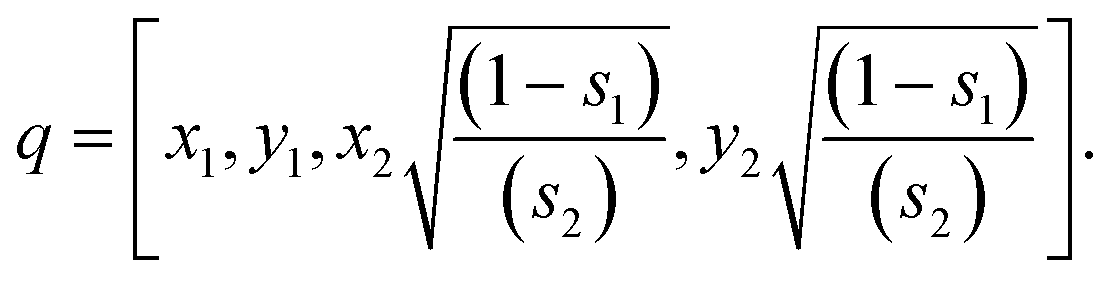
With the previous steps, a set of unitary quaternions is generated. By applying rigid rotations to the ligand molecules using these unitary quaternions, a set of protein–ligand relative orientations is created.
From a technical perspective, the greatest challenge and major concern in developing a computational tool capable of estimating the molecular inaccessible volume and molecular accessible area in protein–ligand systems has been the memory usage due to the large size of the resulting system. In order to be able to use Dodd and Theodorou's analytical approach8 as a black-box library, the distribution of the computational load using message passage interface (MPI)63 over a number of processors was compulsory. This was to ascertain the efficient handling of the memory load. As a result, the user can perform analytical calculations of the molecular inaccessible volume and molecular accessible area in realistic protein–ligand systems using reasonable computational resources.
Results and discussion
In order to assess the proposed method, several tests were performed on different systems of varying size. Ligand and protein molecules constituting the main focus systems were mainly downloaded from the Protein Data Bank (PDB)64 in .pdb format except for simpler molecules like monatomic hydrogen,65 diatomic hydrogen,66 water,67 methane,61 ethane60 and caffeine68 molecules which were retrieved from Github69 in .xyz format. PDB files with bound molecules underwent conversion so as to separate the ligand and protein components into different .xyz files for more efficient and convenient file manipulation. All molecules and their generated volume area surfaces were visualized by Jmol.22 Initial tests of the algorithm were performed between simple molecules like monoatomic hydrogen and diatomic hydrogen following progression to more complex molecular systems downloaded from PDB and analyzed. More specifically, the 1zp8,702bpw71 and 4wtg72 PDB files were selected as representatives of small-, medium- and large-size scale molecular systems, respectively. 1zp8 and 2bpw PDB entries refer to HIV-1 protease-inhibitor complexes. Former 1zp8 demonstrates an effective replacement of a peptide group in HIV-1 protease inhibitors with 1,2,3-triazole.732bpw demonstrates the ability to replace a putative inhibitor bound to the HIV-1 protease in single crystals.74 The third PDB entry (4wtg) includes a modified version of the hepatitis C virus (HCV) RNA-dependent RNA polymerase (RdRp) in complex with the clinically active metabolite formed by sofosbuvir, Mn2+ and a primer-template RNA.75Most of the calculations reported in this work have been based on PDB files that contain both ligand and protein molecules and are available via Protein Data Bank. Given such a PDB file, we proceed by first parsing the PDB file in order to acquire the protein and ligand molecule configurations from PDB along with the type of each atom. Based on whether we want to examine the MASA and MIV at a relative orientation different from the original PDB file (as we do in Fig. 2), we choose whether we are going to perform a random rigid rotation of the ligand molecule. Having assigned an atomic radius to each type of atom of both the ligand and protein molecules, and the atomic position at the desired relative orientation, we perform calculations for the MASA and MIV. In all calculations used in this work for the validation of our code, we used as default for the hard core radius in each atom Ri the values of van der Waals radii defined for each atom type in Jmol (version 14.6.1), which can be retrieved by executing the command “show vdw” and defined by typing “set defaultVDW Jmol” on a Jmol console. In order to investigate the effect of the hard core radius length in sum calculations, we performed uniform scaling in all hard core radii using a common scaling factor fR (see Fig. 6). Depending on the practical application, the potential user of our computational tool may choose to alter the assignment of each atomic radius, taking into consideration the difference between ions and uncharged atoms for instance. Nevertheless, in this study, given that the main concern is to provide validation of our approach, the simplest reproducible cases were selected while the option of changing the values of atomic radii was deferred for future version purposes. Due to this reason, no further processes were performed on protein molecules extracted from the downloaded PDB files, like restoring missing atoms or imposing the suitable protonated state under a given pH.
 | ||
| Fig. 2 Analytical calculation of the ligand–protein molecular accessible surface area (a) and molecular inaccessible volume (b) of the HIV-1 protease and AB-2 inhibitor complex retrieved from the 1zp8 PDB entry,70 at different orientations relative to the ligand–protein orientation of the original PDB file configuration (marked as original orientation). In both charts, the original input molecular configuration is shown at x = 0, followed by 50 random ligand–protein orientations sampled by Marsaglia's method.62 The estimations are plotted as a function of the quaternion distance (in radians) between each orientation and the relative ligand–protein orientation of the original PDB molecular configuration. The labeled data points A, B, C and D help the reader compare the plotted information against the corresponding modelled structures shown in Fig. 4. | ||
Despite the development of this computational tool taking advantage of the analytical calculation of Dodd and Theodorou8 to a large extent, the proposed calculations of the molecular accessible surface and molecular inaccessible volume can also be carried out by making use of any other computational tool capable of calculating the SASA. To achieve this, one has to generate the set of auxiliary spheres in the same way as described in the previous paragraph (Fig. 1) and then perform the calculations with the tool of choice. In the context of this research, visual representation was accomplished by using Jmol and its ability to draw 3D isosurfaces. It should be noted that visual rendering of the aforementioned isosurfaces is an arduous computational task, with memory requirements increasing significantly as the size of the molecular systems grows. Nevertheless, most of the available visualization tools output significantly less accurate results when compared to the analytical estimation of Dodd and Theodorou.8 However, due to graphical representation necessities in many studies, the best strategy is to combine both approaches. Subsequently throughout this work, we report our estimations using the analytical method of Dodd and Theodorou8 whereas Jmol is used for visualization purposes. Finally, in order to provide better insight into molecular accessible surfaces, ligand placement on a point of the protein surface is also presented, highlighting the contact between the test molecules given the selected relative ligand–protein orientation.
In Fig. 2, the estimations of the molecular accessible surface area (Fig. 2a) and molecular inaccessible volume (Fig. 2b) are presented for various ligand–protein orientations of the 1zp8 test system (HIV-1 protease with its AB-2 inhibitor73). Relative orientations were randomly produced via quaternion formulation of Marsaglia62 on the ligand–protein pair found in the 1zp8 PDB file downloaded from the Protein Data Bank. The estimated values of the molecular accessible surface area (Fig. 2a) and molecular inaccessible volume (Fig. 2b) are plotted versus the quaternion distance. The baseline against which the quaternion distance was calculated is the ligand–protein orientation of the original input 1zp8 PDB file configuration. Since plotting against the quaternion distance constitutes projection onto one-dimensional space, the reader should bear in mind that only distance relevant to the original orientation retains the properties of distance, meaning that any of the expressed orientations depicted as triangles or star points in close proximity in Fig. 2 may actually be far apart. Nonetheless, the above representation style was selected since the deviation of 50 sampled ligand orientations relative to the original one found in the 1zp8 PDB file is better illustrated. Similarly for the 1zp8 test system, an additional 1000 sampled ligand orientations relative to the original one found in the 1zp8 PDB file were generated and the analytical area and volume calculated values of each ligand–protein sampled orientation were plotted as in Fig. 3.
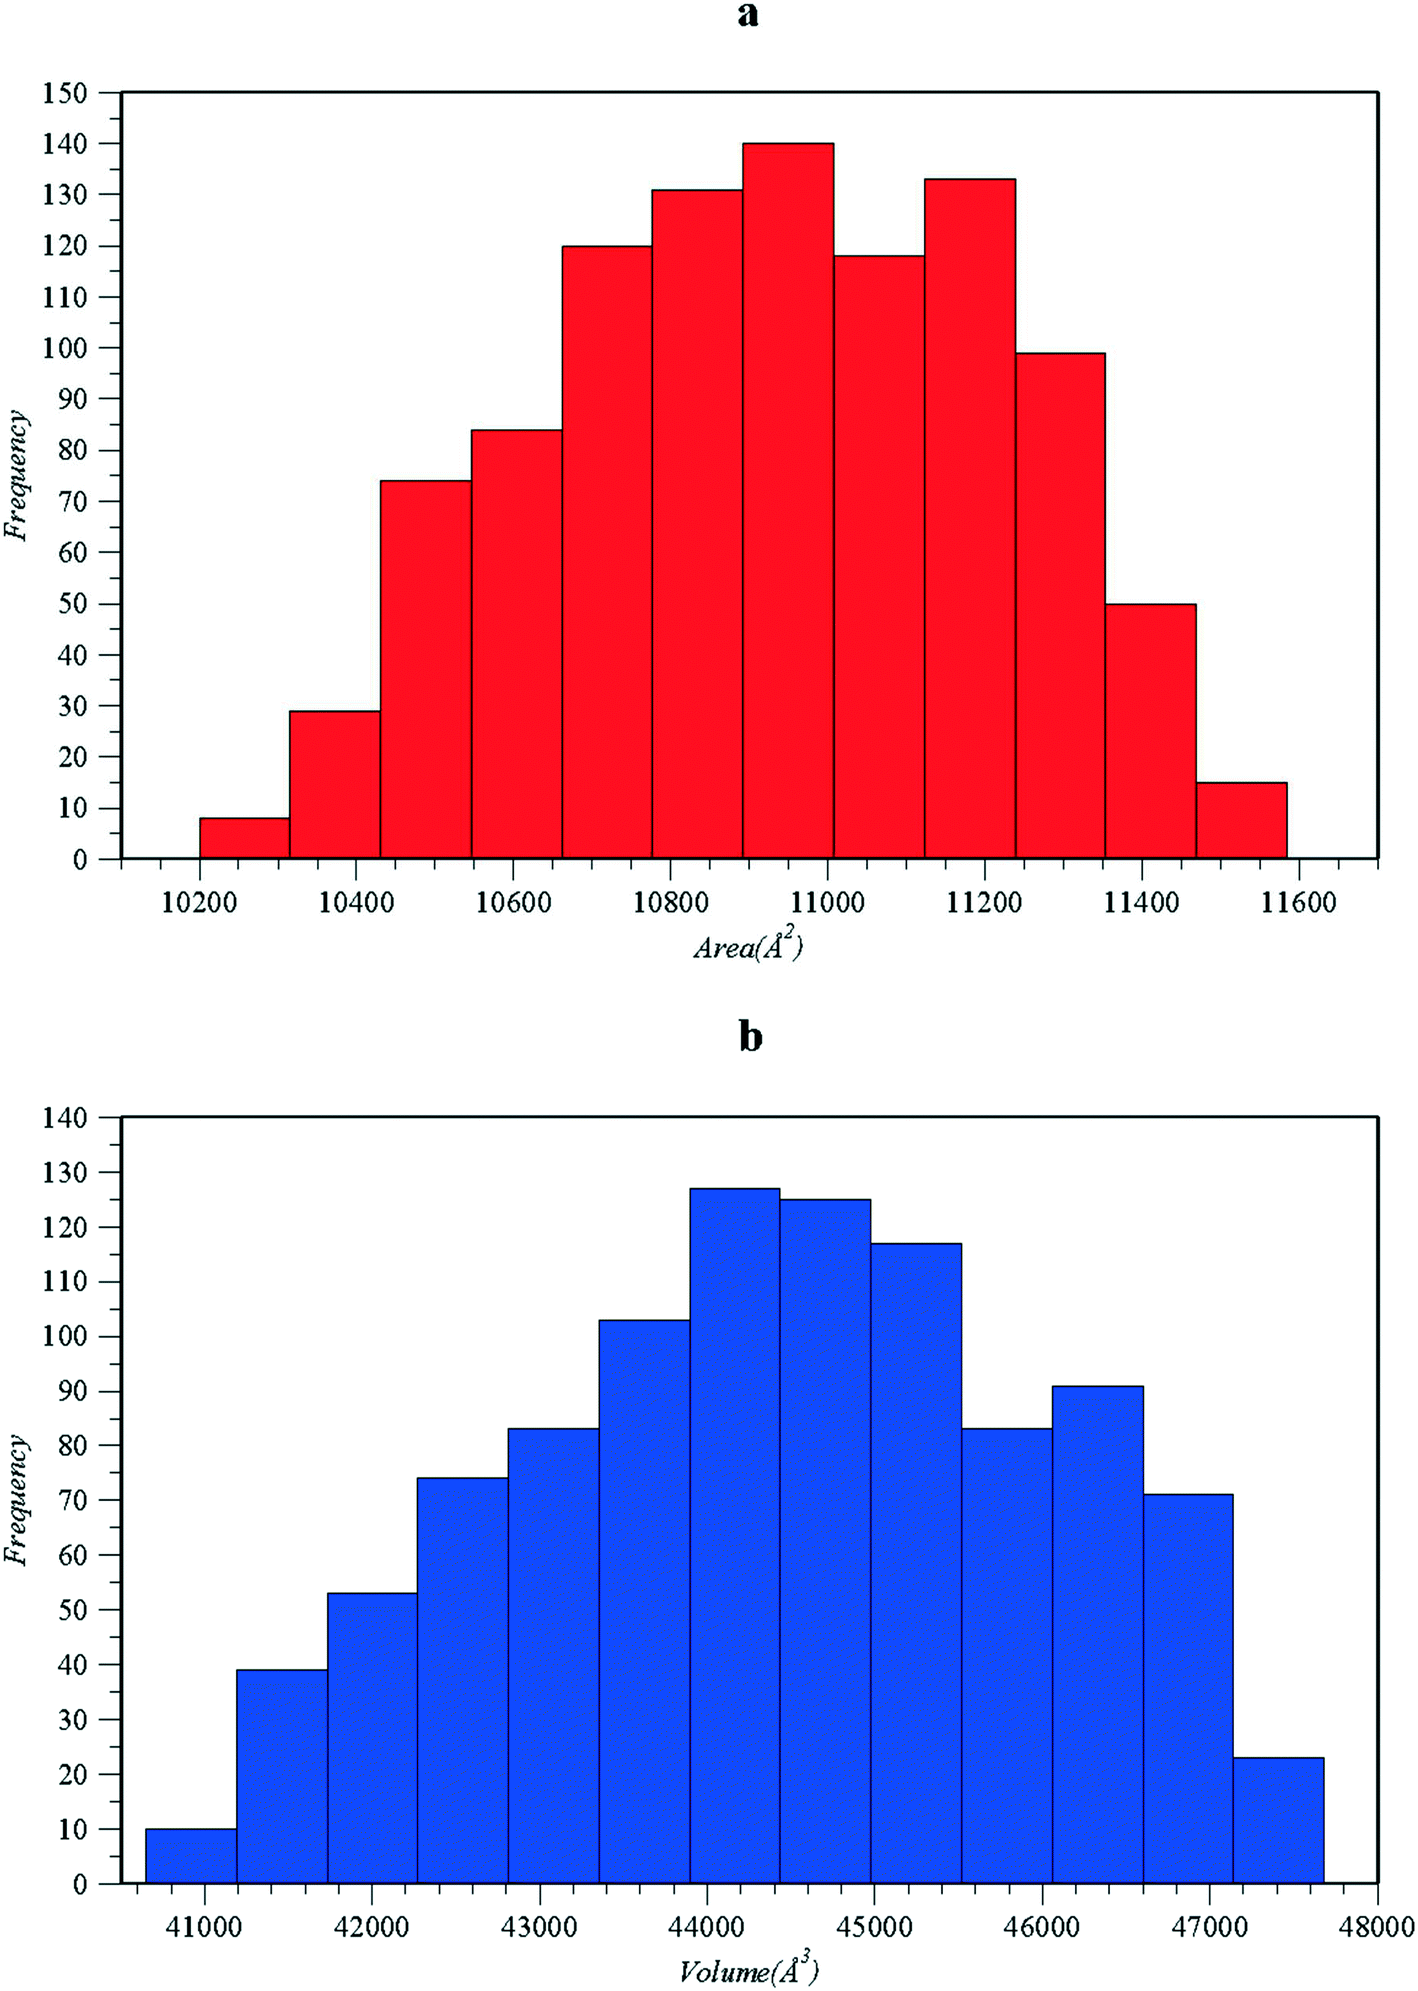 | ||
| Fig. 3 Histograms showing the distribution of the estimated values of the molecular accessible surface area (a) and molecular inaccessible volume (b) for a total of 1000 sampled orientations of the 1zp8 test system.70 | ||
The effect of sampling random relative orientations can be seen in more detail in Fig. 3, where the values of the inaccessible volume and accessible surface area appear to be normally distributed around an average value. At this point the reader should note that the actual shape of such distributions is probably driven towards a “normal” like distribution via the center limit theorem, as is the case for many physical quantities. On the other hand, both the volume and area are bounded continuities and therefore the distributions can never become truly normal. It is therefore advised that the type of the distribution is not taken for granted but considered verified for the particular case of interest. In Fig. 4a, samples of 3D representations of the protein–ligand molecular accessible surface are shown, mainly for configurations retrieved from the minima or maxima of Fig. 2a and b using Jmol. According to the displayed molecular states, the inhibitor can “fit” in the original binding site of the protein with significant changes in the relative orientation. Notably, several of the sampled ligand orientations could potentially bind in the opposite direction, reverse to the ligand configuration of the original 1zp8 PDB file (Fig. 4b). We should point out that calculations in Fig. 2 pertain solely to excluded volume interactions. Therefore such observations may serve exclusively for initial screening. Moreover, in the calculations of Fig. 2, we do not distinguish between placing the ligand into pocket cavities or onto the outer surface of the protein. Nevertheless, once the total molecular accessible surface is evaluated, it is also possible to partition the area based on concavity, charge, polarity, or hydrophobicity of the protein contact atom utilizing the tools which have been developed for the SASA and are available in visualization software like Jmol. It should be noted that in the molecular accessible surface, each point corresponds to a specific atom–atom interaction between the ligand and the protein molecule, with more than 3 body contacts, mapped onto lines and points which form from the intersections of spheres at the surface. It should also be noted that although identification of the hydrophobic part of the accessible surface is straightforward in the proposed methods, by simply identifying auxiliary spheres based on the characterization of the corresponding protein–ligand atom pair, studying “hydrophobicity” as a phenomenon requires much more than simply measuring the amount of the hydrophobic molecular accessible surface since there are many aspects behind the term “hydrophobicity”, with some of them being non-local76 and a strong function of the unique properties of water as a solvent. On the other hand, measuring the amount of the hydrophobic molecular accessible surface appears as a promising potential candidate for developing descriptors in QSAR studies similar to the ones performed using the SASA.77
 | ||
| Fig. 4 (a) 3D illustrations of the 1zp8 PDB70 protein–ligand molecular accessible surfaces using Jmol, extracted from a selected set of sampled relative orientations presented in Fig. 2 (labeled as A, B, C and D). The protein molecule is displayed according to its secondary structure (yellow b-sheets and pink a-helix) while the ligand molecule holds the typical ball & stick representation style. Ligand and protein molecules are presented at the corresponding relative orientation by placing the sampled ligand configuration onto the molecular accessible surface close to the original binding cavity. Unlike the SASA, our molecular accessible surface is a function of both the actual ligand and the ligand–protein relative orientation. (b) A more detailed view of the sampled ligand configuration C versus the original ligand configuration of the 1zp8 PDB file. Interestingly in this sampled orientation, the sampled ligand configuration C (bright green color) can “fit” in the binding site in the opposite direction contrary to the original ligand configuration of the 1zp8 PDB file depicted transparently in red. | ||
In an effort to verify and validate the accuracy of the proposed approach, the estimate of the molecular accessible surface area and a numerical finite difference estimate of the inaccessible volume are shown in Fig. 5. The numerical derivative has been estimated by performing volume calculations over slight increments of the radius parameter δR incorporated in the algorithm. Confirming the consistency between our estimations of the molecular accessible surface and inaccessible molecular volume, the analytical calculation of the molecular accessible surface can be estimated using finite differences provided that the alteration in the radius parameter is neither too small nor too big as it is the case with most numerical estimations based on finite differences.
 | ||
| Fig. 5 Comparison of the analytical estimation of the molecular accessible area (black continuous line) with estimates based on numerical forward finite differences of the inaccessible molecular volume (red crosses). The estimations based on finite differences are presented as a function of the discrete increase in the radius of all auxiliary spheres by the same parameter δR (i.e. area ∼ (volumedij+δR − volumedij)/(δR)). The estimations have been performed upon the original input configuration of the ligand molecule inside the 1zp8 PDB70 file acting here as the protein and the water molecule62 as the “ligand”. | ||
Having established the consistency between the molecular inaccessible volume and accessible molecular surface, in Fig. 6 we demonstrate the validity of the molecular inaccessible volume calculation by comparing the proposed analytical calculation with the estimation based on random “Widom”-like test insertions57 under the original input relative orientation regarding a simple test system, where methane61 and caffeine68 act as ligand and protein molecules, respectively. To perform the stochastic estimation, we initially enclosed the molecule of caffeine in a box and then measured the ratio of attempts which failed to place the methane molecule without overlap in the box, given the original relative orientation. An estimate of the inaccessible volume was produced after multiplying the volume of the box by the ensemble average of the ratio of failed “test” insertions. In Fig. 6, the stochastic estimation is reported as a function of the number of insertions, alongside the analytical volume estimation at the same original relative ligand–protein orientation, where the results from the stochastic method coincide with our analytical calculation output.
 | ||
| Fig. 6 Comparison of analytical inaccessible volume calculation (blue circular points) versus the stochastic evaluation based on test “Widom”-like insertions in a simple molecular system, consisting of methane61 and caffeine68 as ligand and protein molecules, respectively (blue triangular points). The stochastic estimation results were acquired after 5 repetitive runs on the aforementioned test system at the original relative orientation with different seed numbers for each given number of insertions. All calculations coincided with the analytical estimation of the inaccessible volume, within the 95% confidence interval (depicted as error bars in the above graph). | ||
In Fig. 7, we observe the effect of scaling all interatomic contact distances by a common factor fR, regarding 3 molecular test systems of different sizes based on the 1zp8,702bpw,714wtg72 files downloaded from PDB. More specifically, the smallest 1zp8 system consists of 812 atoms in total, 765 of which form the HIV-1 protease while the remaining 47 atoms form its ligand inhibitor AB-2.73 The mid-sized scale 2bpw system contains 1559 atoms, 1514 constituting the HIV-1 protease and 45 its potent ligand inhibitor.74 Lastly, the largest 4wtg system consists of 4357 atoms, 4327 of which belong to the modified version of HCV RdRp and the remaining 30 atoms are found within its ligand, the clinically active metabolite formed by sofosbuvir, Mn2+ and a primer-template RNA.75 Examination of the accessible surface dependency on the algorithm's parameter fR promotes an interesting perspective. There is a certain range where increasing the scaling factor fR leads to reduction of the accessible area, strongly indicating the presence of concave parts on the protein surface which shrink as the radius expands (Fig. 8). However, one may conceive of an approach that uses such observations to identify the presence of cavities but to our knowledge, there is no such method. This is probably due to the usual alternative methods being quite sufficient in identifying cavities or due to the fact that similar calculations would require significant accuracy in the estimation of accessible surfaces. This would not be a practical choice since most of the available methods are of stochastic nature. On the other hand, implementing the analytical calculation of Dodd and Theodorou8 leads to accurate estimations which can be used to estimate partial differences from finite differences. Finally, for users that would like to use our approach in combination with existing (or newer methods) ones for partitioning the surface area based on concavity, we should note that the correlation between accessible areas of a concave cavity formed out of spheres can be affected by the actual definition of the criteria used to separate concave from convex regions.
 | ||
| Fig. 7 Estimations of the accessible surface area (a) and inaccessible volume (b), both expressed as functions of the algorithm's parameter scaling factor fR. The radii of the auxiliary spheres which determine the range of hard core inter-atomic interactions have been estimated by scaling a common factor, the sum of the van der Waals radii for each atom pair that is used in the formation of the auxiliary sphere. Tests were performed upon 3 molecular systems of varying size (1zp8,70 2bpw,71 and 4wtg72). | ||
 | ||
| Fig. 8 Investigation of concave surfaces of the 1zp8 test system70 in relevance to fR changes and visualization by Jmol.22 The translucent orange isosurfaces surrounding (a) and (b) models are created using the “isosurface pocket cavity” Jmol command and are generated according to the set of auxiliary spheres at the specified fR value respectively. In (a), the fR is adjusted to 0.15 and 37 isosurfaces are created with a total accessible surface area of 5008.8 Å2. Increasing fR to 0.20 (b) seems to decrease the amount of isosurfaces created to 34 as well as the overall accessible surface area which drops to 3807.8 Å2. Increments of the scaling factor fR lead to reduction of the overall accessible area as the concave parts on the protein surface shrink and eventually vanish as the radius expands. | ||
Finally, as mentioned previously, a considerable amount of effort has been put into decomposing analytical calculations into independent sub-calculations which can be performed in parallel, since dealing with all of the auxiliary spheres using a single processor may not be feasible for most of the protein–ligand complexes of interest. Aiming to distribute the memory load into multiple processors even at the expense of performing more arithmetic calculations, in Fig. 9 we present the algorithm's execution time as a function of the number of processors used in our parallel decomposition (Fig. 9a) as well as a function of fR alterations utilizing all processors of our computational nodes through MPI63 (Fig. 9b). The system examined in Fig. 9a consists of the protein–ligand complex retrieved from the 1zp8 PDB entry where all radii have been scaled at half of their van der Waals value by setting the fR parameter to 0.5, while in Fig. 9b, the largest in size 4wtg system (4357 atoms) is tested with increasing fR values exploiting plenty of computational resources. As the size of the molecular system increases relevant to the available resources per processor, the necessity and parallel efficiency of actual calculations may differ, but our approach is expected to be applicable provided that sufficient computational resources are allocated. Subsequently, parallelization through MPI makes our approach suitable both for supercomputers and homemade clusters alike.
 | ||
| Fig. 9 Inaccessible volume and accessible surface area calculation completion time as a function of the number of processors tested on a small size-scale molecular system (1zp8)70 (a) as well as a function of fR alterations upon the largest in size 4wtg72 molecular system utilizing 38 processors of our computational nodes through MPI (b). | ||
For all of the above tests, we implemented our developed algorithm and proposed a methodology which mainly relies on the generation of a set of auxiliary spheres according to the examined molecular system for the analytical calculation of the molecular accessible surface area (MASA) and molecular inaccessible volume (MIV). The user can also perform MASA and MIV calculations by simply inputting the generated set of auxiliary spheres to the computational tool of preference. However, this comes with a considerable trade off in the accuracy of the estimated area and volume values if not calculated by our developed algorithm. In order to assess the validity and robustness of our proposed method, analytical volume and area calculations were carried out on the simplest possible molecular test systems. For this reason, two test systems were formed consisting of either monatomic hydrogen65 (test 1) or diatomic hydrogen66 (test 2) as hypothetical protein molecules, while the ligand molecule was always a monatomic hydrogen65 in both cases. The estimated volume and area after the execution of the developed algorithm were compared with the respective calculation results of other available computational tools applied on the same test systems. Due to this fact, the van der Waals (vdW) radii of each hydrogen atom in ligand and protein molecules were adjusted equally to 1.2 Å among the examined programs for a fair comparison. Several tests were performed utilizing the incorporated volume and area features where applicable of Jmol22 and VMD23 molecular visualization software. Apart from that, analytical volume and area calculations of our algorithm were verified by the online partial sphere volume and area calculator78 as well as checked against Poreblazer19,20 and Molecularvolume21 software. The yielded results are summarized in Table 2.
| Area (Å2) | Test 1 | Test 2 | Volume (Å3) | Test 1 | Test 2 |
|---|---|---|---|---|---|
| MASIV | 72.382300 | 83.541238 | MASIV | 57.905843 | 71.190481 |
| Online calculator78 | 72.382295 | 83.541232 | Online calculator78 | 57.905836 | 71.190473 |
| Jmol22 | 72.187240 | 83.328275 | Jmol22 | 57.589081 | 70.826505 |
| VMD23 | 72.382301 | 82.805351 | Molecularvolume21 | 56.000000 | 68.500000 |
| Poreblazer19,20 | 72.320000 | 83.170000 |
Potential applications based on the molecular accessible surface area
The molecular accessible surface area (MASA) can be considered as a natural extension of the widely used concept of the solvent accessible surface area. Therefore, like the SASA, the MASA can be used in a variety of applications, spanning from visualization, estimation of descriptors in QSAR models, to “docking”. Furthermore, the MASA can “replace” the SASA in most applications with minimal effort. For most applications, one simply needs to replace the set of atoms in the original system with a set of auxiliary atoms. It is then straightforward to use any available tool that has been developed for the SASA either for visualization or for actual estimations. Since the accuracy provided by the user of an analytical estimation is not expected to be essential in many of these applications, and in order to facilitate the use of the MASA in applications that correctly used the SASA, we provide, as part of the ESI† of this paper, the ability to create the appropriate set of auxiliary atoms, given the protein and ligand configurations, without further estimation of the MASA. Furthermore, in the ESI† section we show how to combine this software with Jmol or VMD in order either to visualize the MASA or even to estimate the MASA, using the tools that have been developed for the SASA and are available via these programs. Given that most available tools used for the estimation of the SASA, to our knowledge, are approximate, we believe that the analytical method of Dodd and Theodorou is expected to be used in cases where the accuracy of the estimation is important, whereas the approximate estimates can be used in order to reduce the necessary computational cost where accuracy is not essential. A potential application of the MASA where the accuracy of the analytical method of Dodd and Theodorou is expected to be essential is “docking”. Having in mind that the term “docking” is used to describe a variety of approaches that aim at sampling configurations where protein and ligand molecules are “most likely” to bond to each other as summarized in the Introduction section of this paper, the MASA can be used in order to facilitate the creation of such ensembles of configurations by giving the ability to sample all nonzero overlap placements of the ligand, given the internal degrees of freedom and the relative orientation. Although the ability to create samples with non-overlapping configurations is important on its own, we expect that our ability to provide an estimate with high accuracy will eventually turn the molecular accessible surface into a key ingredient in future “docking” applications since it can be used to “measure” the probability of creating non-overlapping ensembles. Whereas in this paper we limit ourselves in extending the notion of the solvent accessible volume, by proposing two new concepts that of the molecular accessible surface, and the inaccessible molecular volume as the natural extension of the solvent accessible volume, in a continuation of this work we aim to demonstrate how the proposed concepts in this paper can be used for the creation of ensembles with well-defined weights and how this can be used in the further development of docking applications. Finally, the proposed algorithm for the estimation of the molecular inaccessible volume of ligands is expected to have practical uses in the estimation of protein–ligand binding affinities via staged insertion or particle deletion methods. It is therefore interesting to assess the effect that the range of hard core interactions may have on the proposed estimation. As it has already been shown in the development of particle deletion59,79–82 and staged insertion methods,83 it is also possible to use estimations of the accessible volume. These estimations are based on hard core interactions as part of the evaluation of the chemical potential in the case of molecules interacting via “soft” potential. In this case, the free energy difference related to the transformation of hard cavities formed through the hard core interactions is added to the final “soft” molecule. The overall calculation becomes independent of the actual choice by considering the range of hard core interactions smaller or larger than the minimum distance of two atoms expected to be in contact with each other under the given conditions. If the free energy difference is estimated via the staged insertion method, hard core interactions should be smaller than the minimum distance. If the particle deletion method is used, hard core interactions should be larger than the minimum distance. In any case, the range of hard core interactions is expected to be smaller than the distance at the first pick of interatomic radius of gyration.Conclusion
In this work, the estimation of the molecular inaccessible volume and accessible surface area is proposed as a generalization of the SASA. We implemented the proposed approach for estimation of the protein–ligand inaccessible volume and accessible surface area upon a set of molecular systems of various sizes. We demonstrated how it is possible to estimate the proposed molecular volumes and surfaces using any available tool that can be used for the estimation of the SASA by adding the suitable set of auxiliary spheres as in the included example of Jmol. Furthermore, we have shown that by utilizing the power of analytical calculation of the volume of fused spheres by Dodd and Theodorou plus distributing the computational load via MPI, it is possible to make very accurate estimations in a variety of protein–ligand systems. The validity of our approach was assessed firstly by estimating the inaccessible volume via a stochastic Widom-like test insertion method and secondly, by comparing the molecular accessible surface with a numerical finite difference calculation. Finally, by drawing the connection between the proposed molecular inaccessible volume and free energy difference estimations via the staged insertion and deletion schemes, the molecular inaccessible volume ought to be used in the future for estimation of protein–ligand binding affinities. Alternatively, it is expected to constitute an additional visualization tool, providing more specificity to the examination of protein–ligand interactions.Data and software availability
We provide a FORTRAN based program that is able to perform the inaccessible volume and accessible surface calculations reported in this work by performing calls to a library that deploys Dodd and Theodorou estimation of the volume of fused spheres, kindly provided to us by Professor Theodorou. The program requires a minimal input of two .xyz files, the first one constituting the protein molecule and the second one possessing the ligand coordinates at the desired relative orientation. Additionally, example files are provided as ESI† which can be used for verification purposes. For more details, please check the ESI.†Conflicts of interest
There are no conflicts to declare.Acknowledgements
The support in form of computational time granted by the Greek Research & Technology Network (GRNET) at the National HPC facility – ARIS – under projects “ToraDrug” and “ProLiq” (project IDs 001040 and 002035), is kindly acknowledged. The accessibility to the MAPS platform via Scienomics, Groups of Scientific Excellence initiative is also acknowledged. Professor Theodorou is acknowledged for providing us with an implementation of the Dodd and Theodorou method. Finally, we would like to acknowledge Ms Konstantina Vaitsi for spelling and editorial proof reading of the manuscript.References
- B. Lee and F. M. Richards, The Interpretation of Protein Structures: Estimation of Static Accessibility, J. Mol. Biol., 1971, 55(3), 379–400, DOI:10.1016/0022-2836(71)90324-x.
- A. Shrake and J. A. Rupley, Environment and Exposure to Solvent of Protein Atoms. Lysozyme and Insulin, J. Mol. Biol., 1973, 79(2), 351–371, DOI:10.1016/0022-2836(73)90011-9.
- M. L. Connolly, Analytical Molecular Surface Calculation, J. Appl. Crystallogr., 1983, 16(5), 548–558, DOI:10.1107/S0021889883010985.
- M. L. Connolly, The Molecular Surface Package, J. Mol. Graphics, 1993, 11(2), 139–141, DOI:10.1016/0263-7855(93)87010-3.
- R. Fraczkiewicz and W. Braun, Exact and efficient analytical calculation of the accessible surface areas and their gradients for macromolecules, J. Comput. Chem., 1998, 19(3), 319–333, DOI:10.1002/(SICI)1096-987X(199802)19:3<319::AID-JCC6>3.0.CO;2-W.
- K. D. Gibson and H. A. Scheraga, Exact Calculation of the Volume and Surface Area of Fused Hard-Sphere Molecules with Unequal Atomic Radii, Mol. Phys., 1987, 62(5), 1247–1265, DOI:10.1080/00268978700102951.
- S. J. Wodak and J. Janin, Analytical Approximation to the Accessible Surface Area of Proteins, Proc. Natl. Acad. Sci. U. S. A., 1980, 77(4), 1736–1740 CrossRef CAS PubMed.
- L. R. Dodd and D. N. Theodorou, Analytical Treatment of the Volume and Surface Area of Molecules Formed by an Arbitrary Collection of Unequal Spheres Intersected by Planes, Mol. Phys., 1991, 72(6), 1313–1345, DOI:10.1080/00268979100100941.
- L. Cavallo, J. Kleinjung and F. Fraternali, POPS: A Fast Algorithm for Solvent Accessible Surface Areas at Atomic and Residue Level, Nucleic Acids Res., 2003, 31(13), 3364–3366 CrossRef CAS PubMed.
- N. J. D. Drechsel, C. J. Fennell, K. A. Dill and J. Villà-Freixa, TRIFORCE: Tessellated Semianalytical Solvent Exposed Surface Areas and Derivatives, J. Chem. Theory Comput., 2014, 10(9), 4121–4132, DOI:10.1021/ct5002818.
- J. Weiser, P. S. Shenkin and W. C. Still, Approximate atomic surfaces from linear combinations of pairwise overlaps (LCPO), J. Comput. Chem., 1999, 20(2), 217–230, DOI:10.1002/(SICI)1096-987X(19990130)20:2<217::AID-JCC4>3.0.CO;2-A.
- D. Xu and Y. Zhang, Generating Triangulated Macromolecular Surfaces by Euclidean Distance Transform, PLoS One, 2009, 4(12), e8140, DOI:10.1371/journal.pone.0008140.
- B. Rost and C. Sander, Conservation and Prediction of Solvent Accessibility in Protein Families, Proteins: Struct., Funct., Genet., 1994, 20(3), 216–226, DOI:10.1002/prot.340200303.
- E. Faraggi, T. Zhang, Y. Yang, L. Kurgan and Y. Zhou, SPINE X: Improving Protein Secondary Structure Prediction by Multi-Step Learning Coupled with Prediction of Solvent Accessible Surface Area and Backbone Torsion Angles, J. Comput. Chem., 2012, 33(3), 259–267, DOI:10.1002/jcc.21968.
- O. Dor and Y. Zhou, Real-SPINE: An Integrated System of Neural Networks for Real-Value Prediction of Protein Structural Properties, Proteins: Struct., Funct., Bioinf., 2007, 68(1), 76–81, DOI:10.1002/prot.21408.
- M. Wang, A. Li, X. Wang and H. Feng, Prediction of protein solvent accessibility with Markov chain model, Shengwu Yixue Gongchengxue Zazhi, 2006, 23(5), 1109–1113 Search PubMed.
- M. Mucchielli-Giorgi, S. Hazout and P. Tuffery, PredAcc: Prediction of Solvent Accessibility, Bioinformatics, 1999, 15(2), 176–177, DOI:10.1093/bioinformatics/15.2.176.
- J. Mihel, M. Šikić, S. Tomić, B. Jeren and K. Vlahoviček, PSAIA – Protein Structure and Interaction Analyzer, BMC Struct. Biol., 2008, 8, 21, DOI:10.1186/1472-6807-8-21.
- Poreblazer GitHub - SarkisovGroup/PoreBlazer: PoreBlazer (v4.0) source code, examples, and geometric properties of porous materials calculated for the subset of 12000 structures from the CSD MOF, https://github.com/SarkisovGroup/PoreBlazer, (accessed 2021-07-22).
- L. Sarkisov and A. Harrison, Computational Structure Characterisation Tools in Application to Ordered and Disordered Porous Materials, Mol. Simul., 2011, 37, 1248–1257, DOI:10.1080/08927022.2011.592832.
- pdb2volume.py GitHub - ajd98/molecularvolume: Utilities for molecular volume calculation, https://github.com/ajd98/molecularvolume, (accessed 2021-07-22).
- Jmol: an open-source Java viewer for chemical structures in 3D, http://jmol.sourceforge.net/, (accessed 2021-03-24).
- VMD Software Downloads, https://www.ks.uiuc.edu/Development/Download/download.cgi?PackageName=VMD, (accessed 2021-07-20).
- W. Kabsch and C. Sander, Dictionary of Protein Secondary Structure: Pattern Recognition of Hydrogen-Bonded and Geometrical Features, Biopolymers, 1983, 22(12), 2577–2637, DOI:10.1002/bip.360221211.
- W. Kabsch and C. Sander, How Good Are Predictions of Protein Secondary Structure?, FEBS Lett., 1983, 155(2), 179–182, DOI:10.1016/0014-5793(82)80597-8.
- E. Krissinel and K. Henrick, Inference of Macromolecular Assemblies from Crystalline State, J. Mol. Biol., 2007, 372(3), 774–797, DOI:10.1016/j.jmb.2007.05.022.
- S. J. Hubbard and J. M. Thornton, ‘NACCESS’, Computer Program, Department of Biochemistry and Molecular Biology, University College, London, 1993, Naccess homepage http://www.bioinf.manchester.ac.uk/naccess/, (accessed 2021-07-17) Search PubMed.
- S. Mitternacht, FreeSASA: An Open Source C Library for Solvent Accessible Surface Area Calculations, F1000Research, 2016, 5, 189, DOI:10.12688/f1000research.7931.1.
- E. Potterton, S. McNicholas, E. Krissinel, K. Cowtan and M. Noble, The CCP 4 Molecular-Graphics Project, Acta Crystallogr., Sect. D: Biol. Crystallogr., 2002, 58(11), 1955–1957, DOI:10.1107/S0907444902015391.
- L. Potterton, S. McNicholas, E. Krissinel, J. Gruber, K. Cowtan, P. Emsley, G. N. Murshudov, S. Cohen, A. Perrakis and M. Noble, Developments in the CCP 4 Molecular-Graphics Project, Acta Crystallogr., Sect. D: Biol. Crystallogr., 2004, 60(12), 2288–2294, DOI:10.1107/S0907444904023716.
- M. D. Winn, C. C. Ballard, K. D. Cowtan, E. J. Dodson, P. Emsley, P. R. Evans, R. M. Keegan, E. B. Krissinel, A. G. W. Leslie, A. McCoy, S. J. McNicholas, G. N. Murshudov, N. S. Pannu, E. A. Potterton, H. R. Powell, R. J. Read, A. Vagin and K. S. Wilson, Overview of the CCP4 Suite and Current Developments, Acta Crystallogr., Sect. D: Biol. Crystallogr., 2011, 67(Pt 4), 235–242, DOI:10.1107/S0907444910045749.
- P. Bernadó, M. Blackledge and J. Sancho, Sequence-Specific Solvent Accessibilities of Protein Residues in Unfolded Protein Ensembles, Biophys. J., 2006, 91(12), 4536–4543, DOI:10.1529/biophysj.106.087528.
- J. Estrada, P. Bernado, M. Blackledge and J. Sancho, ProtSA: A Web Application for Calculating Sequence Specific Protein Solvent Accessibilities in the Unfolded Ensemble, BMC Bioinf., 2009, 10(1), 104, DOI:10.1186/1471-2105-10-104.
- E. Durham, B. Dorr, N. Woetzel, R. Staritzbichler and J. Meiler, Solvent Accessible Surface Area Approximations for Rapid and Accurate Protein Structure Prediction, J. Mol. Model., 2009, 15(9), 1093–1108, DOI:10.1007/s00894-009-0454-9.
- J. R. Christensen, H. Meng-Lund, H. Grohganz, A. Poso, T. Laitinen, O. Korhonen, L. Jørgensen and J. Pajander, Surface Area, Volume and Shape Descriptors as a Novel Tool for Polymer Lead Design and Discovery, Eur. J. Pharm. Sci., 2017, 102, 188–195, DOI:10.1016/j.ejps.2017.03.013.
- M. Sharma and D. Ahuja, QSAR Studies of Flavonoids Derivatives for Antioxidant and Antimicrobial Activity, J. Drug Delivery Ther., 2019, 9(4), 765–773, DOI:10.22270/jddt.v9i4.3967.
- M. E. A. Zaki, S. A. Al-Hussain, V. H. Masand, S. Akasapu and I. Lewaa, QSAR and Pharmacophore Modeling of Nitrogen Heterocycles as Potent Human N-Myristoyltransferase (Hs-NMT) Inhibitors, Molecules, 2021, 26(7), 1834, DOI:10.3390/molecules26071834.
- J. Kujawski, H. Popielarska, A. Myka, B. Drabińska and M. Bernard, The Log P Parameter as a Molecular Descriptor in the Computer-Aided Drug Design – an Overview, Computational Methods in Science and Technology, 2012, 18(2), 81–88, DOI:10.12921/cmst.2012.18.02.81-88.
- PyMOL, pymol.org https://pymol.org/2/, (accessed 2021-07-20).
- E. Fischer, Einfluss Der Configuration Auf Die Wirkung Der Enzyme, Chem. Ber., 1894, 27(3), 2985–2993, DOI:10.1002/cber.18940270364.
- D. E. Koshland, Application of a Theory of Enzyme Specificity to Protein Synthesis*, Proc. Natl. Acad. Sci. U. S. A., 1958, 44(2), 98–104 CrossRef CAS PubMed.
- S. Kumar, B. Ma, C. J. Tsai, N. Sinha and R. Nussinov, Folding and Binding Cascades: Dynamic Landscapes and Population Shifts, Protein Sci., 2000, 9(1), 10–19 CrossRef CAS PubMed.
- E. Lionta, G. Spyrou, D. Vassilatis and Z. Cournia, Structure-Based Virtual Screening for Drug Discovery: Principles, Applications and Recent Advances, Curr. Top. Med. Chem., 2014, 14(16), 1923–1938, DOI:10.2174/1568026614666140929124445.
- I. D. Kuntz, J. M. Blaney, S. J. Oatley, R. Langridge and T. E. Ferrin, A Geometric Approach to Macromolecule-Ligand Interactions, J. Mol. Biol., 1982, 161(2), 269–288, DOI:10.1016/0022-2836(82)90153-x.
- M. D. Miller, S. K. Kearsley, D. J. Underwood and R. P. Sheridan, FLOG: A System to Select ‘Quasi-Flexible’ Ligands Complementary to a Receptor of Known Three-Dimensional Structure, J. Comput.-Aided Mol. Des., 1994, 8(2), 153–174, DOI:10.1007/BF00119865.
- M. Rarey, B. Kramer, T. Lengauer and G. Klebe, A Fast Flexible Docking Method Using an Incremental Construction Algorithm, J. Mol. Biol., 1996, 261(3), 470–489, DOI:10.1006/jmbi.1996.0477.
- W. Welch, J. Ruppert and A. N. Jain, Hammerhead: Fast, Fully Automated Docking of Flexible Ligands to Protein Binding Sites, Chem. Biol., 1996, 3(6), 449–462, DOI:10.1016/s1074-5521(96)90093-9.
- V. Schnecke and L. A. Kuhn, Virtual Screening with Solvation and Ligand-Induced Complementarity, Perspect. Drug Discovery Des., 2000, 20(1), 171–190, DOI:10.1023/A:1008737207775.
- K. P. Clark, Ajay. Flexible Ligand Docking without Parameter Adjustment across Four Ligand–Receptor Complexes, J. Comput. Chem., 1995, 16(10), 1210–1226, DOI:10.1002/jcc.540161004.
- J. S. Taylor and R. M. Burnett, DARWIN: A Program for Docking Flexible Molecules, Proteins, 2000, 41(2), 173–191 CrossRef CAS.
- M. L. Verdonk, J. C. Cole, M. J. Hartshorn, C. W. Murray and R. D. Taylor, Improved Protein-Ligand Docking Using GOLD, Proteins, 2003, 52(4), 609–623, DOI:10.1002/prot.10465.
- G. M. Morris, D. S. Goodsell, R. S. Halliday, R. Huey, W. E. Hart, R. K. Belew and A. J. Olson, Automated Docking Using a Lamarckian Genetic Algorithm and an Empirical Binding Free Energy Function, J. Comput. Chem., 1998, 19(14), 1639–1662, DOI:10.1002/(SICI)1096-987X(19981115)19:14<1639::AID-JCC10>3.0.CO;2-B.
- H. J. Böhm, LUDI: Rule-Based Automatic Design of New Substituents for Enzyme Inhibitor Leads, J. Comput.-Aided Mol. Des., 1992, 6(6), 593–606, DOI:10.1007/BF00126217.
- D. K. Gehlhaar, G. M. Verkhivker, P. A. Rejto, C. J. Sherman, D. B. Fogel, L. J. Fogel and S. T. Freer, Molecular Recognition of the Inhibitor AG-1343 by HIV-1 Protease: Conformationally Flexible Docking by Evolutionary Programming, Chem. Biol., 1995, 2(5), 317–324, DOI:10.1016/1074-5521(95)90050-0.
- D. K. Gehlhaar, K. E. Moerder, D. Zichi, C. J. Sherman, R. C. Ogden and S. T. Freer, Novo Design of Enzyme Inhibitors by Monte Carlo Ligand Generation, J. Med. Chem., 1995, 38(3), 466–472, DOI:10.1021/jm00003a010.
- G. M. Verkhivker, D. Bouzida, D. K. Gehlhaar, P. A. Rejto, S. Arthurs, A. B. Colson, S. T. Freer, V. Larson, B. A. Luty, T. Marrone and P. W. Rose, Deciphering Common Failures in Molecular Docking of Ligand-Protein Complexes, J. Comput.-Aided Mol. Des., 2000, 14(8), 731–751, DOI:10.1023/a:1008158231558.
- H. Gohlke, M. Hendlich and G. Klebe, Knowledge-Based Scoring Function to Predict Protein-Ligand Interactions, J. Mol. Biol., 2000, 295(2), 337–356, DOI:10.1006/jmbi.1999.3371.
- R. D. Clark, A. Strizhev, J. M. Leonard, J. F. Blake and J. B. Matthew, Consensus Scoring for Ligand/Protein Interactions, J. Mol. Graphics Modell., 2002, 20(4), 281–295, DOI:10.1016/s1093-3263(01)00125-5.
- G. Boulougouris, I. Economou and D. Theodorou, Calculation of the Chemical Potential of Chain Molecules Using the Staged Particle Deletion Scheme, J. Chem. Phys., 2001, 115, 8231–8237, DOI:10.1063/1.1405849.
- A. Gilbert, Ethane from Nutjunkie/IQmol, 2021 Search PubMed.
- A. Gilbert, Methane from Nutjunkie/IQmol, 2021 Search PubMed.
- G. Marsaglia, Choosing a Point from the Surface of a Sphere, Ann. Math. Stat., 1972, 43(2), 645–646, DOI:10.1214/AOMS/1177692644.
- L. Clarke, I. Glendinning and R. Hempel, The MPI Message Passing Interface Standard. In Programming Environments for Massively Parallel Distributed Systems, ed. K. M. Decker and R. M. Rehmann, Birkhäuser: Basel, Monte Verità, 1994, pp. 213–218, DOI:10.1007/978-3-0348-8534-8_21.
- Bank, R. P. D. RCSB PDB: Homepage https://www.rcsb.org/, (accessed 2021-03-24).
- Monoatommic Hydrogen erkale/H.xyz at master susilehtola/erkale https://github.com/susilehtola/erkale, (accessed 2021-07-22).
- Diatomic Hydrogen erkale/H2.xyz at master susilehtola/erkale https://github.com/susilehtola/erkale, (accessed 2021-07-22).
- A. Gilbert, Water Molecule from Nutjunkie/IQmol, 2021 Search PubMed.
- A. Gilbert, Caffeine from Nutjunkie/IQmol, 2021 Search PubMed.
- GitHub: Where the world builds software https://github.com/, (accessed 2021-03-24).
- Bank, R. P. D. RCSB PDB - 1ZP8: HIV Protease with inhibitor AB-2 https://www.rcsb.org/structure/1zp8, (accessed 2021-03-24).
- Bank, R. P. D. RCSB PDB - 2BPW: HIV-1 protease-inhibitor complex https://www.rcsb.org/structure/2BPW, (accessed 2021-03-24).
- Bank, R. P. D. RCSB PDB - 4WTG: CRYSTAL STRUCTURE OF HCV NS5B GENOTYPE 2A JFH-1 ISOLATE WITH S15G E86Q E87Q C223H V321I MUTATIONS AND DELTA8 BETA HAIRPIN LOOP DELETION IN COMPLEX WITH SOFOSBUVIR DIPHOSPHATE GS-607596, MN2+ AND SYMMETRICAL PRIMER TEMPLATE 5′-CAAAAUUU https://www.rcsb.org/structure/4WTG, (accessed 2021-03-24).
- A. Brik, J. Alexandratos, Y.-C. Lin, J. H. Elder, A. J. Olson, A. Wlodawer, D. S. Goodsell and C.-H. Wong, 1,2,3-Triazole as a Peptide Surrogate in the Rapid Synthesis of HIV-1 Protease Inhibitors, Chembiochem, 2005, 6(7), 1167–1169, DOI:10.1002/cbic.200500101.
- S. Munshi, Z. Chen, Y. Li, D. B. Olsen, M. E. Fraley, R. W. Hungate and L. C. Kuo, Rapid X-Ray Diffraction Analysis of HIV-1 Protease-Inhibitor Complexes: Inhibitor Exchange in Single Crystals of the Bound Enzyme, Acta Crystallogr., Sect. D: Biol. Crystallogr., 1998, 54(Pt 5), 1053–1060, DOI:10.1107/s0907444998003588.
- T. C. Appleby, J. K. Perry, E. Murakami, O. Barauskas, J. Feng, A. Cho, D. Fox, D. R. Wetmore, M. E. McGrath, A. S. Ray, M. J. Sofia, S. Swaminathan and T. E. Edwards, Structural Basis for RNA Replication by the Hepatitis C Virus Polymerase, Science, 2015, 347(6223), 771–775, DOI:10.1126/science.1259210.
- L. Zhang, L. Wang, Y.-T. Kao, W. Qiu, Y. Yang, O. Okobiah and D. Zhong, Mapping Hydration Dynamics around a Protein Surface, Proc. Natl. Acad. Sci. U. S. A., 2007, 104(47), 18461–18466, DOI:10.1073/pnas.0707647104.
- W. J. Dunn, M. G. Koehler and S. Grigoras, The Role of Solvent-Accessible Surface Area in Determining Partition Coefficients, J. Med. Chem., 1987, 30(7), 1121–1126, DOI:10.1021/jm00390a002.
- Volume of a partial sphere Calculator https://keisan.casio.com/exec/system/1223382199, (accessed 2021-07-17).
- G. C. Boulougouris, I. G. Economou and D. N. Theodorou, On the Calculation of the Chemical Potential Using the Particle Deletion Scheme, Mol. Phys., 1999, 96(6), 905–913, DOI:10.1080/00268979909483030.
- G. C. Boulougouris, On the Estimation of the Free Energy, from a Single Equilibrium Statistical Ensemble, via Particle Reinsertion, J. Phys. Chem. B, 2012, 116(3), 997–1006, DOI:10.1021/jp2036185.
- G. C. Boulougouris, Multidimensional Direct Free Energy Perturbation, J. Chem. Phys., 2013, 138(11), 114111, DOI:10.1063/1.4795319.
- B. Gc, Free Energy Calculations, Enhanced by a Gaussian Ansatz, for the “Chemical Work” Distribution, J. Comput. Chem., 2014, 35(13), 1024–1035, DOI:10.1002/jcc.23590.
- D. A. Kofke and P. T. Cummings, Precision and Accuracy of Staged Free-Energy Perturbation Methods for Computing the Chemical Potential by Molecular Simulation, Fluid Phase Equilib., 1998, 150–151, 41–49, DOI:10.1016/S0378-3812(98)00274-X.
Footnote |
| † Electronic supplementary information (ESI) available. See DOI: 10.1039/d1me00053e |
| This journal is © The Royal Society of Chemistry 2021 |