
 Open Access Article
 This Open Access Article is licensed under a Creative Commons Attribution-Non Commercial 3.0 Unported Licence
A novel brain–computer interface flexible electrode material with magnetorheological properties
Guangwei
He†
a,
Yu
Tong†
 a,
Chi
Zhang
b,
Beibei
Xue
a,
Xufeng
Dong
*a,
Shouhu
Xuan
c,
Peixin
Sun
d and
Min
Qi
*a
a,
Chi
Zhang
b,
Beibei
Xue
a,
Xufeng
Dong
*a,
Shouhu
Xuan
c,
Peixin
Sun
d and
Min
Qi
*a
aSchool of Materials Science and Engineering, Dalian University of Technology, Dalian 116024, China. E-mail: dongxf@dlut.edu.cn; minqi@dlut.edu.cn
bSchool of Biomedical Engineering, Dalian University of Technology, Dalian 116024, China
cCAS Key Laboratory of Mechanical Behavior and Design of Materials, Department of Modern Mechanics, University of Science and Technology of China (USTC), Hefei, 230027, China
dDepartments of Neurosurgery, Cancer Hospital of China Medical University, Liaoning Cancer Hospital & Institute, Shenyang 110042, China
First published on 16th September 2021
Abstract
The electrode is the crucial component of a brain–computer interface (BCI), and is the key for the development of the BCI technology. Compared with non-intrusive electrodes and intrusive electrodes, semi-invasive BCI electrodes could make a balance between the quality of the electroencephalogram (EEG) signal and security. However, the application of the compressed mesh electrodes, typical semi-invasive electrodes, has been restricted due to the folds and tangles of the electrode material during injection and the insufficient deployment after injection. To solve the problem, we develop a novel semi-invasive BCI flexible electrode material based on the Fe3O4@GO/P(NIPAM–MAA) hydrogel with magnetic field controlled rheology. The rheology test results indicate that the hydrogel is injectable and its expansion during the transition from sol to gel at ∼37 °C can be actively controlled by applying a magnetic field. Its resistivity is less than 120 Ω m, which makes it sensitive enough to transmit electrical signals between brains and computers. The signal waveform and amplitude recorded by the Fe3O4@GO/P(NIPAM–MAA) hydrogel electrode and wet electrode are basically the same, which proves that the prepared hydrogel electrode material can acquire and record effective EEG signals. Compared with the wet electrode, hydrogel electrodes show higher average peak-to-peak values and higher noise levels. Although the signal-to-noise ratio is similar between the Fe3O4@GO/P(NIPAM–MAA) hydrogel electrode and the wet electrode, the hydrogel electrode is more stable, which proves that the Fe3O4@GO/P(NIPAM–MAA) hydrogel electrode can accurately collect and record EEG signals with a stable signal-to-noise ratio.
Introduction
A brain–computer interface is the frontier of human brain engineering and a critical direction of man–machine interactions. Compared with other man–machine interaction systems, the BCI doesn’t depend on the normal input and output ways of our brain. It is a new non-muscle channel that established between the human brain and computers or other electronic devices.1 Thus, the BCI is an alternative system built using artificial mechanisms and acts as a bridge between the brain and external devices, which can achieve direct information interactions and control of real-time communication. It is a ground-breaking technology that is produced on the basis of the intersection of electronic information, bio-medicine, materials science, mechanics and other disciplines.2The initial goal of the BCI was medical monitoring. The BCI can monitor the neuron physiological activities of the brain by analyzing brain waves, providing important evidence for the diagnosis of brain diseases. As a new input and output manner, the BCI also makes it possible for human brain signals to drive external devices directly. In 2014, at the opening ceremony of the Brazil World Cup, the paralyzed youth wore the exoskeleton that was similar to the mechanical armor, kicking off the World Cup through the BCI.3 The emergence and development of BCI technology have not only brought the gospel of functional recovery to the disabled, but also provided opportunities for functional enhancement to healthy people. In the field of aerospace, BCI technology can transform astronauts’ thinking activities into operating instructions, which will assist them in completing their space missions.4 It is worth mentioning that Elon Musk's Neuralink company has implanted a flexible electrode with a diameter of 4–6 microns into the monkey brain and completed the preliminary testing and evaluation.5 In August 2020, Neuralink used live pigs to demonstrate BCI technology. The product uses wireless transmission and wireless induction through minimally invasive surgery.6 In addition, the applications of the BCI also involve intelligent transportation, identity verification, education and entertainment, among which the huge socioeconomic benefits and broad application prospects make BCI technology extremely competitive.
Electrodes are a crucial component of the BCI and key to the realization of BCI technology. According to the electrode position, the BCI can be classified into two categories, including non-intrusive electrodes and intrusive electrodes. Non-invasive, also known as wearable, doesn’t need to be implanted in the brain. This non-invasive method is less risky and can guarantee security. At present, there are many research studies in this area, such as claw electrodes,7 bionic humidity-sensitive electrodes,8 foam electrodes,9 sponge electrodes,10 textile electrodes,11 Tattoo electrodes12etc. It can be seen that the wearable style is becoming more and more in the direction of flexibility, making it smaller, lighter, more comfortable, and non-stressful to meet the needs of long-term wear. Because of its scientific significance and potential economic benefits, the application of a non-intrusive BCI has begun to take shape and is showing a tendency to rapid development, such as headband helmets, electronic tattoos, and so on. As we all know, the quality and intensity of the EEG signal are proportional to the distance between the electrode and the brain nerve.13 Therefore, although the wearable type is safe, convenient and fashionable, and its shortcomings are also obvious. The collected EEG signal is weak, fuzzy, poor quality and unstable, that is, the signal-to-noise ratio is low. Compared with non-invasive, electrodes implanted in the skull can provide better spatial resolution, higher signal-to-noise ratio and wider frequency range. It can be used for a long time and is less susceptible to motion artifacts and external noise, which makes it possess a unique advantage in practical applications of the BCI. There are many such studies, such as stripes,14 snakes,15 sinusoidal probes,16 three-dimensional micro-needle electrodes,17 climbing twined electrodes,18 micro-wrinkled electrodes,19 micro-crack arrays,20 flexible nerve clips,21 nerve tassel electrodes,22etc. Although the intrusive BCI ensures the strength and quality of the collected EEG signals, anyway, whether the risk of surgical infections or the expensive and cumbersome procedures, security is still a major problem.
In terms of the shortcomings of the above two types of BCI, scholars have proposed the concept of semi-invasive technology.23 Semi-invasive, also known as injectable, combines the advantages of non-invasive and invasive. Injecting through a syringe can accurately target and locate in specific brain regions, which could make a balance between the quality of EEG signals and security. At present, the research of a semi-invasive BCI is still in its infancy. Among them, the most representative one is an ultra-flexible open mesh structure invented by Charles M Lieber's team.24–26 The compressed mesh electrode is injected into the skull through a syringe, and the mesh will stretch itself. It can fit on the brain tissue very softly, which can further blur the boundaries and bridge the gap between neural networks and electronic networks.
However, the existing semi-invasive BCI technologies are passive. During the injection, the potential wrinkles and tangles of the electrode material would affect the signal-to-noise ratio of the EEG signals. After injection, the electrode material can’t be fully deployed on the cerebral cortex, which also restricts the monitoring range of its EEG signal. In response to these problem, this study proposes a subversive idea of semi-invasive BCI technology that turns passive to active. Its core content is to control the deployment of the electrode material by applying an external magnetic field after the electrode material is injected into the cerebral cortex. The ultimate goal is to develop a novel semi-invasive BCI flexible electrode material with magnetic field-controlled rheology. The schematic diagram is shown in Fig. 1. Compared with non-intrusive BCI electrodes, the novel semi-invasive BCI electrode would have a higher signal-to-noise ratio since it is placed directly on the surface of the brain; when compared with invasive BCI electrodes, it would be much safer because it avoids complicated craniotomy. With respect to the other semi-invasive BCI electrodes, it could control the unfolding of the material, and avoid entanglement and wrinkles.
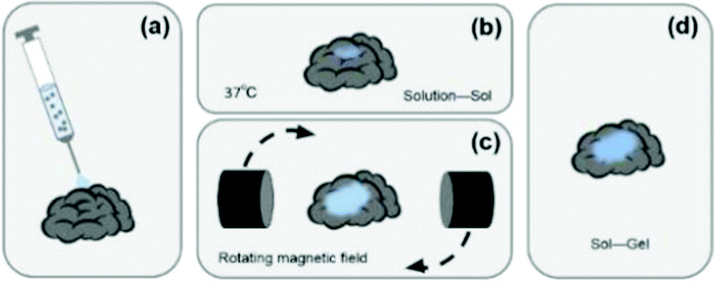 | ||
| Fig. 1 The schematic diagram: (a) injecting the hydrogel precursor solution. (b) In the physiological environment of 37 °C, the hydrogel would change from solution to sol. (c) Applying an external magnetic field to achieve the purpose of expanding the sol area. (d) After removing the external magnetic field, the hydrogel would undergo a sol-to-gel transformation. | ||
Hydrogels match the mechanical properties of brain tissues and have unique rheological properties as injectable materials. Graphene oxide (GO) has excellent electrical conductivity, which is beneficial to the transmission of EEG signals. Fe3O4 can be designed into nanometer size with paramagnetism, which would provide the hydrogels with reversible magnetorheological properties. Therefore, we synthesized a Fe3O4@GO/P(NIPAM–MAA) hydrogel and used it to prepare the novel semi-invasive BCI electrode. Furthermore, the Fe3O4@GO/P(NIPAM–MAA) hydrogel can be used not only as a semi-invasive electrode, but also as a substitute for a non-invasive electrode material. Since the intrusive EEG signal acquisition test requires comprehensive consideration of safety and ethical issues, this article only uses them to perform EEG acquisition experiments outside the scalp in a non-invasive manner.
Experimental section
Materials and preparation methods
Preparation of the Fe3O4@GO/P(NIPAM–MAA) hydrogel
First, 100 mg N-isopropylacrylamide (NIPAM, 98% purity), 1.0% methacrylic acid (MAA), 15 mg crosslinker N,N-methylenebisacrylamide (BIS), 15 mg initiator ammonium persulfate (APS) and 2 mL deionized water were added in a beaker to prepare a hydrogel precursor solution, and subjected to ultrasonic and magnetic stirring treatment. Then, the mixture was weighed and 30 mg Fe3O4@GO was added for ultrasonic treatment. After 20 min, the hydrogel precursor solution and Fe3O4@GO solution were mixed evenly into a Petri dish, and 6 μL of catalyst N,N,N,N-tetramethylethylenediamine (TMEDA) was added. Finally, the solution was continuously sonicated and stirred for 30 min. After a few minutes of rest, the Fe3O4@GO/P(NIPAM–MAA) hydrogel was obtained.The experimental schematic is shown in Fig. 2.
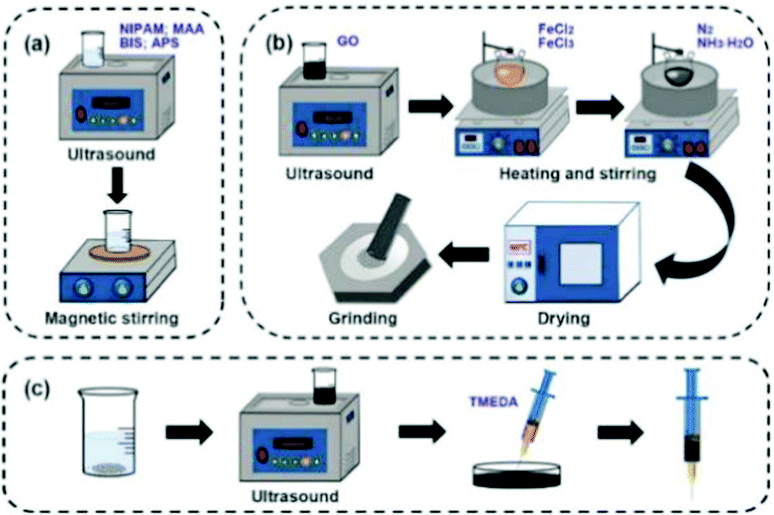 | ||
| Fig. 2 (a) Preparation of the P(NIPAM–MAA) hydrogel. (b) Preparation of Fe3O4@GO. (c) Preparation of the Fe3O4@GO/P(NIPAM–MAA) hydrogel. | ||
Characterization of the Fe3O4@GO/P(NIPAM–MAA) hydrogel
The morphology and structure of the P(NIPAM–MAA), Fe3O4@GO and Fe3O4@GO/P(NIPAM–MAA) hydrogels were analyzed using a field emission scanning electron microscope (SEM, NOVA NanoSEM 450, USA) and an advanced Fourier transform infrared spectrometer (FTIR, IS50, USA).Chemical structure analysis of Fe3O4@GO
The chemical structures of Fe3O4 and Fe3O4@GO were confirmed using an X-ray photoelectron spectrometer (XPS, ESCALAB XI+, UK) to analyze the element type and valence state of the sample. An X-ray diffractometer (XRD, Empyrean, Netherlands) was used to analyze the structure of graphite, graphene oxide, Fe3O4, and Fe3O4@GO. The BET surface areas of GO before and after modification with Fe3O4 were also tested. In order to research the structural evolution of carbon-based materials in the chemical co-precipitation reaction, further characterization of GO and Fe3O4@GO was provided using a Raman microscope (Raman, inVia Qontor, USA). The light source used a 532 nm laser, and the spectral recording range was 250–2000 cm−1. In order to explore the influence of Fe3O4 nanoparticles on the thermal stability of GO, a thermogravimetric analyzer (TGA, SDTA851e, Switzerland) was used to test GO and Fe3O4@GO. The test was in a N2 atmosphere with a heating rate of 10 °C min−1.Property testing
Conductivity and electrochemical performance
The sheet resistance of the Fe3O4@GO/P(NIPAM–MAA) hydrogel was tested using a four-probe tester (HP-504, China). This experiment randomly selected 15 points, and then took the average value. According to the formula, the resistivity could be calculated from the product of the average sheet resistance and the thickness of the hydrogel electrode.The electrochemical performance of the P(NIPAM–MAA) and Fe3O4@GO/P(NIPAM–MAA) hydrogels was analyzed using an electrochemical workstation (CV, AUTOLAB M204, Netherlands). The reference electrodes are Ag/AgCl and a platinum (Pt) electrode. The hydrogel is sandwiched between two nickel foams to make sample electrodes, and then the three electrodes are immersed in phosphate buffered saline (PBS buffer) for testing. The starting voltage was set to −0.8 V, the end voltage was set to 0.8 V, the scan rate was set to 10 mV s−1, and the scan cycle was performed 30 times.
Magnetic-sensitivity properties
The magnetic properties of Fe3O4, Fe3O4@GO, and Fe3O4@GO/P(NIPAM–MAA) hydrogels were characterized and analyzed using a vibrating sample magnetometer (VSM, Lakeshore-7400s, China). The external magnetic field was −18![[thin space (1/6-em)]](https://www.rsc.org/images/entities/char_2009.gif) 000–18000Oe, and the magnetization curve of the sample was recorded at room temperature.
000–18000Oe, and the magnetization curve of the sample was recorded at room temperature.
Rheological properties
The injectability of the hydrogels was macroscopically analyzed by the test tube inversion method. Initially, the hydrogel precursor solution was injected into the test tube with a sterile syringe. After observing and recording for a period of time, we turned the test tube upside down by 180°. If no liquid flows out, there is no doubt that the hydrogel has been formed. Then a timer was used to record the time spent in this process. In order to quantitatively analyze the gelation time of the hydrogel, the rheometer was used to characterize the viscosity of the hydrogel over time. When the viscosity of the hydrogel no longer increases, the gelation process is complete.The magnetorheological properties of the Fe3O4@GO/P(NIPAM–MAA) hydrogel were determined using a rheometer whose parallel-plate system (diameter 20 mm and gap distance 1 mm) was attached to an external magnetic field generator. The magnitude of the magnetic field strength can be changed by controlling the magnitude of the direct current emitted by the parallel plate system. When the current is changed, a uniform magnetic field perpendicular to the sample would be formed between the upper and lower parallel plates of the rheometer. Table 1 shows the corresponding values of the current intensity and magnetic field strength of the rotating rheometer. At a constant frequency of 10 rad s−1, the dependence of the storage modulus G′ and loss modulus G′′ for the Fe3O4@GO/P(NIPAM–MAA) hydrogel on shear strain (0.01–1000%) under different magnetic field strengths was tested. At the constant strain amplitude (0.01%) and the frequency (10 rad s−1), the dependence of the storage modulus and loss modulus for the Fe3O4@GO/P(NIPAM–MAA) hydrogel on magnetic stress was tested. All tests were performed at 25 °C.
| Name | Corresponding value | ||||
|---|---|---|---|---|---|
| Current intensity (A) | 0 | 1 | 2 | 3 | 4 |
| Magnetic field strength (mT) | 0 | 115 | 234 | 350 | 456 |
EEG signal acquisition performance
The EEG signal is collected and recorded using a 32-lead EEG recorder (eegoTM mylab, ANT Neuro, Netherlands). As shown in Fig. 3(a), after the subject puts on the electrode cap, the hydrogel electrode material is injected into 34 electrode sites. As shown in Fig. 3(b), when all 34 channels are displayed in green on the computer interface, it means that the impedance of the electrode materials of all channels is below 20 kΩ, and then the next EEG signal acquisition test can be performed and the sampling frequency is 500 Hz. Among them, GND is a ground electrode, and CPz, M1, and M2 are reference electrodes. The EEG signal was collected for 3 h in a noise-reducing enclosed space, and the current state of the subject was evaluated every 0.5 h. During the experimental test, the subjects try to avoid swallowing, shaking their legs, clenching their teeth and other behaviours that affect signal collection, and try to avoid large-scale shaking to prevent movement artifacts and external noise.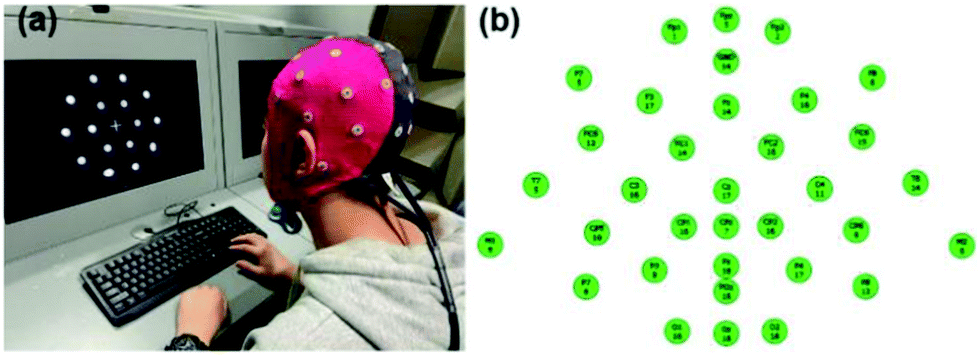 | ||
| Fig. 3 (a) The process of collecting EEG signals. (b) The schematic diagram of 34 channels. | ||
Results and discussion
Morphological and structural characterization
Fig. 4(a) indicates that the diameter of the Fe3O4 particles is about 20–30 nm, and the fine particles are uniformly distributed. Fe3O4 was modified in situ on the surface of graphene oxide (GO), and the layered structure of GO was conducive to loading magnetic Fe3O4 nanoparticles.28 Fe3O4 and GO were overlapped and compounded together. This structure can improve the synergistic effect of the two materials, indicating that Fe3O4@GO has been successfully prepared by the chemical co-precipitation method.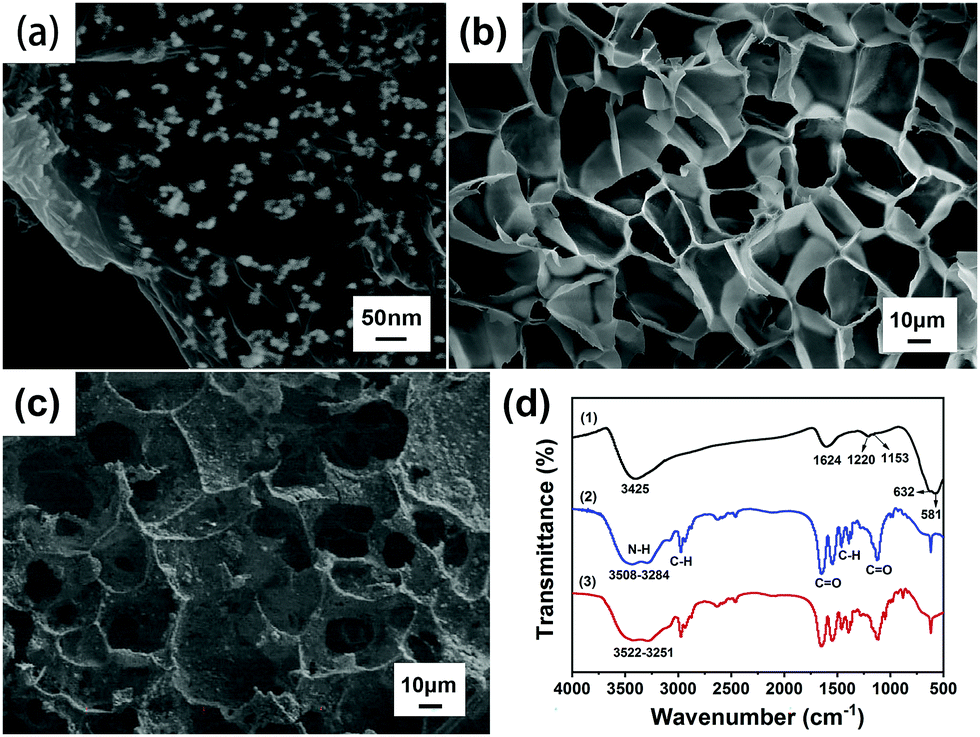 | ||
| Fig. 4 (a) SEM image of Fe3O4@GO. (b) SEM image of the P(NIPAM–MAA) hydrogel. (c) SEM image of the Fe3O4@GO/P(NIPAM–MAA) hydrogel. (d) FTIR spectra of Fe3O4@GO (1), P(NIPAM–MAA) hydrogel (2) and Fe3O4@GO/P(NIPAM–MAA) hydrogel (3). | ||
As shown in Fig. 4(b) and (c), comparing the SEM images of the P(NIPAM–MAA) hydrogel and the Fe3O4@GO/P(NIPAM–MAA) hydrogel, it was found that the similarity of the two hydrogels is that the pores were relatively uniform, and the pore size was about 20 μm. They formed cross-linked three-dimensional porous network structures, which not only provided an access channel that was beneficial to signal transmission, but also provided a huge space for water molecules to increase the response rate of the hydrogel. However, compared with the P(NIPAM–MAA) hydrogel, the surface of the Fe3O4@GO/P(NIPAM–MAA) hydrogel was extremely rough due to the addition of Fe3O4@GO. Such a rough surface morphology enabled the BCI electrode to maintain conformal contact with the brain in a more stable manner, which was of great significance for signal transmission.
Fig. 4(d) shows the FTIR spectra of Fe3O4@GO, P(NIPAM–MAA) and Fe3O4@GO/P(NIPAM–MAA) hydrogels. From the FTIR spectra of the P(NIPAM–MAA) hydrogel, a broad peak in the range of 3508–3284 cm−1 was caused by the N–H absorption peak of the amide group of NIPAM and the O–H vibration absorption peak in MAA. The absorption peak at 2973 cm−1 was attributed to the C–H vibrational peak of methyl and methylene on the isopropyl group. Two strong absorption peaks appeared at around 1720 cm−1 and 1650 cm−1, which were characteristic stretching vibration peaks of C![[double bond, length as m-dash]](https://www.rsc.org/images/entities/char_e001.gif) O on the amide. The symmetric vibrational coupling splitting peaks of the dimethyl group on the isopropyl group was detected at 1417 cm−1 and 1346 cm−1. In the region of 1021–1271 cm−1, the absorption peak was obviously enhanced, which was caused by the CO stretching vibration absorption peak in MAA.29 It can be seen that MAA was successfully introduced into PNIPAM, and the P(NIPAM–MAA) hydrogel was successfully prepared. The FTIR spectrum of the Fe3O4@GO/P(NIPAM–MAA) hydrogel was similar to that of the P(NIPAM–MAA) hydrogel, but the absorption peak was obviously enhanced in the range of 3522–3251 cm−1, which was caused by the –OH stretching vibration peak of Fe3O4@GO nanoparticles. It didn't show the diffraction peak of Fe3O4@GO on the whole, indicating that Fe3O4@GO had been evenly dispersed in the hydrogel, which proved that an integrated Fe3O4@GO/P(NIPAM–MAA) hydrogel has been prepared.
O on the amide. The symmetric vibrational coupling splitting peaks of the dimethyl group on the isopropyl group was detected at 1417 cm−1 and 1346 cm−1. In the region of 1021–1271 cm−1, the absorption peak was obviously enhanced, which was caused by the CO stretching vibration absorption peak in MAA.29 It can be seen that MAA was successfully introduced into PNIPAM, and the P(NIPAM–MAA) hydrogel was successfully prepared. The FTIR spectrum of the Fe3O4@GO/P(NIPAM–MAA) hydrogel was similar to that of the P(NIPAM–MAA) hydrogel, but the absorption peak was obviously enhanced in the range of 3522–3251 cm−1, which was caused by the –OH stretching vibration peak of Fe3O4@GO nanoparticles. It didn't show the diffraction peak of Fe3O4@GO on the whole, indicating that Fe3O4@GO had been evenly dispersed in the hydrogel, which proved that an integrated Fe3O4@GO/P(NIPAM–MAA) hydrogel has been prepared.
Characteristics of nanoparticles
Fig. 5(a) depicts the full XPS spectra of Fe3O4 and Fe3O4@GO and the high-resolution narrow-area XPS image of Fe2p, O1s, and C1s. In Fig. 5(a1), there were no obvious peak shifts due to hybridization. In the XPS spectrum of Fe3O4@GO, it can be seen that some strong electron binding energy peaks appear at about 711 eV, 532 eV, and 285 eV, respectively, corresponding to the characteristic peaks of Fe2p, O1s, and C1s, indicating that the prepared Fe3O4@GO sample contains at least Fe, O, and C elements.30 In the XPS spectrum of the Fe2p narrow region, strong electron binding energy peaks appear at 710.7 eV and 724.3 eV, respectively, corresponding to Fe2p3/2 and Fe2p1/2 in Fe3O4, indicating that the prepared samples contain Fe2+ and Fe3+.31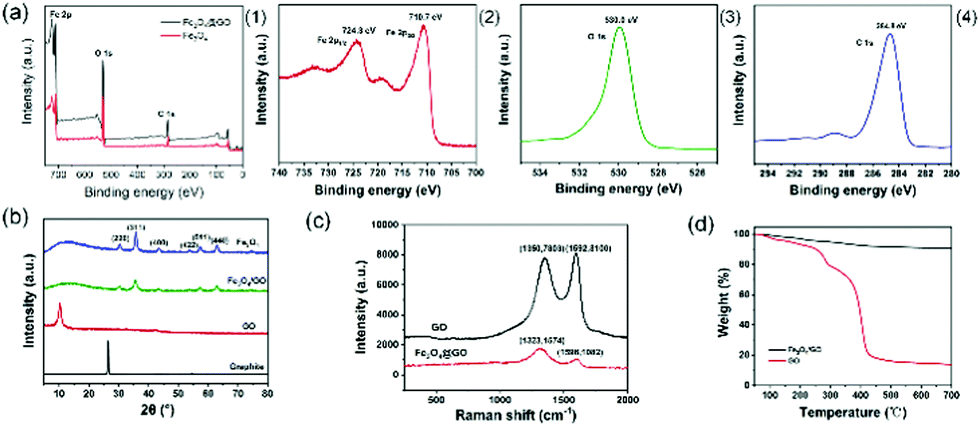 | ||
| Fig. 5 (a) XPS spectra of Fe3O4@GO and Fe3O4 (1), Fe2p (2), O1s (3) and C1s (4). (b) XRD patterns of graphite, GO, Fe3O4 and Fe3O4@GO. (c) Raman spectra of GO and Fe3O4@GO. (d) TGA curves of GO and Fe3O4@GO. | ||
Fig. 5(b) illustrates the XRD patterns of graphite, GO, Fe3O4 and Fe3O4@GO nanoparticles. Comparing the XRD spectra of graphite and GO, when graphite was converted into GO through strong oxidation treatment, the original sharp diffraction peak at about 26° disappears, while a weaker diffraction peak appeared at about 10°, and the layer spacing increased, which was caused by the insertion of oxygen-containing functional groups between graphite and flakes. Comparing Fe3O4 and Fe3O4@GO, it was found that the two XRD patterns were roughly the same, showing the characteristic peaks of Fe3O4 instead of GO. The reason why the characteristic peaks of GO disappear was that during the co-precipitation reaction, the attachment and growth of Fe3O4 on the GO surface destroyed the orderly stacking of GO sheets, making GO present a state of disordered exfoliation in the entire composite material system.32
Fig. 5(c) reveals the Raman spectra of GO and Fe3O4@GO. The crystal characteristic peaks of carbon atoms are the D peak at 1300 cm−1 and the G peak at 1580 cm−1.33 Peak D is the disordered vibration peak of carbon atoms. Its formation and position change involve a double resonance Raman process of defect scattering, which is caused by the movement of the lattice away from the Brillouin centre and used to characterize defects in the sample. Peak G is caused by the in-plane stretching vibration of SP2 hybrid carbon atoms.34 Compared with GO, the D peak of Fe3O4@GO moved from 1350 cm−1 to 1323 cm−1, the peak intensity became weaker, and the peak shape became wider, indicating that the introduction of Fe3O4 nanoparticles made GO exhibit higher disorder and more defects. The G peak moved from 1592 cm−1 to 1598 cm−1. The Raman shift of the G peak confirmed the charge transfer between GO and Fe3O4 in the chemical co-precipitation reaction, indicating that a strong interaction force was formed between GO and Fe3O4. The intensity ratio of peak D to peak G (ID/IG) is an important parameter that characterizes the disorder of the surface structure of carbon-based materials.35 Compared with GO, the ID/IG of Fe3O4@GO increased from 0.96 to 1.45, indicating that GO had formed defects in the two-dimensional crystal structure of carbon atoms after magnetic functional modification.
Fig. 5(d) describes the TGA curves of GO and Fe3O4@GO samples. In the TGA curve of GO, when the temperature is below 200 °C, there would be a slight weight loss, which is mainly caused by the removal of physically adsorbed water molecules on the surface of the GO sample. In the temperature range of 200–400 °C, it had a severe weight loss because of the thermal decomposition of the oxygen-containing functional groups in GO. In the temperature range of 400–700 °C, GO had a slow and stable weight loss, which was caused by the removal of more stable oxygen-containing functional groups in GO and the thermal decomposition of the carbon skeleton.36 However, Fe3O4@GO had less weight loss in the whole temperature range, and the thermal weight loss curve only slightly dropped when the temperature was above 200 °C. The reason is that a strong interfacial bonding force is formed between Fe3O4 and GO, indicating that the thermal stability of Fe3O4@GO is higher than that of GO. The BET surface areas of GO before and after modification with Fe3O4 were 479.676 m2 g−1 and 153.678 m2 g−1, respectively.
Temperature-sensitivity and mechanical properties
Isopropylacrylamide (NIPAM) is currently the most representative temperature-sensitive hydrogel. From the perspective of the structure, the monomer NIPAM contains CC, which is easy to open for radical polymerization. NIPAM contains both a hydrophilic amide and a hydrophobic isopropyl, which exhibits temperature sensitivity by adjusting the ratio of amide and isopropyl.37 Since the lower critical solution temperature (LCST) of NIPAM is close to the human temperature (32 °C), the LCST of the hydrogel can be adjusted according to the hydrophilicity and hydrophobicity of another functional monomer – methacrylic acid (MAA). The influence of different MAA content on the LCST of the P(NIPAM–MAA) thermos-sensitive hydrogel is shown in Table 2. When the temperature is below LCST, a strong hydrogen bond is formed between the amide and the water molecule, which presents macroscopic hydrophilicity and volume expansion. When the temperature is above the LCST, the hydrophobicity of the isopropyl is dominant, and the hydrogel macroscopically exhibits volume shrinkage.
| Monomer 1 | Monomer 2 (%) | Crosslinkers | Initiator | Catalyst | LCST (°C) |
|---|---|---|---|---|---|
| NIPAM | MAA 0.0 | BIS | APS | TMEDA | 32 |
| NIPAM | MAA 0.2 | BIS | APS | TMEDA | 33 |
| NIPAM | MAA 0.4 | BIS | APS | TMEDA | 34 |
| NIPAM | MAA 0.6 | BIS | APS | TMEDA | 35 |
| NIPAM | MAA 0.8 | BIS | APS | TMEDA | 36 |
| NIPAM | MAA 1.0 | BIS | APS | TMEDA | 37 |
Fig. 6(a) denotes the DSC curve of the hydrogel, that is, the endothermic and exothermic reaction as a function of temperature. When the hydrogel undergoes a phase transition, there would be a downward endothermic peak on the DSC curve.38 The LCST of the pure PNIPAM hydrogel was around 32 °C. With the increase of MAA content, the LCST increased accordingly, and the endothermic peak on the corresponding DSC curve would gradually move to the right. Under the condition that the content of MAA is 1%, the LCST of the hydrogel is 37 °C. Fig. 6(b) shows the dependence of the light transmittance for the hydrogel on temperature. When the temperature is below the LCST, the light transmittance of the hydrogel was higher and the change was relatively small. When the temperature increased to LCST, the light transmittance dropped sharply to 0.39 The LCST of the pure PNIPAM hydrogel was around 32 °C. With the increase of MAA content, the inflection points of the sharp drop in light transmittance on the corresponding curve would gradually move to the right. When the content of MAA is 1%, the LCST of the hydrogel is 37 °C, which demonstrates that the prepared hydrogel has a good temperature sensitivity property.
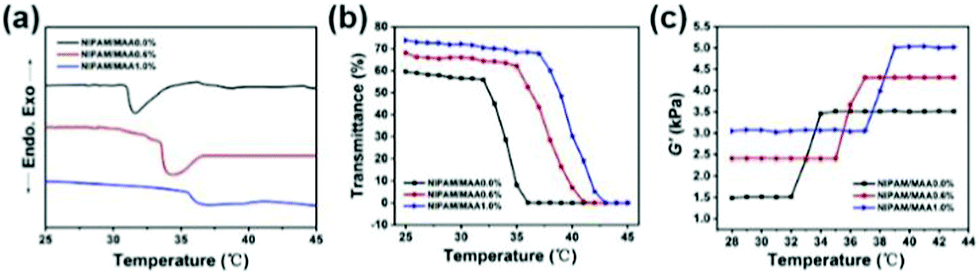 | ||
| Fig. 6 (a) DSC curve of the hydrogels. (b) Dependence of the light transmittance for the hydrogel on temperature. (c) Dependence of the shear modulus for the hydrogel yield on temperature. | ||
Fig. 6(c) indicates the dependence of the shear modulus for the hydrogel yield on temperature. When the temperature was below the LCST, the shear modulus of the hydrogel was smaller and tended to be stable. When the temperature reached the LCST, the shear modulus of the hydrogel changed sharply. As the temperature continued to increase above the LCST, the shear modulus of the hydrogel increased to the maximum and no longer changes.40 The shear modulus values of P(NIPAM–MAA) hydrogels with MAA content of 0.0%, 0.6%, and 1.0% are about 3500 Pa, 4400 Pa, and 5000 Pa, respectively, indicating that with the increase of MAA content, the mechanical properties of the P(NIPAM–MAA) hydrogel are improved, and are on the same order of magnitude as that of brain tissues (Pa–kPa).41
Resistivity and electrochemical performance
Fig. 7(a) illustrates the sheet resistance of the Fe3O4@GO/P(NIPAM–MAA) hydrogel. The thickness of the hydrogel sample is 4 mm, so according to the formula, the resistivity of the Fe3O4@GO/P(NIPAM–MAA) hydrogel is 119.48 Ω m. The hydrogel material exhibits excellent electrical conductivity, which is sufficient to support the signal transmission.42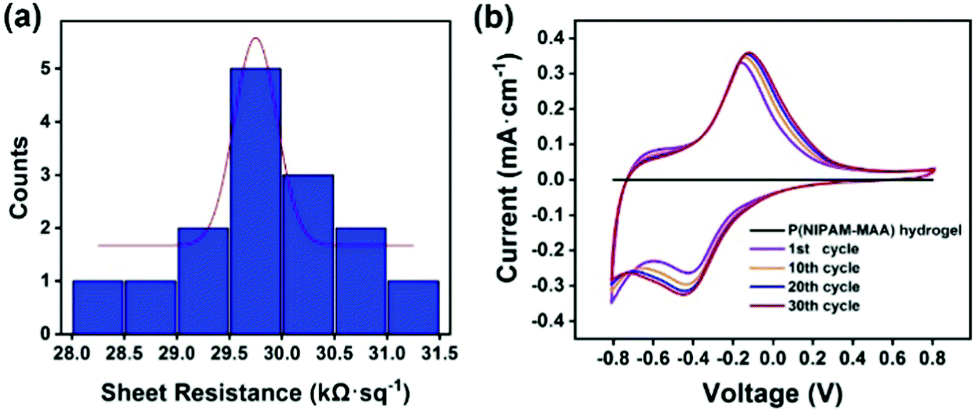 | ||
| Fig. 7 (a) Sheet resistance of the Fe3O4@GO/P(NIPAM–MAA) hydrogel. (b) Cyclic voltammetry curve of the Fe3O4@GO/P(NIPAM–MAA) hydrogel. | ||
Fig. 7(b) shows the cyclic voltammetry (CV) curve of the hydrogels when the test voltage window is −0.8–0.8 V at a scan rate of 10 mV s−1. It can be seen that when the Fe3O4@GO dispersed phase is not added, the CV pattern of the P(NIPAM–MAA) hydrogel is a straight line parallel to the X axis, indicating that it does not have electrical conductivity. Compared with the P(NIPAM–MAA) hydrogel, the CV pattern of the Fe3O4@GO/P(NIPAM–MAA) hydrogel is close to a rectangle, and the area enclosed by the CV curve is larger, indicating that the prepared hydrogel electrode has a larger charge storage capacity, which proves that the prepared Fe3O4@GO/P(NIPAM–MAA) hydrogel electrode material has better electrochemical performance. The electrode material exhibits a good charge injection capability, which mainly depends on the huge and effective contact area provided by the Fe3O4@GO/P(NIPAM–MAA) hydrogel. When the scanning voltage is reversed, the corresponding current would also be reversed, which indicates that the electrode material has good redox reversibility and is suitable for use as a flexible electrode material for the brain–computer interface. In addition, the shape of the CV pattern after 30 scanning cycles is approximately the same, showing that it has good electrochemical stability. This is of great significance to the BCI electrode, which can make the collection of EEG signals more stable, and is also conducive to the recording and transmission of the EEG signals.
The polarization curve represents the curve of the relationship between the electrode potential (V) and the current density (I) on the electrode. The steeper the polarization curve, the greater the degree of potential deviation, the stronger the polarization, that is, the greater the obstruction of the electrode process. As shown in Fig. 8, the curve of the Fe3O4@GO/P(NIPAM–MAA) hydrogel with the bio-potential electrode is gentle, indicating that the degree of polarization is small and the electrode process is relatively successful.
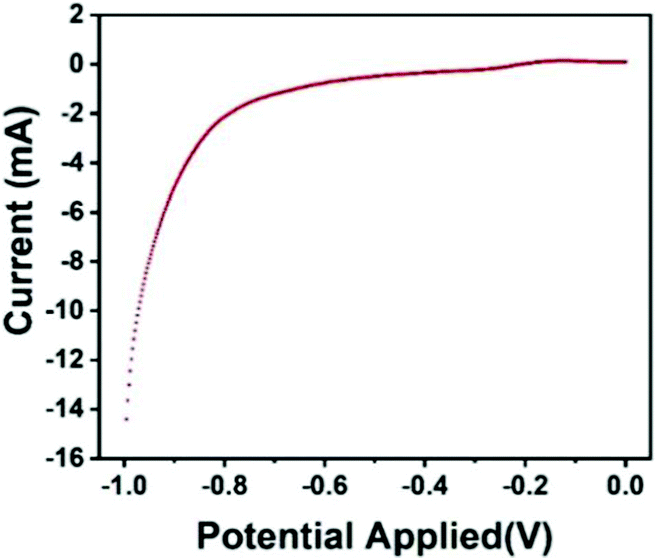 | ||
| Fig. 8 Electrode polarization curve of the Fe3O4@GO/P(NIPAM–MAA) hydrogel. | ||
Magnetic properties of the Fe3O4@GO/P(NIPAM–MAA) hydrogel
Fig. 9(a) indicates the magnetic hysteresis curves of Fe3O4, Fe3O4@GO, and Fe3O4@GO/P(NIPAM–MAA) hydrogels. Their saturation magnetization values were 60, 58, and 10 emu g−1 respectively. GO and hydrogels are non-magnetic materials, and their introduction would decrease the magnetic properties of the Fe3O4@GO/P(NIPAM–MAA) hydrogel.43 Therefore, the magnetic properties of the Fe3O4@GO/P(NIPAM–MAA) hydrogel mainly depend on the content of Fe3O4 nanoparticles. As shown in Fig. 9(b), they had no hysteresis loop at room temperature, and the remanence and coercivity were both 0, which proved that they have superparamagnetism at room temperature. Superparamagnetism is of great significance to magnetic nanoparticles. It can neglect the interaction between nanoparticles, making them uniformly dispersed in aqueous solution without serious agglomeration.44 More importantly, the materials can be reused without being influenced by “history”. In other words, when no magnetic field is applied, the material is completely restored to its previous state.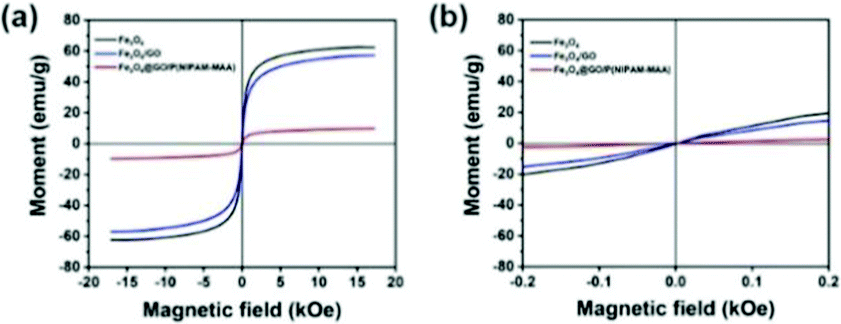 | ||
| Fig. 9 (a) Magnetic hysteresis curves of Fe3O4, Fe3O4@GO, Fe3O4@GO/P(NIPAM–MAA) hydrogels. (b) Detailed view of the magnetic hysteresis curves. | ||
Rheological properties of the Fe3O4@GO/P(NIPAM–MAA) hydrogel
The test tube inversion method45 was used to macroscopically analyze the injectable properties of the P(NIPAM–MAA) hydrogel. Initially, the hydrogel precursor solution is injected into the test tube with a sterile syringe. After observing and recording for a period of time, the test tube was turned upside down by 180°. Fig. 10(a) describes the viscous liquid state before injection, and Fig. 10(b) shows the final gel state. It took 132 s to record this process according to the stopwatch timer. In order to further quantitatively analyze the gelation time of the hydrogel, we used a rheometer to test the viscosity of the hydrogel. As shown in Fig. 10(c), it was a liquid at the beginning, and the hydrogel had a lower viscosity. As time goes by, the viscosity of the hydrogel would increase. When the viscosity of the hydrogel no longer continued to increase, the hydrogel had been solidified and formed. The viscosity of the hydrogel was below 500 Pa s at the beginning of injection which can ensure the spreadability of the electrode material, indicating that the prepared hydrogel has good injectability. And the gelation time was about 120 s, ensuring a sufficient and security magnetization time.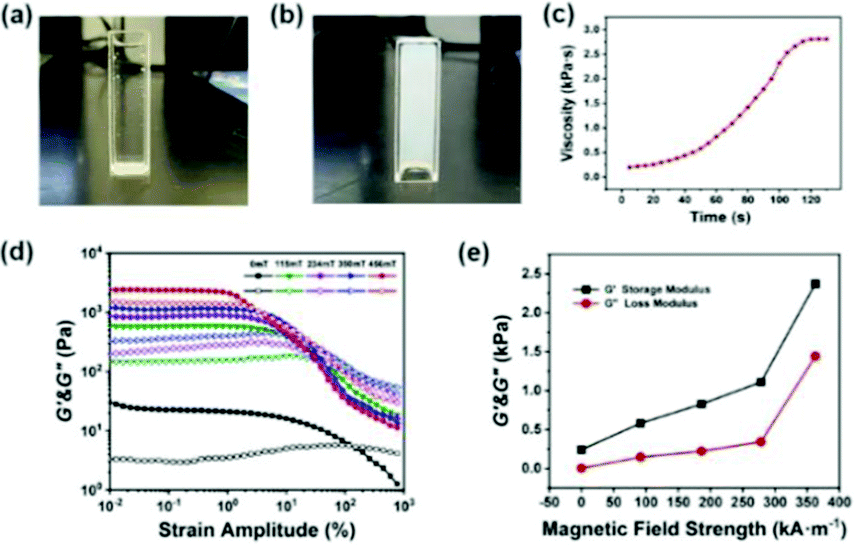 | ||
| Fig. 10 (a) The viscous liquid state of the hydrogel before injection. (b) The final gel state of the hydrogel. (c) Dependence of viscosity for the hydrogel on time. (d) Dependence of the G′&G′′ for the Fe3O4@GO/P(NIPAM–MAA) hydrogel on shear strain amplitude under different magnetic field strengths. (e) Dependence of the G′&G′′ for the Fe3O4@GO/P(NIPAM–MAA) hydrogel on magnetic field strength. | ||
Fig. 10(d) indicates the dependence of the storage modulus (G′) and loss modulus (G′′) for the Fe3O4@GO/P(NIPAM–MAA) hydrogel on shear strain amplitude under different magnetic field strengths. Without applying an external magnetic field, neither the storage modulus nor the loss modulus of the magnetic hydrogel has an obvious plateau stage. When an external magnetic field is applied, the G′ of the hydrogel remains unchanged at a low strain amplitude, and a small plateau appears. When the critical strain amplitude is reached, the G′ decreases with the increase of strain amplitude, and the G′′ increases firstly and then decreases with the increase of strain amplitude. In the case of low shear strain amplitude, the G′ is higher than the G′′, which is in a viscoelastic state. When the strain amplitude exceeds a certain critical value, the G′ is lower than the G′′, which is in a flowing state. Below the critical strain amplitude, the region in which the modulus value remains constant is called the linear viscoelastic region. While after the critical strain amplitude is exceeded, the G′ and the G′′ decrease rapidly, which is called the nonlinear viscoelastic zone.46 With the increase of the magnetic field strength, the linear viscoelastic region of the hydrogel gradually decreases, and the nonlinear viscoelastic region gradually increases. The intersection points of the G′ and the G′′ curves gradually shifts to left, in other words, the hydrogel would reach a flowing state under lower shear strain, exhibiting a significant magnetorheological effect.
Fig. 10(e) shows the dependence of the storage modulus and loss modulus for the Fe3O4@GO/P(NIPAM–MAA) hydrogel on magnetic field strength. It can be seen that the G′ and the G′′ of the Fe3O4@GO/P(NIPAM–MAA) hydrogel both increase with the increase of magnetic field strength. Under the same strain amplitude, with the increase of the magnetic field strength, due to the polarization, the mutual attraction between the magnetic particles in the hydrogel increases, making the internal network structure more stable and exhibiting higher storage modulus. At the same time, in order to be able to change this network structure, a higher energy is required, that is, the loss modulus also increases.
Demonstration of magnetic controlled spreading
The magnetic control deformation simulation experiment was conducted on a plastic brain model (Fig. 11) at 37 °C. First, Fe3O4@GO/P(NIPAM–MAA) hydrogel solution was injected on the surface model (Fig. 11a). During its transition from sol to gel, we applied an external magnetic field using two magnets, and then the hydrogel underwent significant deformation (Fig. 11b). As the position of the applied magnetic field changes, the hydrogel continues to deform in all directions. After 120 s, the sol–gel transition process was finished, and the morphology of the hydrogel was fixed (Fig. 11c). It can be seen from the demonstration results that the deformation of the hydrogel can be actively controlled by applying an external magnetic field, indicating that the Fe3O4@GO/P(NIPAM–MAA) hydrogel has good magnetorheological properties.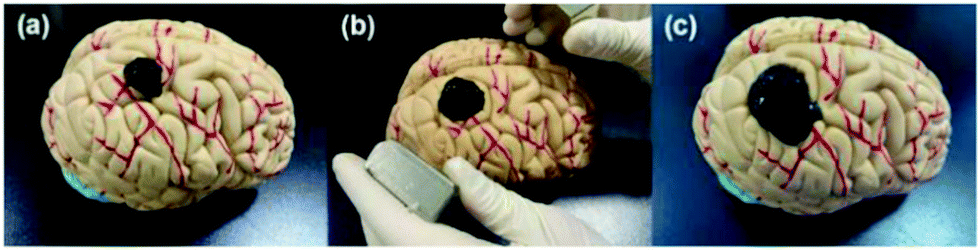 | ||
| Fig. 11 Demonstration of magnetic controlled spreading. (a) Initial state after injection. (b) Directional deformation by applying a magnetic field. (c) The final morphology of the hydrogel. | ||
EEG signal acquisition performance of the hydrogel electrode
In order to verify the feasibility of the EEG signal acquisition test, a preliminary experiment was first carried out. The Fe3O4@GO/P(NIPAM–MAA) hydrogel was injected into the CP5 and CP6 channels of the electrode cap. As a comparison, the wet electrode conductive paste was injected into the Pz channel, the main component of which was the conductive polymer carboxymethyl cellulose. When the electrode material was injected, the contact resistance of the two materials was within the allowable range (less than 20 kΩ). Fig. 12(a) illustrates the change curve of the voltage amplitude of the EEG signals collected by the hydrogel electrode and the wet electrode in a time interval of 20 s, and Fig. 12(b) and (c) depict the random selection of 11–12 s and 18–19 s for EEG signals. The test results show that the EEG signal waveform and signal amplitude collected by the Fe3O4@GO/P(NIPAM–MAA) hydrogel electrode and the wet electrode are basically the same, indicating that the prepared hydrogel electrode material can obtain and record effective EEG signals.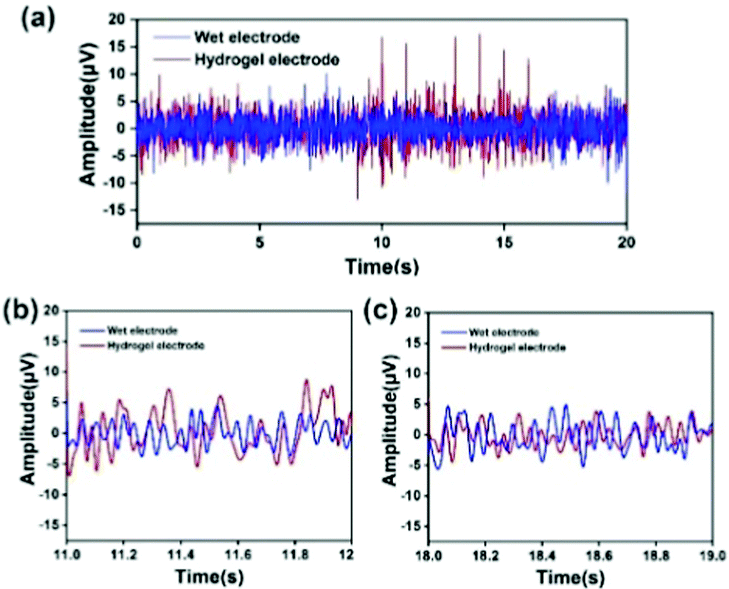 | ||
| Fig. 12 (a) Voltage amplitude of the electroencephalogram signal collected by the hydrogel electrode and the commercial wet electrode in a time interval of 20 s. (b) Randomly selected 11–12 s for EEG signal recording. (c) Randomly selected 11–12 s for EEG signal recording. | ||
The human brain has about 6.66 × 10⁴ nerves per cubic millimeter, and the EEG signal has the characteristics of weak amplitude, strong randomness, and susceptibility to interference. Therefore, it is usually necessary to collect multi-channel signals at the same time when collecting EEG signals. In order to rule out chance, the Fe3O4@GO/P(NIPAM–MAA) hydrogel was injected into 34 channels of the electrode cap to collect EEG signals in the whole brain.
Taking the FC1 channel as an example, Fig. 13 shows the selected segment records of this channel every 0.5 h during the whole test. It can be seen that the EEG data collected by the FC1 channel are relatively stable, and the voltage amplitude of the EEG signal is within 80 μV. The average voltage amplitudes of the recorded EEG signals in the six time periods were 11.29, 11.71, 14.73, 23.28, 14.53, and 17.35 μV, and the signal basically did not attenuate. This shows that with the passage of time, the hydrogel can maintain good contact with the scalp, and the intrinsic impedance of the electrode and the quality of the recorded EEG signals have not changed significantly. However, the quality of the EEG signals recorded in the second half of the time is obviously not as good as the first half of the time, which may be due to the subject's mental state of fatigue and restlessness during the long test process. Based on the change trend of EEG signal intensity recorded by the FC1 channel over time, the Fe3O4@GO/P(NIPAM–MAA) hydrogel can be used as an ideal BCI electrode material, which can meet the normal monitoring activities of brain–computer interconnection equipment.
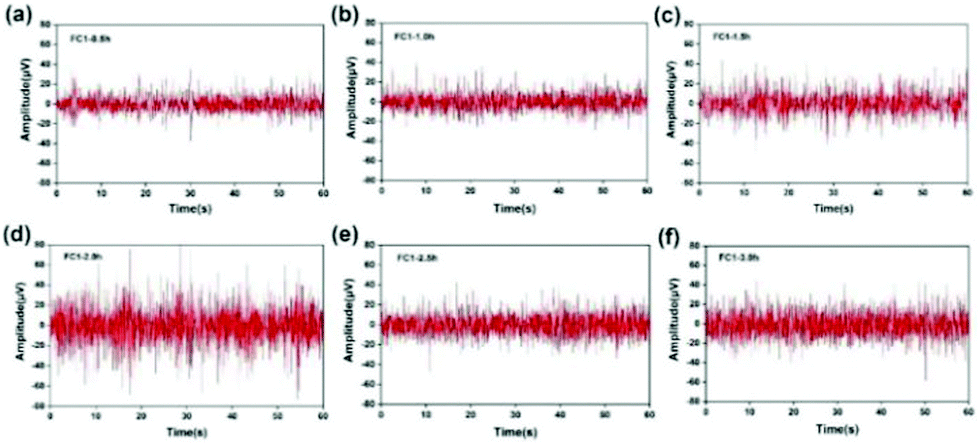 | ||
| Fig. 13 FC1 channel selection recorded every 0.5 h during the test. (a) Recorded at 0.5 h. (b) Recorded at 1.0 h. (c) Recorded at 1.5 h. (d) Recorded at 2.0 h. (e) Recorded at 2.5 h. (f) Recorded at 3.0 h. | ||
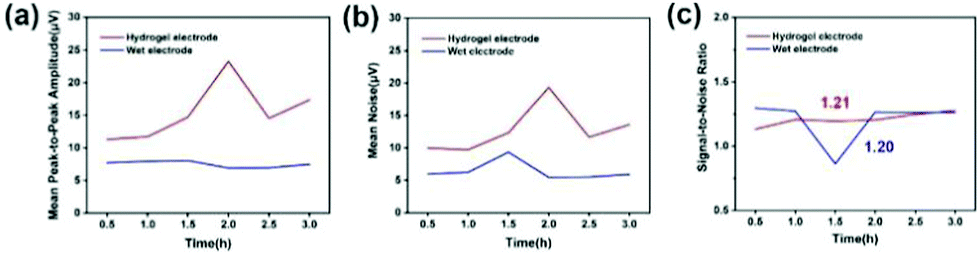
The signal-to-noise ratio (SNR) is used to characterize the quality and intensity of the collected EEG signals, and the SNR is defined by the ratio of the signal level to the noise level. Generally speaking, the larger the SNR, the better the quality of the collected and recorded EEG signals and the higher the intensity. For signals, the peak-to-peak amplitude of the average waveform was calculated, and then the average peak amplitude was taken and it was recorded as the signal level (A). For noise, the peak-to-peak amplitude of the average waveform is subtracted from the peak-to-peak amplitude of all waveforms, and the standard deviation is calculated from the result value. Two times the average standard deviation is recorded as the noise level (ε). Fig. 14(a)–(c) indicates the average peak amplitude, average noise amplitude and signal-to-noise ratio of the EEG signals during the entire recording period. Compared with wet electrodes, hydrogel electrodes have a higher average peak-to-peak value, but also exhibit higher noise levels. According to statistical calculations, during the entire recording period, although the average signal-to-noise ratios of the hydrogel electrode and the wet electrode are similar, 1.21 and 1.20, respectively, the signal-to-noise ratio of the hydrogel electrode material is more stable. This indicates that the signal-to-noise ratios of the EEG signals recorded by the two electrode materials are similar. If the hydrogel electrode is used as a semi-invasive electrode, it would have a much higher signal-to-noise ratio, because the electrode is directly placed on the surface of cerebral cortex without the barrier of the skull.
 | ||
| Fig. 14 (a) Mean peak to peak amplitude over the entire recording period. (b) Mean noise amplitude over the entire recording period. (c) Signal-to-noise ratio over the entire recording period. | ||
Conclusions
In this work, we demonstrated fabrication, characterization, and performance of a novel semi-invasive brain–computer interface flexible electrode composite made from Fe3O4@GO and P(NIPAM–MAA) hydrogels. We found that the composite can transform from sol to gel at body temperature within 120 s. The composite has significant magnetorheological properties, and enables us to control its expansion by applying a remote magnetic field during the gelation process. The gelled composite has an interpenetrating three-dimensional porous network structure and low resistivity, which make it provide an access channel for signal transmission. Compared with the non-invasive BCI electrodes, the electrode based on this composite is injectable and could actively expand on the surface of the cerebral cortex, which makes it have a higher signal-to-noise ratio and avoid potential wrinkles and tangles of the electrode. When compared with the invasive electrodes, it would have greater security. The novel composite seems to be an ideal material for developing the next generation semi-invasive BCI electrodes with a good balance between the signal-to-noise ratio and security. To be sure, for non-invasive BCI electrodes, hydrogel electrodes could exhibit a higher signal-to-noise ratio. Obviously, the resolution of the hydrogel electrode is lower than that of the invasive BCI electrode. In any case, semi-invasive BCI hydrogel electrodes still have research prospects in some special applications.Semi-invasive electrodes have attracted wide spread attention in the academic world due to their unique advantages such as low material cost, simple and efficient preparation, no irritation or sensitization and so on. However, concerning the semi-invasive electrodes, we need to continue to explore the problems of precise positioning, smooth injection and intelligent controlled release. In addition, on the basis of full consideration of safety and ethical issues, we should continue to explore the semi-invasive way of collecting and recording EEG in the scalp using hydrogel electrode materials. In a nutshell, the research on semi-invasive flexible electrodes in various countries is still in its infancy and there are relatively few related reports. Anyway, with the increasing demands of the BCI around the world, the development of such electrodes would make breakthrough progress.
Author contributions
Guangwei He: methodology, writing – original draft preparation; Yu Tong: rheology analysis; Chi Zhang: EEG signal acquisition; BeiBei Xue: testing; Xufeng Dong: supervision, conceptualization, writing – reviewing and editing; Shouhu Xuan: suggestions; Peixin Sun: visualization, EEG signal acquisition; Min Qi: validation, supervision.Conflicts of interest
There are no conflicts to declare.Acknowledgements
This work was supported by the Fundamental Research Funds for the Central Universities under the grant number of DUT20YG105.Notes and references
- J. R. Wolpaw, N. Birbaumer, W. J. Heetderks, D. J. McFarland, P. H. Peckham, G. Schalk, E. Donchin, L. A. Quatrano, C. J. Robinson and T. M. Vaughan, IEEE Trans. Rehabil. Eng., 2000, 8, 164–173 CrossRef CAS PubMed.
- L. F. Nicolas-Alonso and J. Gomez-Gil, Sensors, 2012, 12, 1211–1279 CrossRef PubMed.
- M. Bates, IEEE Pulse, 2017, 8, 22–26 Search PubMed.
- T. S. Pan, J. H. Jiang, J. Li, T. Liu, S. Yu, X. T. Sun, Z. C. Yan, S. H. Chen, Y. Fan, M. Gao, X. Deng, T. J. Liu, D. Z. Yao, Y. Xia and Y. Lin, Composites, Part B, 2020, 204, 108475 CrossRef.
- C. Y. Li and W. J. Zhao, Natl. Sci. Rev., 2020, 7, 249–252 Search PubMed.
- L. Q. Mao, ACS Sens., 2020, 5, 2659–2660 CrossRef CAS PubMed.
- X. H. Guo, W. H. Pei, Y. J. Wang, Q. Gui, H. Zhang, X. Xing, Y. Huang, H. D. Chen, R. C. Liu and Y. Liu, 38th Annual International Conference of the IEEE Engineering in Medicine and Biology Society (EMBC), 2016.
- J. He, P. Xiao, J. W. Shi, Y. Liang, W. Lu, Y. S. Chen, W. Q. Wang, P. S. Theato, W. Kuo and T. Chen, Chem. Mater., 2018, 30, 4343–4354 CrossRef CAS.
- H. Q. Hua, W. Tang, X. M. Xu, D. Feng and L. Shu, Micromachines, 2019, 10, 518 CrossRef PubMed.
- S. Lin, J. C. Liu, W. Z. Li, D. Wang, Y. Huang, C. Jia, Z. W. Li, M. Murtaza, H. Y. Wang, J. N. Song, Z. L. Liu, K. Huang, D. Zu, M. Lei, B. Hong and H. Wu, Nano Lett., 2019, 19, 6853–6861 CrossRef CAS PubMed.
- S. Lin, T. Y. Xu and X. M. Xu, IEEE Sens. J., 2019, 19, 5995–6005 Search PubMed.
- S. K. Ameri, R. Ho, H. W. Jang, T. Li, Y. H. Wang, L. Wang, D. M. Schnyer, D. Akinwande and N. S. Lu, ACS Nano, 2017, 11, 7634–7641 CrossRef PubMed.
- A. F. Renz, A. M. Reichmuth, F. Stauffer, G. Thompson-Steckel and J. Vörös, J. Neural Eng., 2018, 15, 061001 CrossRef PubMed.
- Z. L. Xiang, S. C. Yen, S. Sheshadri, J. H. Wang, S. Lee, Y. H. Liu, D. Liao, N. V. Thakor and C. K. Lee, Adv. Mater., 2016, 28, 4472–4479 CrossRef CAS PubMed.
- B. Ji, Z. Q. Xie, W. Hong, C. P. Jiang, Z. J. Guo, L. C. Wang, X. L. Wang, B. Yang and J. Q. Liu, J. Materiomics, 2019, 6, 330–338 CrossRef.
- H. S. Sohal, J. Andrew, J. Richard, C. Gavin-J, V. Konstantin, O. Anthony and B. Stuart, Front. Neurosci., 2014, 7, 00010 Search PubMed.
- Z. L. Xiang, J. Q. Liu and C. K. Lee, Microsyst. Nanoeng., 2016, 2, 16012 CrossRef CAS PubMed.
- Y. C. Zhang, N. Zheng, Y. Cao, F. L. Wang, P. Wang, Y. J. Ma, B. W. Lu, G. H. Hou, Z. Fang and Z. W. Liang, Sci. Adv., 2019, 5, 1066 CrossRef PubMed.
- J. B. Ji, M. H. Wang, C. H. Ge, Z. Q. Xie, Z. J. Guo, W. Hong, X. W. Gu, L. C. Wang, Z. R. Yi, C. P. Jiang, B. Yang, X. L. Wang, X. Y. Li, C. Y. Li and J. Q. Liu, Biosens. Bioelectron., 2019, 135, 181–191 CrossRef PubMed.
- F. Decataldo, T. Crame, D. Martelli, I. Gualandi, W. S. Korim, S. T. Yao, M. Tessarolo, M. Murgia, E. Scavetta, R. Amici and B. Fraboni, Sci. Rep., 2019, 9, 1–9 CAS.
- S. Lee, W. Y. X. Peh, J. H. Wang, F. Y. Yang, J. S. Ho, N. V. Thakor, S. C. Yen and C. K. Lee, Adv. Sci., 2017, 4, 1700149 CrossRef PubMed.
- S. Guan, J. Wang, X. Gu, Y. Zhao, R. Hou, H. Fan, L. Zou, L. Gao, M. Du, C. Li and Y. Fang, Sci. Adv., 2019, 5, 2842 CrossRef PubMed.
- G. W. He, X. F. Dong and M. F. Qi, Mater. Res. Express, 2020, 7, 102001 CrossRef CAS.
- T. Zhou, G. S. Hong, T. M. Fu, X. Yang, T. G. Schuhmann, R. D. Viveros and C. M. Lieber, Proc. Natl. Acad. Sci. U. S. A., 2017, 114, 5894–5899 CrossRef CAS PubMed.
- J. Liu, T. M. Fu, Z. G. Cheng, G. S. Hong, T. Zhou, L. H. Jin, M. Duvvuri, Z. Jiang, P. Kruskal, C. Xie, Z. G. Suo, Y. Fang and C. M. Lieber, Nat. Nanotechnol., 2018, 10, 629 CrossRef PubMed.
- G. S. Hong, X. Yang, T. Zhou and C. M. Lieber, Curr. Opin. Biotechnol, 2018, 50, 33–41 CAS.
- W. S. Hummers and R. E. Offeman, J. Am. Chem. Soc., 1958, 80, 1339 CrossRef CAS.
- Y. Li, J. Chu, J. Y. Qi and X. Li, Appl. Surf. Sci., 2011, 257, 6059–6062 CrossRef CAS.
- W. S. Huang, J. F. Shen, N. Li and M. X. Ye, Polym. Eng. Sci., 2015, 55, 1361–1366 CrossRef CAS.
- H. P. Cong, J. He, Y. Lu and S. H. Yu, Small, 2010, 6, 169–173 CrossRef CAS PubMed.
- H. A. Becerril, J. Mao, Z. F. Liu, R. M. Stoltenberg, Z. N. Bao and Y. S. Chen, ACS Nano, 2008, 2, 463–470 CrossRef CAS PubMed.
- J. Kan and Y. Wang, Sci. Rep., 2013, 3, 3502 CrossRef PubMed.
- S. Alwarappan, A. Erdem, C. Liu and C. Z. Li, J. Phys. Chem. C, 2009, 113, 8853–8857 CrossRef CAS.
- C. Thomsen and S. Reich, Phys. Rev. Lett., 2000, 85, 5214–5217 CrossRef CAS PubMed.
- A. C. Ferrari and J. Robertson, Phys. Rev. B: Condens. Matter Mater. Phys., 2000, 61, 14095–14107 CrossRef CAS.
- J. Q. Wan, W. Cai, X. Meng and E. Z. Liu, Chem. Commun., 2007, 5004–5006 RSC.
- C. H. Zhu, Y. Lu, J. Peng, J. F. Chen and S. H. Yu, Adv. Funct. Mater., 2012, 22, 4017–4022 CrossRef CAS.
- R. Dinarvand and A. Emanuele, J. Controlled Release, 1995, 36, 221–227 CrossRef CAS.
- Z. W. Ren, Y. Wang, S. Q. Ma, S. Duan, X. P. Yang, P. Gao, X. Zhang and Q. Cai, ACS Appl. Mater. Interfaces, 2015, 7, 19006–19015 CrossRef CAS PubMed.
- X. M. Ma, Y. H. Li, W. C. Wang, Q. Ji and Y. Z. Xia, Eur. Polym. J., 2013, 49, 389–396 CrossRef CAS.
- S. M. Wellman, J. R. Eles, K. A. Ludwig, J. P. Seymour, N. J. Michelson, W. E. McFadden, A. L. Vazquez and T. D. Y. Kozai, Adv. Funct. Mater., 2018, 28, 1701269 CrossRef PubMed.
- H. Jang, Y. J. Park, X. Chen, T. Das, M. S. Kim and J. H. Ahn, Adv. Mater., 2016, 28, 4184–4202 CrossRef CAS PubMed.
- Y. Zhang, J. Y. Liu, S. Ma, Y. J. Zhang, X. Zhao, X. D. Zhang and Z. D. Zhang, J. Mater. Sci.: Mater. Med., 2010, 21, 1205–1210 CrossRef CAS PubMed.
- Y. M. Zhai, J. F. Zhai, M. Zhou and S. J. Dong, J. Mater. Chem. C, 2009, 19, 7030–7035 RSC.
- P. Baei, J. F. Sasan, R. Z. Sareh, T. S. Mohammad, H. Baharvand and N. Aghdami, Mater. Sci. Eng., C, 2016, 63, 131–141 CrossRef CAS PubMed.
- M. Cvek, M. Mrlik, M. Ilcikova, J. Mosnacek, L. Munster and V. Pavlinek, Macromolecules, 2017, 50, 2189–2200 CrossRef CAS.
Footnote |
| † Guangwei He and Yu Tong contributed equally to this work. |
| This journal is © The Royal Society of Chemistry 2021 |