DOI:
10.1039/D1MA00619C
(Paper)
Mater. Adv., 2021,
2, 6665-6675
Melt-quenched vanadium pentoxide-stabilized chitosan nanohybrids for efficient hydrazine detection
Received
17th July 2021
, Accepted 26th August 2021
First published on 27th August 2021
Abstract
Nanocrystalline low-dimensional nanostructured vanadium pentoxide (n-V2O5) nanoparticles were synthesized using a hydrothermal and melt-quenching approach without using any reducing agent, acids/bases, and hazardous solvents. Further, the synthesized V2O5 nanoparticles were successfully dispersed in a chitosan (CS) solution for fabricating an organic–inorganic nanohybrid matrix for the electrocatalytic determination of hydrazine to avoid human exposure. Furthermore, this study was supported by various sophisticated tools to characterize the synthesized V2O5 and V2O5–CS films, namely UV-Vis, PL, FTIR, XRD, SEM, AFM, TEM, and EDX. The V2O5–CS nanohybrid showed a substantial sensing strength when deposited onto an indium-tin-oxide (ITO)-coated glass substrate without ultrasonication and studied using amperometry and cyclic voltammetry techniques. Thus, the electrochemical responses against various hydrazine concentrations obtained from the fabricated V2O5–CS/ITO electrode demonstrated high sensitivity, a low detection limit, a quick response time, and a wide linear range of 50.48 μA μM−1 cm−2, 0.084 mM, 20 seconds, and 2–22 mM at a 50 mV scan rate, respectively. Hence, the utilization of V2O5–CS-based inorganic–organic nanohybrid materials fabricates a robust sensing system and a favorable sensing platform with wide applications towards the development of electrochemical sensor devices.
1. Introduction
Hydrazine has demonstrated enormous applications as a pesticide, blowing agent, propellant, insecticide, antioxidant, plant-growth regulator, pharmaceutical intermediate, and corrosion inhibitor.1–3 However, despite its applications, it shows toxicity and acts as a cancer-causing, nephrotoxic material, causing damage to the nervous system and genetic material.4–8 For overcoming these issues, the fast, selective, and efficient electrocatalytic detection of hydrazine is necessary to help avoid human exposure, as, in the environment, hydrazine decomposes very rapidly and does not harm humankind through environmental factors, but when hydrazine is used in agriculture as a pesticide its overuse can lead to uptake by plants/crops, which when consumed by animals and humans can lead to various life-threatening complications like cancer, neurological disorders, etc.9–12 Furthermore, several studies reported in this context for hydrazine sensing centered on various electro-oxidation methods of hydrazine are based on nanostructured materials and polymer nanocomposites.13–17 However, these electrochemical sensors have many drawbacks because of a lack of surface architectures that give an electrochemical sensor a higher sensitivity and specificity against analytes of interest by utilizing nanostructured materials – thus miniaturizing the elements of the sensor and increasing the signal-to-noise ratio at the device interface – and, so far, many nanomaterials with a variable morphology have been used for fabricating electro-oxidation platforms.18–25
Moreover, owing to the multiple valence states and the maximum oxidation state of vanadium, nanostructured V2O5 exhibits enhanced catalytic properties, high electron-transfer kinetics, and an enhanced adsorption capability for charge-transfer characteristics. Therefore, vanadium pentoxide nanostructures (n-V2O5) are promising materialsshowing a high chemical stability and enhanced catalytic activity.19,26–29 Furthermore, chitosan (CS) is a non-toxic biopolymer that exhibits high biocompatibility and film-forming abilities. Many studies30,31 to date have shown that CS is a promising material for synthesizing nanocomposites with various metal and metal oxide nanoparticles, which will offer nanocomposites with extraordinary properties. Thus, here in this study, CS is used to form a nanocomposite with the metal (n-V2O5) due to its film-forming ability and stability to control aggregation, which will stabilize the n-V2O5 film on the electrode surface.32,33 The V2O5–CS inorganic (V2O5)–organic (CS) nanostructured hybrid film was developed for the effective and efficient electrochemical determination of hydrazine in an aqueous solution, and the film was prepared via a simple solution-casting method of this nanohybrid onto an ITO-coated glass substrate, which demonstrated an excellent film-forming ability, charge-transfer characteristics, a large surface area, and a high adsorption capability. Thus, we investigated the fabricated electrochemical device via the smart and intelligent V2O5–CS nanohybrid to monitor hydrazine to avoid human exposure (Fig. 1). Hence, in this work, the used nanocomposite was synthesized using the melt-quenched and hydrothermally derived nanocrystalline V2O5 (n-V2O5) ex situ grafted onto the chitosan (CS) biopolymer as an organic–inorganic nanohybrid material without the use of any reducing agent, acids/bases, and hazardous solvents for the determination of hydrazine; this makes our synthesis procedure unique compared with other pre-existing synthesis methods such as in situ and various other ex situ protocols.
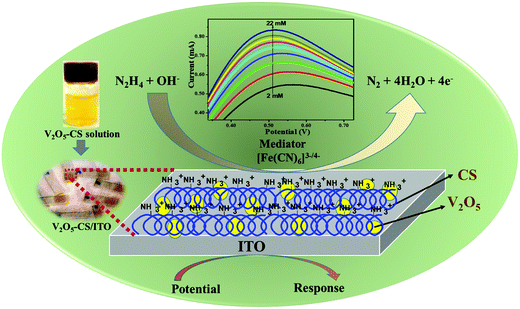 |
| | Fig. 1 Schematic overview of this works. | |
2. Experimental section
2.1. Materials
Vanadium pentoxide (V2O5; molecular weight (MW): 181.88 g mol−1; CAS number: 1314-62-1), hydrogen peroxide (H2O2; MW: 34 g mol−1; Product Cat no. 1.93007.0521), chitosan (CAS number: 9012-76-4), potassium hexacyanoferrate(II) trihydrate (C6FeK4N6·3H2O; MW: 422.39 g mol−1; product cat no.: 1.93686.0521), potassium hexacyanoferrate(III) (C6FeK3N6; MW: 329.25 g mol−1; product cat no.: 1.93667.0521), glacial acetic acid (CH3CO2H; MW: 60.05; CAS number: 64-19-7), sodium chloride (NaCl; MW: 58.44 g mol−1; Product Cat no. S9888) and hydrazine solution (NH2NH2; MW: 32.05; CAS number: 302-01-2) were obtained from Sigma-Aldrich. Sodium hydroxide (NaOH; MW: 40.00 g mol−1; CAS no. 1310-73-2), acetone (C3H6O; MW: 58.08; CAS number: 67-64-1), and ammonia solution (NH3; MW: 17.03 g mol−1; CAS no. Q16225) were obtained from Qualigens, Thermo Fisher Scientific. Disodium phosphate (Na2HPO4·H2O; MW: 177.99; CAS no. 10028-24-7) and monosodium phosphate (NaH2PO4; MW: 119.98; CAS no. 7558-80-7) were procured from Himedia. All the chemicals used for the experiments were of analytical grade, and they were used as received without further purification. The ITO sheets (surface resistivity ∼15 Ω cm−1) for deposition of the V2O5−CS nanohybrid were procured from Sigma-Aldrich. Milli-Q water (18 Ω resistivity), Millipore, USA, was used to perform all the experimental works, and the stock solution of hydrazine was prepared in 5 mM phosphate buffer of pH 6.4.
2.2. n-V2O5 nanoparticle synthesis
The V2O5 nanoparticles were synthesized via hydrothermal and melt-quenching methods, as reported previously34 with some modifications. First, as purchased, micro-size V2O5 (5 g) powder was weighed and kept in a crucible, which was placed in a muffle furnace at 900 °C until the molten phase was achieved; it was then taken out and cooled to room temperature using cold Milli-Q water with continuous stirring for eight hours until the V2O5 sol was finally obtained, and this sol was kept overnight in a sealed airtight bottle for aging before it was transferred to a Teflon-lined stainless steel hydrothermal vessel. Next, this vessel was placed in a hot air oven for 15 hours at 180 °C before being allowed to cool by natural convection to room temperature. Subsequently, a yellow residue was obtained, which was washed several times with Milli-Q water and, lastly, it was washed with ethanol to remove any impurities before being vacuum dried at 50 °C.
2.3. V2O5 nanoparticle electrophoretic deposition (EPD)
EPD was performed using a BioRad, Model 200/0.2 instrument (DC power supply unit). Before EPD, V2O5 nanoparticles (20 mg) were sonicated in 10 mL of absolute ethanol for one hour using an ice bath to avoid alcohol evaporation. After that, a yellow and opaque suspension of V2O5 nanoparticles was obtained. Then, this as-prepared colloidal suspension of V2O5 nanoparticles was transferred to a two-electrode-based electrochemical cell. A platinum electrode was used as the anode and the hydrolyzed ITO-coated glass substrate acted the cathode, where the anode and cathode were parallel to each other and had a separation distance of 1 cm. This setup resulted in the formation of a thin, uniform, and homogeneous V2O5 film on ITO (0.25 cm2) via EPD using the optimal conditions of 25 V for 15 seconds. Moreover, this prepared V2O5/ITO film electrode was washed several times with Milli-Q water followed by ethanol for removing any unbound particles; it was stored at 4 °C for further experiments.
2.4. V2O5–CS/ITO nanohybrid film fabrication
V2O5 nanoparticles (30 mg) were dispersed in a CS solution (1 wt%; 5 mL) and were kept under ultrasonication for two hours, which resulted in a highly viscous solution of CS with V2O5 nanoparticles dispersed uniformly. Then from this viscous solution, a 10 μL sample was aliquoted onto a pre-cleaned ITO-coated glass substrate (0.25 cm2) to form a thin film of the V2O5–CS composite via the drop-casting method; this was then allowed to dry at room temperature. After drying, the thin-film composite was washed using Milli-Q water to remove any unbound particles. Furthermore, the prepared V2O5–CS/ITO electrode was used for performing electro-oxidation studies of hydrazine using the three-electrode system.
2.5. Characterization
Several characterization techniques were used to study the as-prepared V2O5, V2O5/ITO, V2O5–CS, and V2O5–CS/ITO samples. Initially, the ultraviolet-visible (UV-vis) spectra were obtained in the wavelength range of 200–800 nm using a PerkinElmer, Lambda 950 spectrophotometer. Then, the vibration spectra were obtained using a Fourier transform infrared (FTIR) spectrophotometer (Nicolet 380, Thermo Fisher Scientific) in the 400–4000 cm−1 wavenumber range. X-Ray diffraction measurements were carried out using a D8 Advance, Bruker, with Cu-Kα (λ = 1.5406 Å) radiation and a Ni filter in the 2θ angle range of 10–50°. Thermogravimetric (TGA) analysis was performed using a Model-STA 6000 instrument (PerkinElmer, Singapore). Photoluminescence (PL) spectra were obtained utilizing a Fluorolog®-3 spectrofluorometer (Horiba). The energy dispersive X-ray (EDX) and scanning electron microscope (SEM) analyses were performed using a Hitachi S-3700N instrument for elemental confirmation and surface morphology analysis of the as-prepared nanoparticles and nanohybrids. In addition, atomic force microscopy (AFM) (Park Systems, XE 100) was also utilized for determining the surface morphologies of the V2O5/ITO and V2O5–CS/ITO electrodes. Moreover, selected area electron diffraction pattern (SAED) and high-resolution transmission electron microscopy (HR-TEM) micrographs were obtained utilizing an FEI Tecnai G2 F20-Twin, Swiss Confederation instrument. Finally, an Autolab PG workstation, Metrohm, was utilized for performing electro-oxidation studies of hydrazine via the V2O5–CS/ITO electrode using the three-electrode system, in which a platinum wire was used as the counter electrode, V2O5–CS/ITO was the working electrode, and Ag/AgCl was the reference electrode in the presence of a mediator of 5 mM [Fe(CN)6]3−/4− in 50 mM phosphate buffer saline (PBS) at pH 6.4 containing 0.9% NaCl.
3. Results and discussion
3.1. Structural, optical, and morphological characterization of V2O5, V2O5–CS, and V2O5–CS/ITO
The CS, V2O5 nanoparticles and V2O5–CS nanohybrid were initially studied utilizing the UV-vis spectrum, recorded in the 200–500 nm range (Fig. 2(A)). As CS is transparent in the ultraviolet and visible regions thus, determining its optical properties using spectroscopic methods is very difficult. For the V2O5 nanoparticles, the UV-vis spectrum demonstrates two absorption peaks at 248 and 208 nm, while the broad peak that arises at 242 nm in the V2O5–CS nanohybrid is due to the combination of π–π* transitions and n–π* transitions. Furthermore, the optical band gap was calculated using the Tauc plot by plotting (αhν)2vs. hν (eV), as shown in Fig. 2(B). By extrapolating the linear part to the energy axis, the energy band gap (Eg) values obtained are 5.8, 4.4, and 5.95 eV for CS, the V2O5 nanoparticles and the V2O5–CS nanohybrid, respectively. Compared with the V2O5 nanoparticles, the increase in the band gap of the V2O5–CS nanohybrid is due to the V2O5 nanoparticles being successfully intercalated into the CS matrix. The reason behind the increase in the band gap of the nanohybrid is that in CS in the acidic solution phase, the NH2 group of CS is protonated to acquire a positive charge (NH3+), which offers the CS a slightly higher band gap of 5.8 eV, and when CS was crafted with the V2O5 nanoparticles to form the V2O5–CS nanohybrid the conduction band of the nanohybrid increased, becoming 5.95 eV due to the favorable environment provided by the CS, which suppresses the conduction band of V2O5 and offers the nanohybrid an elevated band gap. Furthermore, the thermal behaviour of CS, V2O5 and V2O5–CS nanohybrid was studied using TGA in the temperature range from 30 to 800 °C. The initial weight loss of CS in the temperature range of 50–140 °C is about 16% [Fig. 2(C) (cyan color)], which might be due to the loss of residual moisture in the sample. CS shows a slight weight loss between 140 and 250 °C owing to the decomposition of small chain polymers, followed by a more apparent loss of weight starting from 250 up to 485 °C, which might be ascribed to a multifaceted process including dehydration of the saccharide units in the polymer.35,36 On the other hand, in the TGA curve for the V2O5–CS nanohybrid [Fig. 2(C) (red color)] up to 225 °C, the weight loss of the nanohybrid film is quite small (up to 11%) because of the removal of the absorbed physical and chemical moisture content. When the temperature was increased to higher than 550 °C, the weight loss of up to 45% was significant because CS was decomposed into smaller units. The TGA curve of V2O5 nanoparticles [Fig. 2(C) (green color)] shows that the weight loss in the temperature range of about 30–140 °C is due to the removal of water in the sample.37 Moreover, the V2O5 nanoparticles exhibit a significant weight loss of up to 65% when the temperature is increased to 460 °C. Therefore, although the prepared V2O5–CS nanohybrid exhibits a higher thermal stability than CS and the V2O5 nanoparticles, there was no considerable weight change from 645 °C to 800 °C, implying the presence of only V2O5 within the temperature range. Fig. 2(D) shows the PL spectra of CS, V2O5 nanoparticles and the V2O5–CS nanohybrid performed at the 420 nm excitation wavelength. The emission spectra show peaks at 483 nm (Fig. 2(D)(i)), 359 nm (Fig. 2(D)(ii)), and 404 nm Fig. 2(D)(iii) for CS, V2O5 and V2O5–CS, respectively. A red-shifted emission is observed in the V2O5–CS nanohybrid due to the successfully incorporation of V2O5 nanoparticles into the electron-rich CS polymer chains.34
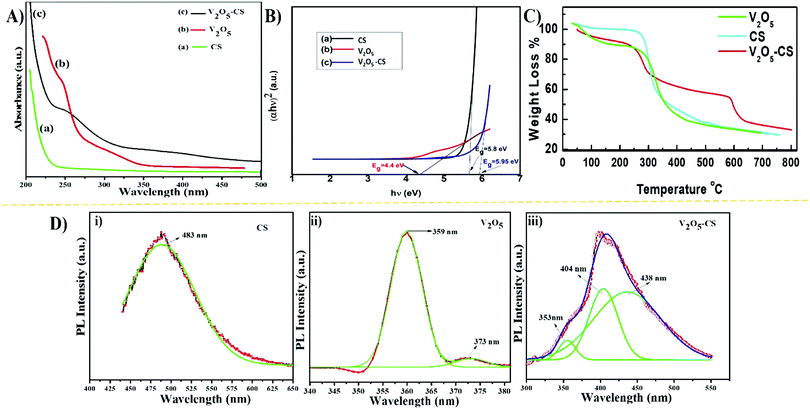 |
| | Fig. 2 (A) UV-vis absorption spectra, (B) band gaps in terms of the Tauc plot of (αhν)2versus (hν), (C) TGA analysis, and (D) photoluminescence spectra for (i) CS, (ii) V2O5 nanoparticles, and (iii) V2O5–CS nanohybrid. | |
The FTIR spectra of CS, nanostructured V2O5, and the V2O5–CS nanohybrid film are shown in Fig. 3(A) in which the vibrational spectrum of CS (green curve (a)) demonstrates a characteristic peak at 3440 cm−1 owing to overlap of –NH2 and –OH stretching bands, and the bands exhibited at 2920 cm−1 and 1650 cm−1 are the CH2 and carbonyl (C![[double bond, length as m-dash]](https://www.rsc.org/images/entities/char_e001.gif) O) stretching bands of amide I and amide II, respectively; the peak at 1380 cm−1 is the result of the –C–O stretching mode of the –CH2–OH groups, and finally the peak at 1070 cm−1 is due to the stretching vibration of C–O–C in the glucose ring of CS.38,39 Furthermore, the vibration spectrum of the V2O5 nanoparticles (Fig. 3(A) [red curve (b)]) yielded weak bands at 3430 cm−1 due to the different vibration modes of O–H stretching due to physically adsorbed water. Moreover, the three broad peaks centered at 573, 812, and 1030 cm−1 are ascribed to the stretching vibration of V–O, the bending vibrations of V–O–V, and the vibration of stretching between the shortest bonds of vanadium and oxygen, respectively.40 It is evident from Fig. 3(A) [blue curve (c)] that the vibrational spectrum obtained has similar vibration spectral bands that correspond to the functional group of CS, and the other bands at 571 and 813 cm−1 are the result of the stretching vibration of V–O and the bending vibration of V–O–V, respectively; thus, it can be concluded from this that the V2O5–CS nanohybrid was successfully synthesized.
O) stretching bands of amide I and amide II, respectively; the peak at 1380 cm−1 is the result of the –C–O stretching mode of the –CH2–OH groups, and finally the peak at 1070 cm−1 is due to the stretching vibration of C–O–C in the glucose ring of CS.38,39 Furthermore, the vibration spectrum of the V2O5 nanoparticles (Fig. 3(A) [red curve (b)]) yielded weak bands at 3430 cm−1 due to the different vibration modes of O–H stretching due to physically adsorbed water. Moreover, the three broad peaks centered at 573, 812, and 1030 cm−1 are ascribed to the stretching vibration of V–O, the bending vibrations of V–O–V, and the vibration of stretching between the shortest bonds of vanadium and oxygen, respectively.40 It is evident from Fig. 3(A) [blue curve (c)] that the vibrational spectrum obtained has similar vibration spectral bands that correspond to the functional group of CS, and the other bands at 571 and 813 cm−1 are the result of the stretching vibration of V–O and the bending vibration of V–O–V, respectively; thus, it can be concluded from this that the V2O5–CS nanohybrid was successfully synthesized.
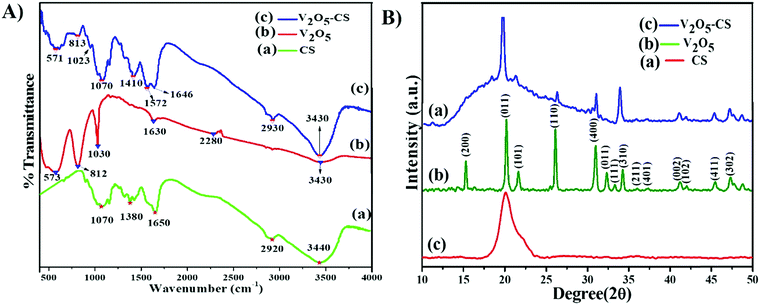 |
| | Fig. 3 (A) FT-IR transmission spectra: (a) CS, (b) V2O5 nanoparticles and (c) V2O5–CS nanohybrid; and (B) X-ray diffraction patterns: (a) CS, (b) V2O5 nanoparticles and (c) V2O5–CS nanohybrid. | |
The X-ray diffraction (XRD) analysis of CS, V2O5, and V2O5–CS is presented in Fig. 3(B). Here, the red curve (c) demonstrates the XRD spectrum of pure CS, which exhibits a broad diffraction peak at a 2θ value of 20.3°, indicating the amorphous structure of CS; this broad peak thereby indicates the long-range disorder commonly found in polymer samples.37 Furthermore, the XRD peak patterns of the V2O5 nanoparticles [green curve (b)] and the V2O5–CS nanohybrid [blue curve (a)] are relative reflections of each other, as all the patterns show the reflection planes from (2 0 0), (0 0 1), (1 0 1), (1 1 0), (4 0 0), (0 1 1), (1 1 1), (3 1 0), (2 1 1), (4 0 1), (0 0 2), (1 0 2), (4 1 1), and (3 0 2), which indicates that the V2O5 nanoparticles and V2O5–CS nanohybrid have an orthogonal type of structure and all these corresponding peak points match with the reported values of the Joint Committee's database on Powder Diffraction Standards (JCPDS) card number 41-1426 (a = 11.5160 Å, b = 3.5656 Å, and c = 4.3727 Å).41 Apart from these peaks, no foreign phases (diffraction peaks of any impurities) were detected, confirming that the synthesized V2O5 samples were highly pure. Furthermore, in the V2O5–CS nanohybrid [blue curve (a)], a broad peak at 2θ at ∼21° is observed, which may be linked to the CS phase due to intermolecular hydrogen bonds and the steric effects between the polymer chains and V2O5 nanoparticles.42 Furthermore, the average crystallite diameter (d) values calculated using Scherrer's equation [eqn (1)] are ∼25 and ∼21 nm for the V2O5 nanoparticles and V2O5–CS nanohybrids, respectively, from the full width at half maximum (FWHM) of the most intense peak (0 1 1) of the XRD. In eqn (1), β is the FWHM value (radians), ‘λ’ is 1.5406 Å, which is the CuKα wavelength, and θ is the Bragg diffraction.
| |  | (1) |
Moreover, atomic force microscopy (AFM) was utilized to study the surface properties of the CS, V
2O
5 nanoparticles, and V
2O
5–CS nanohybrid film deposited on the ITO substrate to form the electrode, and the obtained morphological characteristics are demonstrated in
Fig. 4. The three-dimensional morphology of the CS/ITO film surface demonstrates smooth, homogeneous, and bulbous structural elements [
Fig. 4(a)]. Furthermore, in
Fig. 4(b), the surface morphology of the V
2O
5 nanoparticles on the ITO is demonstrated, where the nanoparticles are uniformly distributed, and the roughness analysis revealed the root mean square roughness (RMS-
Rq) = 6.0 nm, the roughness average (
Ra) = 5.1 nm, and the maximum peak height profile = 11.3 nm. The 2D and 3D morphologies of the V
2O
5–CS/ITO nanohybrid film [
Fig. 4(c)] demonstrate how the nanoparticles are incorporated into the CS layer with RMS-
Rq,
Ra, and maximum peak height profiles of 3.2 nm, 2.5 nm, and 9.3 nm, respectively. Thus, these results show that the roughness is decreased compared with the V
2O
5/ITO nanoparticle surface due to the presence of CS; from this, it can be said that the obtained V
2O
5–CS film on the ITO surface is a smooth nanohybrid film with incorporated V
2O
5 nanoparticles as CS is a biopolymer. Furthermore, SEM analysis was also carried out to investigate the surface morphologies of CS, the V
2O
5 nanoparticles, and the V
2O
5–CS nanohybrid film deposited on the ITO substrate to form the electrode. Porous, thick, and uniform layers of CS are visible in
Fig. 5(a). From the SEM micrograph of the V
2O
5 nanoparticles [
Fig. 5(b)], it can be seen that the nanoparticles are uniformly dispersed on the ITO surface, and apart from this it can also be observed that they are densely distributed owing to deposition
via the EPD process.
Fig. 5(c) reveals the globular morphology of the formed nanohybrid film, indicating the successful synthesis of the V
2O
5–CS nanohybrid, formed due to electrostatic interactions between the cationic CS and the presence of surface charges on the V
2O
5 nanoparticles, which help in the grafting of the V
2O
5 nanoparticles into the CS polymer network.
Fig. 5(d)–(f) show the EDX spectra of CS/ITO, V
2O
5/ITO and V
2O
5–CS/ITO film, respectively. The atomic percentage of C, N and O for the CS/ITO electrodes are 46.28, 16.57 and 37.15%, respectively, while in the V
2O
5/ITO film the atomic percentages of V and O are 68.46 and 31.54%, respectively, with the absence of other elements indicating the high purity of the synthesized nanoparticles. The EDX data of the V
2O
5–CS/ITO nanohybrid film show atomic% values for C (12.72%) and N (2.94%), indicating the presence of CS molecules, and confirming the formation of the nanohybrid. In addition to these studies, TEM analysis of the V
2O
5 nanoparticles was also carried out and is presented in
Fig. 6. The TEM image reveals that the V
2O
5 nanoparticles retained a homogeneous spherical morphology, and these particles range from 10 to 35 nm in size. The average particle size of the V
2O
5 nanoparticles was around ∼12 nm, which was obtained by a histogram fitted by the Lorentzian function. Furthermore, the interplanar spacing ‘
d = 0.26 nm’ is consistent with the prominent (0 1 1) diffraction peak observed in the XRD study; in addition to this, the selected area electron diffraction image (top-right inset in
Fig. 6) is similar to the JCPDS card data values of
d-spacing, which corresponds to the highly intense peak of the XRD study.
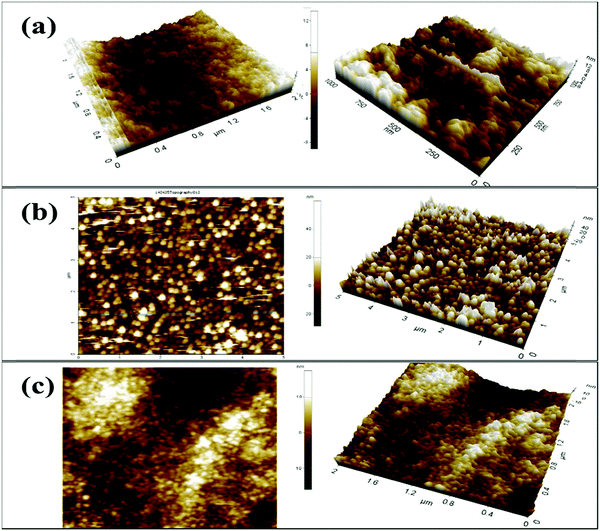 |
| | Fig. 4 Two- and three-dimensional AFM micrographs: (a) CS/ITO film, (b) V2O5/ITO film and (c) V2O5–CS/ITO nanohybrid film. | |
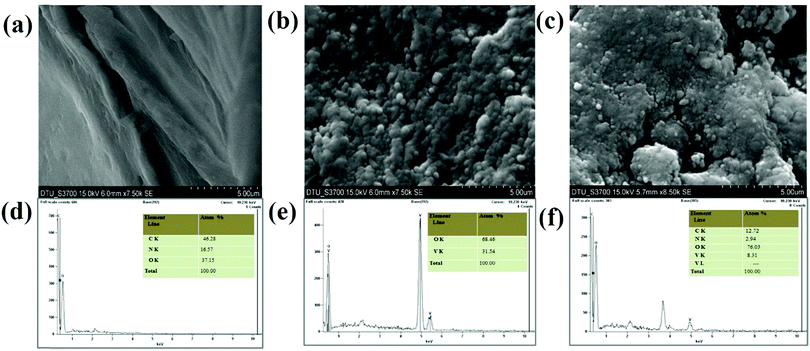 |
| | Fig. 5 SEM micrographs and EDX analysis: (a and d) CS film, (b and e) V2O5 nanoparticles, and (c and f) V2O5–CS nanohybrid film. | |
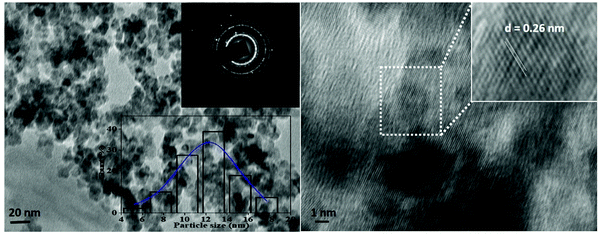 |
| | Fig. 6 TEM and HR-TEM images with inset images showing the corresponding SAED image and the size distribution histogram fitted by Lorentzian function of V2O5 nanoparticles prepared via the hydrothermal method. | |
3.2. Electrochemical studies
3.2.1. Cyclic voltammetry (CV) and differential pulse voltammetry (DPV).
The redox electrochemical behavior of the plain ITO, CS/ITO, and V2O5/ITO, and V2O5–CS/ITO electrodes were studied in 50 mM PBS solution (0.9% NaCl) of pH 6.4 containing [Fe(CN)6]3−/4− of 5 mM at a scan rate of 50 mV s−1 [Fig. 7(A)]. The green curve in Fig. 7(A) is the cyclic voltammogram of the plain ITO electrode, which exhibits oxidation and reduction peaks due to the presence of the [Fe(CN)6]3−/4− mediator, which demonstrates the anodic/oxidation current peak (Ipa) at 0.303 mA. Furthermore, the black, red, and blue curves in Fig. 7(A) are of the CS/ITO, V2O5/ITO, and V2O5–CS/ITO electrodes, respectively, and demonstrate the anodic/oxidation current peak (Ipa) values of 0.506, 0.658, and 0.714 mA, respectively. The current increase that is observed in the CS/ITO electrode compared with the plain ITO electrode is due to the cationic nature of the CS, which helps to accept electrons.43 The Ipa value of the V2O5/ITO electrode is more than those of the plain ITO and CS/ITO electrodes, confirming that the metal oxide V2O5 is an excellent conducting material with a large surface area. Further, the Ipa value of the V2O5–CS/ITO electrode is the highest among the other fabricated electrodes, and this is as a result of the V2O5 nanoparticles being incorporated into the biopolymer CS matrix, which increases the electroactive surface area obtained from the high electrocatalytic mobility, resulting in improvement of the electron transfer. Furthermore, the DPV results were in complete agreement with the CV behavior of the ITO, CS/ITO, V2O5/ITO, and V2O5–CS/ITO electrodes, and it also suggested that the V2O5 nanoparticles incorporated into the CS biopolymer provide greater electron transport and an enhanced electrocatalytic behavior between the mediator and the electrode [Fig. 7(B)].
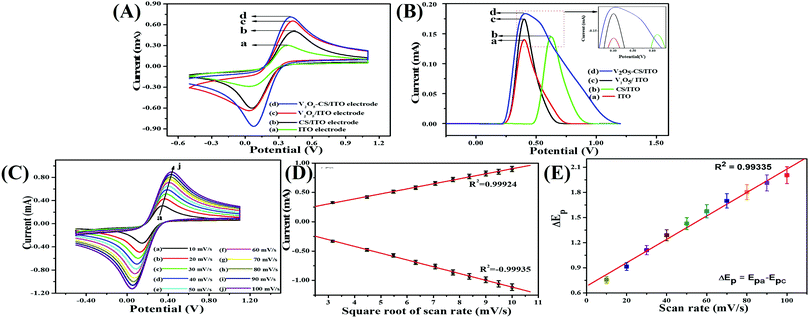 |
| | Fig. 7 (A) Cyclic voltammograms of the (a) ITO, (b) CS/ITO, (c) V2O5–CS/ITO, and (d) V2O5–CS/ITO electrodes; (B) DPV results of the (a) ITO, (b) CS/ITO, (c) V2O5–CS/ITO, and (d) V2O5–CS/ITO electrodes; (C) scan-rate studies from 10 to 100 mV s−1 for the V2O5–CS/ITO electrode; (D) the magnitude of current vs. potential difference as a function of the square root of the scan rate (10–100 mV s−1); and (E) the magnitude of the potential difference (ΔEp) as a function of the scan rate (10–100 mV s−1). | |
3.2.2. Scan-rate effect.
For studying the interfacial kinetics of the V2O5–CS/ITO electrode, CV studies were performed by varying the scan rate from 10 to 100 mV s−1 [Fig. 7(C)] in a 50 mM PBS solution (0.9% NaCl) of pH 6.4 containing [Fe(CN)6]3−/4− of 5 mM. From this study, it was evident that the magnitudes of the oxidation/anodic (Ipa) and reduction/cathodic (Ipc) peak currents increase linearly when the current values are plotted against the square root of the scan rate (ν1/2) [Fig. 7(D)]. Moreover, when the scan rate is varied from 10 to 100 mV s−1, with this increase in scan rate, the oxidation/anodic and reduction/cathodic peaks start to shift towards a more positive potential and a more negative potential, respectively, which in turn suggests this redox (oxidation–reduction) behavior as a quasi-reversible process; furthermore, the potential peak shift (ΔEp = Epa − Epc) also exhibits a linear association [Fig. 7(E)] with the scan rate, suggesting this process at the electrode of electrochemical reaction as a diffusion-controlled process, and the obtained linear fit (R2 = 0.99335) of the peak height against the scan rate suggests enhanced electrocatalytic behavior.
3.2.3. Kinetic studies.
The electron-transfer coefficient (KS) of ITO modified by V2O5–CS is calculated using eqn (2)12 in which ‘F’ is the Faraday constant (96![[thin space (1/6-em)]](https://www.rsc.org/images/entities/char_2009.gif) 485 C mol−1), the gas constant is denoted by ‘R’ (8.314 J mol−1 K−1), the peak-to-peak separation (in V) is denoted by m, the number of electrons is denoted by n, ν is the scan rate, and T is the temperature (which in this case is a room temperature of 300 K). Thus, by putting these values into eqn (2), KS was obtained for V2O5–CS/ITO electrode as 0.601142 s−1; this value indicates an increased rate of electron transfer, which is a result of the higher catalytic behavior of the V2O5 nanoparticles. Furthermore, the Brown–Anson model [eqn (3)]12 was used to determine the V2O5–CS/ITO electrode's surface concentration (Y); here, A denotes the surface area of the electrode (0.25 cm2), Ip is the peak current of the electrode (Ipc and Ipa), and the remaining other values are as stated above. Thus, putting these values in eqn (3), the obtained Y value was 3.67 × 10⁻⁶ mol cm−2, suggesting an increased electroactive surface area. Moreover, for calculating the diffusion coefficient (D) for 5 mM [Fe(CN)6]3−/4− diffusion from the electrolyte to the surface of V2O5–CS/ITO electrode, the Randles–Ševčik equation [eqn (4)]12 was employed in which C denotes the mediator concentration at the surface (in this case, it is 0.000005 mol cm−3), and the other values are as stated for eqn (2) and (3). Putting the values into eqn (4), the obtained D value is 1.27368 cm2 s−1.
485 C mol−1), the gas constant is denoted by ‘R’ (8.314 J mol−1 K−1), the peak-to-peak separation (in V) is denoted by m, the number of electrons is denoted by n, ν is the scan rate, and T is the temperature (which in this case is a room temperature of 300 K). Thus, by putting these values into eqn (2), KS was obtained for V2O5–CS/ITO electrode as 0.601142 s−1; this value indicates an increased rate of electron transfer, which is a result of the higher catalytic behavior of the V2O5 nanoparticles. Furthermore, the Brown–Anson model [eqn (3)]12 was used to determine the V2O5–CS/ITO electrode's surface concentration (Y); here, A denotes the surface area of the electrode (0.25 cm2), Ip is the peak current of the electrode (Ipc and Ipa), and the remaining other values are as stated above. Thus, putting these values in eqn (3), the obtained Y value was 3.67 × 10⁻⁶ mol cm−2, suggesting an increased electroactive surface area. Moreover, for calculating the diffusion coefficient (D) for 5 mM [Fe(CN)6]3−/4− diffusion from the electrolyte to the surface of V2O5–CS/ITO electrode, the Randles–Ševčik equation [eqn (4)]12 was employed in which C denotes the mediator concentration at the surface (in this case, it is 0.000005 mol cm−3), and the other values are as stated for eqn (2) and (3). Putting the values into eqn (4), the obtained D value is 1.27368 cm2 s−1.| | | Ip = (2.69 × 10⁵)n3/2AD1/2Cν1/2 | (4) |
3.2.4. pH optimization.
Before starting the experiments, initially, the pH of the final electrode (V2O5–CS/ITO) was optimized via CV analysis in a 50 mM PBS solution (0.9% NaCl) containing 5 mM [Fe(CN)6]3−/4− of varying pH (5.7 to 8) at a scan rate of 50 mV s−1 (Fig. 8). This study observed that the Ipa value increases from pH 5.7 to 6.4 and then starts to deteriorate as the pH is increased further. Moreover, it was observed that at pH 6.4, the V2O5–CS/ITO electrode demonstrated the highest current magnitude (inset of Fig. 8) owing to the enhanced rate of interaction between the electrode and the mediator [Fe(CN)6]3−/4− compared with the other pH conditions. The lower Ipa values for the other pH conditions is due to the limited electron transport between the V2O5–CS/ITO electrode and the medium. Thus, for this study's overall CV analysis, pH 6.4 was selected as the optimum pH condition.
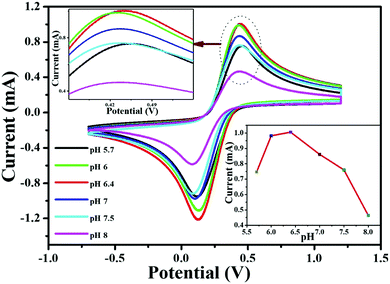 |
| | Fig. 8 CV studies of the V2O5–CS/ITO electrode as a function of pH ranging from 5.7 to 8.0 in phosphate buffer containing [Fe(CN)6]3−/4−. Inset shows the current response of the V2O5–CS/ITO electrode as a function of pH. | |
3.2.5. Electro-oxidation study of hydrazine.
Regarding human toxicity issues caused by hydrazine, in this study the electrochemical sensing response of the V2O5–CS/ITO nanohybrid electrode to hydrazine was demonstrated via the fabrication of a fast, selective, and efficient V2O5–CS/ITO nanohybrid-based electrochemical sensing device for detection of hydrazine to help avoid human exposure. For the measurement of different hydrazine concentrations, CV analysis was performed in which the V2O5–CS/ITO nanohybrid electrode was exposed to various concentrations of hydrazine (N2H4; 2–22 mM) in a 50 mM PBS solution (0.9% NaCl) of pH 6.4 containing [Fe(CN)6]3−/4− of 5 mM at a scan rate of 50 mV s−1 [Fig. 9(A)]. From the CV study, it was observed that the oxidation/anodic peak current (Ipa) increases linearly with the increasing concentration of N2H4, and the reduction/cathodic peak current (Ipc) decreases linearly with the increasing concentration of N2H4, suggesting that the V2O5–CS/ITO nanohybrid electrode is sensitive towards N2H4. The chemical overview of the electrochemical reduction of N2H4 by the V2O5–CS/ITO nanohybrid electrode in the presence of the mediator [Fe(CN)6]3−/4− is demonstrated in eqn (5) below.| |  | (5) |
As it was observed that the oxidation/anodic current (Ipa) and reduction/cathodic current (Ipc) peaks had a linear relationship with various N2H4 concentrations from 2 to 22 mM [Fig. 9(B)], and the obtained linear coefficient value (R2) was 0.96859, which suggested a strong relationship between currents at oxidation (Ipa)/reduction (Ipc) peaks and the N2H4 concentrations. Further, from the obtained results, the limit of detection (LOD) was calculated using the standard formula (3 × SD/sensitivity) in which SD is the value of the standard deviation of the calibration plot slope and the background current; for determining the LOD, first sensitivity was calculated, and the obtained sensitivity was 50.48 μA μM−1 cm2, which suggested that the fabricated electrode was highly sensitive towards N2H4; then from further calculations, the obtained LOD was 0.084 mM. Thus, the electro-oxidation activity of the V2O5–CS/ITO nanohybrid electrode at various concentrations of N2H4 suggests that the V2O5–CS nanohybrid material used to fabricate the electrode is a promising material for the electrochemical sensing of N2H4 in the given sample, and the V2O5–CS nanohybrid is further put forward as a prominent material for fabricating a potential electrochemical device. Moreover, Table 1 compares this fabricated electrode with other pre-existing electrode materials used to determine N2H4,44–52 which suggests that the electrode fabricated in this work has a better sensitivity.
 |
| | Fig. 9 (A) Electro-oxidation response study of the V2O5–CS/ITO electrode with respect to the hydrazine concentration (2–22 mM) in PBS (5 mM, pH 6.4, 0.9% NaCl) containing [Fe(CN)6]3−/4− at a scan rate of 50 mV s−1. (B) Calibration curve of the V2O5–CS/ITO electrode and the variation in current as a function of the hydrazine concentration (2–22 mM) in PBS (5 mM, 6.4 pH, 0.9% NaCl) containing [Fe(CN)6]3−/4− at a scan rate of 50 mV s−1. | |
Table 1 Sensing parameters for hydrazine utilizing different electrode materials
| Method |
Electrode material |
pH, medium |
Sensitivity |
Linear range |
LOD |
Response time (s) |
Ref. |
| CV |
Pd-GG-g-PAM-silica modified GCE |
7.0, PBS |
— |
0.05–0.6 and 0.6–180 mmol dm−3 |
4.1 × 10⁻³ mmol dm−3 |
— |
39
|
| Amperometry |
AuNG/CMG/GCE |
7.4, PBS |
— |
6–30 μM |
0.5 μM |
— |
40
|
| CV |
Pd NPs-modified CB |
9.0, PBS |
— |
0.005–0.5, 0.5–10, and 10–50 mmol dm−3 |
8.8 × 10⁻³ mmol dm−3 |
— |
41
|
| Amperometry |
Au@Pd/rGO/GCE |
6.8, PBS |
0.825 A L mol−1 |
2.0–40 μM liter−1 |
0.08 μM liter−1 |
— |
42
|
| CV |
Fe-doped ZnO nanoparticle electrode |
— |
39.36 μA cm−2 μM−1) |
— |
0.01 × 10⁻³ mmol dm−3 |
∼10 |
43
|
| Amperometry |
Fe2O3-modified carbon powder epoxy composite electrode |
7.4, PBS |
— |
— |
1.18 × 10⁻³ mmol dm−3 |
∼60 |
44
|
| CV |
m-Fe3O4/GO/GCE |
7.1, PBS |
— |
1.0–4400 μM |
0.059 μM |
— |
45
|
| Amperometry |
Au@Pd/CB-DHP/GCE |
10, PBS |
0.0824 A L mol−1 |
2.5–88 μM liter−1 |
1.77 μM liter−1 |
— |
46
|
| Amperometry |
CuO/CNTs–rGO/GCE |
— |
4.28 |
1.2–430 μM |
0.20 μM |
— |
47
|
| Amperometry |
V2O5–CS/ITO |
6.4, PBS |
50.48 μA μM−1 cm−2 |
2–22 mM |
0.084 mM |
20 |
Present work |
3.2.6. Response time, reproducibility and selectivity/interference study of the V2O5–CS/ITO electrode.
The reproducibility of the V2O5–CS/ITO nanohybrid electrode was delineated utilizing the CV technique in a 50 mM PBS solution (0.9% NaCl) of pH 6.4 containing [Fe(CN)6]3−/4− of 5 mM at an optimized scan rate of 50 mV s−1 in the presence of N2H4 (8 mM). The results obtained from 15 repeated measurements using the same electrode (data not shown) indicated that the as-prepared V2O5–CS/ITO electrode showed good reproducibility after 15 repeated measurements with good precision of about 2.3% at low SD. Furthermore, by utilizing similar reaction conditions, the response time was determined [Fig. 10(A)], for the V2O5–CS/ITO nanohybrid electrode by measuring the electrochemical current responses between 2 and 30 s. The magnitude of the current increases initially (2–20 s), and after 20 s the current started to deteriorate, indicating that 20 s is the optimum response time for the V2O5–CS/ITO nanohybrid electrode for sensing N2H4 in the sample. Moreover, interference studies presented in Fig. 10(B) were also performed in the presence of ascorbic acid (12 mM), urea (12 mM), dextrose (12 mM), and ammonia (12 mM), which demonstrated that no significant current change was observed.
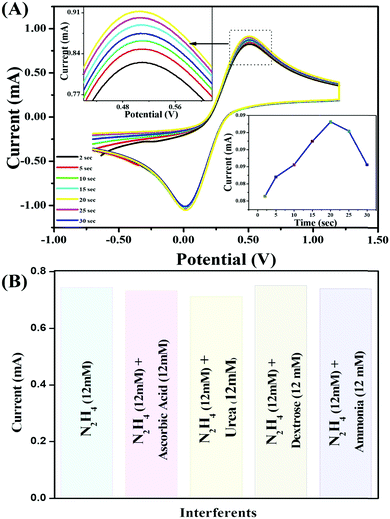 |
| | Fig. 10 (A) CV study of the electrochemical response times of the V2O5–CS/ITO nanohybrid electrode; inset image shows the current response versus the incubation time for the V2O5–CS/ITO nanohybrid electrode. (B) Interference study of the V2O5–CS/ITO electrode with ascorbic acid (12 mM), urea (12 mM), dextrose (12 mM), and ammonia (12 mM) as interferent materials. | |
4. Conclusions
In conclusion, we herein presented a method for the synthesis of V2O5 nanoparticles using a hydrothermal method followed by a melt-quenching method; these nanoparticles were further stabilized by functionalizing them with CS for fabricating a thin film electrode (V2O5–CS/ITO) via casting an aqueous suspension of the V2O5–CS nanohybrid onto an indium-tin-oxide (ITO)-coated glass electrode, to investigate the electrocatalytic activity of the nanohybrid towards hydrazine oxidation via cyclic voltammetry. The electrochemical response of the V2O5–CS/ITO electrode showed a high sensitivity (50.48 μA μM−1 cm−2) for the electrochemical determination of hydrazine (2–22 mM); the obtained LOD in this study was 0.084 mM at a scan rate of 50 mV s−1, and the determined amperometric response time was 20 s. Thus, the findings of this study suggest that the synthesized V2O5–CS nanohybrid material is a very promising agent for fabricating an electrochemical sensing platform for the label-free, rapid, and simple quantitative determination of N2H4 in samples to overcome the human toxicity issues caused by hydrazine, as the device fabricated using the V2O5–CS nanohybrid is fast, selective, and efficient. Hence, from this, it can be stated that a favorable electrochemical sensing device platform has been established for the determination of N2H4; but further studies are still needed to develop an on-site model for N2H4 detection in real samples, and our group is working towards achieving these objectives in the near future.
Conflicts of interest
The authors declare no conflict of interest for this work.
Acknowledgements
All the authors are thankful to their respective institutions. Furthermore, J.S. expresses gratitude for the DST-INSPIRE faculty Fellowship, BHU (IoE grant), and UGC New Delhi for financial support. K.RB.S. would like to express gratitude to Professor A. K. Singh for providing constant support and guidance throughout this work. R.P.S. is thankful to VC, IGNTU, Amarkantak, India, for providing constant support financially and for motivating us to do good science, and last, D.K. is thankful to the VC, DTU, Delhi, India.
References
- R. Ahmad, N. Tripathy and Y.-B. Hahn, Chem. Commun., 2014, 50, 1890–1893 RSC.
- S. D. Zelnick, D. R. Mattie and P. C. Stepaniak, Aviat., Space Environ. Med., 2003, 74, 1285–1291 CAS.
- R. Maji, A. K. Mahapatra, K. Maiti, S. Mondal, S. S. Ali, P. Sahoo, S. Mandal, M. R. Uddin, S. Goswami and C. K. Quah, RSC Adv., 2016, 6, 70855–70862 RSC.
- M. B. Gholivand and A. Azadbakht, Electrochim. Acta, 2011, 56, 10044–10054 CrossRef CAS.
- A. A. Ensafi and B. Rezaei, Talanta, 1998, 47, 645–649 CrossRef CAS PubMed.
- J. Mo, B. Ogorevc, X. Zhang and B. Pihlar, Electroanal. An Int. J. Devoted to Fundam. Pract. Asp. Electroanal., 2000, 12, 48–54 CAS.
- K. Yamamoto and S. Kawanishi, J. Biol. Chem., 1991, 266, 1509–1515 CrossRef CAS.
- H. M. Moghaddam, H. Beitollahi, S. Tajik, I. Sheikhshoaie and P. Biparva, Environ. Monit. Assess., 2015, 187, 1–12 CrossRef PubMed.
- U. P. Azad and V. Ganesan, Electrochim. Acta, 2011, 56, 5766–5770 CrossRef CAS.
-
V. A. Maraldi, Master thesis, Universidade Estadual Paulista ‘Júlio de Mesquita Filho’, 2018, http://hdl.handle.net/11449/157120.
- K. R. Singh, M. Fernandes, T. Sarkar and P. Sridevi, Infect. Non Infect. Dis., 2019, 4, 1–7 CrossRef.
- P. Singh, K. R. Singh, J. Singh, S. N. Das and R. P. Singh, RSC Adv., 2021, 11, 18050–18060 RSC.
- A. K. Yadav, T. K. Dhiman, G. B. V. S. Lakshmi, A. N. Berlina and P. R. Solanki, Int. J. Biol. Macromol., 2020, 151, 566–575 CrossRef CAS PubMed.
- X. Yue, W. Yang, M. Xu, X. Liu and J. Jia, Talanta, 2015, 144, 1296–1300 CrossRef CAS PubMed.
- M. K. Rofouei, H. Khoshsafar, H. Bagheri and R. J. Kalbasi, Int. J. Environ. Anal. Chem., 2018, 98, 156–170 CrossRef CAS.
- H. Rostami, F. Khosravi, M. Mohseni and A. A. Rostami, Int. J. Biol. Macromol., 2018, 107, 343–348 CrossRef CAS PubMed.
- J. Singh, A. Roychoudhury, M. Srivastava, P. R. Solanki, D. W. Lee, S. H. Lee and B. D. Malhotra, Nanoscale, 2014, 6, 1195–1208 RSC.
- D. Grieshaber, R. MacKenzie, J. Vörös and E. Reimhult, Sensors, 2008, 8, 1400–1458 CrossRef CAS PubMed.
- P. R. Solanki, A. Kaushik, V. V. Agrawal and B. D. Malhotra, NPG Asia Mater., 2011, 3, 17–24 CrossRef.
-
R. P. Singh, P. Singh and K. R. B. Singh, Composite Materials, CRC Press, Boca Raton, FL, 1st edn, 2021, pp. 1–28 Search PubMed.
- R. P. Singh, Int. J. Electrochem., 2011, 2011, 1–30 CrossRef.
-
R. P. Singh, in Nanotechnology, ed. R. Prasad, M. Kumar and V. Kumar, Springer Singapore, Singapore, 2017, pp. 293–303 Search PubMed.
-
R. P. Singh, Advances in Nanostructured Composites, CRC Press, Taylor & Francis Group, Boca ERaton, FL, Series: A Science Publishers Book, 2019, vol. 1, pp. 16–47 Search PubMed.
- V. Nayak, K. R. Singh, A. K. Singh and R. P. Singh, New J. Chem., 2021, 45, 2849–2878 RSC.
- K. R. Singh, V. Nayak, T. Sarkar and R. P. Singh, RSC Adv., 2020, 10, 27194–27214 RSC.
- X. Liu, J. Zeng, H. Yang, K. Zhou and D. Pan, RSC Adv., 2018, 8, 4014–4031 RSC.
- N. Asim, S. Radiman, M. A. Yarmo and M. S. B. Golriz, Microporous Mesoporous Mater., 2009, 120, 397–401 CrossRef CAS.
- L. Mai, F. Dong, X. Xu, Y. Luo, Q. An, Y. Zhao, J. Pan and J. Yang, Nano Lett., 2013, 13, 740–745 CrossRef CAS PubMed.
- M. Beaula Ruby Kamalam, S. S. R. Inbanathan, K. Sethuraman, A. Umar, H. Algadi, A. A. Ibrahim, Q. I. Rahman, C. S. Garoufalis and S. Baskoutas, Environ. Res., 2021, 199, 111369 CrossRef CAS PubMed.
- A. Baghban, M. Heidarizadeh, E. Doustkhah, S. Rostamnia and P. F. Rezaei, Int. J. Biol. Macromol., 2017, 103, 1194–1200 CrossRef CAS PubMed.
- E. Doustkhah, S. Rostamnia, B. Gholipour, B. Zeynizadeh, A. Baghban and R. Luque, Mol. Catal., 2017, 434, 7–15 CrossRef CAS.
- S. Kumar, J. Dutta, P. K. Dutta and J. Koh, Int. J. Biol. Macromol., 2020, 160, 470–481 CrossRef CAS PubMed.
- S. Kumar, A. Mukherjee and J. Dutta, Trends Food Sci. Technol., 2020, 97, 196–209 CrossRef CAS.
- M. Li, F. Kong, H. Wang and G. Li, CrystEngComm, 2011, 13, 5317–5320 RSC.
- J. Singh, M. Srivastava, J. Dutta and P. K. Dutta, Int. J. Biol. Macromol., 2011, 48, 170–176 CrossRef CAS PubMed.
- L. Upadhyaya, J. Singh, V. Agarwal, A. C. Pandey, S. P. Verma, P. Das and R. P. Tewari, Process Biochem., 2015, 50, 678–688 CrossRef CAS.
- J. Singh and P. K. Dutta, Int. J. Biol. Macromol., 2009, 45, 384–392 CrossRef CAS PubMed.
- P. Meng and I. Ramli, Solid State Sci. Technol., 2007, 15, 128–133 Search PubMed.
- A. Kaushik, R. Khan, P. R. Solanki, P. Pandey, J. Alam, S. Ahmad and B. D. Malhotra, Biosens. Bioelectron., 2008, 24, 676–683 CrossRef CAS PubMed.
- C. Xiong, A. E. Aliev, B. Gnade and K. J. Balkus Jr., ACS Nano, 2008, 2, 293–301 CrossRef CAS PubMed.
- A. Pan, J.-G. Zhang, Z. Nie, G. Cao, B. W. Arey, G. Li, S. Liang and J. Liu, J. Mater. Chem., 2010, 20, 9193–9199 RSC.
- L.-H. Li, J.-C. Deng, H.-R. Deng, Z.-L. Liu and L. Xin, Carbohydr. Res., 2010, 345, 994–998 CrossRef CAS PubMed.
- S. Kumar, N. Nigam, T. Ghosh, P. K. Dutta, S. P. Singh, P. K. Datta, L. An and T. F. Shi, Mater. Chem. Phys., 2010, 120, 361–370 CrossRef CAS.
- P. K. Rastogi, V. Ganesan and S. Krishnamoorthi, Electrochim. Acta, 2014, 125, 593–600 CrossRef CAS.
- S. Daemi, A. A. Ashkarran, A. Bahari and S. Ghasemi, Sens. Actuators, B, 2017, 245, 55–65 CrossRef CAS.
- J. Panchompoo, L. Aldous, C. Downing, A. Crossley and R. G. Compton, Electroanalysis, 2011, 23, 1568–1578 CrossRef CAS.
- S. Dutta, C. Ray, S. Mallick, S. Sarkar, A. Roy and T. Pal, RSC Adv., 2015, 5, 51690–51700 RSC.
- R. Kumar, D. Rana, A. Umar, P. Sharma, S. Chauhan and M. S. Chauhan, Sens. Lett., 2014, 12, 1273–1278 CrossRef.
- B. Šljukić, C. E. Banks, A. Crossley and R. G. Compton, Electroanalysis, 2006, 18, 1757–1762 CrossRef.
- G. Vinodha, P. D. Shima and L. Cindrella, J. Mater. Sci., 2019, 54, 4073–4088 CrossRef CAS.
- P. B. Deroco, I. G. Melo, L. S. R. Silva, K. I. B. Eguiluz, G. R. Salazar-Banda and O. Fatibello-Filho, Sens. Actuators, B, 2018, 256, 535–542 CrossRef CAS.
- Z. Zhao, W. Wang, W. Tang, Y. Xie, Y. Li, J. Song, S. Zhuiykov, J. Hu and W. Gong, Ionics, 2020, 26, 2599–2609 CrossRef CAS.
|
| This journal is © The Royal Society of Chemistry 2021 |
Click here to see how this site uses Cookies. View our privacy policy here.  Open Access Article
 *a,
Kshitij RB
Singh
 b,
Manish
Kumar
c,
Rahul
Verma
a,
Ranjana
Verma
d,
Priya
Malik
c,
Saurabh
Srivastava
e,
Ravindra Pratap
Singh
 f and
Devendra
Kumar
*c
![[double bond, length as m-dash]](https://www.rsc.org/images/entities/char_e001.gif) O) stretching bands of amide I and amide II, respectively; the peak at 1380 cm−1 is the result of the –C–O stretching mode of the –CH2–OH groups, and finally the peak at 1070 cm−1 is due to the stretching vibration of C–O–C in the glucose ring of CS.38,39 Furthermore, the vibration spectrum of the V2O5 nanoparticles (Fig. 3(A) [red curve (b)]) yielded weak bands at 3430 cm−1 due to the different vibration modes of O–H stretching due to physically adsorbed water. Moreover, the three broad peaks centered at 573, 812, and 1030 cm−1 are ascribed to the stretching vibration of V–O, the bending vibrations of V–O–V, and the vibration of stretching between the shortest bonds of vanadium and oxygen, respectively.40 It is evident from Fig. 3(A) [blue curve (c)] that the vibrational spectrum obtained has similar vibration spectral bands that correspond to the functional group of CS, and the other bands at 571 and 813 cm−1 are the result of the stretching vibration of V–O and the bending vibration of V–O–V, respectively; thus, it can be concluded from this that the V2O5–CS nanohybrid was successfully synthesized.
O) stretching bands of amide I and amide II, respectively; the peak at 1380 cm−1 is the result of the –C–O stretching mode of the –CH2–OH groups, and finally the peak at 1070 cm−1 is due to the stretching vibration of C–O–C in the glucose ring of CS.38,39 Furthermore, the vibration spectrum of the V2O5 nanoparticles (Fig. 3(A) [red curve (b)]) yielded weak bands at 3430 cm−1 due to the different vibration modes of O–H stretching due to physically adsorbed water. Moreover, the three broad peaks centered at 573, 812, and 1030 cm−1 are ascribed to the stretching vibration of V–O, the bending vibrations of V–O–V, and the vibration of stretching between the shortest bonds of vanadium and oxygen, respectively.40 It is evident from Fig. 3(A) [blue curve (c)] that the vibrational spectrum obtained has similar vibration spectral bands that correspond to the functional group of CS, and the other bands at 571 and 813 cm−1 are the result of the stretching vibration of V–O and the bending vibration of V–O–V, respectively; thus, it can be concluded from this that the V2O5–CS nanohybrid was successfully synthesized.


![[thin space (1/6-em)]](https://www.rsc.org/images/entities/char_2009.gif) 485 C mol−1), the gas constant is denoted by ‘R’ (8.314 J mol−1 K−1), the peak-to-peak separation (in V) is denoted by m, the number of electrons is denoted by n, ν is the scan rate, and T is the temperature (which in this case is a room temperature of 300 K). Thus, by putting these values into eqn (2), KS was obtained for V2O5–CS/ITO electrode as 0.601142 s−1; this value indicates an increased rate of electron transfer, which is a result of the higher catalytic behavior of the V2O5 nanoparticles. Furthermore, the Brown–Anson model [eqn (3)]12 was used to determine the V2O5–CS/ITO electrode's surface concentration (Y); here, A denotes the surface area of the electrode (0.25 cm2), Ip is the peak current of the electrode (Ipc and Ipa), and the remaining other values are as stated above. Thus, putting these values in eqn (3), the obtained Y value was 3.67 × 10⁻⁶ mol cm−2, suggesting an increased electroactive surface area. Moreover, for calculating the diffusion coefficient (D) for 5 mM [Fe(CN)6]3−/4− diffusion from the electrolyte to the surface of V2O5–CS/ITO electrode, the Randles–Ševčik equation [eqn (4)]12 was employed in which C denotes the mediator concentration at the surface (in this case, it is 0.000005 mol cm−3), and the other values are as stated for eqn (2) and (3). Putting the values into eqn (4), the obtained D value is 1.27368 cm2 s−1.
485 C mol−1), the gas constant is denoted by ‘R’ (8.314 J mol−1 K−1), the peak-to-peak separation (in V) is denoted by m, the number of electrons is denoted by n, ν is the scan rate, and T is the temperature (which in this case is a room temperature of 300 K). Thus, by putting these values into eqn (2), KS was obtained for V2O5–CS/ITO electrode as 0.601142 s−1; this value indicates an increased rate of electron transfer, which is a result of the higher catalytic behavior of the V2O5 nanoparticles. Furthermore, the Brown–Anson model [eqn (3)]12 was used to determine the V2O5–CS/ITO electrode's surface concentration (Y); here, A denotes the surface area of the electrode (0.25 cm2), Ip is the peak current of the electrode (Ipc and Ipa), and the remaining other values are as stated above. Thus, putting these values in eqn (3), the obtained Y value was 3.67 × 10⁻⁶ mol cm−2, suggesting an increased electroactive surface area. Moreover, for calculating the diffusion coefficient (D) for 5 mM [Fe(CN)6]3−/4− diffusion from the electrolyte to the surface of V2O5–CS/ITO electrode, the Randles–Ševčik equation [eqn (4)]12 was employed in which C denotes the mediator concentration at the surface (in this case, it is 0.000005 mol cm−3), and the other values are as stated for eqn (2) and (3). Putting the values into eqn (4), the obtained D value is 1.27368 cm2 s−1.


