DOI:
10.1039/D1MA00605C
(Paper)
Mater. Adv., 2021,
2, 7024-7035
Transition metal coordination frameworks as artificial nanozymes for dopamine detection via peroxidase-like activity†
Received
13th July 2021
, Accepted 9th September 2021
First published on 29th September 2021
Abstract
Enzyme-like metal–organic frameworks are currently one type of star material in the fields of artificial enzymes and analytical sensing. However, there has been little progress in making use of MOF structures based on a catalytically active metal center. Herein, transition metal coordination frameworks (Cu–HMT and Ni–HMT) are used as artificial nanozymes for the visual detection of a Parkinson's disease biomarker (dopamine, DA) through peroxidase-like catalytic activity. We prepared hexamine and transition metal coordination frameworks (Cu–HMT and Ni–HMT) through a trouble-free green synthetic route and characterized them in detail. Comparative studies of peroxidase mimic activity were conducted in the presence of the as-prepared Cu–HMT and Ni–HMT. Impressively, Cu–HMT possesses formidable peroxidase mimic activity, which allows UV-vis spectra and naked-eye detection of DA. Furthermore, Ni–HMT has its own limitations, including lower water stability and poorer activity compared to Cu–HMT. However, the peroxidase-like activity of Cu–HMT was strongly inhibited in the presence of DA. Notably, the proposed sensing system was proven to show an enhanced inhibition effect, including visual detection, high selectivity, specificity and low detection limits of 0.7 and 4.2 mM for H2O2 and DA, respectively. Based on this phenomenon, the as-synthesized Cu–HMT could be used as a kind of nanozyme to enhance the performance of colorimetric sensors.
1. Introduction
Nanozymes are a kind of substituent inspired by natural enzymes. They are widely used in many applications, including industrial, biomedical, catalysis and sensing applications.1 Indeed, they have inherent peroxidase-mimic, oxidase-mimic, catalyst-mimic, and superoxide-like activities. Among these, their peroxidase-mimic activity has attracted great attention due to its promising properties.2,3 Most nanozymes have mimic properties, but less activity compared to natural enzymes. Thus, it is necessary to improve the design and development of highly catalytic nanozymes to outperform natural enzymes. So far, various nanozymes have demonstrated to act as peroxidase nanozymes, including Fe3O4, Mn3O4, Co3O4, Cu2O, Ag nanoparticles (NPs), Au NPs, Pt NPs, and carbon-based materials.4–8 Their nanozyme activity can be adjusted by various stimuli, such as pH, temperature and steric hindrance. Many researchers have aimed to enhance the activity of nanozymes using external stimuli such as size, shape and surface charges and various modifications and compositions.9,10 Therefore, tremendous efforts have been dedicated to improving the catalytic activity of metal–organic frameworks (MOFs) as better candidates to replace nanomaterial-based nanozymes.
MOFs have been given more importance in the field of nanozymes due to their high surface area, numerous active sites, pore tunability, cost-effectiveness, etc.11,12 MOFs are promising materials for many applications, such as gas isolation, catalysis, energy storage or transfer, biomedical applications, drug delivery, sensors and environmental applications.13–16 Additionally, MOFs have formidable peroxide-like activity, and can oxidize 3,3′,5,5′-tetramethylbenzidine (TMB) in the presence of H2O2via an electron transfer process.17,18 So far, most pristine MOFs and modified MOFs have exhibited pioneering peroxidase catalysis for the detection of H2O2, dopamine (DA), ascorbic acid, glucose, uric acid, poisonous metal ions and bioactive materials.19–26 Recently, a few reports have documented DA detection via peroxidase-like activity. Jang et al. reported the Cu(PDA)(DMF) MOF for the detection of DA,27 and a few hybrid materials also have excellent peroxidase-like activity.28–32 Zheng et al. presented MOF808, which was used to analyze ascorbic acid at neutral pH.33 Most MOFs are synthesized using hydrothermal or solvothermal methods under harsh conditions in toxic solvents (DMF, acetic acid).34,35 As is known, hexamethylenetetramine (HMT)-based coordination frameworks have pioneering super-capacitor and battery applications after calcination. It is also interesting to note that the HMT-based frameworks are synthesized using an eco-friendly synthetic method (room temperature and aqueous medium) and serve as oxidase activity mimics.
DA acts as a neurotransmitter, which is one the essential nutrient for human bodies. Eventhough, the higher concentration can leads nervous infection and premature death. Disordered levels of DA can lead to dangerous diseases such as schizophrenia, Alzheimer's, Parkinson's and Huntington's diseases.36,37 So far, fluorescence, electrochemical and colorimetric methods, and surface plasma resonance (SPR) have been developed for DA detection.38,39 However, the above-mentioned techniques have limitations such as photo-leaching, time-consuming operation, and inference from uric acid and ascorbic acid, which typically limits their selectivity. Therefore, developing new approaches with superior performance for DA detection is still necessary. Among them, visual and colorimetric methods have attracted great interest due to their simplicity and specificity and the fact that interestingly, the results can be analyzed by the naked eye without using any expensive instruments.
In this context, we developed transition-metal-containing coordination frameworks (Cu2+ and Ni2+–HMT) using a green synthetic one-pot method. They are constructed using HMT as a bridging ligand and Cu2+ and Ni2+ as metal nodes. As- prepared Cu2+–HMT and Ni2+–HMT showed superior peroxidase-mimic activity and were able to oxidize TMB with H2O2 to generate the product oxTMB. Moreover, Cu2+–HMT has higher inherent catalytic acidity compared to CuO, NiO NPs and Ni2+–HMT due to the abundant reactive active species. However, DA inhibits the peroxidase-like activity of Cu–HMT. Based on this approach, i.e., the enhancement and inhibition of the oxidation of TMB, superior selectivity and sensitivity in the detection of H2O2 and DA are achieved via a colorimetric method. As shown in Scheme 1b, Cu–HMT oxidized TMB via reactive active species from the decomposition of H2O2. Nevertheless, DA caused decreased oxidation of TMB due to its competitive consumption of the reactive oxygen species (ROS), which results in reduced peroxidase-mimic activity and a hypochromic effect in the absorption spectrum. Therefore, H2O2 and DA could be detected according to the colour change. Thus, we demonstrated that this facile methodology offers rapid, reliable and selective detection for an H2O2 and DA assay.
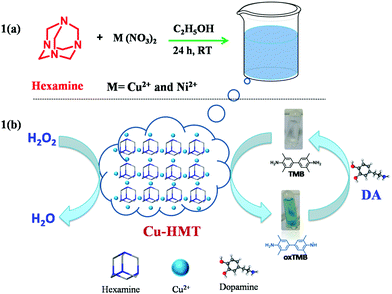 |
| | Scheme 1 Schematic illustration of the transition-metal-based hexamine coordination frameworks (a); mechanism of the peroxidase-based activity of Cu–HMT for the detection of H2O2 and DA (b). | |
2. Experimental section
2.1. Reagents and materials
Copper nitrate (Cu(NO3)2), nickel nitrate (Ni(NO3)2, hexamine, 3,3′,5,5′-tetramethylbenzidine (TMB), ethanol, hydrogen peroxide (H2O2), DA, glucose (G), fructose (Fr), cysteine (Cy), uric acid (UA), ascorbic acid (AA), p-benzoquinone (PBQ), methanol (MeOH), isopropyl alcohol (IPA) were all purchased from SRL chemicals as analytical grade reagents and used without further purification.
2.2. Characterization
The morphology and crystalline structure information were evaluated using scanning electron microscopy (SEM, FEI Quanta FEG 200) and high-resolution transmission electron microscopy (HRTEM, JEOL, JEM, Fb-2000). The X-ray diffraction patterns were obtained using a PAN analytical X’pert pro X-ray diffractometer with CuKα radiation. In the bonding information studies, an Agilent Technologies FT-IR spectrometer (USA) was used to record the Fourier-transform infrared (FT-IR) spectra in attenuated total reflectance (ATR) mode. Thermal stability was analysed via thermogravimetry analysis (STA 2500 Thermoanalyzer).
2.3. Synthesis of transition-metal-based hexamine coordination frameworks (Cu2+ and Ni2+–HMT)
The transition-metal-based coordination frameworks (Cu2+–HMT & Ni2+–HMT) were synthesized via a previously reported procedure with minor modifications.40,41 Typically, 1 g (1 mm) of hexamine was dissolved in 10 mL ethanol and stirred at ambient temperature. Subsequently, 0.7 g (1 mm) of Cu (NO3)2 in 5 mL of ethanol was added drop-wise to the above solution. Immediately, the bluish-colored solution formed a blue-colored precipitate, and it was stirred for a further 24 hours. The slightly bluish precipitate was washed with ethanol several times and dried at 70 °C overnight. Finally, Cu–HMT was collected. Ni–HMT was also synthesized using the above procedure. The slightly greenish Ni–HMT was collected.
2.4. Peroxidase-like activity
The reaction of the catalyst Cu–HMT (0.6 mg mL−1), TMB (100 μl of 10 mM) and H2O2 (100 μl of 0.1 M) was carried out in acetate buffer solution (pH 4.5) under ambient conditions. During the reaction, the colorless TMB became blue-colored oxTMB, which was measured using UV-vis spectroscopy and the naked eye. Furthermore, different conditions were optimized, including the TMB concentration, catalyst loading, pH, and concentration of H2O2.
2.5. Real sample analysis
We applied this colorimetric detection platform to determine DA in human urine. Urine was obtained from human subjects, and their consent was recorded through Sri Ramaswamy Memorial Hospital (SRM Hospital). Moreover, a recovery experiment was performed using the standard addition method, in which different concentrations of DA were spiked in human urine samples for analysis.
3. Results and discussion
3.1. Characterization of the synthesized Cu–HMT
The synthetic method gave the pure transition-metal-based hexamine coordination frameworks (Cu2+–HMT & Ni2+–HMT) in high crystalline yield, and is systematically illustrated in Scheme 1a. In terms of coordination chemistry, hexamethylenetetramine (HMT) is a convenient building block due to its diverse chelating ability. It can easily form stoichiometric molecular compounds with transition metals through different coordination sites. In the synthetic procedure, HMT was reacted with the inorganic metal nodes (Cu(NO3)2 and (Ni(NO3)2) to form the crystalline MOFs [Cu–(HMT)2NO3)2]n and [Ni–(HMT)2NO3)2]n, based on previous literature.42 According to theory, the Cu and Ni were coordinated with the oxygen atoms of six water molecules to form an octahedral structure. The Cu cations bind with the HMT ligand via hydrogen bonds between the nitrogen of HMT and a water molecule to form a 1D Cu/HMT zigzag structure. The molecular formula of the 1D zigzag chain can be expressed as Cu(NO3)2(μ2-HMT)2·(H2O)x.43 These 1D zigzag chains can easily assemble into a 2D supramolecular framework. Finally, the 2D supramolecular framework assembles into microplates of Cu–HMT MOFs. The assembly process is typically driven by strong hydrogen bonds because of the bond-accepting behavior of HMT.44 After ultrasonic exfoliation in ethanol solution, Cu–HMT MOF nanosheets are obtained, which further verified that the microplates are stacked 2D coordination frameworks.
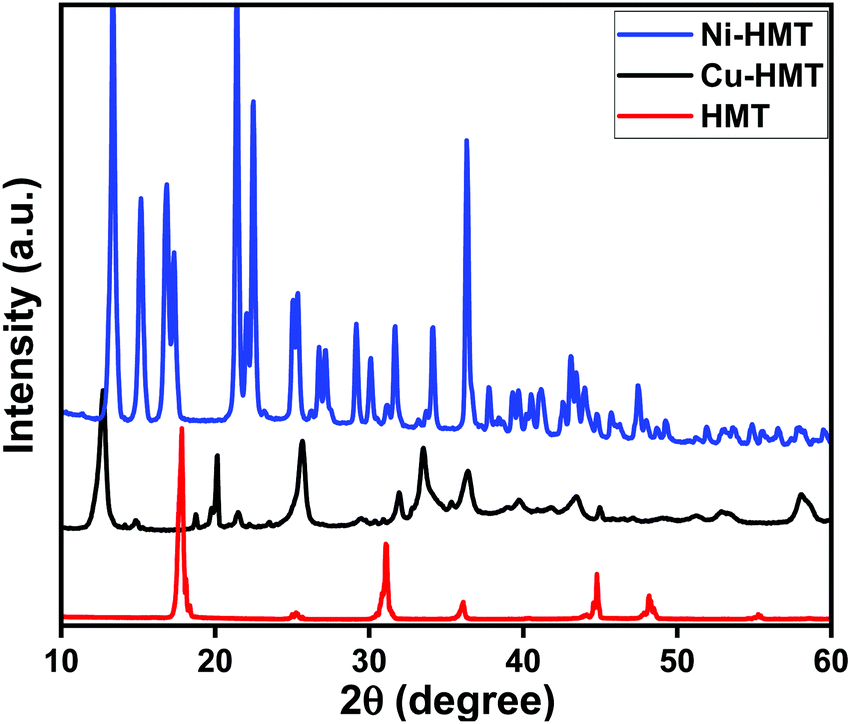
The as-synthesized Cu–HMT and Ni–HMT crystalline phases were extensively investigated using powder X-ray diffraction (PXRD). The PXRD spectra of the synthesized Cu–HMT and Ni–HMT were measured at room temperature over the 10–90° range. As shown in Fig. 1a, the pristine hexamine exhibited strong characteristic diffraction peaks with a highly crystalline nature. The HMT coordinated with the inorganic nodes copper (Cu2+) and nickel (Ni2+), as shown in Fig. 1a and b. After the formation of the coordination framework, the HMT diffraction peaks were slightly shifted, which emphasizes that HMT coordinated with Cu2+ to form the copper-based hexamine coordination framework (Cu–HMT). Fig. 1b shows the crystalline nature of the nickel-based hexamine coordination framework (Ni–HMT). These diffraction patterns matched well with earlier reports (ref. no. 719423 and 04-0850).40,45 The diffraction results confirmed the formation of Cu2+- and Ni2+-based hexamine coordination frameworks (Cu–HMT and Ni–HMT).
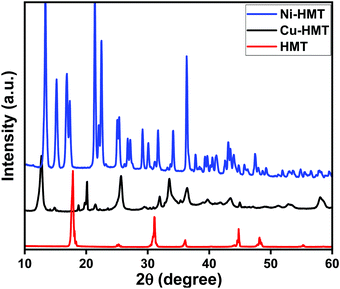 |
| | Fig. 1 PXRD patterns of hexamine, Cu–HMT and Ni–HMT. | |
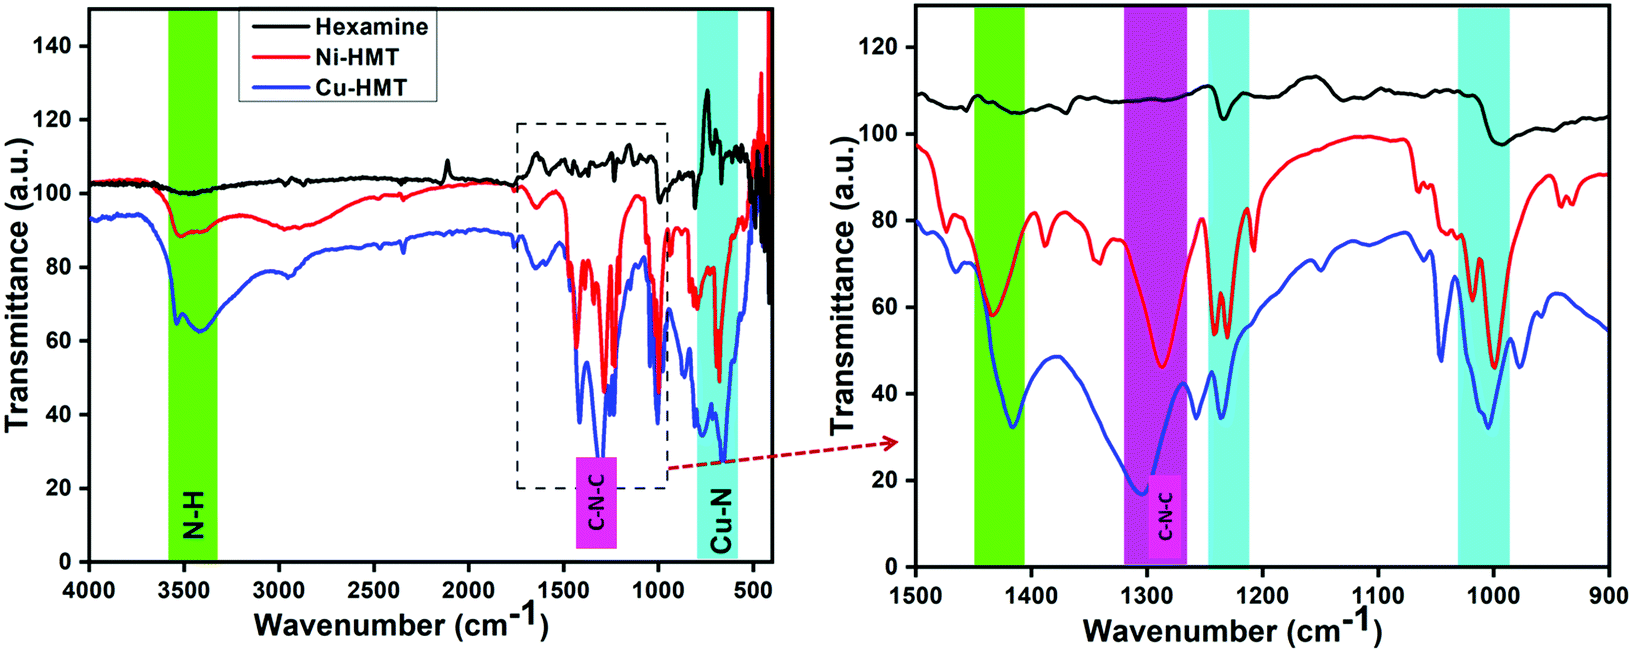
The bonding interactions of the prepared Cu–HMT and Ni–HMT were analyzed via FT-IR spectroscopy. Fig. 2a and b show the bonding vibrations of HMT, Cu–HMT and Ni–HMT. The precursor HMT exhibited two major bands at 998 and 1234 cm−1, which were assigned as C–N bands. Notably, in previous reports, it has been pointed out that hexamine (HMT) acts as a bidentate bridging ligand.42 When the inorganic node (Cu2+) was coordinated with HMT, the HMT characteristic bands were split into doublets due to the coordination between the electron-density-rich nitrogen atom and Cu2+, which clearly indicates the formation of Cu–HMT. The Cu–N vibration band appeared at 560 cm−1, and the stretching vibration peaks at 1620 cm−1 and 1428 cm−1 were ascribed to the deformation vibration of –C–N. Based on the vibration spectra, it can be concluded that Cu–N–Cu linkages were formed. Fig. 2b presents an enlargement of a region of the spectra, showing that the HMT bands were split into doublets and the M–O bands.
 |
| | Fig. 2 FT-IR spectra of Cu–HMT and Ni–HMT. | |
The morphology of the prepared Cu– and Ni–HMT samples were observed using SEM and TEM, as shown in Fig. 3 and Fig. S1 (ESI†). Fig. 3a–c display the microplate morphology of the synthesized Cu–HMT with uniform size. The TEM images depicted in Fig. 3e and f also confirm the uniform microplate-like morphology of Cu–HMT. Furthermore, the high resolution TEM image reveals the presence of a zig-zag-like metal ion chain structure,46 and the SADF pattern reveals the existence of the metal nodes (Cu2+). In addition, the energy-dispersion X-ray (EDX) spectra and elemental mapping also confirmed that the elements C, N, and Cu were present in Cu–HMT, as shown in Fig. 3g and h. Moreover, Ni–HMT was also confirmed using SEM, EDX and mapping, and the results are displayed in Fig. S1 and S2 (ESI†). Based on the obtained microscopic results, we concluded that the Cu–HMT and Ni–HMT had a microplate-like morphology.
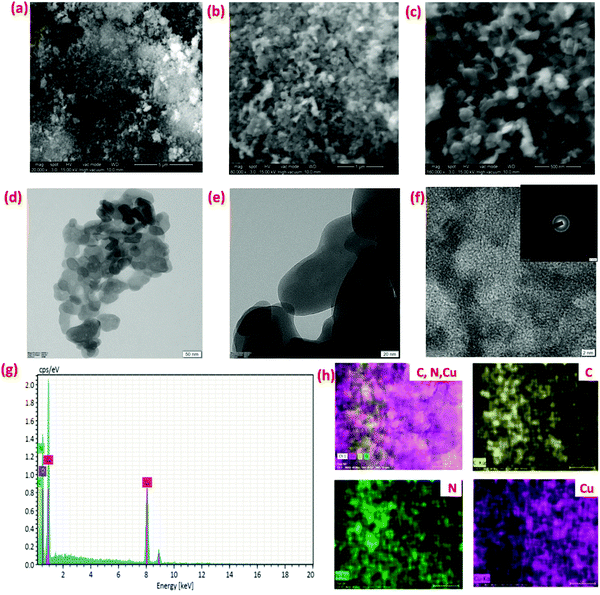 |
| | Fig. 3 Morphology study of the synthesized Cu–HMT. SEM images (a–c) and TEM images (d–f). SEM-EDX spectra (g) and elemental mapping of Cu–HMT (h): carbon (yellow); nitrogen (green); copper (violet). | |
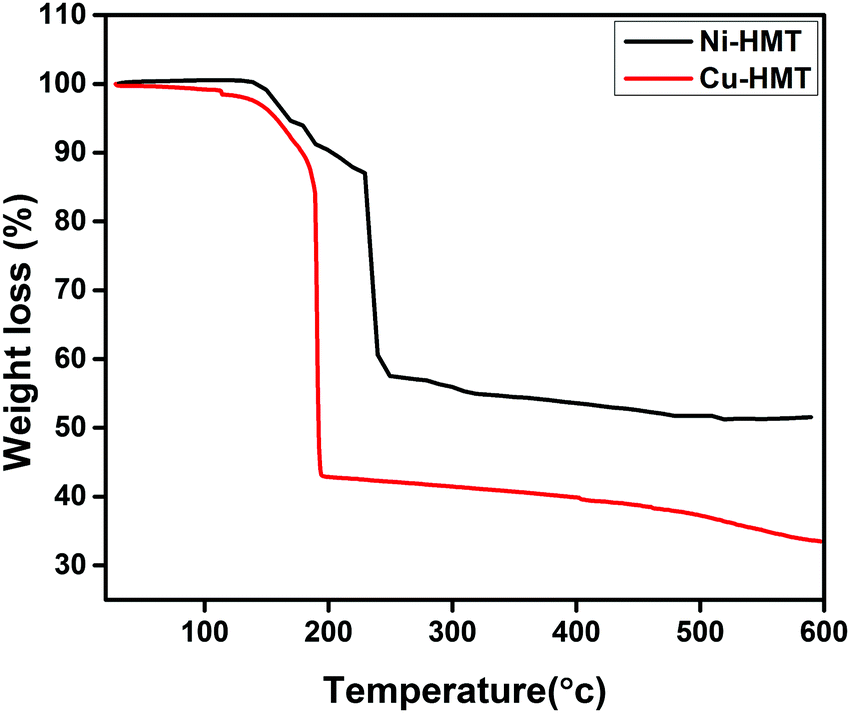
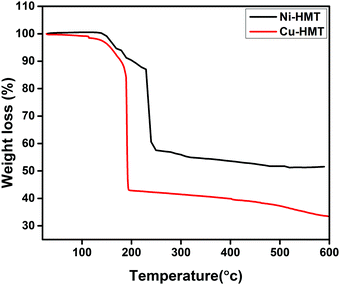
To clarify the thermal stability of the obtained Cu– and Ni–HMT, they were evaluated using thermo-gravimetric analysis (TGA) over the temperature range 0–600 °C, and the results are displayed in Fig. 4. The synthesized Cu- and Ni–HMT have good thermal stability up to 200 and 300 °C, respectively; above these temperatures, they began to decompose. Cu–HMT has lower stability compared to Ni–HMT because of hydrogenation. However, Cu–HMT has excellent water stability compared to Ni–HMT.47
 |
| | Fig. 4 TGA curves of the as-obtained Cu–HMT and Ni–HMT. | |
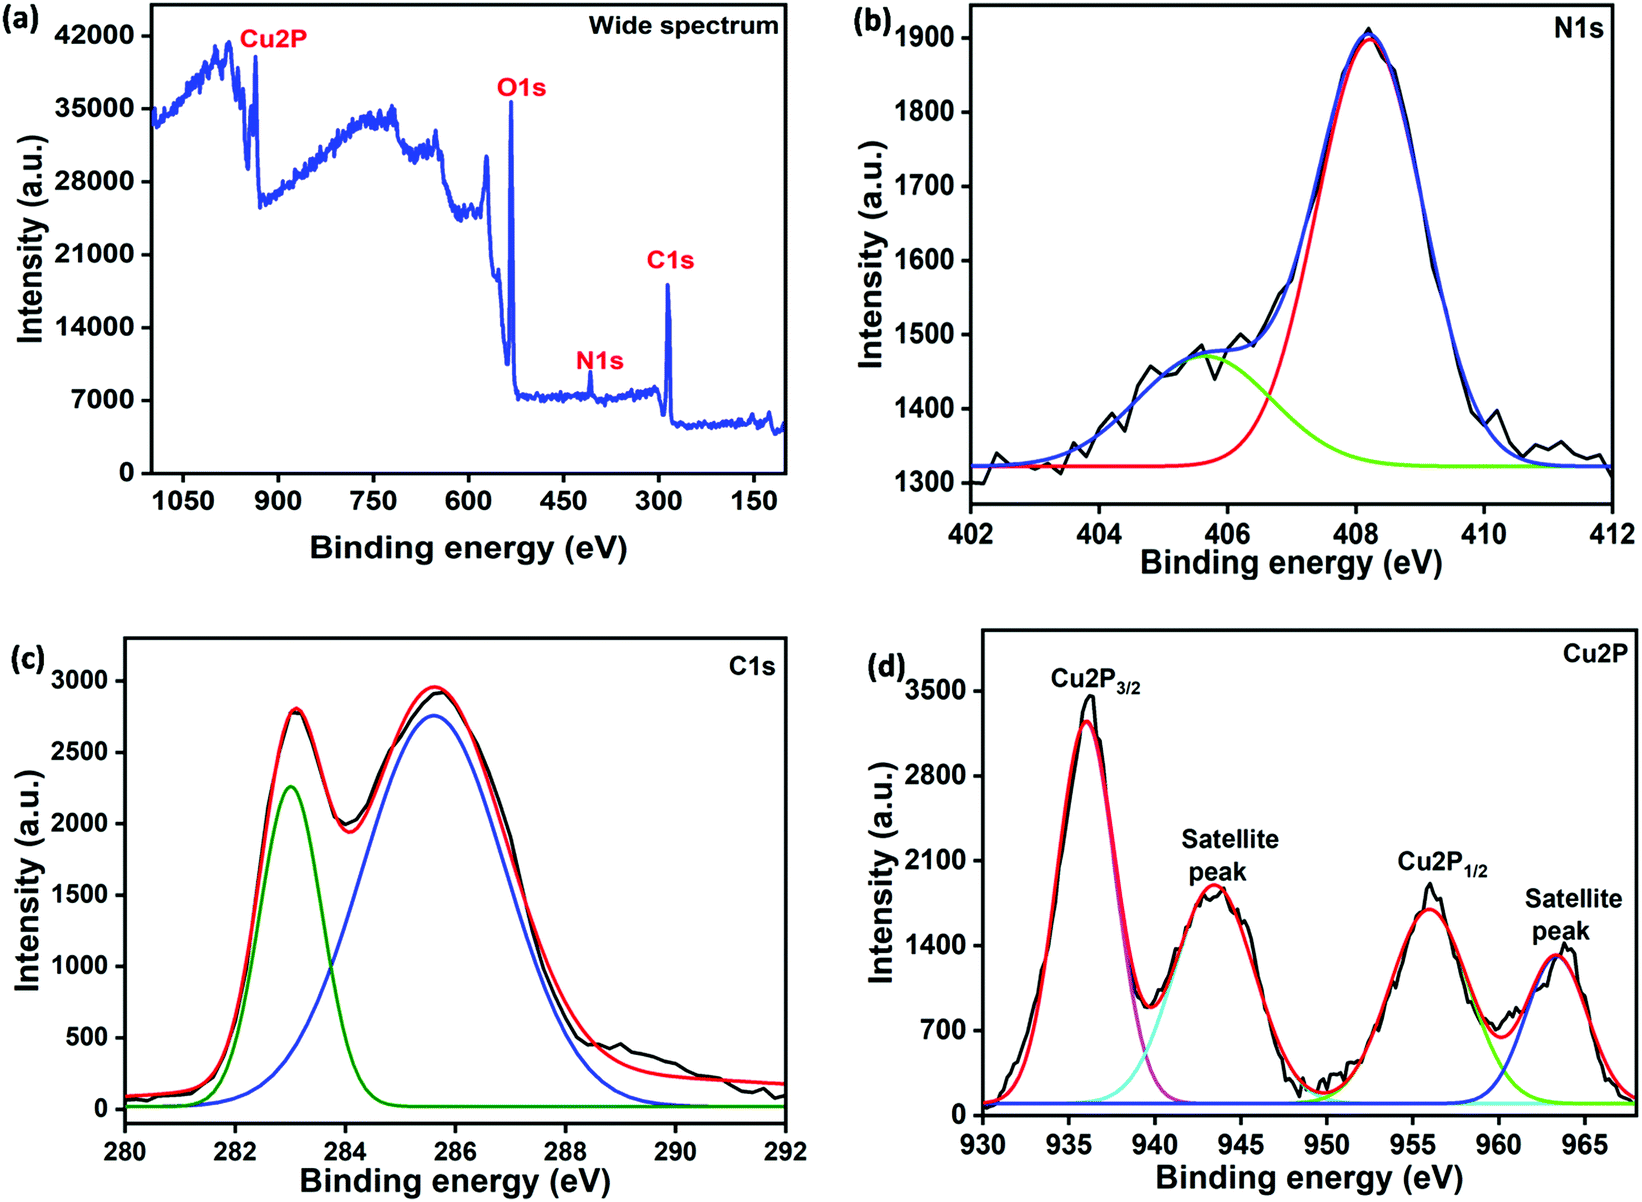
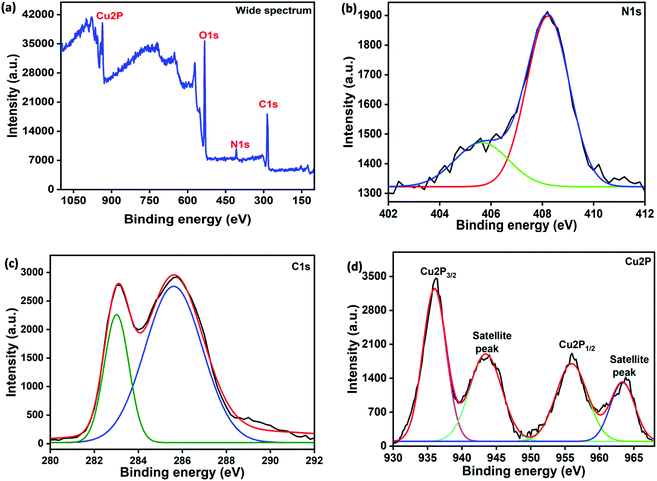
The N2 adsorption–desorption studies determined the surface area of Ni–HMT and Cu–HMT, and the results are shown in Fig. S3 (ESI†). As shown in Fig. S3 (ESI†), the Brunauer–Emmett–Teller (BET) surface area and pore volume of pristine Ni–HMT and Cu–HMT were found to be 212.186 m2 g−1 and 521.560 m2 g−1, and 0.223 cc g−1 and 0.393 cc g−1, respectively. In this observation, Cu–HMT had higher surface area and pore volume compared to Ni–HMT. High surface area promotes high catalytic activity for the oxidation of TMB. XPS analysis further verified the chemical bonding and chemical composition of Cu–HMT, as shown in Fig. 5. The wide-range spectrum of Cu–HMT confirmed the presence of C, N and Cu (Fig. 5a). The high-resolution Cu 2p spectrum showed two major characteristic peaks at 936.06 and 956 eV, which indicated the Cu2+ state in Cu–HMT, which suggested that Cu2+ could coordinate with the bidentate ligand. Moreover, associated satellite peaks were observed at binding energies of 943.46 and 963.26 eV, as shown in Fig. 5d.48 As depicted in Fig. 5b, the N 1s core-level spectrum of Cu–HMT can be deconvoluted into peaks with binding energies of 405.72 and 408.23 eV, which were attributed to pyrrolic nitrogen (C–N–C) and quaternary nitrogen, respectively. The C1s core-level spectrum exhibited peaks with binding energies of 282 and 285.6 eV, which were associated with C–N and sp3 carbons (Fig. 5c).49 Based on the results, we concluded that the oxidation state Cu2+ existed in Cu–HMT and that the nitrogen atom of HMT bound with Cu2+.
 |
| | Fig. 5 XPS spectra of Cu–HMT: (a) survey, (b) N 1s, (c) C 1s, and (d) Cu 2p. | |
3.2. Peroxidase-like activity of Cu–HMT
In the visual detection method, the peroxidase-like activity is indispensable. On this basis, the method was intended to evaluate the peroxidase-like activity of Cu–HMT via the oxidation of TMB. We analyzed the catalytic oxidation capacity of Cu–HMT using the results shown in Fig. 6, in which Cu–HMT (A), TMB (B), and H2O2 (C) are clearly denoted. As shown in Fig. 6a, we did not observe any significant colour change in the systems including A, B, C, A + B, or A + C. However, the combination A + B + C system revealed a robust colour change due to the oxidation of TMB (shown in the inset optical photograph). The colour shift clearly indicated that the as-obtained Cu–HMT has robust peroxidase-like catalytic function. Additionally, the UV-visible spectrum also a solid support for oxidation of the TMB with a absorbance band. In particular, the A + B + C system has viable peroxidase-mimic catalytic behavior due to the charge transfer process. Moreover, the prevention of the peroxidase-mimic activity was studied in the presence of DA. As shown in Fig. 6b, the A + B + C system exhibited a strong blue color due to oxidized TMB, as well as an absorption band at A652![[thin space (1/6-em)]](https://www.rsc.org/images/entities/char_2009.gif) nm. Interestingly, with the addition of DA to the blue-colored oxTMB, as predicted, the blue colour vanished, which suggested that DA inhibited the oxidation process. Additionally, an optical photograph clearly displayed a colour change in presence and absence of DA (shown in the inset photograph).
nm. Interestingly, with the addition of DA to the blue-colored oxTMB, as predicted, the blue colour vanished, which suggested that DA inhibited the oxidation process. Additionally, an optical photograph clearly displayed a colour change in presence and absence of DA (shown in the inset photograph).
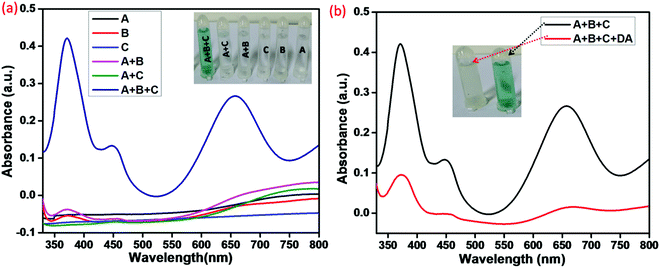 |
| | Fig. 6 (a) The UV-visible spectra of Cu–HMT (A), TMB (B), H2O2 (C), Cu–HMT + TMB (A + B), Cu–HMT + H2O2 (A + C), and Cu–HMT + TMB + H2O2 (A + B + C) with the corresponding photograph in the inset. (b) Absorption spectra in the presence and absence of DA; the color change is shown in the inset photograph. | |
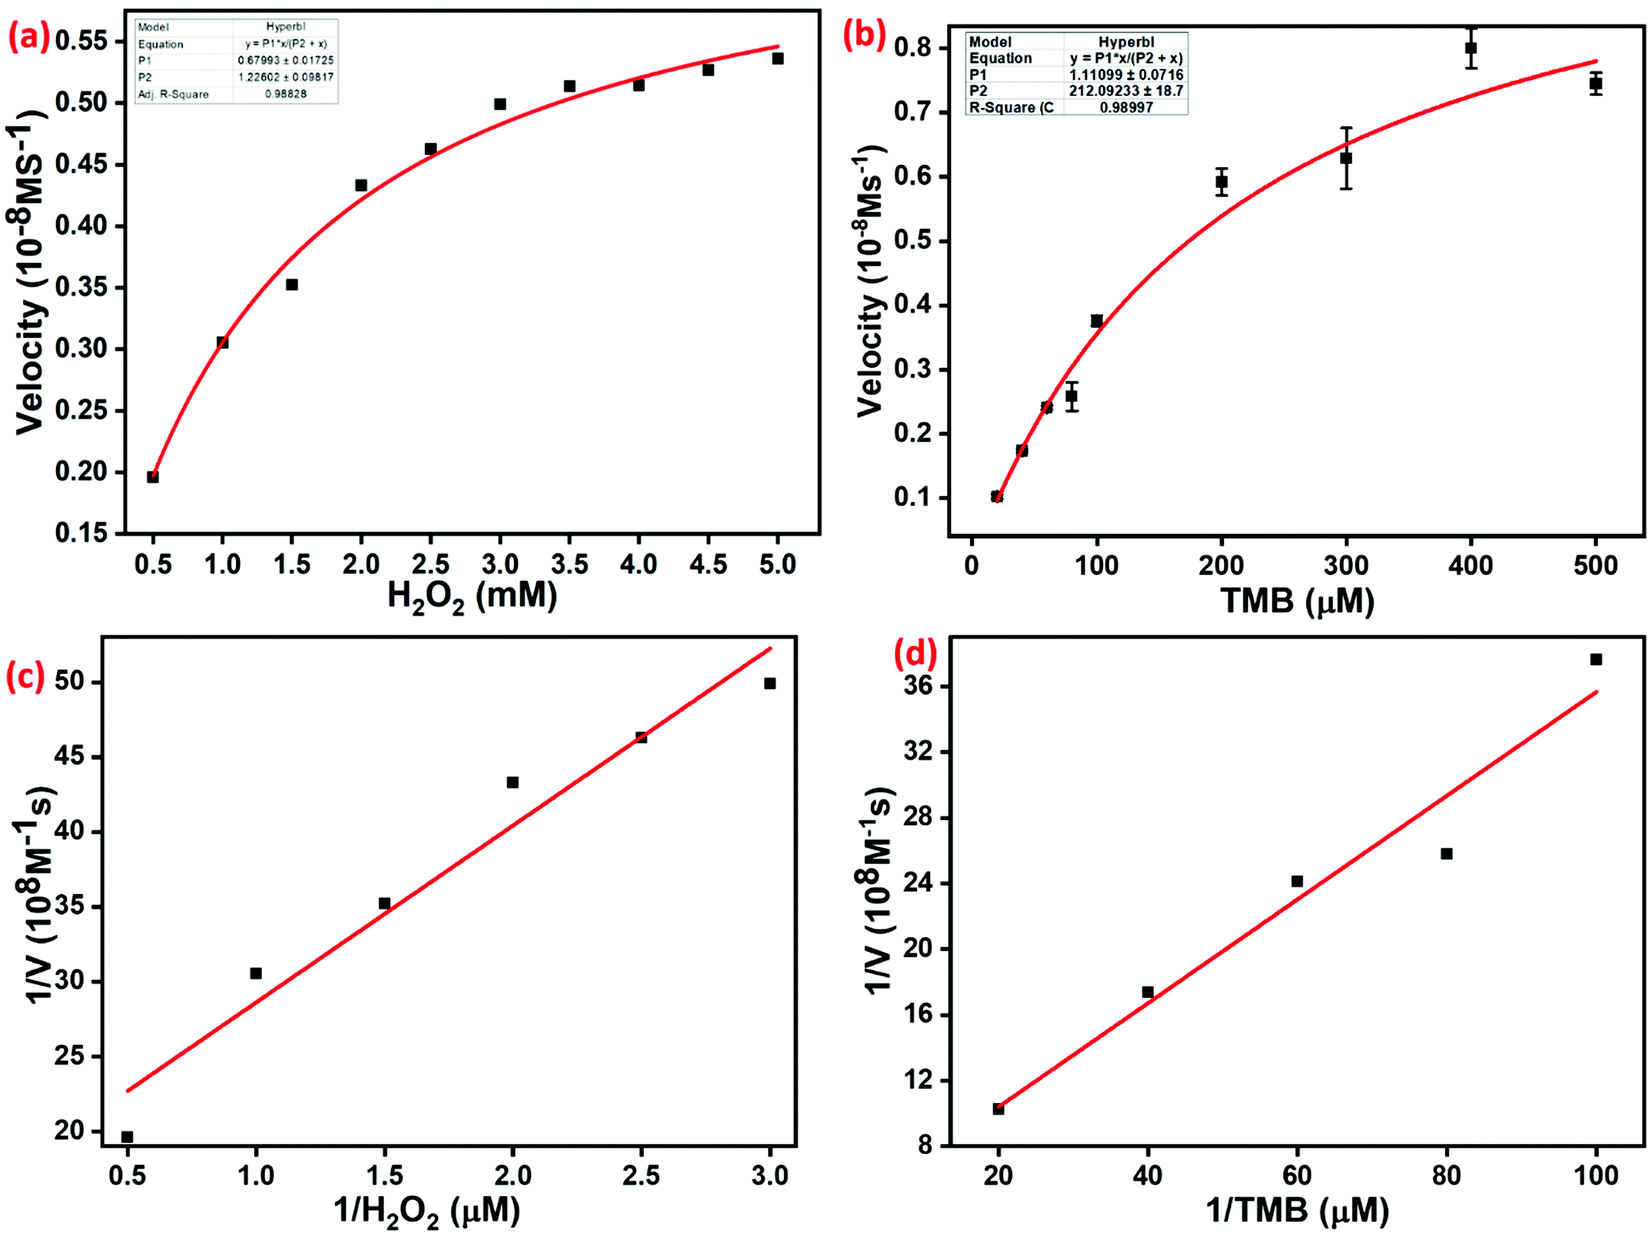
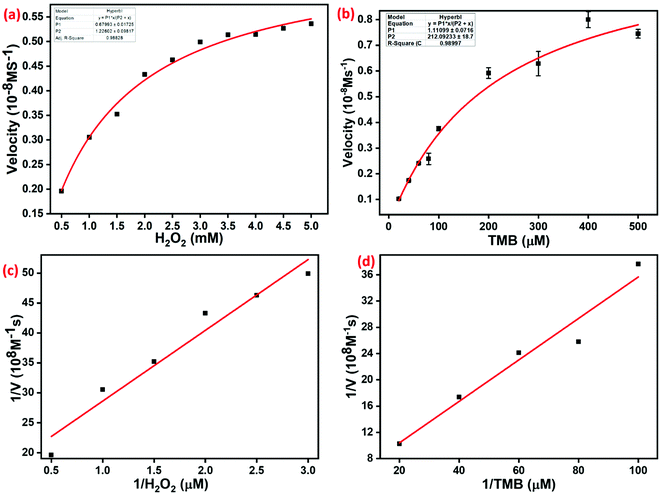
3.3. Michaelis–Menten study
The catalytic behavior of TMB and H2O2 was studied using the steady-state kinetic mode. The Michaelis–Menten curves were obtained by altering the concentration of either TMB or H2O2 as the substrates. Moreover, the Michaelis–Menten curves (Fig. 7a and b) and Lineweaver–Burk plots (Fig. 7c and d) were obtained for TMB and H2O2 over a certain concentration range. Subsequently, we fitted the Lineweaver–Burk plot to calculate the Michaelis–Menten constant (Km) and maximal initial velocity (V) of the catalytic reaction involving Cu–HMT. The Michaelis–Menten kinetics equation is V = (Vmax × [S])/(Km + [S]). The Lineweaver–Burk double reciprocal plot is expressed as: 1/V = (Vmax/Km)(1/[S]) + (Vmax/1). Km is the Michaelis–Menten constant, Vmax is the maximum velocity, and S is the substrate concentration. The value Km is an important factor to determine the catalytic activity and the affinity between the enzyme and substrate. The Km values of Cu–HMT for the substrates H2O2 and TMB were 0.6799 mM and 1.1343 mM. Moreover, the calculated Vmax values of these two systems were 1.2 × 10⁸ M−1 s and 214.8 × 10⁸ M−1 s, respectively. Moreover, the Km value and Vmax values of Cu–HMT were compared with those of horseradish peroxidase (HRP) and other MOFs in Table 1. Based on the results, we concluded that as-prepared Cu–HMT has superior binding affinity towards H2O2 and TMB, which enhanced the peroxidase-like activity.
 |
| | Fig. 7 (a) Kinetic data obtained by varying the H2O2 concentration while keeping the concentration of TMB constant. (b) Kinetic data obtained by varying the TMB concentration while keeping the concentration of H2O2 constant. (c and d) Lineweaver–Burk plots of the double reciprocal of the Michaelis–Menten equations for H2O2 and TMB. | |
Table 1 Comparison of the binding affinity and velocity for the peroxidase-like activity of HRP and other MOFs
| Enzyme mimic |
Substrate |
K
m (mM) |
V
max (10−1 M s−1) |
Ref. |
| HRP |
H2O2 |
3.7 |
8.1 |
33
|
| TMB |
0.434 |
10 |
| MOF-808 |
H2O2 |
1.06 |
1.39 |
50
|
| TMB |
0.0796 |
3.12 |
| Cu–HMT |
H2O2 |
0.68 |
1.343 |
This work |
| TMB |
1.2 |
214 |
3.4. Peroxidase-like catalytic activity pathway
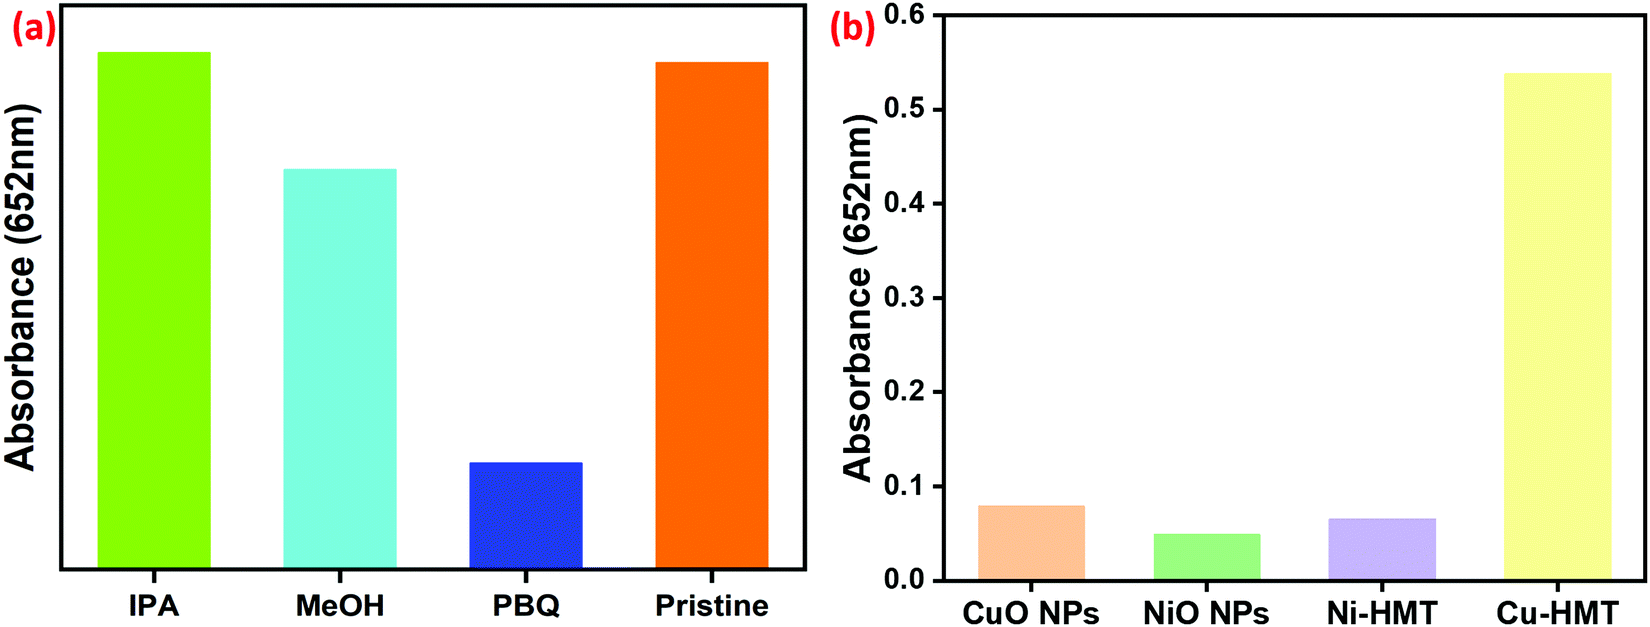
The catalytic mechanism of Cu–HMT was examined through trapping reactive oxygen species (ROS) during the catalytic reaction, and a comparison with related nanozymes and the resultant spectra are shown in Fig. 8. To clarify, the peroxidase-mimic reaction was carried out via ROS including hydroxyl (˙OH) and superoxide (˙O2−), which are trapped by the radical scavengers IPA or methanol and p-benzoquinone (PBQ), respectively. As shown in Fig. 8a and Fig. S6 (ESI†), Cu–HMT showed higher catalytic activity without any scavengers. The addition of IPA or methanol into the solution slightly reduced the A652nm peak, indicating that a negligible quantity of hydroxyl radicals was produced, which suggests that the hydroxyl radical does not make a major contribution to the particular chromogenic oxidations. Furthermore, the absorption peak A652nm was suppressed when PBQ was added to the initial solution, indicating the inhibition of peroxidase-like activity, which in turn indicates that the peroxidase-like activity is carried out specifically by ˙O2−. We then conducted an analysis using a nitroblue tetrazolium (NBT) superoxide dismutase (SOD) assay. NBT is commonly used for SOD analysis, and exhibits an absorbance band at 550 nm in the presence of riboflavin and light.56 In the same way, in our case, the absorption band of NBT at 550 nm in the presence of Cu–HMT and H2O2 was examined. The bare NBT had an absorption band with low intensity; after incubation with Cu–HMT and H2O2, the NBT absorbance band at 550 nm increased due to the production of superoxide ions (Fig. S5, ESI†). Further radical scavenger experiments also revealed ˙O2− to be a major reactive species in the Cu–HMT system. The peroxidase mimic activity of Cu–HMT was compared with those of CuO NPs, NiO NPs, and Ni–HMT, and the results are displayed in Fig. 8b and Fig. S7 (ESI†). Among them, Cu–HMT showed superior catalytic activity due to a higher concentration of ROS. Moreover, TMB and H2O2 can easily absorb on the surface of Cu–HMT. Therefore, the numerous lone-pair electrons will increase the electron density and mobility on the lattice of Cu–HMT, which decomposed H2O2 into reactive oxygen species (˙O2−). Copper (Cu2+) has redox properties that have been utilized for superoxide generation; copper (Cu+) directly activates molecular oxygen to superoxide (˙O2−), but Ni2+ does not have the same properties. Indirectly, adsorption of the oxTMB substrate on HMT blocks the catalytic Ni2+ sites, similar to the results observed in the previous result. Ni–HMT has less activity compared to the Cu–HMT. The detection limits are also compared with those of other related nanozymes in Table 2.
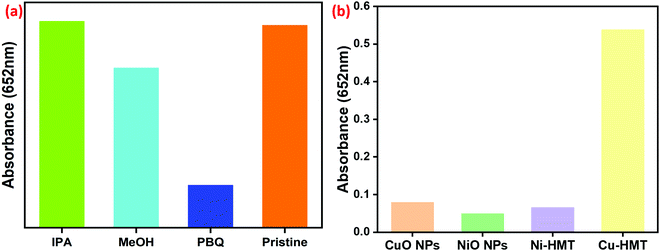 |
| | Fig. 8 (a and b) Absorption spectra results from the radical scavenging experiments and a comparison of the peroxidase-mimic activity of CuO NPs, NiO, Ni–HMT and Cu–HMT. | |
Table 2 Comparison between the performances of various nanomaterials reported as DA sensors
| Serial no. |
Material |
Method |
Linear range |
LOD (μM) |
Ref. |
| 1 |
Ag NPs |
Colorimetric |
3.2–20 μM |
1.20 |
51
|
| 2 |
Au NPs |
Colorimetric |
2.5–20 μM |
2.50 |
52
|
| 3 |
Cu2+ |
Colorimetric |
1–50 μM |
1 |
53
|
| 4 |
CuS/rGO |
Colorimetric |
2–100 μM |
0.48 |
54
|
| 5 |
Cu-MOXs |
Colorimetric |
0.5–20 μM |
8.6 |
55
|
| 6 |
Cu(PDA)(DMF) |
Colorimetric |
1–10 mM |
— |
26
|
| 7 |
Cu–HMT |
Colorimetric |
0.5–3.5 mM |
4.2 |
This work |
3.5. Optimization of the sensing conditions
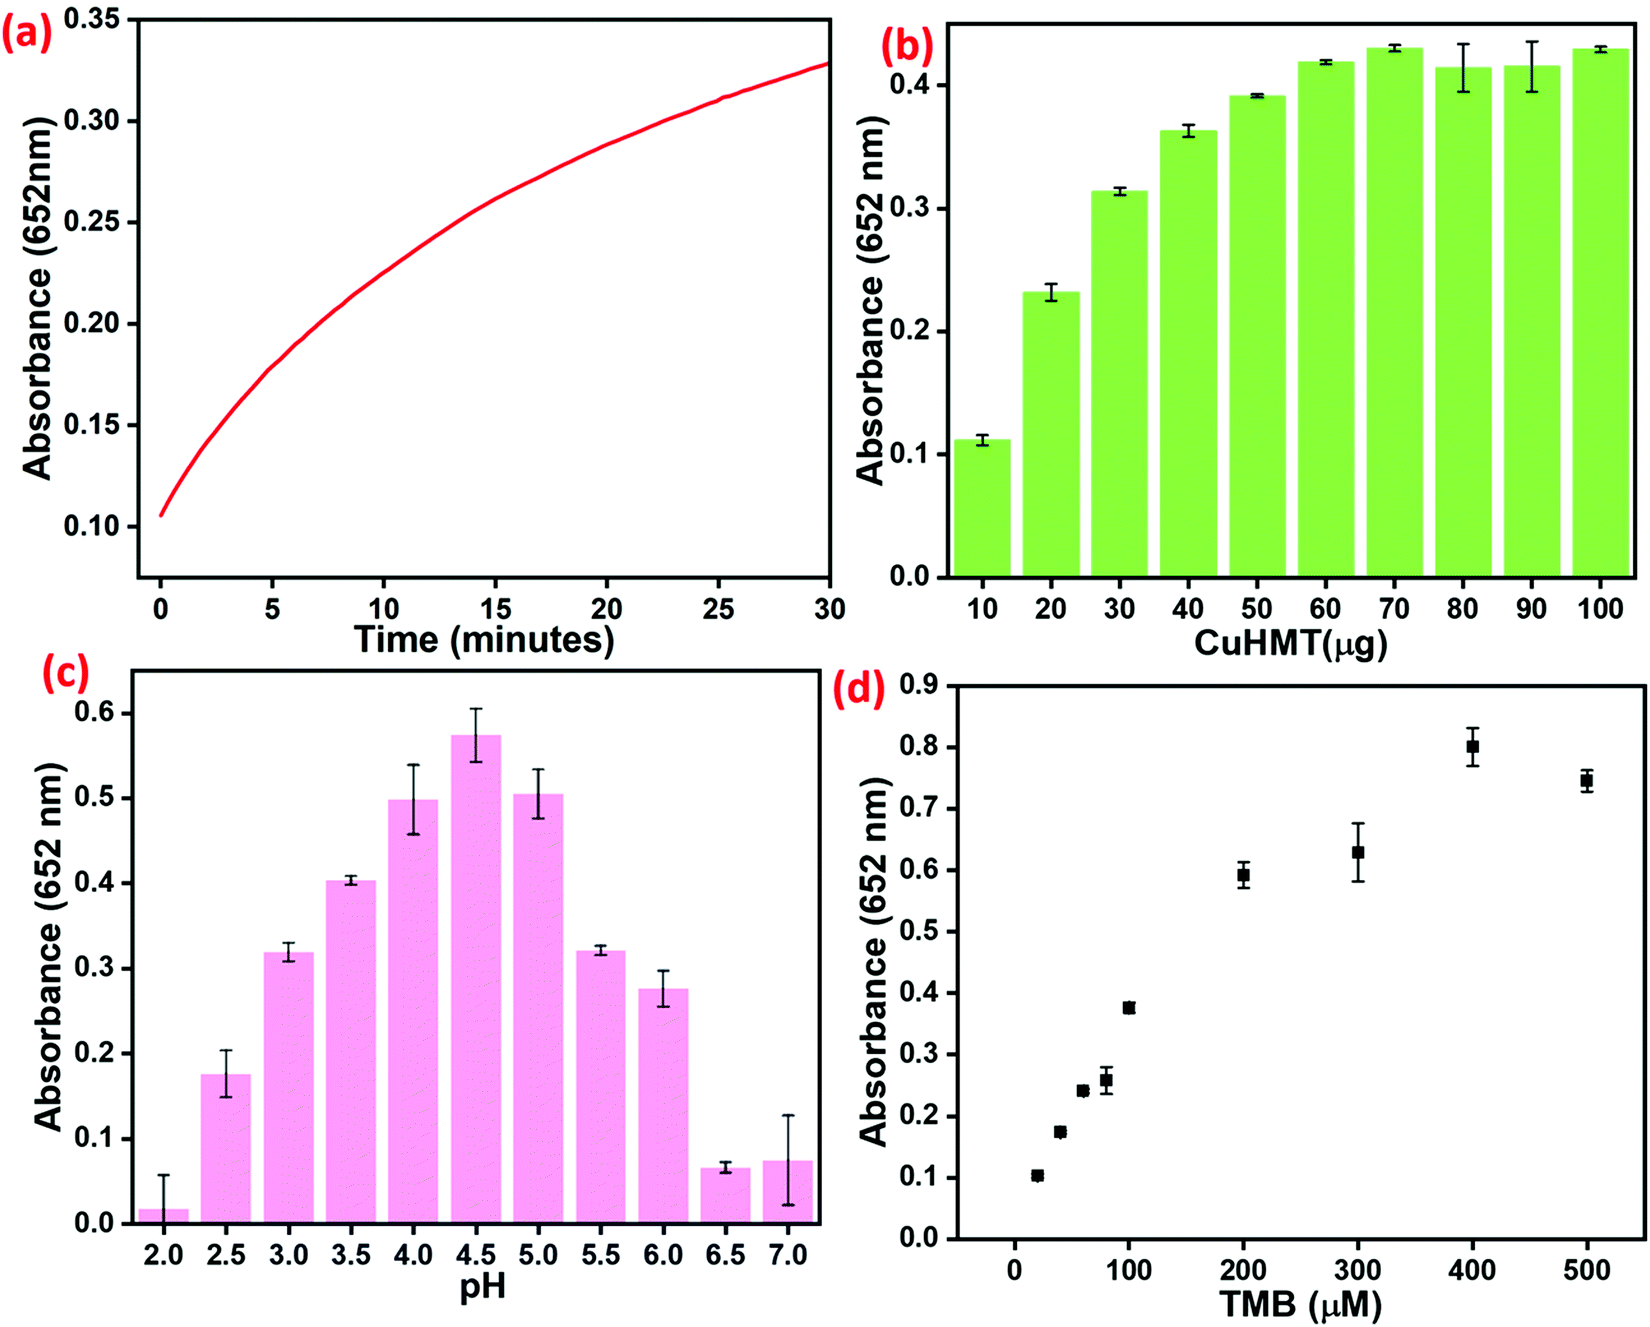
In the context of developing a Cu–HMT sensor with strong peroxidase activity, several experimental factors were optimized, including the amount of Cu–HMT, concentration of TMB, concentration of Cu–HMT, time, temperature, and pH (Fig. 9). Prior to testing the sensor, the mimic catalytic activity was explored using various amounts of the prepared Cu–HMT (2, 4, 6, 8, and 10 mg), as shown in Fig. S4 (ESI†). Among them, 6 mg of Cu–HMT exhibited higher catalytic activity compared to the other nanomaterial amounts. Consequently, the time-dependent peroxidase-like activity was determined using 6 mg of Cu–HMT in 2 ml buffer solution, and the results are displayed in Fig. 9a. Subsequently, as the concentration of Cu–HMT was varied from 10–70 μM with 6 mg of Cu–HMT in the system, the absorption peak A656nm gradually increased with a hypochromic effect; further increasing the concentration of Cu–HMT did not result in any obvious absorption peak shift. These results are displayed in Fig. 9b. Among the tested concentrations, 70 μM resulted in tremendous peroxidase-like activity. Moreover, we performed the reaction of H2O2, TMB and Cu–HMT at different pH values (2 to 7), which resulted in colour change as well as absorption peak shift, as displayed in Fig. 9c. Among the tested pH values, those in the acidic range (pH 2 to 4) showed a yellowish color with an absorption band at A420nm, which corresponds to a two-electron transfer process. Furthermore, when the pH was increased to 4.5 and 5, the TMB changed from colorless to a blue color with an absorption peak at A652nm, demonstrating one-electron transfer. Interestingly, less peroxidase-like activity was observed above pH 5 to 7 due to the lower stability of H2O2 and TMB. The absorption spectra results reveal that pH 4.5 resulted in superior peroxidase-like activity compared to the other pH values. Subsequently, the concentration of TMB was optimized by varying the concentration of TMB, suggesting that the maximum activity occurred at 100 μM, as displayed in Fig. 9d.
 |
| | Fig. 9 Optimization experiments: absorbance at different times (a), using various concentrations of Cu–HMT (6 mg) (b), different pH values (c) and different concentrations of the chromogenic substrate TMB (d). | |
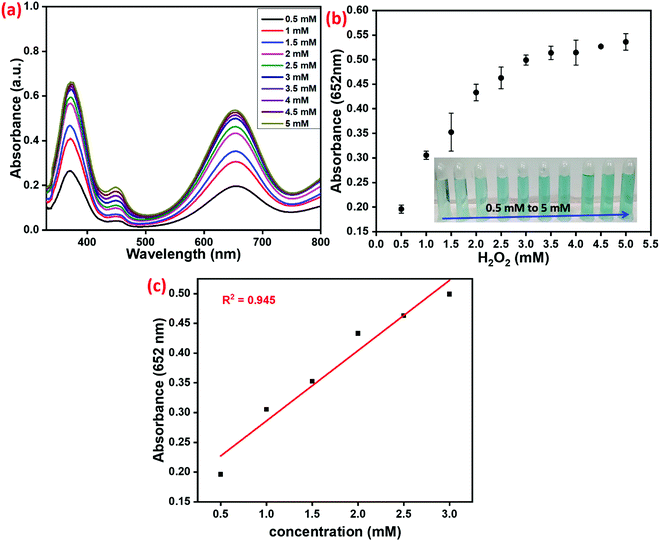
The determination of H2O2via peroxidase-mimic activity using the synthesized Cu–HMT is shown in Fig. 10. The above-mentioned optimized conditions for Cu–HMT and TMB were used in the presence of various concentrations of H2O2, which decomposes the H2O2 into the reactive active species. Hence, the ROS produced from the different concentration of H2O2 could oxidize TMB, which turns blue in colour (Fig. 10a). Moreover, the absorption band was A652nm, which also indicates a one-electron transfer process. As shown in Fig. 10b, the enhancement of the relative intensity of the absorbance band at A652nm was plotted versus various concentrations of H2O2 (the inset photograph shows the reaction system with different concentrations of H2O2). A linear calibration plot (R2 = 0.945) was obtained for the different concentrations of H2O2 (Fig. 10c).
 |
| | Fig. 10 (a) UV-vis spectra of the oxidized TMB product produced in the presence of different concentrations of H2O2. (b) Plot of the enhancement of the relative intensity of the absorbance band at 652 nm versus various concentrations of H2O2 (inset optical image shows the reaction system with different concentrations of H2O2). (c) Linear calibration plot for different concentrations of H2O2 in the reaction system. | |
3.6. Inhibition effect of DA
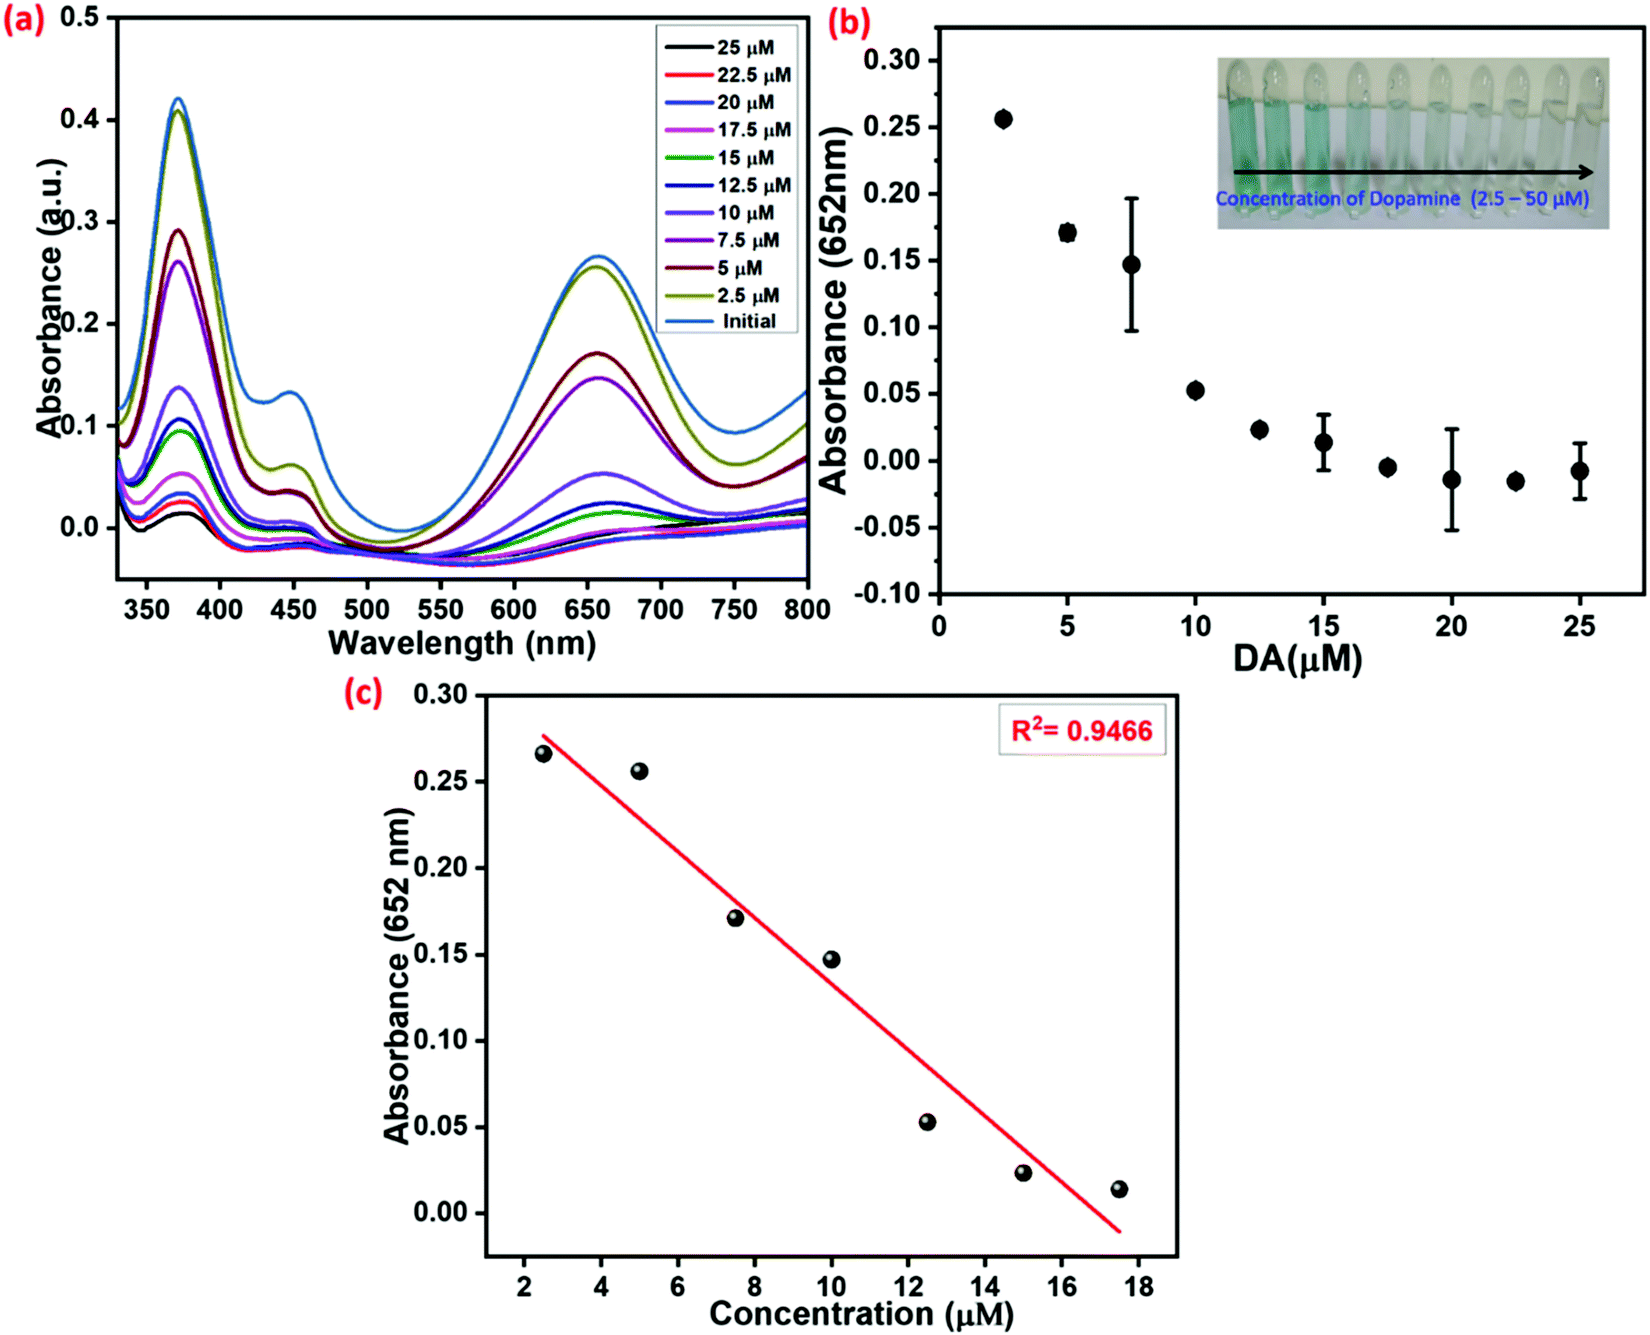
After demonstrating the excellent peroxidase-like activity of the copper hexamine coordination framework (Cu–HMT), the inhibition effect on the peroxidase-like activity in the presence of DA was investigated. The strongly blue-colored oxTMB was associated with the absorption band at 652 nm in the above-mentioned system in the absence of DA. However, the addition of DA into the system inhibited the peroxidase-like activity. The absorption spectra for different concentrations of DA (2.5 μM to 20 μM) are shown in Fig. 11. As shown in Fig. 11a, the bright blue colour faded, and the absorption band at A652nm was hypochromically shifted. The absorption peak attained a steady-state at 17 μM of DA. Fig. 11b shows the relative intensity of absorbance plotted versus various concentrations of DA. The inset digital photographic images display discoloration, which confirms the inhibition effect. The calibration curve of absorbance versus the concentration of DA was linear with a range of 2.5–17.5 μM (R2 = 0.946); the result is shown in Fig. 11c.
 |
| | Fig. 11 UV-vis spectra of the oxidized TMB product in the presence of different concentrations of DA. (b) Plot of the suppression of the relative absorbance band intensity at 652 nm versus the concentration of DA (the inset optical image shows the reaction system with different concentrations of DA). (c) Linear calibration plot of different concentrations of DA in the reaction system. | |
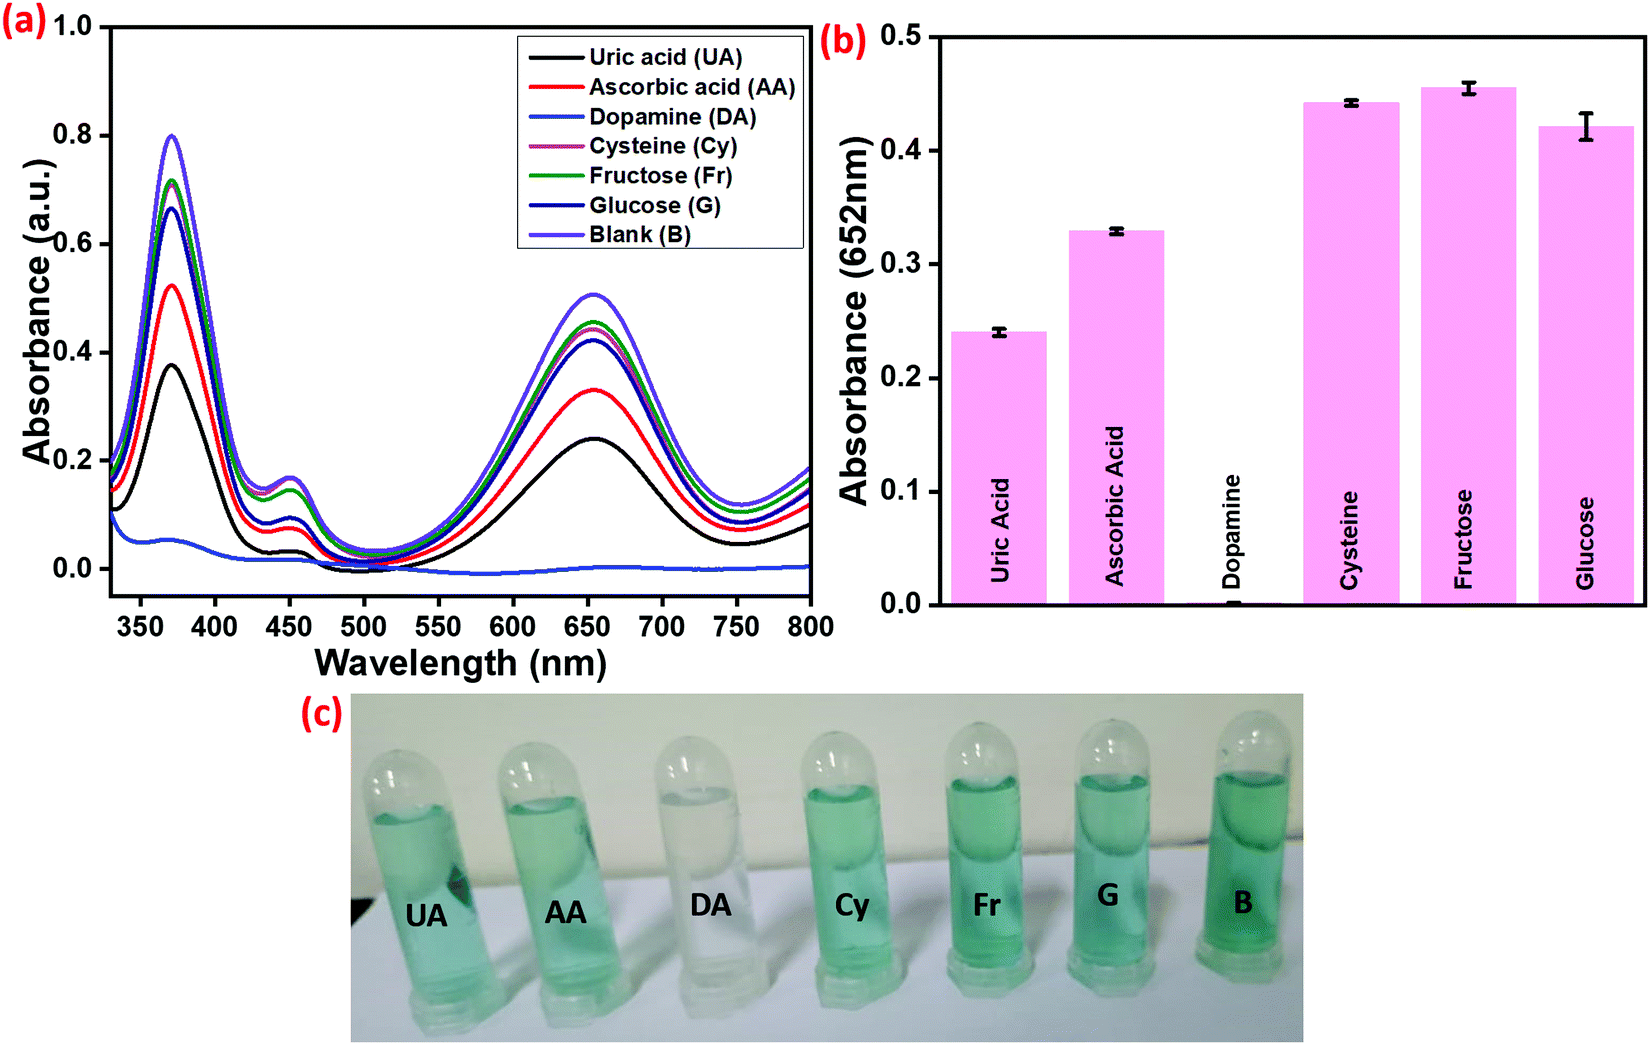
To analyze the selectivity of the prepared Cu–HMT, DA, UA, AA, Cy, Fr and G were selected as inhibitors of peroxidase-like activity. As shown in Fig. 12, the absorption intensity at 656 nm and the blue color of oxTMB remained unchanged before the addition of the inhibitors. Afterwards, we find that DA induces a surprising decrease in the absorption characteristics of the oxidized TMB relative to other interfacial substances; this finding indicates that the absorption peaks are modified in the presence of DA. Fig. 12b and c present the relative identification efficiency of DA and the colour difference, which demonstrates that DA causes especially strong fading compared to the other substances. Finally, we infer that DA selectively blocks the peroxidase-like activity. Ascorbic acid shows a small extent of inhibition of the TMB oxidation. Further optimization of the preparation should be possible, and we will investigate this in the future. Additionally, real human samples were successfully analyzed with 93–97% recovery, and the results are displayed in Table 3.
 |
| | Fig. 12 (a) Selectivity of Cu–HMT towards DA detection in comparison to other interfering substances. (b) Bar plot of the relative detection efficiency showing the absorbance at 652 nm. (c) Optical images of decolorization in the presence of DA. The standard values used for the selectivity study were: TMB (100 μM), H2O2 (100 μM), catalyst solution (0.7 mg mL−1) with DA (50 μM) or other interferent substances (100 μM). | |
Table 3 Results for the determination of DA in human urine samples
| Urine |
DA spiked |
DA found |
Recovery (%) |
| 1 |
10 |
9.3 |
93 |
| 2 |
20 |
17.5 |
92 |
| 3 |
30 |
27.3 |
97 |
4. Conclusion
In summary, a facile one-pot method was developed to synthesize a transition metal (Cu2+ and Ni2+)-based coordination framework for the highly selective detection of H2O2 and DA. The prepared Cu2+ and Ni2+–HMT showed adequate peroxidase-like activity; Cu–HMT has greater water stability as well as higher catalytic activity compared to Ni–HMT. Interestingly, Cu–HMT displays remarkable enhancement and inhibition of its peroxidase-like activity towards H2O2 and DA detection compared to the other nanomaterials. Under the optimized conditions, the analytical performance of the developed colorimetric sensor exhibits excellent selectivity towards H2O2 and DA even in the presence of other molecules, with detection limits of 4.2 nM and 0.7 nM, respectively. The proposed method is rapid, simple, reliable and highly feasible for real sample analysis, with the detection of DA being achieved in human urine samples. We believe that the as-synthesized Cu–HMT with peroxidase-mimic activity is an ideal material for use in practical applications for versatile purposes.
Conflicts of interest
There are no conflicts to declare.
Acknowledgements
Authors acknowleges the “Selective Excellence Research Initiative Fund SRMIST-2021” from Department of Chemistry, SRM Institute of Science and Technology. This study was supported by the Department of Chemistry and SRM-SCIF from the SRM Institute of Science and Technology, Tamil Nadu – 603 203, India.
References
- Y. Meng, W. Li, X. Pan and G. M. Gadd, Environ. Sci.: Nano, 2020, 7, 1305–1318 RSC.
- J. Wu, X. Wang, Q. Wang, Z. Lou, S. Li, Y. Zhu, L. Qin and H. Wei, Chem. Soc. Rev., 2019, 48, 1004–1076 RSC.
- H. Wei and E. Wang, Chem. Soc. Rev., 2013, 42, 6060–6093 RSC.
-
S. Cai and R. Yang, Nanozymology, Springer, 2020, pp. 331–365 Search PubMed.
- L. Gao, J. Zhuang, L. Nie, J. Zhang, Y. Zhang, N. Gu, T. Wang, J. Feng, D. Yang and S. Perrett, Nat. Nanotechnol., 2007, 2, 577–583 CrossRef CAS PubMed.
- L. Huang, Q. Zhu, J. Zhu, L. Luo, S. Pu, W. Zhang, W. Zhu, J. Sun and J. Wang, Inorg. Chem., 2019, 58, 1638–1646 CrossRef CAS PubMed.
- S. He, L. Yang, P. Balasubramanian, S. Li, H. Peng, Y. Kuang, H. Deng and W. Chen, J. Mater. Chem. A, 2020, 8, 25226–25234 RSC.
- S. R. Ahmed, J. Cirone and A. Chen, ACS Appl. Nano Mater., 2019, 2, 2076–2085 CrossRef CAS.
- Y. Liu, X. Wang and H. Wei, Analyst, 2020, 145, 4388–4397 RSC.
- Y. Huang, J. Ren and X. Qu, Chem. Rev., 2019, 119, 4357–4412 CrossRef CAS PubMed.
- D. Wang, D. Jana and Y. Zhao, Acc. Chem. Res., 2020, 53, 1389–1400 CrossRef CAS PubMed.
- I. Nath, J. Chakraborty and F. Verpoort, Chem. Soc. Rev., 2016, 45, 4127–4170 RSC.
- J.-R. Li, R. J. Kuppler and H.-C. Zhou, Chem. Soc. Rev., 2009, 38, 1477–1504 RSC.
- M. Marieeswaran and P. Panneerselvam, RSC Adv., 2020, 10, 3705–3714 RSC.
- J. Lee, O. K. Farha, J. Roberts, K. A. Scheidt, S. T. Nguyen and J. T. Hupp, Chem. Soc. Rev., 2009, 38, 1450–1459 RSC.
- P. Karthik, R. Vinoth, P. Zhang, W. Choi, E. Balaraman and B. Neppolian, ACS Appl. Energy Mater., 2018, 1, 1913–1923 CrossRef CAS.
- S. Wang, W. Deng, L. Yang, Y. Tan, Q. Xie and S. Yao, ACS Appl. Mater. Interfaces, 2017, 9, 24440–24445 CrossRef CAS PubMed.
- L. Ai, L. Li, C. Zhang, J. Fu and J. Jiang, Chem. – Eur. J., 2013, 19, 15105–15108 CrossRef CAS PubMed.
- W. Dong, X. Liu, W. Shi and Y. Huang, RSC Adv., 2015, 5, 17451–17457 RSC.
- Y. L. Liu, X. J. Zhao, X. X. Yang and Y. F. Li, Analyst, 2013, 138, 4526–4531 RSC.
- D. Chen, B. Li, L. Jiang, D. Duan, Y. Li, J. Wang, J. He and Y. Zeng, RSC Adv., 2015, 5, 97910–97917 RSC.
- H. Tan, Q. Li, Z. Zhou, C. Ma, Y. Song, F. Xu and L. Wang, Anal. Chim. Acta, 2015, 856, 90–95 CrossRef CAS PubMed.
- L. He, Z. W. Jiang, W. Li, C. M. Li, C. Z. Huang and Y. F. Li, ACS Appl. Mater. Interfaces, 2018, 10, 28868–28876 CrossRef CAS PubMed.
- S. Wang, W. Deng, L. Yang, Y. Tan, Q. Xie and S. Yao, ACS Appl. Mater. Interfaces, 2017, 9, 24440–24445 CrossRef CAS PubMed.
- H. Yang, R. Yang, P. Zhang, Y. Qin, T. Chen and F. Ye, Microchim. Acta, 2017, 184, 4629–4635 CrossRef CAS.
- F. Liu, J. He, M. Zeng, J. Hao, Q. Guo, Y. Song and L. Wang, J. Nanopart. Res., 2016, 18, 1–9 CrossRef.
- Z. Ren, J. Luo and Y. Wan, ACS Appl. Mater. Interfaces, 2019, 11, 30542–30550 CrossRef CAS PubMed.
- M. K. Masud, J. Kim, M. M. Billah, K. Wood, M. J. Shiddiky, N. T. Nguyen, R. K. Parsapur, Y. V. Kaneti, A. A. Alshehri, Y. G. Alghamidi and K. A. Alzahrani, J. Mater. Chem. B, 2019, 7, 5412–5422 RSC.
- R. Qin, Y. Feng, D. Ding, L. Chen, S. Li, H. Deng, S. Chen, Z. Han, W. Sun and H. Chen, ACS Appl. Bio Mater., 2021, 4(7), 5520–5528 CrossRef CAS.
- S. Tanaka, M. K. Masud, Y. V. Kaneti, M. J. A. Shiddiky, A. Fatehmulla, A. M. Aldhafiri, W. A. Farooq, Y. Bando, M. S. A. Hossain and Y. Yamauchi, ChemNanoMat, 2019, 5, 506–513 CrossRef CAS.
- L. Jiao, W. Xu, Y. Zhang, Y. Wu, W. Gu, X. Ge, B. Chen, C. Zhu and S. Guo, Nano Today, 2020, 35, 100971 CrossRef CAS.
- S. Tanaka, Y. V. Kaneti, R. Bhattacharjee, M. N. Islam, R. Nakahata, N. Abdullah, S. I. Yusa, N. T. Nguyen, M. J. A. Shiddiky, Y. Yamauchi and M. S. A. Hossain, ACS Appl. Mater. Interfaces, 2018, 10, 1039–1049 CrossRef CAS PubMed.
- H.-Q. Zheng, C.-Y. Liu, X.-Y. Zeng, J. Chen, J. Lü, R.-G. Lin, R. Cao, Z.-J. Lin and J.-W. Su, Inorg. Chem., 2018, 57, 9096–9104 CrossRef CAS PubMed.
- P. Karthik, A. Pandikumar, M. Preeyanghaa, M. Kowsalya and B. Neppolian, Microchim. Acta, 2017, 184, 2265–2273 CrossRef CAS.
- M. Muppidathi, P. Perumal, R. Ayyanu and S. Subramanian, Analyst, 2019, 144(9), 3111–3118 RSC.
- J. Segura-Aguilar, I. Paris, P. Muñoz, E. Ferrari, L. Zecca and F. A. Zucca, J. Neurochem., 2014, 129, 898–915 CrossRef CAS PubMed.
- P. Belujon and A. A. Grace, Int. J. Neuropsychopharmacol., 2017, 20, 1036–1046 CrossRef CAS PubMed.
- X. Wei, Z. Zhang and Z. Wang, Microchem. J., 2019, 145, 55–58 CrossRef CAS.
- H. Tang, P. Lin, H. L. Chan and F. Yan, Biosens. Bioelectron., 2011, 26, 4559–4563 CrossRef CAS PubMed.
- M. R. H. Nezhad, J. Tashkhourian, J. Khodaveisi and M. R. Khoshi, Anal. Methods, 2010, 2, 1263–1269 RSC.
- D. Sun, S. Liu, G. Zhang and J. Zhou, Chem. Eng. J., 2019, 359, 1659–1667 CrossRef CAS.
- S. Liu, J. Zhou and H. Song, Small, 2018, 14, 1703548 CrossRef PubMed.
- I. S. Ahuja, R. Singh and C. Yadava, J. Mol. Struct., 1980, 68, 333–339 CrossRef CAS.
- P. Afanasiev, S. Chouzier, T. Czeri, G. Pilet, C. Pichon, M. Roy and M. Vrinat, Inorg. Chem., 2008, 47, 2303–2311 CrossRef CAS PubMed.
- M. Kirillov, Coord. Chem. Rev., 2011, 255, 1603–1622 CrossRef.
- S. Liu, J. Zhou and H. Song, Chem. Commun., 2018, 54, 9825–9828 RSC.
- Y. Zhu, J. Ciston, B. Zheng, X. Miao, C. Czarnik, Y. Pan, R. Sougrat, Z. Lai, C.-E. Hsiung and K. Yao, Nat. Mater., 2017, 16, 532–536 CrossRef CAS PubMed.
- R. Sanz, F. Martínez, G. Orcajo, L. Wojtas and D. Briones, Dalton Trans., 2013, 42, 2392–2398 RSC.
- P. Karthik, E. Balaraman and B. Neppolian, Catal. Sci. Technol., 2018, 8, 3286–3294 RSC.
- D. Porter and H. Bright, J. Biol. Chem., 1983, 258, 9913–9924 CrossRef CAS.
- M. R. H. Nezhad, J. Tashkhourian, J. Khodaveisi and M. R. Khoshi, Anal. Methods, 2010, 2, 1263–1269 RSC.
- R. Baron, M. Zayats and I. Willner, Anal. Chem., 2005, 77, 1566–1571 CrossRef CAS PubMed.
- H.-B. Wang, Y. Li, G.-L. Dong, T. Gan and Y.-M. Liu, New J. Chem., 2017, 41, 14364–14369 RSC.
- S. Dutta, C. Ray, S. Mallick, S. Sarkar, R. Sahoo, Y. Negishi and T. Pal, J. Phys. Chem. C, 2015, 119, 23790–23800 CrossRef CAS.
- M. X. Guo and Y. F. Li, Spectrochim. Acta, Part A, 2019, 207, 236–241 CrossRef CAS PubMed.
- Y. Liu, Y. Zhang, Q. Liu, Q. Wang, A. Lin, J. Luo, Y. Du, Y. W. Lin and H. Wei, Analyst, 2021, 146, 1872–1879 RSC.
Footnote |
| † Electronic supplementary information (ESI) available. See DOI: 10.1039/d1ma00605c |
|
| This journal is © The Royal Society of Chemistry 2021 |
Click here to see how this site uses Cookies. View our privacy policy here. 
 Open Access Article
 This Open Access Article is licensed under a Creative Commons Attribution-Non Commercial 3.0 Unported Licence
 *
*