
 Open Access Article
 This Open Access Article is licensed under a Creative Commons Attribution-Non Commercial 3.0 Unported Licence
The detection of Al3+ and Cu2+ ions using isonicotinohydrazide-based chemosensors and their application to live-cell imaging†
In-ho
Song‡
a,
Pritam
Torawane‡
 b,
Jung-Seop
Lee
a,
Shrikant Dashrath
Warkad
c,
Amulrao
Borase
b,
Suban K.
Sahoo
d,
Satish Balasaheb
Nimse
*a and
Anil
Kuwar
*b
b,
Jung-Seop
Lee
a,
Shrikant Dashrath
Warkad
c,
Amulrao
Borase
b,
Suban K.
Sahoo
d,
Satish Balasaheb
Nimse
*a and
Anil
Kuwar
*b
aInstitute of Applied Chemistry and Department of Chemistry, Hallym University, Chuncheon 200702, Republic of Korea. E-mail: satish_nimse@hallym.ac.kr
bSchool of Chemical Sciences, KBC-North Maharashtra University, Jalgaon 425001, India. E-mail: kuwaras@gmail.com
cBiometrix Technology, Inc., 2-2 Bio Venture Plaza 56, Chuncheon 24232, Korea
dDepartment of Applied Chemistry, SV National Institute of Technology, Surat 395007, India
First published on 17th August 2021
Abstract
A new Schiff base receptor (3) was synthesized by an equimolar reaction between isonicotinic hydrazide and 2,4-dihydroxybenzaldehyde in ethanol. Receptor 3 demonstrated excellent selectivity and sensitivity towards Cu2+ ions and Al3+ ions by UV-vis absorption spectroscopy and fluorescence spectroscopy, respectively. Receptor 3 showed a detectable color change from colorless to yellow with a red-shift (Δλ ≈ 70 nm) in the absorption spectra in the presence of Cu2+. In the emission study of 3, Al3+ showed significant fluorescent enhancement (λem = 473 nm) over a wide range of tested metal ions. The quantum yield of receptor 3 (Φ = 0.0021) increases ∼230 folds in the presence of Al3+ ions to form receptor 3·Al3+ complex (Φ = 0.484). Receptor 3 showed high selectivity for Al3+ with a Ka of 4.8 × 10⁴ M−1 and LOD of 3.0 nM. In comparison, Ka for Cu2+ was 1.3 × 10⁴ M−1 and LOD of 1.9 μM. Receptor 3 is an excellent chemosensor for detecting Al3+ ions as indicated by its nanomolar range LOD. The quick response, easy-synthesis, and high sensitivity make receptor 3 an ideal sensor for detecting Al3+ ions in a semi-aqueous medium and living cells.
1. Introduction
Development of highly specific and sensitive chemosensors has attracted significant interest in detecting bioactive metal ions and toxic metal ions due to their importance in chemical, biological, medical, material, and environmental sciences.1–4 Development of colorimetric and fluorescence-based detection methods that target precise recognition of bioactive metals such as copper (Cu2+) and aluminum (Al3+) is a topic of high interest among researchers.5–11Cu2+ is the third most abundant heavy metal after Fe3+ and Zn2+ in the human body. Several biological processes require Cu2+ in optimum amounts.12–15 Enzymes such as tyrosinase, lysyl oxidase, cytochrome c oxidase, and superoxide dismutase require Cu2+ for redox reactions.16,17 Even though Cu2+ is potentially toxic, it is an essential element.18 The deficiency of Cu2+ leads to Menkes disease.19,20 Whereas, the accumulation of Cu2+ is correlated to the Wilson disease,21,22 Amyotrophic Lateral Sclerosis,23,24 and Alzheimer's disease.25,26 The crucial physiological relevance of Cu2+ and its associated biomedical insinuations has resulted in substantial attention for the scheming of highly selective and sensitive copper chemosensors.27
Al3+ is one of the most abundant biosphere elements at approximately 8% of the total mineral components. The neurotoxicity of Al3+ has been known to humans for over one hundred years.28,29 Al3+ can cause many health issues, including Alzheimer's disease30 and osteomalacia,31 and increased risk of breast cancer.32 The World Health Organization (WHO) recommends 3–10 mg of Al3+ as an average daily intake. At the same time, the weekly tolerable dietary intake is about 7 mg kg−1 body weight. Thus, recognizing Al3+ in life and environmentally significant samples is critical to address.33,34 The detection of Al3+ has been challenging compared to other metal ions because of poor spectroscopic characteristics, meager coordination ability, and easy hydration.35–37 The development of highly sensitive and selective chemosensor for Al3+ detection is in great demand. Therefore, it is of substantial importance to build receptors for the selective detection of Al3+.
According to recent literature, noncyclic receptors containing multiple coordination sites have considerably improved in the chemosensor design because of their ability to recognize different ionic and neutral molecules.38–40 Such noncyclic receptors are well known to show interesting coordination properties due to heteroatoms in chelating sites. With this in mind, a Schiff base (receptor 3, Fig. 1a) was prepared from isonicotinohydrazide and 2,4-dihydroxybenzaldehyde and evaluated as the target receptor for the metal ions. It was hypothesized that N atoms of the –CH![[double bond, length as m-dash]](https://www.rsc.org/images/entities/char_e001.gif) N– bond and the O atom of ortho –OH in receptor 3 could coordinate with the metal ion to form a stable complex. Herein, we report receptor 3 as a selective chemosensor for Cu2+ as it showed the distinctive red shift in the absorption maxima but without any fluorescence signal for the complex. Receptor 3 was found to be an excellent fluorescence sensor for Al3+, as evident from the chelation-enhanced fluorescence (CHEF) effect. The application of receptor 3 in fluorescence imaging was evaluated by confocal fluorescence microscopy in A549 cells, proving receptor 3 as a convenient tool for tracking Al3+in vivo.
N– bond and the O atom of ortho –OH in receptor 3 could coordinate with the metal ion to form a stable complex. Herein, we report receptor 3 as a selective chemosensor for Cu2+ as it showed the distinctive red shift in the absorption maxima but without any fluorescence signal for the complex. Receptor 3 was found to be an excellent fluorescence sensor for Al3+, as evident from the chelation-enhanced fluorescence (CHEF) effect. The application of receptor 3 in fluorescence imaging was evaluated by confocal fluorescence microscopy in A549 cells, proving receptor 3 as a convenient tool for tracking Al3+in vivo.
 | ||
| Fig. 1 (a) Scheme for the synthesis of receptor 3, (b) Single X-ray crystal structure of receptor 3 (50% probability ellipsoids). | ||
2. Material and methods
2.1 Materials and instrumentation
All reagents were purchased from Sigma-Aldrich and were used as received unless stated otherwise. The reaction was carried out under an inert atmosphere (Argon gas) and monitoring the reaction using thin-layer chromatography (TLC) to confirm the formation of the product. The developed plates were visualized under UV light (254 nm). The synthesized compound was characterized by 1H and 13C NMR on a Jeol FT-NMR spectrometer (400 MHz; JEOL, Japan) in DMSO-d6. The chemical shifts (δ ppm) and the coupling constants (J Hz) are reported. UV-visible spectra were recorded on a Shimadzu UV-24500 (Shimadzu, Japan) in the range of 200–600 nm at room temperature using a quartz cuvette of 1 cm optical path length. Fluorescence emission spectra were measured on an Agilent Cary Eclipse fluorescence spectrophotometer (Agilent Technologies, USA). FT-IR spectra were recorded on a Nicolet iS5 FT-IR (ThermoScientific) spectrometer in the range of 400–4000 cm−1 using KBr pellets. The JMS-700 MStation Mass Spectrometer (JEOL, Japan) was used for recording the high-resolution mass spectra of receptor 3. The mass spectra of 3·Al3+ complex were obtained by matrix-assisted laser deposition/ionization (time-of-flight), MALDI-TOF mass spectrometry on a Bruker Autoflex speed TOF/TOF spectrometer (Bruker Daltonics, Bremen, Germany). X-ray analysis was performed using a Bruker AXS D8 Quest CMOS diffractometer (Bruker, USA). The microplate reader was Spectramax Plus 384 (Molecular Devices, USA), and the fluorescent microscope Zeiss-ScopeA1 (Germany) was used in this study.2.2 Synthesis of receptor 3
Isonicotinohydrazide (0.198 g, 1.0 mmol) and 2,4-dihydroxybenzaldehyde (0.200 g, 1.0 mmol) were reacted in ethanol (25 mL) at room temperature until the completion of the reaction (5 h). The yellow color solid obtained was filtered and dried. Then, the obtained yellow colored crud product was recrystallization from ethanol (yield = 90%). 1H NMR (400 MHz, DMSO-d6): δ 6.36 (d, 2H, Ar-H), 7.36 (s, 1H, Ar-H), 7.82 (d, 2H, Ar-H), 8.54 (s, 1H, CHN), 8.77 (d, 2H, Ar-H), 10.08 (s, 1H, Ar-OH), 11.29 (s, 1H, NH), 12.14 (s, 1H, Ar-OH); 13C NMR (100 MHz, DMSO-d6): δ 102.61, 107.84, 110.40, 121.43, 131.20, 140.07, 150.29, 159.49, 161; mass: expt. m/z = 258.0870 (C13H11N3O3 [M + H]), calc. m/z = 257.245.
2.3 UV-vis and fluorescence spectral measurements
All stock and working solutions were prepared using double distilled water and spectroscopic grade DMSO. A stock solution of receptor 3 (1 × 10⁻³ M) was prepared in DMSO, and the corresponding working solutions (10 × 10−6 M) were prepared simply by diluting with DMSO. Similarly, stock solutions of cations (1 × 10⁻² M) were prepared in double-distilled water, and the corresponding working solutions (1 × 10⁻³ M) were prepared by diluting with water. The UV-visible absorption and emission spectra of the receptor 3 (10 × 10−6 M) dissolved in DMSO were recorded by adding the aqueous solution of various metal ions (Na+, K+, Ag+, Cs+, Sr2+, Ca2+, Co2+, Cu2+, Pd2+, Mn2+, Mg2+, Ba2+, Ni2+, Zn2+, Cd2+, Pb2+, Al3+, Cr3+, Fe3+, Fe2+) to examine the selectivity at room temperatures (298 K). For the sensitivity study, UV-visible absorption and emission titration experiments were performed through a stepwise addition of four equivalents of metals (1 × 10⁻³ M) to a solution of receptor 3 (10 × 10−6 M) in DMSO. The absorbance intensity and emission intensity were recorded in the range of 200–600 nm and 360–600 nm, respectively, alongside a reagent blank. Receptor 3 showed selectivity for detecting Cu2+ in the absorption titrations and detecting Al3+ in the fluorescence titrations. The binding stoichiometry of receptor 3 with Cu2+ ion (UV-visible absorption spectroscopy) and Al3+ ion (fluorescence spectroscopy) were investigated by Job's plot method. A receptor 3 was titrated with successive addition of Cu2+ or Al3+ (1 μL, 1.0 × 10⁻³ M) in water to a receptor 3 (1.0 mL) solution in DMSO. The collected data were processed using the Benesi–Hildebrand equation41 to determine the association constant (Ka) of analyte Cu2+ and Al3+ ion with receptor 3. The absorbance changes at 413 nm were used alongside a reagent blank for the detection of Cu2+ ions. The fluorescence intensity was recorded at λex/λem = 343/473 nm alongside a reagent blank with the excitation and emission slits set to 5.0 nm. The limit of detection (LOD) was estimated by applying the IUPAC recommended equation, LOD = 3σ/slope.42 Where σ is the standard deviation of (n = 10) blank samples and the slope is the slope for calibration curves.2.4 Crystal growth for single X-ray crystallography
The single crystals of receptor 3 were obtained by slow diffusion of ethanol in DMSO. However, several attempts to obtain the single crystals of receptor 3 and Al3+ complex (3·Al3+), receptor 3 and Cu2+ complex (3·Cu2+) were unsuccessful. A suitable single crystal was carefully mounted for X-ray crystallography with the help of a trace of Fomblin oil on a Mitegen micromesh mount. Then it was transferred to the goniometer head with a fixed chi angle, a molybdenum Kα wavelength fine focus sealed X-ray tube (λ = 0.71073), a single crystal curved graphite incident beam monochromator, a Photon100 CMOS area detector, and an Oxford Cryosystems low-temperature device. X-ray diffraction data were collected at 150 K using ω and φ scans to a maximum resolution of Θ = 33.221°. Data reduction, scaling, and absorption corrections were performed using SAINT (Bruker, V8.38A). The final completeness is 89.00% out of 33.221° in Θ. Multi-scan absorption correction was performed using SADABS 2016/2.43 The absorption coefficient μ of this material was 0.107 mm−1 at this wavelength (λ = 0.71073 Å). The space group was determined based on systematic absences using XPREP44 as Pna21. The structure was solved using direct methods with ShelXS-97 and refined by full-matrix least-squares on F2 using ShelXL-2018/3 and the graphical interface ShelXLE (Rev937).45 All non-hydrogen atoms were refined anisotropically. Hydrogen atom positions were calculated geometrically and improved using a riding model. Mercury, PyMol, and POVRay were utilized for molecular measurements and molecular visualization.462.5 Effect of pH on the detection of Al3+ and reversibility of receptor 3
The effect of pH (pH = 2–12) on receptor 3 was examined by fluorescence spectroscopy both in the absence and presence of Al3+ ions. The pH was adjusted by adding perchloric acid and tetrabutylammonium hydroxide in the HEPES buffered system. Reversibility is a critical aspect of the fluorescent recognition process. Hence, we examined the reversibility of receptor 3 in the presence of ethylenediaminetetraacetic acid disodium salt (EDTANa2). For the reversibility study, EDTANa2 (4 equiv.) was added to the solution containing receptor 3·Al3+ complex obtained by adding Al3+ at a 1![[thin space (1/6-em)]](https://www.rsc.org/images/entities/char_2009.gif) :4 mole ratio. The reversibility was recorded by alternate additions of Al3+ (4 equiv.) and EDTANa2 (4 equiv.).
:4 mole ratio. The reversibility was recorded by alternate additions of Al3+ (4 equiv.) and EDTANa2 (4 equiv.).
2.6 Determination of quantum yield of receptor 3 and receptor 3·Al3+ complex
Quantum yields (Φ) of receptor 3 and its complexes with Al3+ were measured using the following formula.where A is the area under the emission spectral curve, OD is the compound's optical density at the excitation wavelength, and η is the refractive index of the solvent. The quantum yield of receptor 3 and its complexes with Al3+ was determined using β-carboline (Φ = 0.570) as the standard.47
2.7 Cell culture studies
The cytotoxicity assay (MTT (3-(4,5-dimethylthiazol-2-yl)-2,5-diphenyltetrazolium bromide) assay) and cell imaging study of receptor 3, Al3+, and Al3+ combined with receptor 3 was conducted using A549 cells (colorectal carcinoma cell line). The A549 cells were procured from the Korea cell line bank, Seoul, South Korea. Dulbecco Modified Eagle Medium (DMEM), fetal bovine serum (FBS), trypsin, 3-(4,5-dimethyl thiazol-2yl)-2,5-diphenyl tetrazolium bromide was procured from Thermo Fisher Scientific, USA. DMSO was procured from Biosesang, Korea. Cell culture plates and glass coverslips were procured from SPL Life Sciences, Korea. A549 cells were grown in an incubator at 37 °C and 5% CO2 using DMEM media containing 2 mM glutamine and 10% FBS. Cells were trypsinized for seeding at 70–90% of cell confluency.2.8 Cytotoxicity assay and cell imaging
About 2000 A549 cells per well were seeded in 96-well plates. After 24 h, the media containing receptor 3, Al3+ ion, and receptor 3 with Al3+ (1, 10, 25, and 50 μM) were added to the wells and incubated for another 24 h. Control wells were treated with equivalent volumes of dimethyl sulfoxide (DMSO). 200 μL of fresh media containing MTT solution and incubated for four hours at 37 °C. The absorbance was recorded at 570 nm to evaluate the cell viability. Each experiment was executed three times. The data analysis was performed using the Origin software.For cell imaging, A549 cells were seeded separately on poly-L-lysine coated 14 mm coverslips in 6 well plates and allowed to grow for 24 h. For cell imaging control experiments, 10 μM of Al3+ ion and 10 μM of receptor 3 were incubated separately for 30 min at 37 °C and 5% CO2 in the dark. For cell imaging of receptor 3 and Al3+ complex, 10 μM of Al3+ ion was incubated separately for 30 min. The media was then replaced with 10 μM of receptor 3 and incubated for an additional 30 min. The cells were washed with PBS buffer (pH = 7.4), followed by fixing with 2% paraformaldehyde for 30 min after removing the media. Coverslip was mounted on a glass slide, and imaging was performed under a fluorescence microscope (Zeiss-ScopeA1, Germany). Images were taken through a green channel.
3. Results and discussion
3.1 Synthesis of receptor 3
The Schiff base (E)-N′-(2,4-dihydroxybenzylidene)isonicotinohydrazide (receptor 3) was synthesized with a slight modification of the reported48 method through a direct reaction between isonicotinohydrazide and 2,4-dihydroxybenzaldehyde (Fig. 1a) in ethanol with stirring and refluxing for 5 h. The molecular structure of receptor 3 was characterized using various spectral techniques (FT-IR, 1H NMR, 13C NMR, and Mass), data (ESI,† Fig. S1–S3) and finally confirmed by single-crystal X-ray crystallography (Fig. 1b). The crystallographic data, selected bond parameters, and hydrogen-bond parameters are presented in Tables S1, S2 and S3, respectively. The CIF file for receptor 3 was placed in the Cambridge Structure Database (CCDC 2051947†). The orange-colored crystal (0.55 × 0.42 × 0.05 mm3) of receptor 3 demonstrated an orthorhombic system having a Pna21 space group within the unit cell. The ORTEP diagram with numbering and packing diagram is shown in Fig. 1b. The receptor 3 in its free form displays the molecular association via intramolecular hydrogen bonding between the phenolic hydroxyl to imine nitrogen. Receptor 3 shows an intramolecular hydrogen bond (O(1)–H⋯N(1)) with a distance of 1.92 (3) Å and a bond angle of 150 (2) Å, which is in the expected range of such hydrogen bonds. Receptor 3 undergoes a solvent-assisted keto tautomerization suitable for the intramolecular charge transfer (ICT) process.49 The fluorescence intensity enhancement of receptor 3 in the presence of Al3+ is attributed to the ICT process.3.2 Determination of selectivity of receptor 3 as a chemosensor for metal ions
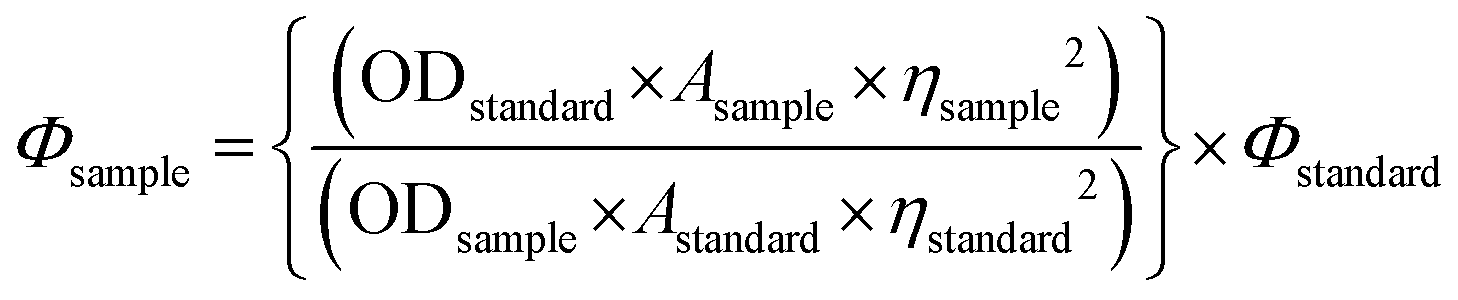
The selectivity of receptor 3 for cation detection was investigated using the UV-visible absorption and fluorescence spectroscopy. The UV-vis absorption spectra of receptor 3 (10 × 10−6 M, in DMSO) were recorded in the absence and presence of 4 equivalents of various metal ions, such as Na+, K+, Ag+, Cs+, Sr2+, Ca2+, Co2+, Cu2+, Pd2+, Mn2+, Mg2+, Ba2+, Ni2+, Zn2+, Cd2+, Pb2+, Al3+, Cr3+, Fe3+, Fe2+ (1 × 10⁻³ M, in H2O).Receptor 3 showed an absorption band at 343 nm, most likely due to the π to π* transition (Fig. 2a). Upon addition of Cu2+ ions, the absorption band at 343 nm was red-shifted to 413 nm (Δλ ≈ 70 nm), indicating that receptor 3 has a higher binding affinity towards Cu2+ ions than other surveyed metal ions. Receptor 3 showed two additional shoulder peaks at 428 nm and 475 nm to the major peak at 413 nm. In the presence of other metal ions, receptor 3 showed either no change or moderate decrease in the absorption intensity relative to the receptor. These results indicated the intramolecular charge transfer (ICT) character of the synthesized receptor 3 by recognizing Cu2+ ions through imine-N, amide carbonyl, and hydroxyl groups.50 The push–pull character of the ICT state due to multiple coordination resulted in a red-shift (Δλ ≈ 70 nm). These results indicated that receptor 3 shows selectivity for Cu2+ ions.
 | ||
| Fig. 2 (a) Changes in UV-vis absorption spectra and (b) fluorescence intensity (λex = 343 nm, λem = 473 nm) of receptor 3 (10 × 10−6 M) upon the addition of 4 equivalents of different metal ions (1 × 10⁻³ M, in H2O). Inset shows the color change of the solutions from colorless to pale green and fluorescence ‘turn-on’ effect. | ||
The fluorescence emission spectra of receptor 3 (10 × 10−6 M, in DMSO) were recorded in the absence and presence of 4 equivalents of various metal ions, such as Na+, K+, Ag+, Cs+, Sr2+, Ca2+, Co2+, Cu2+, Pd2+, Mn2+, Mg2+, Ba2+, Ni2+, Zn2+, Cd2+, Pb2+, Al3+, Cr3+, Fe3+, Fe2+ (1 × 10⁻³ M, in H2O). Receptor 3 showed weak fluorescence emission at 473 nm upon excitation at 343 nm. Fascinatingly, fluorescence was remarkably enhanced (∼430-folds) in the presence of Al3+ ions (Fig. 2b). Interestingly, there was no change in the emission performance of receptor 3 in the presence of other cations, including Cu2+. The increase in fluorescence emission intensity was due to the azomethine group of receptor 3. Receptor 3 is reducibly fluorescent due to the CN double bond's isomerization at the excited state and the excited-state proton transfer (ESPT). The ESPT involves the phenolic proton of the substituted dihydroxyl moieties of salicylaldehyde in receptor 3. Upon stable chelation with Al3+, the CN isomerization is inhibited. The coordination of receptor 3 with the Al3+ prohibits the ESPT process, as indicated by the fluorescence enhancement.51–53
3.3 Binding mechanism and association constant
Job's plot was used to determine the binding stoichiometry of receptor 3 with Cu2+ ions (UV-visible absorption spectroscopy) and Al3+ ions (fluorescence spectroscopy). The molar ratio of metal ions was changed from 0.1 to 1.0 by keeping the total concentration of receptor 3 and Cu2+ ions at 10 × 10−6 M. The absorption maxima (λ = 413 nm) was observed when the molar ratio of the receptor 3 to Cu2+ was 0.33, indicating the formation of a 2:1 3·Cu2+ complex (Fig. S4a, ESI†). Similarly, the change in fluorescence intensity (λex = 343 nm, λem = 473 nm) was used to determine the binding stoichiometry of receptor 3 with Al3+. The molar ratio of Al3+ was changed from 0.1 to 1.0 by keeping the total concentration of receptor 3, and Al3+ ions at 10 × 10−6 M. The emission maxima (λ = 473 nm) was observed when the molar ratio of the receptor 3 to Al3+ was 0.33, indicating the formation of a 2:1 3·Al3+ complex (Fig. S4b, ESI†). The complexes 3·Cu2+ and 3·Al3+ were obtained by refluxing four equivalents of Cu2+ and Al3+ with receptor 3 in an ethanolic solution. To ascertain the formation of receptor 3·Cu2+ complex and 3·Al3+ complex, we compared FT-IR spectra for receptor 3 with that of respective complexes, as shown in Fig. 3.
 | ||
| Fig. 3 FT-IR spectra of (a) 3·Cu2+ complex and (b) 3·Al3+ complex recorded using the reflectance technique (4000–400 cm−1). | ||
The FT-IR spectrum of receptor 3 (Fig. 3a) demonstrated signals at 3436.05, 3224.39 (amide), 3086.99 (intramolecular bonded O–H), and 1647.39 (imine) cm−1. For the receptor 3·Cu2+ complex, the FT-IR spectrum demonstrated a broad signal at 3422.06 (amide), no frequency for intramolecular bonded O–H, and 1621.84 (imine) cm−1. These results indicate that receptor 3 forms a stable complex with Cu2+. Similarly, the FT-IR spectrum of receptor 3·Al3+ complex demonstrated a broad signal at 3430.74 (amide), no frequency for intramolecular bonded O–H, and 1623.77 (imine) cm−1. The FT-IR spectrum shifts in the 3·Cu2+ and 3·Al3+ complexes compared to the receptor 3, confirming the involvement of imine and amide groups in the complexation process.
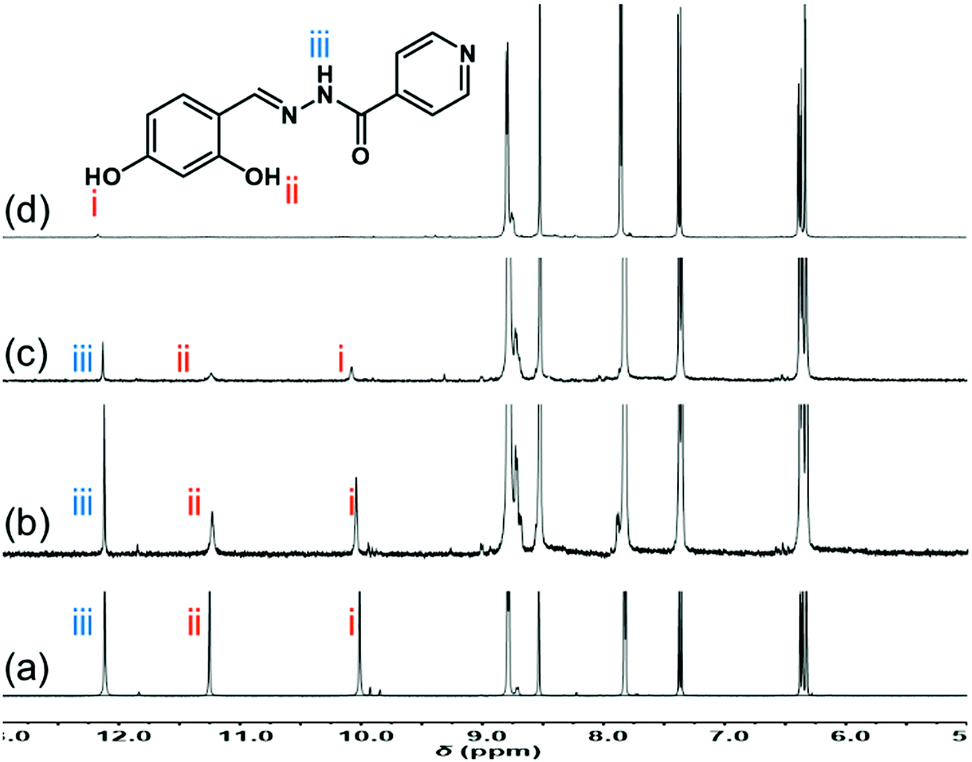
As shown in Fig. 4, the 1H NMR titration experiment was conducted using the mixture of 0.5% D2O-d2 in DMSO-d6. The 1H NMR of receptor 3 demonstrated sharp peaks at δH 12.12 (amide N–H), δH 11.25, and δH 10.01 (phenolic –OH). The signals for one N–H proton and two –OH protons gradually disappeared upon increasing the amount of Al3+ ions (0–1 equiv.). However, there was no significant change in the peak corresponding to imine C–H (δH 8.52). These results indicate that the amide group, imine group, and phenolic moiety of receptor 3 take part in the complexation with Al3+ ions. Further, the MALDI-TOF mass spectrum of receptor 3·Al3+ complex showed a signal at an m/z value of 544.129 and 561.133 (Fig. S5, ESI†). These results rationalize the formation of the 2:1 complexation pattern for the 3·Al3+ complex. The paramagnetic property of Cu2+ results in the peak broadening in proton NMR spectra. Thus, the binding process of receptor 3 with Cu2+ could not be monitored by NMR studies.54
 | ||
| Fig. 4 1H NMR spectral changes of receptor 3 in the mixture of 0.5% D2O-d2 in DMSO-d6, (a) 3 + Al3+ (0 equiv.) (b) 3 + Al3+ (0.25 equiv.), (c) 3 + Al3+ (0.5 equiv.), (d) 3 + Al3+ (1 equiv.). | ||
The association constants (Ka) of Cu2+ (UV-visible absorption spectroscopy) and Al3+ (fluorescence spectroscopy) complexes with receptor 3 were determined by Benesi–Hildebrand equations (eqn (S1) and (S2), ESI†). As shown in Fig. 5a, the receptor 3 (1.0 mL, 10 × 10−6 M) in DMSO was titrated with successive addition of Cu2+ (0–20 μL in H2O, c = 10 × 10−4 M) to measure the association constant (Ka). The absorbance values at absorption maxima (λ = 413 nm) were processed using the Benesi–Hildebrand equation (eqn (S1), ESI†) to obtain the binding curve (Fig. S6a, ESI†). The Ka value for the complexation of Cu2+ with receptor 3 was 1.3 × 10⁴ M−1.
 | ||
| Fig. 5 Changes in (a) UV-vis absorption spectra and (b) fluorescence spectra (λex = 343 nm, λem = 473 nm) of receptor 3 (in 1 mL DMSO, 10 × 10−6 M) up on successive addition of Cu2+ (0 to 20 μL in H2O, c = 10 × 10−4 M), and Al3+ (0 to 20 μL in H2O, c = 10 × 10−4 M), respectively. | ||
As shown in Fig. 5b, receptor 3 (1.0 mL, 10 × 10−6 M) in DMSO was titrated with successive addition of Al3+ (0–20 μL in H2O, c = 10 × 10−4 M). The changes in fluorescence intensity (λex = 343 nm, λem = 473 nm) were used to determine the Ka value by plotting the binding curve (Fig. S6b, ESI†) according to the Benesi–Hildebrand equation (eqn (S2), ESI†). The Ka value for the complexation of Al3+ with receptor 3 was 4.8 × 10⁴ M−1. The binding affinity of Al3+ for receptor 3 is 4-fold higher than that of Cu2+ ions.
Computational studies were conducted by applying the density functional theory (DFT) using Gaussian 09. The molecular geometries of the singlet ground state of receptor 3, 3·Cu2+ complex, and 3·Al3+complex were optimized using hybrid B3LYP functions with a 6-31G++(d,p) (C, H, N, O) and LANL2DZ (Cu, Al) basis sets.55 The HOMO, LUMO results, information for bond length, and bond angles were obtained using Avogadro 1.2.0.56 The 3D structures of the 3·Cu2+ and 3·Al3+complexes were calculated by the DFT method using the 2:1 binding stoichiometry between receptor 3 and respective ions. The DFT computed structure of receptor 3 and its complexes are presented in Fig. S7 (ESI†). The LUMO–HOMO bandgap (ΔE (eV) = ELUMO − EHOMO) for receptor 3 was found to be 0.293.
In contrast, the LUMO–HOMO bandgap for 3·Cu2+ and 3·Al3+complexes were 0.279 and 0.078, respectively. These results provided the basis for ascertaining the ICT between receptor 3 and Cu2+ and Al3+ ions. Comparing the electron densities of the HOMO and LUMO of receptor 3 with the 3·Cu2+ complex supported the charge transfer occuring between the receptor and metal ions that further lowered the bandgap. The lowering of the bandgap upon complexation supported the red-shift of the absorbance of receptor 3 upon the addition of Cu2+. On the contrary, the significant decrease in the LUMO–HOMO bandgap (ΔE = 0.078) indicated the formation of a relatively stable 3·Al3+ complex as compared to the 3·Cu2+ complex. The increase in fluorescence enhancement was complemented by a sharp decrease in energy HOMO–LUMO bandgap of the receptor 3.
3.4 Receptor 3 as a chemosensor for Cu2+ and Al3+ ions
The detection of the target analyte in the presence of possibly competing analytes is a crucial aspect for any compound to be an excellent chemosensor. Therefore, we evaluated the specificity of receptor 3 for Cu2+ in a competition experiment by recording the absorption (λ = 413 nm) receptor 3 in the presence of Cu2+ (1 equiv.) ion mixed with other cations (4 equiv.). The results of the competition experiments are presented in Fig. S8a (ESI†). Similarly, we determined the efficiency of receptor 3 for detecting Al3+ ions in a competition experiment by recording the fluorescence intensity (λex = 343 nm, λem = 473 nm). As shown in Fig. S8b (ESI†), the fluorescence intensity for receptor 3 was measured in the presence of Al3+ (1 equiv.) ion mixed with other cations (4 equiv.) The coefficient of variation in the change of absorbance and fluorescence intensity for Cu2+ detection and Al3+ detection, were below ±10%, respectively. These results indicate that receptor 3 is a highly valuable chemosensor for detecting Cu2+ by UV-vis absorption spectroscopy. Moreover, receptor 3 demonstrated its excellence in detecting Al3+ ions with high specificity by fluorescence spectroscopy. Therefore, the high selectivity and specificity of receptor 3 for Cu2+ and Al3+ ions make it an excellent chemosensor for analytical applications. The absorbance (λ = 413 nm) and fluorescence intensity (λex = 343 nm, λem = 473 nm) were plotted at various concentrations of Cu2+ ions and Al3+ ions, respectively, to obtain the calibration plots (Fig. S9, ESI†). The LOD for detecting Cu2+ ions by UV-vis absorption spectroscopy was 1.86 μM. Whereas, the LOD for the detection of Al3+ ions by Fluorescence spectroscopy was 3.08 nM. The approximately 600-fold lower sensitivity of receptor 3 for Al3+ ions compared to Cu2+ ions was attributed to the ∼4-fold higher binding constant for 3·Al3+ complex. It is important to notice that receptor 3 demonstrated relatively lower detection limits for Cu2+ and Al3+ than some of the reported methods presented in Tables S4 and S5 (ESI†).3.5 Effect of pH on the detection of Al3+ and reversibility of receptor 3
The effect of pH on receptor 3 for detecting Al3+ ions was tested in the pH range of 2.0–12.0, as shown in Fig. 6a. The emission intensity (λem = 473 nm) of receptor 3 did not change significantly with the pH change. However, equimolar Al3+ ions changed the fluorescence intensity of receptor 3·Al3+ complex considerably with the pH change. The receptor 3·Al3+ complex's emission intensity was significantly high at pH 2.0–8.0 than pH 9.0–12.0. These results indicate that interactions of Al3+ ions with receptor 3 are pH dependant. The decrease in emission intensity at higher pH values (9.0–12.0) specifies that the Al3+ ions are freed from the complex, possibly due to more robust interactions with increased –OH levels. Nonetheless, receptor 3 demonstrated significant fluorescence intensity at pH 5.0–8.0 in the presence of Al3+ ions, indicating its applicability for the detection of intracellular Al3+ ions. | ||
| Fig. 6 (a) Changes in the fluorescence intensity of receptor 3 and receptor 3·Al3+ complex in a binary mixture of DMSO:HEPES buffer (at various pH values) (9:1; v/v), (b) fluorescence intensities (λex = 343 nm, λem = 473 nm) of 3·Al3+ complex (1:1) in the presence of EDTA for many cycles in DMSO. | ||
It is of a great advantage if a sensor can be reversible and reusable for sensing cations with high selectivity. A literature survey revealed that most of the reported Al3+ ion sensors are based on chemodosimetry that is typically irreversible.57 Reversibility test experiments were conducted by alternate additions of Al3+ ion and EDTA (Fig. 6b) to the solution of receptor 3. As shown in Fig. 6b, the emission spectra of receptor 3 in the presence of Al3+ (4 equiv.) showed high emission intensity, which was quenched by EDTANa2 (6 equiv.) on the solution. However, further addition of Al3+ (4 equiv.) demonstrated fluorescence signal, but this time slightly lower than the previous cycle. Adding Al3+ ions (4 equiv.) causes emission enhancement, which can be quenched by adding another portion of EDTANa2 (6 equiv.). The reversibility of receptor 3 was repetitive, with a slight loss in fluorescence efficiency due to Al3+/EDTANa2 additions. The observed decrease in fluorescence intensity for each cycle results from an excess of EDTANa2 (6 equiv.) compared to Al3+ (4 equiv.). This experiment suggests that receptor 3 can act as a likely environmental receptor for Al3+ detection.
3.6 Quantum yield of receptor 3 and receptor 3·Al3+ complex
Quantum yields of receptor 3 and 3·Al3+ complex were determined using norharmene as a standard. The quantum yield of receptor 3 (Φ = 0.0021) increases ∼230 folds in the presence of Al3+ ions to form receptor 3·Al3+ complex (Φ = 0.484).3.7 Application of receptor 3 in cell imaging application for detection of intracellular Al3+ ions
The complexation-induced fluorescence “turn on” or “turn off” effect is crucial for bio-imaging applications of small molecular probes designed to detect the cationic analyte. Receptor 3 did not show any change in fluorescence intensity upon binding with Cu2+ ions. However, the fluorescence signal of receptor 3 was increased by a few hundred folds in the presence of Al3+ ions. Therefore, receptor 3 was used to detect Al3+ ions in the living A549 cell lines to explore their biological applications. The MTT assay allowed us to estimate the cytotoxicity of receptor 3, Al3+, and receptor 3·Al3+ complex after exposure of cells to concentrations of 1, 10, 25, and 50 μM for 24 h with DMSO as a control. As depicted in Fig. 7a, the results are shown as the percent cell growth for each group compared to the control. There was no significant cell death even after 24 h of treatment at 1–25 μM of the receptor 3, Al3+ ions, and the receptor 3·Al3+ complex. However, upon treatment at 50 μM of receptor 3 and receptor 3·Al3+ complex, about a 20% decrease in cell growth was observed. Hence, 10 μM of receptor 3 was used for cell imaging applications. As shown in Fig. 7b, the cells did not show significant fluorescence upon incubation with Al3+ ions (10 μM) alone. However, very weak fluorescence was observed upon incubation of cells with receptor 3 (10 μM). Interestingly, the fluorescence intensity was increased upon incubation of cells with receptor 3 (10 μM) in the presence of Al3+ ions (10 μM). These results indicated that receptor 3 has a high potential in biological applications to detect Al3+ in an in vitro assay. | ||
| Fig. 7 (a) Cytotoxicity's of receptor 3, Al3+, and receptor 3 + Al3+ on the A549 cells after 24 h, (b) bright-field images (top row) and green channel (bottom row), control, receptor 3, Al3+, and receptor 3 + Al3+. | ||
4. Conclusions
In conclusion, we have developed a new optical receptor 3 based on Schiff base chemistry that demonstrated excellent selectivity and sensitivity towards Cu2+ ions in UV-vis absorption spectroscopy. Whereas the developed receptor 3 showed excellent selectivity and sensitivity for the detection of Al3+ ion by using fluorescence spectroscopy. In either case, the receptor did not show any interference from other tested metal ions. The 2:1 binding stoichiometry of receptor 3 and Al3+ ions was confirmed by FT-IR, NMR, and mass spectroscopy. The reversibility of receptor 3 for Al3+ ions in the presence of EDTA ensures its ability as an excellent probe for detecting Al3+ in various samples, including living cells. Receptor 3 showed high selectivity for Al3+ with a Ka of 4.8 × 10⁴ M−1 and LOD of 3.0 nM. In comparison, the Ka for Cu2+ was 1.3 × 10⁴ M−1 and LOD of 1.9 μM. Receptor 3 is an excellent chemosensor for detecting Al3+ ions indicated by its nanomolar range LOD. The quick response, easy synthesis, and high sensitivity make receptor 3 an ideal sensor for detecting Cu2+ and Al3+ ions. Further, the synthesized receptor showed a highly sensitive and highly specific fluorescent ‘turn-on’ effect (λem = 473 nm) for the 2:1 binding with Al3+ ions in a semi-aqueous medium and living cells.
Author contributions
I. S. and P. T. contributed equally. Hence, both should be considered as the first authors. S. B. N. and A. K. designed the study; I. S., P. T., J. L., A. B., and S. D. W. performed the experiments; S. B. N., S. K. S., and A. K. analyzed and interpreted the data. S. K. S. completed the theoretical calculation. S. B. N. and A. K. supervised the research. S. B. N. and A. K. wrote the paper. All authors analyzed the data and commented on the paper.Conflicts of interest
The authors declare no competing interests.Acknowledgements
Hallym University Research Fund (HRF-202012-009) supported this research.References
- H. S. Jung, P. S. Kwon, J. W. Kwon, J. I. Kim, C. S. Hong, J. W. Kim, S. Yan, J. Y. Lee, J. H. Lee, T. Joo and J. S. Kim, J. Am. Chem. Soc., 2009, 131(5), 2008–2012, DOI:10.1021/ja808611d.
- Z. Q. Guo, W. Q. Chen and X. M. Duan, Org. Lett., 2010, 12(10), 2202–2205, DOI:10.1021/ol100381g.
- M. Royzen, A. Durandin, V. G. Young, N. E. Geacintov and J. W. Canary, J. Am. Chem. Soc., 2006, 128, 3854–3855, DOI:10.1021/ja056631g.
- C. Gou, S.-H. Qin, H.-Q. Wu, Y. Wang, J. Luo and X.-Y. Liu, Inorg. Chem. Commun., 2011, 14(10), 1622–1625, DOI:10.1016/j.inoche.2011.06.024.
- J. Ting, F. Mei, Z. Mengyao, Q. Jianwen, Z. Hu and G. Yong, Spectrochim. Acta, Part A, 2020, 227, 117530, DOI:10.1016/j.saa.2019.117530.
- J. J. Xiong, P. C. Huang, C. Y. Zhang and F. Y. Wu, Sens. Actuators, B, 2016, 226, 30–36, DOI:10.1016/j.snb.2015.11.113.
- G. Zhang, H. Zhang, J. Zhang, W. Ding, J. Xu and Y. Wen, Sens. Actuators, B, 2017, 253, 224–230, DOI:10.1016/j.snb.2017.06.144.
- K. P. Carter, A. M. Young and A. E. Palmer, Chem. Rev., 2014, 114, 4564–4601, DOI:10.1021/cr400546e.
- N. Dey and S. Bhattacharya, Dalton Trans., 2018, 47, 2352–2359, 10.1039/C7DT03401F.
- H. Rao, W. Liu, K. He, S. Zhao, Z. Lu, S. Zhang, M. Sun, P. Zou, X. Wang, Q. Zhao, Y. Wang and T. Liu, ACS Sustainable Chem. Eng., 2020, 8, 8857–8867, DOI:10.1021/acssuschemeng.0c03354.
- S. L. Gui, Y. Y. Huang, F. Hu, Y. L. Jin, G. X. Zhang, L. S. Yan, D. Q. Zhang and R. Zhao, Anal. Chem., 2015, 87, 1470–1474, DOI:10.1021/ac504153c.
- M. Kumar, N. Kumar, V. Bhalla, P. R. Sharma and T. Kaur, Org. Lett., 2012, 14, 406–409, DOI:10.1021/ol3034059.
- D. G. Barceloux, J. Toxicol., Clin. Toxicol., 1999, 37, 217–230, DOI:10.1081/CLT-100102421.
- T. G. Thomas, K. Sreenath and K. R. Gopidas, Analyst, 2012, 137, 5358–5362, 10.1039/C2AN35904A.
- A. K. Manna, K. Rout, S. Chowdhury and G. K. Patra, Photochem. Photobiol. Sci., 2019, 18(6), 1512–1525, 10.1039/c9pp00114j.
- S. N. Gacheru, P. C. Trackman, M. A. Shah, C. Y. O'Gara, P. Spacciapoli, F. T. Greenaway and H. M. Kagan, J. Biol. Chem., 1990, 265(31), 19022–19027, DOI:10.1016/S0021-9258(17)30618-X.
- H. Beinert, Eur. J. Biochem., 1997, 245(3), 521–532, DOI:10.1111/j.1432-1033.1997.t01-1-00521.x.
- J. F. Mercer, Trends. Mol. Med., 2001, 7(2), 64–69, DOI:10.1016/s1471-4914(01)01920-7.
- H. Tapiero, D. M. Townsend and K. D. Tew, Biomed. Pharmacother., 2003, 57(9), 386–398, DOI:10.1016/s0753-3322(03)00012-x.
- O. Bandmann, K. H. Weiss and S. G. Kaler, Lancet Neurol., 2015, 14(1), 103–113, DOI:10.1016/S1474-4422(14)70190-5.
- R. Hait-Darshan, T. Babushkin and Z. Malik, J. Environ. Pathol., Toxicol. Oncol., 2009, 28(3), 209–221, DOI:10.1615/jenvironpatholtoxicoloncol.v28.i3.20.
- E. Koutsouraki, D. Michmizos, O. Patsi, J. Tzartos, M. Spilioti, M. Arnaoutoglou and M. Tsolaki, Virol. J., 2020, 17(1), 35, DOI:10.1186/s12985-020-01309-x.
- E. Tokuda and Y. Furukawa, Int. J. Mol. Sci., 2016, 17(5), 636, DOI:10.3390/ijms17050636.
- K. A. Trumbull and J. S. Beckman, Antioxid. Redox Signaling, 2009, 11(7), 1627–1639, DOI:10.1089/ars.2009.2574.
- R. Squitti, D. Lupoi, P. Pasqualetti, G. Dal Forno, F. Vernieri, P. Chiovenda, L. Rossi, M. Cortesi, E. Cassetta and P. M. Rossini, Neurology, 2002, 59(8), 1153–1161, DOI:10.1212/wnl.59.8.1153.
- P. G. Georgopoulos, A. Roy, M. J. Yonone-Lioy, R. E. Opiekun and P. J. Lioy, J. Toxicol. Environ. Health, Part B, 2001, 4(4), 341–394, DOI:10.1080/109374001753146207.
- U. A. Fegade, S. K. Sahoo, A. Singh, N. Singh, S. B. Attarde and A. S. Kuwar, Anal. Chim. Acta, 2015, 872, 63–69, DOI:10.1016/j.aca.2015.02.051.
- A. K. Manna, S. Chowdhury and G. K. Patra, New J. Chem., 2020, 44, 10819, 10.1039/D0NJ01954B.
- M. L. D. R. Crapper, W. J. Lukiw and T. P. Kruck, Environ. Geochem. Health, 1990, 12, 103–114, DOI:10.1007/BF01734059.
- C. N. Martyn, D. J. Barker, C. Osmond, E. C. Harris, J. A. Edwardson and R. F. Lacey, Lancet, 1989, 333, 61–62 Search PubMed.
- G. C. Woodson, Bone, 1998, 22, 695–698, DOI:10.1016/s8756-3282(98)00060-x.
- P. D. Darbre, J. Inorg. Biochem., 2005, 99, 1912–1919, DOI:10.1016/j.jinorgbio.2005.06.001.
- S. Kim, J. Y. Noh, K. Y. Kim, J. H. Kim, H. K. Kang, S. W. Nam, S. H. Kim, S. Park, C. Kim and J. Kim, Inorg. Chem., 2012, 51(6), 3597–3602, DOI:10.1021/ic2024583.
- C. Gao, P. Zang, W. Liu and Y. Tang, J. Fluoresc., 2016, 26, 2015, DOI:10.1007/s10895-016-1895-z.
- X. Sun, Y. W. Wang and Y. Peng, Org. Lett., 2012, 14, 3420–3423, DOI:10.1021/ol301390g.
- K. K. Upadhyay and A. Kumar, Org. Biomol. Chem., 2010, 8, 4892–4897, 10.1039/C0OB00171F.
- K. Soroka, R. Vithanage, D. A. Philips, B. Walker and P. K. Dasgupta, Anal. Chem., 1987, 59, 629–636, DOI:10.1021/ac00131a019.
- P. Torawane, K. Keshav, M. K. Kumawat, R. Srivastava, T. Anand, S. Sahoo, A. Borse and A. Kuwar, Photochem. Photobiol. Sci., 2017, 16, 1464–1470, 10.1039/C7PP00182G.
- U. A. Fegade, S. K. Sahoo, A. Singh, N. Singh, S. B. Attarde and A. S. Kuwar, Anal. Chim. Acta, 2015, 872, 63–69, DOI:10.1016/j.aca.2015.02.051.
- A. Kuwar, R. Patil, A. Singh, R. Bendre and N. Singh, ChemPhysChem, 2014, 15, 3933–3937, DOI:10.1002/cphc.201402534.
- H. A. Benesi and J. H. Hildebrand, J. Am. Chem. Soc., 1949, 71(8), 2703–2707, DOI:10.1021/ja01176a030.
- G. L. Long and J. D. Winefordner, Anal. Chem., 1983, 55, 712A–724A, DOI:10.1021/ac00258a724.
- L. Krause, R. Herbst-Irmer, G. M. Sheldrick and D. Stalke, J. Appl. Crystallogr., 2015, 48, 3–10, DOI:10.1107/S1600576714022985.
- G. M. Sheldrick, Acta Crystallogr., Sect. A: Found. Crystallogr., 2008, 64, 112–122, DOI:10.1107/S2053229614024218.
- G. M. Sheldrick, Acta Crystallogr., Sect. C: Struct. Chem., 2015, 71, 3–8, DOI:10.1107/S2053229614024218.
- C. F. Macrae, P. R. Edgington, P. McCabe, E. Pidcock, G. P. Shields, R. Taylor, M. Towler and J. van de Streek, J. Appl. Crystallogr., 2006, 39, 453–457, DOI:10.1107/S002188980600731X.
- A. Pardo, D. Reyman, J. M. L. Poyato and F. Medina, J. Lumin., 1992, 51, 269–274, DOI:10.1016/0022-2313(92)90077-M.
- K. Tayade, S. K. Sahoo, B. Bondhopadhyay, V. K. Bhardwaj, N. Singh, A. Basu, R. Bendre and A. Kuwar, Biosens. Bioelectron., 2014, 61, 429–433, DOI:10.1016/j.bios.2014.05.053.
- S. Patil, U. Fegade, S. K. Sahoo, A. Singh, J. Marek, N. Singh, R. Bendre and A. Kuwar, ChemPhysChem, 2014, 15, 2230–2235, DOI:10.1002/cphc.201402076.
- R. Patil, A. Moirangthem, R. Butcher, N. Singh, A. Basu, K. Tayade, U. Fegade, D. Hundiwale and A. Kuwar, Dalton Trans., 2014, 43, 2895–2899, 10.1039/c3dt52770k.
- D. S. Huerta-Joséa, J. G. Hernández-Hernándezb, C. A. Huerta-Aguilarc and P. Thangarasua, Sens. Actuators, B, 2019, 293, 357–365, DOI:10.1016/j.snb.2019.04.011; C. A. Huerta-Aguilar, T. Pandiyan, N. Singh and N. Jayanthi, Spectrochim. Acta, Part A, 2015, 146, 142–150, DOI:10.1016/j.saa.2015.03.082; C. A. Huerta-Aguilar, B. Ramírez-Guzmán, P. Thangarasu, J. Narayanan and N. Singh, Photochem. Photobiol. Sci., 2019, 18, 1761–1772, 10.1039/C9PP00060G.
- C. A. Huerta-Aguilar, T. Pandiyan, P. Raj, N. Singh and R. Zanella, Sens. Actuators, B, 2016, 223, 59–67, DOI:10.1016/j.snb.2015.09.064; C. A. Huerta-Aguilar, P. Raj, P. Thangarasu and N. Singh, RSC Adv., 2016, 6, 37944–37952, 10.1039/C6RA01231K; C. A. Huerta-Aguilar, T. Pandiyan, N. Singh and N. Jayanthi, Spectrochim. Acta, Part A, 2015, 146, 142–150, DOI:10.1016/j.saa.2015.03.082; J. A. O.Granados, P. Thangarasu, N. Singh and J. M. Vázquez-Ramos, Food Chem., 2019, 278, 523–532, DOI:10.1016/j.foodchem.2018.11.086.
- A. K. Manna, S. Chowdhury and G. K. Patra, New J. Chem., 2020, 44, 10819–10832, 10.1039/D0NJ01954B; A. K. Manna, K. Rout, S. Chowdhury and G. K. Patra, Photochem. Photobiol. Sci., 2019, 18, 1512–1525, 10.1039/C9PP00114J.
- P. Kaur, D. Sareen and K. Singh, Talanta, 2011, 83(5), 1695–1700, DOI:10.1016/j.talanta.2010.11.072.
- H. J. Xu, Z. D. Liu, L. Q. Sheng, M. M. Chen, D. Q. Huang, H. Zhang, C. F. Song and S. S. Chen, New J. Chem., 2013, 37, 274–277, 10.1039/C2NJ40767A.
- J. S. Lee, S. D. Warkad, P. B. Shinde, A. Kuwar and S. B. Nimse, Arabian J. Chem., 2020, 13(12), 8697–8707, DOI:10.1016/j.arabjc.2020.09.061.
- S. Liu, L. Zhang, W. Zan, X. Yao, Y. Yang and X. Liu, Sens. Actuators, B, 2014, 192, 386–392, DOI:10.1016/j.snb.2013.10.134.
Footnotes |
| † Electronic supplementary information (ESI) available: Tables S1–S5 and Fig. S1–S9 are available. CCDC 2051947. For ESI and crystallographic data in CIF or other electronic format see DOI: 10.1039/d1ma00564b |
| ‡ These authors contributed equally. Hence, both should be considered as first authors. |
| This journal is © The Royal Society of Chemistry 2021 |