
 Open Access Article
 This Open Access Article is licensed under a
 Creative Commons Attribution 3.0 Unported Licence
Tuning the optical bandgap and piezoresistance in iridium-based molecular semiconductors through ligand modification†
Simone
Eizagirre Barker‡
 a,
Helen
Benjamin‡
a,
Carole A.
Morrison
a,
Sergejs
Afanasjevs
b,
Gary S.
Nichol
a,
Stephen
Moggach
c,
Konstantin
Kamenev
b and
Neil
Robertson
*a
a,
Helen
Benjamin‡
a,
Carole A.
Morrison
a,
Sergejs
Afanasjevs
b,
Gary S.
Nichol
a,
Stephen
Moggach
c,
Konstantin
Kamenev
b and
Neil
Robertson
*a
aEaStCHEM School of Chemistry, University of Edinburgh, Edinburgh, UK
bCentre for Science at Extreme Conditions, University of Edinburgh, Edinburgh, UK. E-mail: neil.robertson@ed.ac.uk
cSchool of Molecular Sciences, The University of Western Australia, Crawley, Perth, Western Australia, Australia
First published on 29th June 2021
Abstract
Square-planar d8 metal complexes are known to stack with short metal–metal distances in the solid-state, forming linear molecular chains with conductive pathways that can be enhanced under pressure. Although the influence of the metallic centre on the behaviour of these materials has been previously studied, the role and significance of ligand choice has received less focus. Here, we study the relationship between the structural, optical and conductive properties of a series of d8 iridium dicarbonyl complexes with different β-diketonate ligands using a combination of experimental and computational methods. Our results show that ligand choice contributes significantly to the optical transitions of the molecules in solution by lowering the LUMO energy for complexes with π-conjugation or electronegative atoms. We also show that ligand choice is a pathway for band-structure tuning in the molecular crystal through ligand size selection and associated structural packing, with complexes packing in linear metal–metal stacks exhibiting a smaller optical bandgap in the solid state. With pressure-dependent measurements, we confirm that that favourable metal–metal stacking in the solid obtained by appropriate ligand choice leads to higher conductivity at lower pressures. Our results provide insight for the design and application of d8 metal complexes in optoelectronic devices and the development of future molecular materials.
Introduction
Since the discovery of semiconducting behaviour in phthalocyanines and condensed aromatic hydrocarbons in the 1950s,1,2 the field of molecular electronics has seen huge advances, from metallic conductivity in Krogman's salt (K2Pt(CN)4Br0.3) and charge transfer salt TTF-TCNQ,3,4 to superconductivity.5 Metal complexes in particular have shown a wide range of properties, with examples of Dirac electron systems,6 Mott insulators,7 and superconductivity.8 Square-planar d8 metal complexes are of particular interest, due to their propensity to form linear stacks with short metal–metal distances.9 These strong intermolecular interactions can provide a conductive pathway which can be enhanced under the application of pressure; for example, square planar platinum complexes Pt(bqd)2 (bqd = benzoquinonedioximato) and Pt(dmg)2 (dmg = dimethylglyoximato) undergo a 4-fold and 15-fold order of magnitude increase in conductivity on application of pressure, becoming metallic at 0.6–1.4 and 5 GPa, respectively.10–13 This behaviour originates from the increased interaction of Pt dz2 and ligand π-orbitals along the stacking axis, which is highly compressible under pressure.14 Piezoresistive behaviour has also been observed for other stacked d8 metal complexes, including Magnus’ Green salt Pt(NH3)4PtCl4, and Ir(CO)2acac (acac = acetylacetone) which undergo 1.5-fold and 5-fold order of magnitude changes in conductivity, respectively.15While short metal–metal distances are key to this piezoresistive behaviour, there has been relatively little focus on the role played by the ligand. In this work, we investigate the impact of ligand choice on the molecular and solid-state optical and electronic properties of iridium dicarbonyl β-diketonate compounds (including Ir(CO)2acac). We present the synthesis of four Ir(CO)2L (L = ligand) complexes and compare their molecular properties with support from (time-dependent) density functional theory (TD-)DFT calculations. We then present their crystal structures and ability to form thin films, and investigate their solid-state optical and electronic properties through diffuse reflectance measurements with support from solid-state band structure calculations. We then discuss the impact of ligand choice on the solid-state structure and therefore on the electronic and piezoresisitive properties.
Results and discussion
Synthesis
The synthesis scheme for the Ir(CO)2(β-diketonate) complexes is shown in Fig. 1a. The synthesis of Ir(CO)2tfpb (tfpb = benzoyltrifluoroacetone) is presented for the first time; complexes Ir(CO)2dbm (dbm = dibenzoylmethane) and Ir(CO)2tfaa (tfaa = trifluoroacetylacetone) have been reported previously,16 however this was via a different synthetic route, and only IR and NMR data were reported. We study the properties of Ir(CO)2acac (acac = acetylacetone) in parallel to benchmark how our newly characterised complexes compare to the previously reported behaviour for this family of molecules. The complexes were each synthesised from the [Ir(I)(COD)Cl]2 dimer (COD = 1,5-cyclooctadiene), via reaction with carbon monoxide, followed by addition of base and the appropriate β-diketonate ligand. The complexes were obtained in moderate to good yields (38–77%) as crystals from hexane solutions. | ||
| Fig. 1 (a) Synthesis scheme of Ir(CO)2(β-diketonate) complexes. (b) Absorbance spectra of the complexes in solution, scaled by their respective molar absorption coefficients. | ||
Molecular properties
The absorption spectra of the four complexes in solution are shown in Fig. 1b. All complexes exhibit optical transitions in the same region of the UV-vis (250–420 nm). The absorption of Ir(CO)2tfaa is similar in profile to that of Ir(CO)2acac due to the similarity in ligand structure and extent of conjugation, though with a slightly smaller optical gap. The absorbance of Ir(CO)2dbm and Ir(CO)2tfpb extend further towards the visible region than that of Ir(CO)2tfaa, a result of the extended conjugation in the ligand framework.To gain further insight into the electronic structure of the complexes, hybrid (TD-)DFT calculations were performed to identify the frontier molecular orbitals and nature of the electronic transitions. As we find the nature of the frontier orbitals to be very similar for all complexes, those of complex Ir(CO)2tfpb are presented in Fig. 2a, while the orbitals for the remaining complexes are available in the ESI† (Fig. S4–S7). The calculated HOMO and LUMO energies are shown in Table 1. In the case of all four complexes the HOMOs contain no contributions from the diketonate ligand orbitals, such that the ligands are limited to exerting an inductive effect as seen in the slight lowering of the HOMO level for the two complexes containing electron-withdrawing fluorine substituents (Ir(CO)2tfpb and Ir(CO)2tfaa). The large contribution of the diketonate orbitals to the LUMOs of the complexes results in a lowering of the LUMO energy for complexes that have extended π-conjugation (Ir(CO)2dbm and Ir(CO)2tfpb) and for complexes that have electronegative fluorine atoms (Ir(CO)2tfpb and Ir(CO)2tfaa). This combination of effects results in the narrowest HOMO–LUMO gap for Ir(CO)2tfpb.
 | ||
| Fig. 2 (a) Frontier orbitals of the complex as modelled with DFT; (b) simulated (black curve) and experimental (green curve) absorbance spectra of the complex in hexane. The oscillator strength of the electronic transitions obtained via TD-DFT is shown (bars). | ||
| Complex | HOMO energya (eV) | LUMO energya (eV) | HOMO–LUMO gap (eV) | Absorptionb onset (eV) |
|---|---|---|---|---|
| a Calculated from DFT (B3LYP/LANL2DZ+6-31G*). b Onset of absorption from spectra in Fig. 1b. | ||||
| Ir(CO)2acac | −6.51 | −1.75 | 4.76 | 3.1 |
| Ir(CO)2dbm | −6.51 | −2.43 | 4.08 | 2.9 |
| Ir(CO)2tfpb | −6.76 | −2.76 | 4.0 | 2.8 |
| Ir(CO)2tfaa | −6.79 | −2.46 | 4.33 | 3.1 |
The absorption spectra of the complexes in solution were modelled by TD-DFT calculations, and showed good agreement between observed and predicted spectra with a similar ordering of transitions for all four complexes and a reasonably-good match of the number and position of intense peaks. These are presented in Fig. 2b for Ir(CO)2tfpb, and in Fig. S3 in the ESI† for the remaining complexes, with the nature of the low-energy optical transitions also available in the ESI† (Tables S6–S9). The calculated trend of HOMO–LUMO gap energies is consistent with the ordering of the onset of absorption for the complexes in solution, as presented in Table 1. Importantly, the frontier transitions of all the complexes are of metal-to-ligand charge transfer (MLCT) character, with electron density moving from the metal centre to either the central chelate or the vacant π*-orbitals on either the CO ligands. Where the ligands possess extended conjugation Ir(CO)2dbm and Ir(CO)2tfpb, the π*-orbitals on the phenyl rings also contribute to these frontier transitions.
Solid-state properties
| Complex | Ir(CO)2acaca | Ir(CO)2dbm | Ir(CO)2tfpb | Ir(CO)2tfaa |
|---|---|---|---|---|
| a Crystal parameters taken from ref. 18. | ||||
| Space group | P![[1 with combining macron]](https://www.rsc.org/images/entities/char_0031_0304.gif) |
P |
P21/c |
P |
| Cell lengths (Å) | a = 6.48, b = 7.73, c = 9.16 | a = 8.3064(4), b = 11.3030(5), c = 16.2709(9) | a = 7.333*(2), b = 17.1409(6), c = 19.7049(5) | a = 6.5643(4), b = 7.7556(4), c = 9.4383(3) |
| Cell angles (°) | α = 105.7, β = 90.5, γ = 100.7 | α = 96.266(4), β = 97.677(4), γ = 100.017(4) | α = γ = 90, β = 92.083(2) | α = 101.495(3), β = 90.337(4), γ = 102.307(5) |
| Cell volume (Å3) | 433.24 | 1477.08(13) | 2475.46(13) | 459.46(4) |
| Z, Z′ | 2, 0 | 4, 2 | 8, 2 | 2, 1 |
 | ||
| Fig. 3 Schematic of the crystal structures of (a) Ir(CO)2acac, (b) Ir(CO)2dbm, (c) Ir(CO)2tfpb, (d)Ir(CO)2tfaa, obtained via single-crystal X-ray diffraction. Note that (b) and (c) have two molecules in each asymmetric unit. For all complexes, four molecules are shown to illustrate packing along the axis perpendicular to the plane of the molecules. | ||
Complex Ir(CO)2tfaa shows a similar crystal packing to that of Ir(CO)2acac; the molecules form an infinite chain with an alternating distance of 3.2717(7) and 3.3140(7) Å between the iridium atoms, slightly longer than the metal–metal bonds of the Ir(CO)2acac complex. As with Ir(CO)2acac, the Ir atoms in the chain are slightly offset, forming a zig-zag with an angle of 170.755(19)°. Short F–O contacts (e.g. O2⋯F1 2.749(7) Å) exist between the carbon monoxide O and the CF3 groups on adjacent molecules with the chain, and on adjacent chains. The similarity between the Ir(CO)2tfaa and Ir(CO)2acac structures can be explained by the comparable size and shape of the β-diketonate ligands.
By contrast, infinite chains of metal–metal interactions are not observed in complexes Ir(CO)2dbm and Ir(CO)2tfpb. Compound Ir(CO)2dbm crystallises with a much larger unit cell, made up of chains of discrete dimers which stack along the a-axis. Each dimer has a short Ir–Ir distance of 3.1446(3) Å, with an angle of 1.82° between the planes of the two molecules, forming a ‘slipped’ metal–metal bond. The next closest dimer pair is related to the first via a translation along the a axis, such that the β-diketonate ligand sits over the Ir centre of molecule in an adjacent dimer. The phenyl rings are twisted (16–21°) with respect to the core of the ligand chelate, and do not show any sign of π-stacking. It is clear that the size of the β-diketonate ligand has disrupted the ability of the complex to form infinite chains of metal–metal interactions in the solid state.
In compound Ir(CO)2tfpb the β-diketonate ligand is smaller, with only one phenyl ring. As a result the molecules are still able to crystallise in metal–metal chains along the a-axis, however the packing is not as linear as that observed for Ir(CO)2acac or Ir(CO)2tfaa. The molecules crystallise as dimers, with each molecule related to its partner via a reflection and an in-plane 90° rotation, resulting in the phenyl rings stacking over each other whilst keeping the CF3 groups of adjacent molecules far apart. The Ir–Ir distances are not as short as that of the other complexes, 3.5146(9) Å in the dimer and 3.9432(9) Å between dimers. The Ir atoms in the chain are also significantly offset, forming a zigzag with an angle of 159.04(3)°. In addition to this metal-centred stacking, the phenyl rings on the β-diketonate ligand form a chain of π-stacking interactions, 3.680(9) Å and 3.787(9) Å between ring centroids. It is clear that ligand choice has a significant impact on the structural packing of the molecules in crystal form, with large ligands able to overcome the preference for forming metal-stacked chains.
We also fabricated films of each complex using vapour deposition, as square planar M(CO)2(β-diketonate) complexes have been shown to be volatile at relatively low temperatures under reduced pressure.19,20 Their powder X-ray diffraction patterns are shown in Fig. 4, alongside the predicted powder spectrum obtained from single crystal structures. The powder patterns for Ir(CO)2acac, Ir(CO)2dbm, and Ir(CO)2tfaa match well with the predicted single crystal patterns, with some evidence of preferred orientation indicated by the ratio of peak heights. The film of Ir(CO)2tfpb, however, exhibits peaks that do not correspond to the predicted spectrum, indicating either the existence of a different polymorph or decomposition of the material under the sublimation conditions.
 | ||
| Fig. 4 Crystal structure of the vapour-deposited films of complexes (a) Ir(CO)2acac, (b) Ir(CO)2dbm, (c) Ir(CO)2tfpb, (d) Ir(CO)2tfaa, showing the predicted powder X-ray diffraction pattern (black) calculated from single-crystal structure data and experimental diffraction pattern for the films of each material. No experimental peaks were of sufficient intensity to be observed above (a) 40°, (b) 30°, (c) 25°. Peaks labelled with an asterisk (*) correspond to the PXRD pattern of the fluorine-doped Tin Oxide (FTO) glass substrate. | ||
 | ||
| Fig. 5 UV-vis absorption spectra of the complexes in hexane solution (black curves) and Kubelka–Munk transforms obtained from diffuse reflectance measurements of vapour-deposited films (blue curves) and powders (red curves) of (a) Ir(CO)2acac, (b) Ir(CO)2dbm, (c) Ir(CO)2tfpb, (d) Ir(CO)2tfaa. | ||
The optical band gap of each complex is estimated from the absorption behaviour using the Tauc plot extrapolation method (see ESI†),21 and the obtained values from the optical spectra of the powders follow the order Ir(CO)2tfaa (0.5 eV) < Ir(CO)2tfpb (1.0 eV) < Ir(CO)2acac (1.3 eV) < Ir(CO)2dbm (2.0 eV). This contrasts with the solution behaviour, where the complexes with the most conjugated ligands (Ir(CO)2dbm and Ir(CO)2tfpb) had the smallest optical gap, and highlights the role of strong crystal packing interactions in determining solid-state optical behaviour. The powder and film spectra show similar features for all complexes with the exception of Ir(CO)2tfpb, where the absorbance is reduced for the film between 1–2 eV compared to the powder. As the powder XRD measurements showed that the film has a different crystal structure to the measured single-crystal, it is possible that the inter-band transitions in the vapour-deposited film and the powder arise from differences in structure.
The band structures and projected density of states (PDOS) of the complexes in the solid-state were calculated with CASTEP22 and are shown in Fig. 6. For all the complexes the valence band is comprised of Ir-based orbitals, while the frontier of the conduction band is made up of contributions from the β-diketonate ligands, with a small contribution from the CO ligands present for Ir(CO)2acac and Ir(CO)2dbm. Comparing these results with the molecular orbitals of the isolated molecules confirms that the solid-state valence band originates from the molecular HOMOs, particularly the dz2 orbital, and that molecular LUMOs contribute to the conduction band.
 | ||
| Fig. 6 Predicted electronic transitions in the molecular solid: Band structure and corresponding projected density of states (PDOS) of each band, calculated using density functional theory with CASTEP. The valence bands (blue curves in band structure) are mainly of metal (blue curves in PDOS) character, whilst the conduction bands (red curves in band structure), are mainly of ligand character (red curves in PDOS). The X-axis labels on the electronic band structure diagrams represent high symmetry k-points, defined according to the standard convention for each corresponding Brillouin zone. | ||
In the complexes with linear metal–metal stacks in the crystalline solid (Ir(CO)2acac, Ir(CO)2tfaa and, Ir(CO)2tfpb), the valence band exhibits a high degree of dispersion along one axis (ca. 2 eV), corresponding to the metal–metal stacking axis (c-axis) in the crystal structure. This indicates that the intermolecular interactions are relatively strong along the chain. By contrast, the conduction bands are relatively flat, indicating there is relatively little overlap between the unoccupied molecular orbitals on transition to the solid state.
The band structure of Ir(CO)2dbm shows little to no dispersion for any of the bands, indicating that the orbitals are highly localised. This is a result of poor intermolecular orbital overlap in the solid state, a consequence of the dimeric packing in the crystal structure, and suggests that mobility of charge carriers will be limited.
The crystal structure of Ir(CO)2tfpb shows the presence of an infinite chain of metal–metal stacking interactions, but with longer bond lengths and a more staggered overlap compared to that of Ir(CO)2acac and Ir(CO)2tfaa. This translates to a lesser amount of dispersion in the valence band compared to the linear chain complexes, but a far greater dispersion than seen for the dimeric structure of Ir(CO)2dbm.
The simulated band gaps for the complexes follow the order Ir(CO)2tfaa (0.6 eV) < Ir(CO)2acac (1.0 eV) < Ir(CO)2tfpb (1.2 eV) < Ir(CO)2dbm (1.5 eV), which is largely in agreement with the trend from experimentally derived band gaps (Ir(CO)2tfaa < Ir(CO)2tfpb < Ir(CO)2acac < Ir(CO)2dbm). This order reflects the varying amounts of dispersion in the band structures, which originate from the differing extent of intermolecular interactions in the solid state.
Piezoresistive properties
The conductivity of Ir(CO)2acac has been shown to dramatically increase under the application of pressure; after applying ∼14 GPa of external pressure the conductivity increases by approximately 5 orders of magnitude.15 This increased conductivity is associated with a smooth decrease in the metal–metal distances along the chain. Herein, we have investigated the conductive behaviour of complexes Ir(CO)2dbm, Ir(CO)2tfpb and Ir(CO)2tfaa under applied pressure in order to probe the influence of ligand choice on the solid state conductivity. The conductivity of the compressed powders was measured on a pellet using a diamond anvil cell (DAC) apparatus and is presented in Fig. 7 (see Methods for details).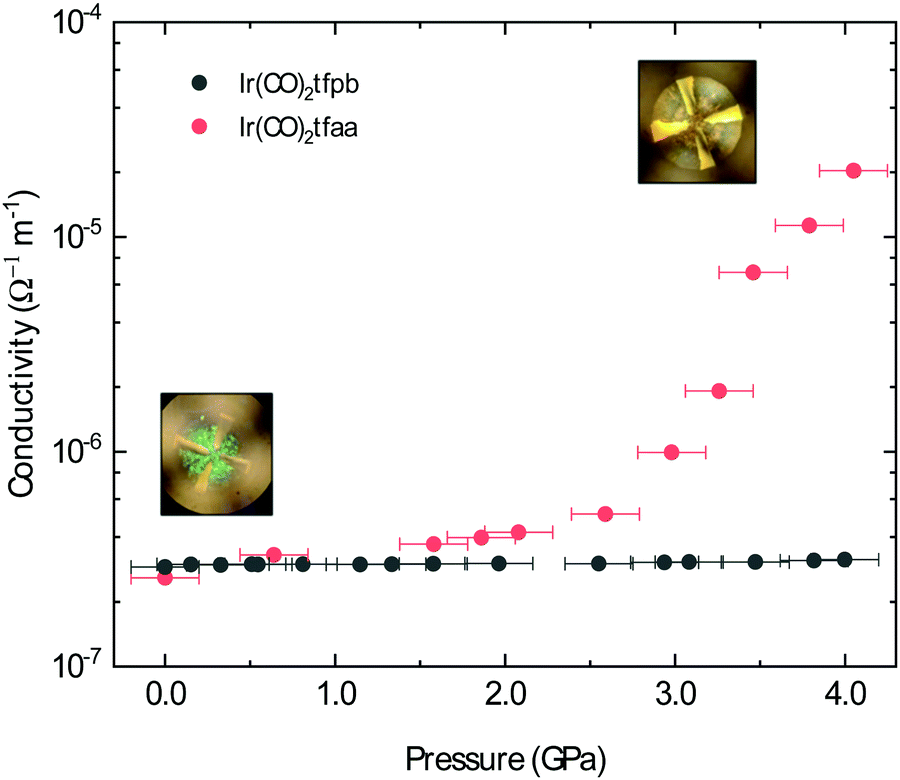 | ||
| Fig. 7 Pressure-dependent conductivity of a compressed powders of Ir(CO)2tfpb and Ir(CO)2tfaa. Inset are pictures of the compressed Ir(CO)2tfaa inside the DAC at two different pressures, showing a colour change from green to brown indicating a shift in energy of the optical bands of the material. The error bars in the pressure axis arise from uncertainty in the collected pressure readings (see Methods for details). The error bars for conductivity values are too small to be visualised in the figure. | ||
In the case of complex Ir(CO)2dbm, the resistance of the compressed pellet was too high to be measured (>200 TΩ), even at elevated temperature (353 K). This high resistance is a due to the low dispersion of the frontier bands, which originated from the lack of metal–metal chains in the crystal structure.
As Ir(CO)2tfaa and Ir(CO)2acac have comparable crystal packing, it is plausible to expect any differences in pressure-dependent conductivity between the two originating from either (1) different initial band-gaps, (2) different degrees of compressibility of the lattice, or (3) presence of any phase transitions. The conductivity of complex Ir(CO)2tfaa increases steadily with greater pressure, increasing by approximately 2 orders of magnitude by 3.0 GPa. This increased conductivity is accompanied by a change in the optical properties with the pellet turning from green to brown (Fig. 7 insets), indicating a shift in the energies of the bands. This behaviour is comparable to that of Ir(CO)2acac, which experiences an order of magnitude increase in conductivity within a similar range.
By contrast, the conductivity of complex Ir(CO)2tfpb remains more or less constant at a lower value within the same pressure range, despite the fact that there is some degree of continuous metal–metal interactions in the structure as in the other complexes. This suggests that its structure does not compress in a way that enhances the metal–metal interactions, which are more staggered than those in Ir(CO)2acac or Ir(CO)2tfaa.
The difference in behaviour between the four complexes highlights the role the ligand plays in determining the optical and electronic behaviour of Ir(CO)2(β-diketonate) complexes, by virtue of how it impacts the solid state crystal packing. Complexes with ligands that prevent the formation of infinite chains, or disrupt the linearity of the metal–metal stack, will either be highly insulating or only show a moderate response to the application of pressure.
Conclusions
We synthesised four Ir(CO)2(β-diketonate) complexes and investigated their structural and optical properties. We find that choice of β-diketonate ligand contributes significantly to the optical transitions of the molecules in solution by lowering the LUMO energy for complexes with π-conjugation or electronegative fluorine atoms. In the solid state, we observe that the choice of ligand plays a significant role in determining the structural packing in the molecular crystal. Importantly, with the support of molecular orbital and band structure calculations, we show that these differences in structural packing have a profound impact on the optical transitions in the solid state, with complexes packing in metal–metal stacks showing a significant reduction in band gap. We also highlight the impact of this metal–metal stacking on the electronic properties of these materials, leading to a pressure-dependent increase in conductivity for Ir(CO)2tfaa and Ir(CO)2acac, while complexes without this favourable packing showed little piezoconductive response. These results demonstrate the importance of ligand modification within these materials set as an important tool for control over their optical and electronic properties. The separate influences of LUMO energy tuning using electron-withdrawing ligands, alongside band-structure tuning through ligand size and packing, provides insight and guidance for the optoelectronic application of semiconducting metal complexes, and the design and development of future molecular electronic materials.Materials and methods
Organometallic synthesis
All commercially available chemicals were used without further purification. The iridium complexes were synthesised according to the following general method:Ir[(COD)(μ-Cl)]2 (400 mg, 0.595 mmol) was dissolved in dry tetrahydrofuran (THF) (45 ml) under nitrogen atmosphere. The solution was degassed by three freeze–pump–thaw cycles, and allowed to thaw under vacuum. Carbon monoxide gas was then passed through the reaction flask for 5–10 minutes under vigorous stirring until the solution changed colour, from yellow-orange to blue-black. The CO was produced in situ from the reaction between oxalyl chloride and aqueous NaOH solution as described by Hansen et al.,23 collected in a balloon and flowed directly into the reaction flask. Sodium hydrogen carbonate (NaHCO3) (4.00 g, 47 mmol) and the appropriate ligand (0.6 mmol) were then quickly added under a high flow of nitrogen, and the mixture heated at 70 °C for 3 hours with stirring. The solution changed back to a yellow-orange colour upon reaction completion. The reaction mixture was cooled, and the product collected through filtration after evaporating the solvent and washing with hexane.
Single crystals of all complexes were obtained by dissolving the reaction product in hexane, heating the solution to 100 °C and leaving to cool slowly. Due to their high solubility in hexane, the Ir(CO)2tfpb and Ir(CO)2tfaa solutions were placed in the fridge (4 °C) to cool for half an hour, then left in the freezer (−20 °C) overnight.
Ir(CO)2acac (160 mg, 77%), obtained as bronze needles. 1H NMR (500 MHz, Chloroform-d) δ = 5.8 (s, 1H), 2.13 (s, 6H) (in agreement with that reported in ref. 18).
Thin-film fabrication via vapour deposition
Single crystals (<5 mg) of the desired material were sublimed onto fluorine-doped tin oxide (FTO) substrates under vacuum (300 mTorr) at approximately 120 °C. The substrate was placed at the end of a condenser finger cooled with dry ice/acetone.Crystallography methods
Single crystal X-ray diffraction measurements were carried out on a Rigaku Oxford Diffraction SuperNova (compounds Ir(CO)2dmb and IR(CO)2tfpb) or a Rigaku Oxford Diffraction Gemini (Ir(CO)2tfaa) diffractometer using either Mo (Ir(CO)2dbm) or Cu (all others) Kα radiation and a crystal temperature of 100 (Ir(CO)2tfaa) or 120 (all others) K. All structures were solved with ShelXT24 and refined by full-matrix least-squares on F2 using ShelXL,24 interfaced through Olex2.25Optical characterization
UV-visible absorption spectra of the complexes in solution and thin-films were carried out using a spectrophotometer (JASCO V-670), with a cell path-length of 1 cm. For solution measurements, a cuvette containing hexane was used as a reference. Molar absorption coefficients of each complex were obtained using the Beer–Lambert law. Diffuse reflectance (DR) spectra were measured with the same setup, equipped with an integrating sphere (SIN-723UV-Visible-NIR). For DR measurements, a few milligrams of each complex were ground into a fine powder with barium sulfate (BaSO4), to obtain a ‘dilute’ powder mixture, which was placed into the setup for measurement. The reflectance of a pure BaSO4 ground sample was used as a reference.Computational methodology
Solid-state calculations
The band structure and partial density of states for the complexes were calculated using density functional theory within the plane-wave pseudopotential approach as implemented in the CASTEP code.22 The PBE functional was used with the default CASTEP ultrasoft pseudopotentials and a plane-wave basis set express at an energy cut-off of 750 eV. The primitive electronic Brillouin zone was sampled with a Monkhorst–Pack grid of 3 × 5 × 5 for Ir(CO)2acac, 5 × 5 × 5 for both Ir(CO)2dbm and Ir(CO)2tfpb, and 4 × 3 × 3 for Ir(CO)2tfaa. The input geometries were those obtained from single-crystal X-ray diffraction experiments.Ir(CO)2acac and Ir(CO)2dbm were optimised under full geometry optimisation, while Ir(CO)2tfaa was subjected to atom-only (ie lattice parameters held fixed, due to poor reproduction of the unit cell parameters under full optimisation – see ESI†). The following convergence criteria were applied: energy tolerance = 1 × 10⁻⁵ eV Å−1, atomic forces = 0.05 eV Å−1, atomic displacements = 5 × 10⁵ Å, and unit cell stress = 0.1 GPa using the Broyden–Fletcher–Goldfarb–Shanno (BFGS) method. Calculations on Ir(CO)2tfpb were performed at single point energy, as due to the large system size the structure could not be optimised even under atom only conditions. The partial density of states plots were derived using the OptaDOS code.31,32
Piezoresistivity measurements
The high-pressure resistance measurements were performed in a Merrill–Bassett diamond anvil cell (DAC) with 0.8 mm culet anvils. The resistance was measured on the compressed powder pellet through the deposited on the anvil gold contacts (see Fig. 7 inset) using the Keithley 6517A electrometer. The resistance values were converted into conductivity using the Montgomery method for anisotropic materials.33 The pressure was probed using the ruby fluorescence method,34 with Daphne 7373 oil as the pressure transmitting medium.35 The uncertainty in collected pressure readings (0.2 GPa) arises due to shifts of the ruby crystal from the centre of the gasket during the course of the measurement.Author contributions
H. B. and N. R. designed and directed the work; S. E. B., and H. B. synthesised materials and performed optical experiments; S. E. B., H. B. and C. M. conducted simulations; S. A. performed pressure-dependent measurements, G. S. N. and S. M. conducted single-crystal X-ray diffraction measurements; K. K. and N. R. supervised the project; S. E. B. and H. B. wrote the manuscript with input from all authors.Conflicts of interest
There are no conflicts to declare.Acknowledgements
We thank the Leverhulme Trust (RPG-2016-152) for funding. The authors would like to thank Stephen Boyer at the Science Centre at London Metropolitan University for performing elemental analysis measurements. This work has made use of the resources provided by the Scottish Instrumentation and Resource Centre for Advanced Mass Spectrometry (SIRCAMS) at the University of Edinburgh and the Edinburgh Computer and Data Facility (ECDF) (http://www.ecdf.ed.ac.uk/). We are grateful for computational support from the UK Materials and Molecular Modelling Hub, which is partially funded by EPSRC (EP/P020194 and EP/T022213), for which access was obtained via the UKCP consortium and funded by EPSRC grant ref EP/P022561/1.References
- H. Kobayashi, A. Kobayashi and H. Tajima, Chem. – Asian J., 2011, 6, 1688–1704 CrossRef CAS PubMed.
- D. D. Eley, Nature, 1948, 162, 819 CrossRef CAS.
- K. Krogmann, Angew. Chem., Int. Ed. Engl., 1969, 8, 35–42 CrossRef CAS.
- J. Ferraris, D. O. Cowan, V. Walatka and J. H. Perlstein, J. Am. Chem. Soc., 1973, 95, 948–949 CrossRef CAS.
- D. Jérome, A. Mazaud, M. Ribault and K. Bechgaard, J. Phys. Lett., 1980, 41, 95–98 CrossRef.
- R. Kato, H. B. Cui, T. Tsumuraya, T. Miyazaki and Y. Suzumura, J. Am. Chem. Soc., 2017, 139, 1770–1773 CrossRef CAS.
- J. B. Torrance, J. J. Mayerle, K. Bechgaard, B. D. Silverman and Y. Tomkiewicz, Phys. Rev. B: Condens. Matter Mater. Phys., 1980, 22, 4960–4965 CrossRef CAS.
- H. Tajima, M. Inokuchi, A. Kobayashi, T. Ohta, R. Kato, H. Kobayashi and H. Kuroda, Chem. Lett., 1993, 1235–1238 CrossRef CAS.
- B. M. Anderson and S. K. Hurst, Eur. J. Inorg. Chem., 2009, 3041–3054 CrossRef CAS.
- K. Takeda, I. Shirotani and K. Yakushi, Chem. Mater., 2000, 12, 912–916 CrossRef CAS.
- I. Shirotani, A. Kawamura, K. Suzuki, W. Utsumi and T. Yagi, Bull. Chem. Soc. Jpn., 2006, 64, 1607–1612 CrossRef.
- K. Takeda, I. Shirotani, C. Sekine and K. Yakushi, J. Phys.: Condens. Matter, 2000, 12, L483–L488 CrossRef CAS.
- K. Takeda, I. Shirotani and K. Yakushi, Synth. Met., 2003, 133–134, 415–416 CrossRef CAS.
- H. Benjamin, J. G. Richardson, S. A. Moggach, S. Afanasjevs, L. Warren, M. R. Warren, D. R. Allan, C. A. Morrison, K. V. Kamenev and N. Robertson, Phys. Chem. Chem. Phys., 2020, 22, 6677–6689 RSC.
- L. V. Interrante and F. P. Bundy, Inorg. Chem., 1971, 10, 1169–1174 CrossRef CAS.
- F. Bonati and R. Ugo, J. Organomet. Chem., 1968, 11, 341–352 CrossRef CAS.
- L. F. Ballard and J. J. Wortman, J. Appl. Phys., 1970, 41, 4232–4236 CrossRef CAS.
- K. V. Zherikova, N. V. Kuratieva and N. B. Morozova, J. Struct. Chem., 2009, 50, 574–576 CrossRef CAS.
- E. L. Crane, Y. You, R. G. Nuzzo and G. S. Girolami, J. Am. Chem. Soc., 2000, 122, 3422–3435 CrossRef CAS.
- J. C. Hierso, R. Feurer and P. Kalck, Coord. Chem. Rev., 1998, 178–180, 1811–1834 CrossRef CAS.
- J. Tauc, R. Grigorovici and A. Vancu, Phys. Status Solidi, 1966, 15, 627–637 CrossRef CAS.
- S. J. Clark, M. D. Segall, C. J. Pickard, P. J. Hasnip, M. I. J. Probert, K. Refson and M. C. Payne, Zeitschrift fur Krist., 2005, 220, 567–570 CAS.
- S. V. F. Hansen and T. Ulven, Org. Lett., 2015, 17, 2832–2835 CrossRef CAS.
- G. M. Sheldrick, Acta Crystallogr., Sect. A: Found. Adv., 2015, 71, 3–8 CrossRef PubMed.
- O. V. Dolomanov, L. J. Bourhis, R. J. Gildea, J. A. K. Howard and H. Puschmann, J. Appl. Crystallogr., 2009, 42, 339–341 CrossRef CAS.
- M. J. Frisch, G. W. Trucks, H. B. Schlegel, G. E. Scuseria, M. A. Robb, J. R. Cheeseman, G. Scalmani, V. Barone, G. A. Petersson, H. Nakatsuji, X. Li, M. Caricato, A. Marenich, J. Bloino, B. G. Janesko, R. Gomperts, B. Mennucci, H. P. Hratchian, J. V. Ortiz, A. F. Izmaylov, J. L. Sonnenberg, D. Williams-Young, F. Ding, F. Lipparini, F. Egidi, J. Goings, B. Peng, A. Petrone, T. Henderson, D. Ranasinghe, V. G. Zakrzewski, J. Gao, N. Rega, G. Zheng, W. Liang, M. Hada, M. Ehara, K. Toyota, R. Fukuda, J. Hasegawa, M. Ishida, T. Nakajima, Y. Honda, O. Kitao, H. Nakai, T. Vreven, K. Throssell, J. A. J. Montgomery, J. E. Peralta, F. Ogliaro, M. Bearpark, J. J. Heyd, E. Brothers, K. N. Kudin, V. N. Staroverov, T. Keith, R. Kobayashi, J. Normand, K. Raghavachari, A. Rendell, J. C. Burant, S. S. Iyengar, J. Tomasi, M. Cossi, J. M. Millam, M. Klene, C. Adamo, R. Cammi, J. W. Ochterski, R. L. Martin, K. Morokuma, O. Farkas, J. B. Foresman and D. J. Fox, Gaussian 09, Revision A.02 Search PubMed.
- A. D. Becke, J. Chem. Phys., 1993, 98, 5648–5652 CrossRef CAS.
- C. Lee, W. Yang and R. G. Parr, Phys. Rev. B: Condens. Matter Mater. Phys., 1988, 37, 785–789 CrossRef CAS.
- M. D. Hanwell, D. E. Curtis, D. C. Lonie, T. Vandermeerschd, E. Zurek and G. R. Hutchison, J. Cheminform., 2012, 4, 17 CrossRef CAS PubMed.
- N. M. O’Boyle, A. L. Tenderholt and K. M. Langner, J. Comput. Chem., 2008, 29, 839–845 CrossRef PubMed.
- A. J. Morris, R. J. Nicholls, C. J. Pickard and J. R. Yates, Comput. Phys. Commun., 2014, 185(5), 1477–1485 CrossRef CAS.
- R. J. Nicholls, A. J. Morris, C. J. Pickard and J. R. Yates, J. Phys.: Conf. Ser., 2012, 371, 012062 CrossRef.
- H. C. Montgomery, J. Appl. Phys., 1971, 42, 2971–2975 CrossRef CAS.
- G. J. Piermarini, S. Block, J. D. Barnett and R. A. Forman, J. Appl. Phys., 1975, 46, 2774–2780 CrossRef CAS.
- K. Yokogawa, K. Murata, H. Yoshino and S. Aoyama, Jpn. J. Appl. Phys., 2007, 46, 3636 CrossRef CAS.
Footnotes |
| † Electronic supplementary information (ESI) available: FTIR; Tauc plots; band structure calculations; (TD)-DFT calculations; NMR spectra, photographs of vapour-deposited films. CCDC 2082135–2082137. For ESI and crystallographic data in CIF or other electronic format see DOI: 10.1039/d1ma00416f |
| ‡ These authors contributed equally. |
| This journal is © The Royal Society of Chemistry 2021 |