 Open Access Article
Assessment of dihydropyrimidinone-based nanocomposites as multifunctional anti-cancer drug†
Thangamani
S.‡
a,
Hema Priya
Mahendran‡
bc,
Rama Ranjan
Bhattacharjee
 d,
Sankarganesh
Jeyaraj
*bc and
Kallol
Mohanta
 *a
*a
aPSG Institute of Advanced Studies, Coimbatore, Tamil Nadu 641004, India. E-mail: kmohanta@gmail.com; kma@psgias.ac.in
bPSG Center for Molecular Medicine and Therapeutics, PSG Institute of Medical Sciences & Research (Affiliated to the Tamil Nadu Dr MGR Medical University), Coimbatore, Tamil Nadu 641004, India. E-mail: sankar.jeyaraj@gmail.com
cPSG Center for Genetics and Molecular Biology, Off Avinashi Road, Coimbatore 641004, India
dAmity Institute of Nanotechnology, Amity University, Kolkata, West Bengal 700135, India
First published on 26th March 2021
Abstract
Dihydropyrimidinones, which are known as Biginelli compounds, have been found to be tumor inhibitors in the last decade. Herein, novel carbon quantum dot–dihydropyrimidinone (CQD–DHPM) nanocomposites were prepared via a simple conjugation process by varying the ratio of DHPM to CQDs. This conjugation endowed fluorescence properties to the medicinal DHPM compound and offered multifunctionality. CQD–DHPM nanocomposites were tested for their anti-cancer activity against the human non-small cell lung cancer A549 cell line. It was found that conjugating CQDs with DHPM improved its anti-cancer activity and reduced its cytotoxicity towards healthy cells. The fluorescence properties of composites also enabled them to serve as bioimaging fluorophores.
Introduction
Efficiently processable dihydropyrimidinones (DHPMs) are well known for their strong pharmacological properties such as antioxidant,1 antimicrobial,2 antitumoral3 and inhibition to HIV-1,4 and lipoxygenase activity.5 They have also proven to demonstrate their ability against HepG2 and HeLa cell lines,6 human polyomavirus (HPyV), and Hsp90 C-terminal inhibitors.7 DHPM compounds specifically inhibit the Eg5 motor spindle protein and restrict the mitotic progression of cells, and hence can be used as anti-cancer drugs.8 Matos et al. reported that DHPM and its derivatives were tested on various cancer cell lines, including lung, breast, prostate, and colorectal cancer.9The half maximal inhibitory concentration (IC50) is a measure of the potency of an inhibitor to inhibit certain biological functions; a lower IC50 value of a drug to inhibit tumor cell-growth is recommended given that it will have less side-effects. Ragab et al. reported that U251 (glioblastoma multiforme) and OVCAR-03 (ovarian cancer) were found to be more sensitive to DHPM derivatives, which affected cell growth at IC50 < 10 μg mL−1.10 Non-small cell lung carcinoma (NSCLC) is a devastating cancer arising in lung epithelial cells. NSCLC accounts for about 85% of lung cancer.11 It usually grows and spreads slowly compared to small cell lung cancer and is considered as the most common lung carcinoma.12 This cancer remains aggressive with increasing incidence and poor survival rate despite current multimodal treatments. NSCLC was modeled on the A549 cell line, which is adenocarcinomic and composed of human alveolar basal epithelial cells. In a previous study, cytotoxicity against the A549 cell line was tested using compounds such as 2-(5-nitrofurfurylidene)-5-(aryl)-7-(2,4-dichloro-5-fluorophenyl)-5H-thiazolo[2,3-b]pyrimidin-3-ones, 2-(5-arylfurfurylidene)-5-(aryl)-(2,4-dichloro-5-fluorophenyl)-5H-thiazolo[2,3-b]pyrimidin-3-ones, and 4-aryl-6-(2,4-dichloro-5-fluorophenyl)-3,4-dihydropyrimidin-2(1H)-thiones, which exhibited a minimum IC50 of 16.5 μM.13
In modern drug innovation, including multifunctionality in a drug is carefully contemplated so that a single composition can address several purposes related to an ailment. One of the key aspects of multifunctional drugs is to track them inside body or in body fluids so that the dosage of the drug and the monitoring of drug to targets can also be optimized. Fluorescent tagging of a drug molecule enables real-time monitoring of the drug inside living systems. Fluorescence properties aid in determining drug–target interactions, drug-tubulin interfacing, and pharmaco-dynamic consequences.14 Thus, considering that DHPM compounds do not possess any fluorescence property,15 luminous hybrid DHPM composites for applications such as drug detection and bioimaging are limited. However, with the advent of nanomaterials, targeting ailing cells and tracking drugs have been getting simpler. Attaching/conjugating a fluorescent nanomaterial to a particular drug molecule to achieve fluorescence properties is a common practice in current research.16
CQDs are the newest class of carbon nanomaterials, which have various advantages such as simple and inexpensive synthesis, tunable properties, and modifiability.17 Furthermore, CQDs have dynamic fluorescence properties, high chemical stability, low cytotoxicity and biocompatibility.18,19 Their biocompatible features combined with their fluorescence properties enable them to efficiently serve as effective fluorophores for bioimaging and probes for drug delivery.20 Wang et al. reported that CQDs modified with zinc oxide and silica-based materials have biological applications due to their fluorescence properties.21 Prasad et al. demonstrated the significant anti-cancer property of CQDs made from small organic molecules against a breast cancer cell line.22 However, reports on the integration of CQDs with pharmacological molecules were rare until Qu et al. synthesized CQD–TPEA.23 This nanocomposite was prepared by attaching TPEA (N-(2-aminoethyl)-N,N,N-tris(pyridin-2-ylmethyl)ethane-1,2-diamine) to water-soluble CQD particles. The TPEA–CQD composite showed low cytotoxicity and was used for intercellular sensing and bio-tagging of Cu2+.23
The aim of this study was to prepare a hybrid fluorescent monastrol composite based on the combination of DHPM and CQD, i.e., CQD–DHPM, to evaluate its anti-cancer property in the A549 cell line and determine its bioimaging capability. The surface of CQDs contains suitable functional groups (polystyrene sulphonate) as a capping agent so that the optical properties of the CQDs and the therapeutic performance of DHPM can be retained in the new conjugation. The pharmacological agent, CQD–DHPM nanocomposite, developed in this study was evaluated to estimate its anti-cancer activity against the A549 cell line. Accordingly, we evaluated the effect of our novel CQD–DHPM nanocomposites at different ratios in combination and as individuals against the A549 cell line as a model for NSCLC. It was found that the nanocomposite increased the reactivity of the DHPM compound (without subgroup) and lowered its cytotoxicity towards healthy cells.
Experimental section
Materials
Benzyl alcohol, hydrogen peroxide, ethyl acetoacetate, urea and citric acid (CA) were purchased from LOBA Chemie and used as received without further purification. Jeffamine® was obtained as a gift sample from Huntsman India Ltd. Phosphotungstic acid (PTA) and poly(sodium 4-styrene sulfonate) (PSS) were purchased from Fluka and Sigma-Aldrich, respectively, and used as received. The standards and the reaction mixtures were spotted on TLC Silica Gel 60 F254 purchased from Merck Chemicals. Milli-Q water was used in all procedures.Peripheral blood mononuclear cells (PBMCs) from healthy controls, human non-small cell lung cancer cells, and the A549 cell line for pharmacological tests were used with proper ethical guidelines from Institutional Human Ethics Committee, PSG Institute of Medical Sciences and Research, Coimbatore.
Synthesis of dihydropyrimidinone and carbon quantum dots
Dihydropyrimidinone was prepared by Biginelli reaction. Dihydropyrimidinone was synthesized according to the route described elsewhere.24 Carbon quantum dots were prepared according to our previous report.17 The detailed procedures for the synthesis of dihydropyrimidinone and CQDs are presented in the ESI.†Preparation of CQD–DHPM nanocomposites
The preparation of the CQD–DHPM nanocomposites with different proportions of CQD to DHPM was carried as follows: 10 mg of CQDs in 10 mL of water was stirred to obtain a CQD dispersion, and 10, 20, 30 and 40 mg of DHPM were completely dissolved in 10 mL ethanol each (for 1![[thin space (1/6-em)]](https://www.rsc.org/images/entities/char_2009.gif) :
:![[thin space (1/6-em)]](https://www.rsc.org/images/entities/char_2009.gif) 1, 1
1, 1![[thin space (1/6-em)]](https://www.rsc.org/images/entities/char_2009.gif) :
:![[thin space (1/6-em)]](https://www.rsc.org/images/entities/char_2009.gif) 2, 1
2, 1![[thin space (1/6-em)]](https://www.rsc.org/images/entities/char_2009.gif) :
:![[thin space (1/6-em)]](https://www.rsc.org/images/entities/char_2009.gif) 3 and 1
3 and 1![[thin space (1/6-em)]](https://www.rsc.org/images/entities/char_2009.gif) :
:![[thin space (1/6-em)]](https://www.rsc.org/images/entities/char_2009.gif) 4 ratio, respectively) and stirred continuously. Then the DHPM solution was added dropwise to the CQD solution with continuous stirring. The immediate sample of CQD–DHPM was taken for analysis. Samples were collected at regular intervals of 15 min up to 90 min. The solution was initially characterized by fluorescence microscopy. The formation of the nanocomposites was confirmed by optical, compositional, thermal and morphological analysis.
4 ratio, respectively) and stirred continuously. Then the DHPM solution was added dropwise to the CQD solution with continuous stirring. The immediate sample of CQD–DHPM was taken for analysis. Samples were collected at regular intervals of 15 min up to 90 min. The solution was initially characterized by fluorescence microscopy. The formation of the nanocomposites was confirmed by optical, compositional, thermal and morphological analysis.
Characterization tools
Ultraviolet-visible absorption (UV-vis) spectra were recorded using a Shimadzu UV-1800 spectrophotometer in the wavelength range of 200–800 nm in a 3 mm path-length cuvette with a concentration of 1 mg mL−1 in DI water for all the samples. Fourier Transformed infra-red absorption (FT-IR) spectra were recorded using a Shimadzu IR Affinity Series 1S in the range of 4500–600 cm−1 and nuclear magnetic resonance (NMR) spectra were recorded using a Bruker BioSpin GmbH. Thermogravimetric analysis measurements were carried out using a NETSCH STA 449F3 Jupiter thermal analyzer under a nitrogen atmosphere. Fluorescence emission and excitation spectra were recorded using a Shimadzu RF-5301PC spectrofluorophotometer with 1 mg mL−1 concentration of sample in aqueous medium. The fluorescence microscopic studies were carried out using a Nikon Upright Microscope Eclipse Ni-U. The samples were analyzed under different excitation wavelengths in the blue (Ex: 330–380 nm), green (Ex: 450–490 nm) and red (Ex: 510–560 nm) regions. High-resolution transmission electron microscopy (HR-TEM) analysis was performed for nanoparticle measurement using a JEOL JEM 2100.Cell culture
A549 cells were grown in complete DMEM, at an optimum temperature of 37 °C with 5% CO2. The culture medium was supplemented with 10% fetal bovine serum (FBS), 1% L-glutamine, and 1% antibiotic–antimycotic solution. The cells were grown aseptically in tissue culture flasks (T 25 cm2). Fresh PBMCs were also included to determine whether the compounds displayed any toxicity towards normal cells. The PBMCs were isolated by density gradient centrifugation using the Ficoll-Paque overlay method and grown aseptically in tissue culture flasks (T 752) using medium comprised of RPMI-1640, 10% heat-inactivated filtered fetal bovine serum (FBS), and 1% streptomycin and penicillin solution. The cultures were incubated in a humidified 5% CO2 incubator at 37 °C.Cytotoxicity assay
The investigation of the in vitro cytotoxicity of the CQD–DHPM nanocomposites using the MTT assay was carried out in 96-well, flat bottomed microtiter plates. A volume of 200 μL complete culture medium containing 5 × 10³ cells was seeded in each well on the first day of the experiment and incubated for 24 h for the cells to attach to the wells. The following day, the old medium was replaced with fresh medium containing different concentrations (μM) (25, 50, 100, 200, 300, 400 and 500) of the drug and incubated at an optimum temperature of 37 °C with 5% CO2 for 24 h. To determine the cytotoxicity, 10–15 μL of 5 mg mL−1 3-(4,5-dimethylthiazol-2-yl)-2,5-diphenylterazolium bromide (MTT) was added followed by incubating the plates for 3 h at 37 °C in the dark. After 3 h, the medium was aspirated and 100 μL of DMSO was added to each well and the absorbance was read at 590 nm using a Varioskan Flash multimode microtiter plate reader. The IC50 values were determined by non-linear regression analysis. To determine the in vitro cytotoxicity of DHPM on freshly isolated PBMCs from healthy blood donors, around 1 × 10⁵ cells were seeded per well and incubated with different concentrations (μM) (25, 50, 100, 200, 300, 400 and 500) of the compound at 37 °C with 5% CO2 for 72 h to determine the maximum cytotoxic effect. After incubation, the MTT assay was performed, and the absorbance was read at 590 nm. The mean percentage of the post-treatment viable cells was calculated using the following formulae.| % Cytotoxicity = 100 − % Cell viability |
Fluorescence microscopy
Cells from flasks were harvested by trypsinization and 0.5 × 10⁴ cells were seeded on a sterile 8-well chamber slide overnight at 37 °C for fluorescence microscopy. The next day, the cells were treated with drug compounds (CQDs and CQD–DHPM nanocomposites) at the IC50 concentration and incubated at 37 °C for 24 h. After incubation, the medium was aspirated, and the attached cells were washed twice with PBS. The chamber walls were then carefully removed with forceps and the cells were then covered with a cover slip and directly viewed under a fluorescent microscope (using UV light). Images were taken after mounting the slide with a cover slip and mounting medium.Results and discussion
In a previous study, the dihydropyrimidinone molecule was evaluated for its antitumor activity against the A549 cell line and its half maximal inhibitory concentration, i.e., IC50 value, was determined to be 202.6 μM.24 Although DHPM has commendable biological activities, it lacks fluorescence properties, which restricts its application in bioimaging. Fluorophores for the DHPM molecule are not readily available or existing materials are unsuitable as fluorophores with the DHPM molecule given that they may alter the pharmacological activity of this drug molecule. To date, mostly coumarin-based materials have been used as efficient fluorophores due to their benign nature, although coumarin has its own limitations such as photo bleaching and photo damaging of the embodying tissues due to its low excitation and emission wavelengths.25 The recently developed carbon quantum dots (CQDs) possess interesting fluorescence properties. They have a wide range of excitation-dependent emissions and are also non-cytotoxic.26 Carbon quantum dots are relatively inactive and can be functionalized according to the requirements. These advantages make carbon quantum dots promising alternatives to coumarin as a fluorophore.The CQD–DHPM nanocomposite was analyzed by high-resolution transmission electron microscopy (HR-TEM) to study its size distribution and lattice properties. Fig. 1a and b show CQDs and CQD–DHPM (ratio 1![[thin space (1/6-em)]](https://www.rsc.org/images/entities/char_2009.gif) :
:![[thin space (1/6-em)]](https://www.rsc.org/images/entities/char_2009.gif) 2) and their magnified version, respectively. It can be seen from Fig. 1a that the individual CQD particles have mostly oblong shapes with a size of 5 ± 2 nm. Conversely, the CQD–DHPM particles were observed as a cloudy agglomeration of organic molecules with sparse tints of firm structures, as shown in Fig. 1b. Due to the presence of strong interatomic interactions, the molecules did not show a defined structure. The deep black points within this cloudy formation could be the CQDs/CQD clusters, which are attached with the DHPM molecules. The size of these formations is about 200 nm, which is much bigger than the single CQDs (∼5 nm) and reveals the structure of the conjugate. The atomic force microscopy morphology study of CQD–DHPM (ratio 1
2) and their magnified version, respectively. It can be seen from Fig. 1a that the individual CQD particles have mostly oblong shapes with a size of 5 ± 2 nm. Conversely, the CQD–DHPM particles were observed as a cloudy agglomeration of organic molecules with sparse tints of firm structures, as shown in Fig. 1b. Due to the presence of strong interatomic interactions, the molecules did not show a defined structure. The deep black points within this cloudy formation could be the CQDs/CQD clusters, which are attached with the DHPM molecules. The size of these formations is about 200 nm, which is much bigger than the single CQDs (∼5 nm) and reveals the structure of the conjugate. The atomic force microscopy morphology study of CQD–DHPM (ratio 1![[thin space (1/6-em)]](https://www.rsc.org/images/entities/char_2009.gif) :
:![[thin space (1/6-em)]](https://www.rsc.org/images/entities/char_2009.gif) 2) also supports the transmission electron microscopy observations. Fig. S1a and b (ESI†) show the topographies of CQD–DHPM particles scattered on a glass substrate at different magnifications. The AFM images show the presence of ∼0.2 μm particles, which represent the CQD–DHPM particle and >10 nm CQDs can be observed in the background.
2) also supports the transmission electron microscopy observations. Fig. S1a and b (ESI†) show the topographies of CQD–DHPM particles scattered on a glass substrate at different magnifications. The AFM images show the presence of ∼0.2 μm particles, which represent the CQD–DHPM particle and >10 nm CQDs can be observed in the background.
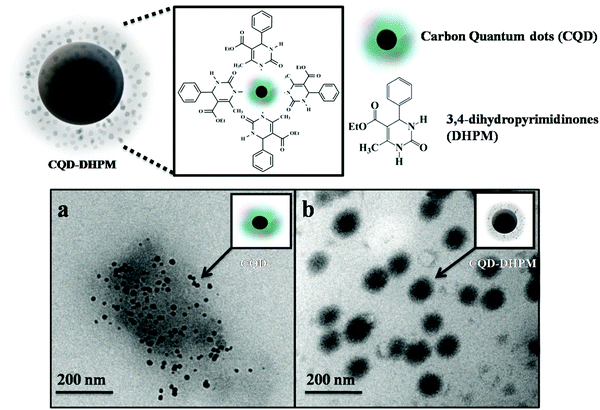 | ||
Fig. 1 HR-TEM analysis of (a) pure CQDs and (b) CQD–DHPM nanocomposite with a CQD![[thin space (1/6-em)]](https://www.rsc.org/images/entities/char_2009.gif) : :![[thin space (1/6-em)]](https://www.rsc.org/images/entities/char_2009.gif) DHPM ratio of 1 DHPM ratio of 1![[thin space (1/6-em)]](https://www.rsc.org/images/entities/char_2009.gif) : :![[thin space (1/6-em)]](https://www.rsc.org/images/entities/char_2009.gif) 2. 2. | ||
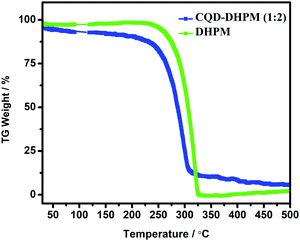
The thermogravimetric analysis (TGA) of the pure DHPM and CQD–DHPM (1![[thin space (1/6-em)]](https://www.rsc.org/images/entities/char_2009.gif) :
:![[thin space (1/6-em)]](https://www.rsc.org/images/entities/char_2009.gif) 2 ratio) in a nitrogen atmosphere was carried out to confirm the conjugation of the DHPM molecules with CQDs, and the results are shown in Fig. 2. The TGA thermogram (Fig. 2) shows that the complete decomposition of DHPM occurs at 300 °C, as evidenced from the endothermic heat exchange in the DSC curve (not shown here). However, for CQD–DHPM, its decomposition occurs at a lower temperature. This suggests the conjugation between the inorganic CQDs and the organic DHPM, which triggers the decomposition of the organic part at a lower temperature by lowering the bond strength. It can be seen that there was a gradual weight loss even before that, which may be due to the slow burning of the surface-functionalization material (PSS) of CQDs.26 The decomposition was incomplete given that ∼15% of the sample was retained, which decayed slowly. This should be the inorganic part, which has a robust C–C structure.26 However, it should be noted that the phase transition temperature of the DHPM molecules did not change although the conjugation with CQDs strongly altered the thermodynamic properties of the DHPM molecules.
2 ratio) in a nitrogen atmosphere was carried out to confirm the conjugation of the DHPM molecules with CQDs, and the results are shown in Fig. 2. The TGA thermogram (Fig. 2) shows that the complete decomposition of DHPM occurs at 300 °C, as evidenced from the endothermic heat exchange in the DSC curve (not shown here). However, for CQD–DHPM, its decomposition occurs at a lower temperature. This suggests the conjugation between the inorganic CQDs and the organic DHPM, which triggers the decomposition of the organic part at a lower temperature by lowering the bond strength. It can be seen that there was a gradual weight loss even before that, which may be due to the slow burning of the surface-functionalization material (PSS) of CQDs.26 The decomposition was incomplete given that ∼15% of the sample was retained, which decayed slowly. This should be the inorganic part, which has a robust C–C structure.26 However, it should be noted that the phase transition temperature of the DHPM molecules did not change although the conjugation with CQDs strongly altered the thermodynamic properties of the DHPM molecules.
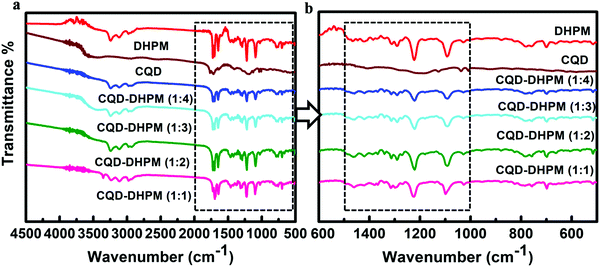
The conjugation between the DHPM molecules and CQDs was evidenced from the FTIR spectral analysis of the DHPM and CQD–DHPM samples. The detailed results are presented in the ESI.†Fig. 3 shows the FTIR spectra of the samples and the corresponding Tables S1–S6 (ESI†) indicate the presence of O–H stretching (broad, ∼3400 cm−1), N–H stretching (broad, 3200 cm−1), C![[double bond, length as m-dash]](https://www.rsc.org/images/entities/char_e001.gif) O stretching (1750 cm−1), C–N stretch (∼1400 cm−1), C–O–C stretching (1226, 1296 cm−1) and C–N–C in amines (1050 cm−1). For the nanocomposites, the presence of O–H stretching and systematic shift of the C–N stretching towards a lower wavenumber are noticeable, which confirm the conjugation of CQDs and DHPM molecules and indicate the probable formation of C–N bonds between the two components of the composites.
O stretching (1750 cm−1), C–N stretch (∼1400 cm−1), C–O–C stretching (1226, 1296 cm−1) and C–N–C in amines (1050 cm−1). For the nanocomposites, the presence of O–H stretching and systematic shift of the C–N stretching towards a lower wavenumber are noticeable, which confirm the conjugation of CQDs and DHPM molecules and indicate the probable formation of C–N bonds between the two components of the composites.
The pure DHPM and CQD–DHPM nanocomposites were also analyzed via1H NMR and the detailed spectral analysis of the samples is presented in the ESI† (Fig. S2–S4 and Tables S7–S11). The NMR spectra and the corresponding chemical shifts of the 1![[thin space (1/6-em)]](https://www.rsc.org/images/entities/char_2009.gif) :
:![[thin space (1/6-em)]](https://www.rsc.org/images/entities/char_2009.gif) 2 ratio CQD–DHPM are shown in Fig. 4 and Table 1. The pure DHPM molecules exhibited NMR signals at 8.17 ppm and 7.26 ppm (m, 3H), corresponding to an aromatic and confirming the pyrimidine aldehyde, respectively. The two hydroamide signals were observed at 5.39 ppm and 5.86 ppm. The presence of a peak at 3.7 ppm (s, 6H, 2CH3) corresponded to the dimethylamino moiety. The peak at 2.3 ppm (s, 3H) shows the presence of an isolated methyl group and confirms the formation of DHPM. When the DHPM molecule was conjugated with CQDs, the NMR spectrum exhibited slight variations in peak positions, as shown in Fig. 4. The CQD–DHPM nanocomposites were observed to have a peak at 2.2 ppm (m, 2H) for the methyl on the linear chain, whereas the peaks from 3.00 ppm to 4.00 ppm are attributed to the isolated methyl group. The presence of a peak at 5.14 ppm indicates the dimethylamino group. The aromatic protons in the composite were confirmed from the peak at 7.24 ppm (m, 3H). It should be noted that signals appeared at around 9 ppm to 7.32 ppm, which indicate a singlet consisting of a single H-proton.
2 ratio CQD–DHPM are shown in Fig. 4 and Table 1. The pure DHPM molecules exhibited NMR signals at 8.17 ppm and 7.26 ppm (m, 3H), corresponding to an aromatic and confirming the pyrimidine aldehyde, respectively. The two hydroamide signals were observed at 5.39 ppm and 5.86 ppm. The presence of a peak at 3.7 ppm (s, 6H, 2CH3) corresponded to the dimethylamino moiety. The peak at 2.3 ppm (s, 3H) shows the presence of an isolated methyl group and confirms the formation of DHPM. When the DHPM molecule was conjugated with CQDs, the NMR spectrum exhibited slight variations in peak positions, as shown in Fig. 4. The CQD–DHPM nanocomposites were observed to have a peak at 2.2 ppm (m, 2H) for the methyl on the linear chain, whereas the peaks from 3.00 ppm to 4.00 ppm are attributed to the isolated methyl group. The presence of a peak at 5.14 ppm indicates the dimethylamino group. The aromatic protons in the composite were confirmed from the peak at 7.24 ppm (m, 3H). It should be noted that signals appeared at around 9 ppm to 7.32 ppm, which indicate a singlet consisting of a single H-proton.
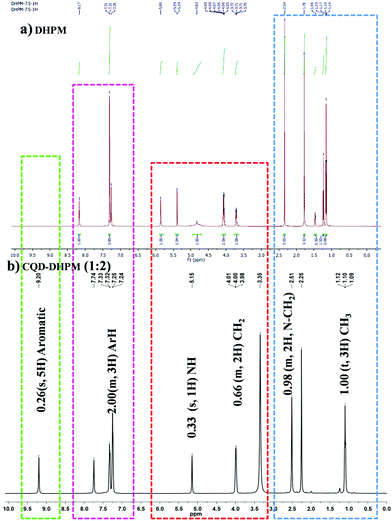 | ||
Fig. 4
1H NMR analysis of (a) pure DHPM and (b) CQD–DHPM nanocomposite with a CQD![[thin space (1/6-em)]](https://www.rsc.org/images/entities/char_2009.gif) : :![[thin space (1/6-em)]](https://www.rsc.org/images/entities/char_2009.gif) DHPM ratio of 1 DHPM ratio of 1![[thin space (1/6-em)]](https://www.rsc.org/images/entities/char_2009.gif) : :![[thin space (1/6-em)]](https://www.rsc.org/images/entities/char_2009.gif) 2. 2. | ||
![[thin space (1/6-em)]](https://www.rsc.org/images/entities/char_2009.gif) :
:![[thin space (1/6-em)]](https://www.rsc.org/images/entities/char_2009.gif) 2 ratio)
2 ratio)
| S. no. | DHPM peak (ppm) | Chemical shift (J) | CQD–DHPM (1![[thin space (1/6-em)]](https://www.rsc.org/images/entities/char_2009.gif) : :![[thin space (1/6-em)]](https://www.rsc.org/images/entities/char_2009.gif) 2) (ppm) 2) (ppm) |
Chemical shift (J) |
|---|---|---|---|---|
| 1 | 1.14–1.17 | 3.08 (t, 3H) CH3 | 1.09–1.12 | 1.00 (t, 3H) CH3 |
| 2 | 1.23 | 1.55 (m, 6H) | 2.25–2.51 | 0.98 (m, 2H, N–CH2) |
| 3 | 1.46 | 0.59 (s, 3H) CH3 | 3.35–4.01 | 0.66 (m, 2H) CH2 |
| 4 | 1.78 | 3.32 m, 2H, CH2 | 5.14 | 0.33 (s, 1H) NH |
| 5 | 2.34 | 3.05 (s, 3H) CH3 | 7.24–7.74 | 2.00(m, 3H) ArH |
| 6 | 3.70–3.72 | 1.08 (m, 2H, N–CH2) | 9.20 | 0.26 (s, 5H) aromatic |
| 7 | 4.05–4.08 | 2.09 (m, 2H) CH2 ethyl | — | — |
| 8 | 4.83 | 1.00 (m, 1H, C4–H) | — | — |
| 9 | 5.39 | 1.05 (s, 1H) NH | — | — |
| 10 | 5.86 | 1.04 (s, 1H) NH | — | — |
| 11 | 7.26–7.31 | 3.89 (m, 3H) ArH | — | — |
| 12 | 8.17 | 1.00 (s, 5H) Aromatic | — | — |
According to the above discussion, it is clear that DHPM and CQDs were conjugated. Several research groups previously reported that carbon nanomaterials including CQDs possess oxygen-containing functional groups on their surface and they can be conjugated with groups such as amines.15,27 However, in our case, the conjugation may have happened via the formation of covalent bonds between the amine groups of DHPM with the surface-functionalized group on CQDs. Therefore, we were interested to see whether this conjugation altered the optical properties of CQDs. It is essential that CQDs retain their fluorescence characteristics even within the nanocomposites so that they can be used as an efficient fluorophore. Accordingly, the prepared nanocomposite samples were analyzed via UV-Vis spectroscopy, fluorescence spectroscopy and fluorescence microscopy.
A prominent absorption peak at 284 nm was observed for 3,4-dihydropyrimidinones (DHPM) together with a small hump at around 221 nm (Fig. S5, ESI†). Both the absorption peak and hump for DHPM appeared as a result of the n → π* transition of C![[double bond, length as m-dash]](https://www.rsc.org/images/entities/char_e001.gif) O and the presence of an N atom in the benzene ring of DHPM strengthened the peak at 284 nm. Conversely, CQDs exhibited an absorption peak at 223 nm (Fig. S5 and Table S12, ESI†). This absorption peak arises from the π → π* transition of the C
O and the presence of an N atom in the benzene ring of DHPM strengthened the peak at 284 nm. Conversely, CQDs exhibited an absorption peak at 223 nm (Fig. S5 and Table S12, ESI†). This absorption peak arises from the π → π* transition of the C![[double bond, length as m-dash]](https://www.rsc.org/images/entities/char_e001.gif) C bond present in CQDs. When DHPM was conjugated with CQDs, the peak at 284 nm peak was slightly red shifted (∼2/3 nm) in the CQD–DHPM nanocomposites. This small shift may be attributed to the strain in the heteroatom ring of the DHPM molecules in the composite. These variations are due to the strain in the heteroatom ring caused by the addition of functional chains to the ring and quantum dots.
C bond present in CQDs. When DHPM was conjugated with CQDs, the peak at 284 nm peak was slightly red shifted (∼2/3 nm) in the CQD–DHPM nanocomposites. This small shift may be attributed to the strain in the heteroatom ring of the DHPM molecules in the composite. These variations are due to the strain in the heteroatom ring caused by the addition of functional chains to the ring and quantum dots.
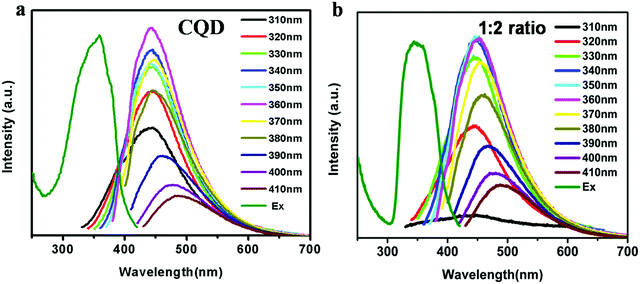
The emission spectra of the aqueous CQD suspension were recorded at various excitation wavelengths. It can be seen in Fig. 5 that with an increase in the excitation wavelength from 310 nm to 410 nm, the emission peak slowly shifted from 440 nm to 490 nm with varying intensities. However, the strongest emission peak of CQDs appeared at 442 nm for the excitation wavelength of 360 nm. These results are compatible with our previous reports.15 The emission spectra of different CQD–DHPM nanocomposites in aqueous suspension are shown in Fig. 5. These spectra are similar to that of CQDs only. This evidence demonstrated that the optical properties of CQDs remained almost unaltered in the nanocomposites given that DHPM has no fluorescence property. The only difference observed for the CQD–DHPM nanocomposites was the change in the strongest emission peak position and the excitation wavelength for the highest emission peak. For the different CQD–DHPM composites, both peaks were red shifted by 10 nm. The excitation-dependent emission feature of CQDs enables the use of the nanocomposites for multicolor labeling of cells via fluorescence imaging.
The crystals of dihydropyrimidinones and the nanocomposites were visible under a microscope. Interestingly, the fluorescence microscopy images of the CQD–DHPM nanocomposites had different fluorescent structures when the proportion of dihydropyrimidinones to CQD was varied. Fig. 6 shows the different structures of the CQD–DHPM conjugates with a CQD![[thin space (1/6-em)]](https://www.rsc.org/images/entities/char_2009.gif) :
:![[thin space (1/6-em)]](https://www.rsc.org/images/entities/char_2009.gif) DHPM ratio of 1
DHPM ratio of 1![[thin space (1/6-em)]](https://www.rsc.org/images/entities/char_2009.gif) :
:![[thin space (1/6-em)]](https://www.rsc.org/images/entities/char_2009.gif) 1, 1
1, 1![[thin space (1/6-em)]](https://www.rsc.org/images/entities/char_2009.gif) :
:![[thin space (1/6-em)]](https://www.rsc.org/images/entities/char_2009.gif) 2, 1
2, 1![[thin space (1/6-em)]](https://www.rsc.org/images/entities/char_2009.gif) :
:![[thin space (1/6-em)]](https://www.rsc.org/images/entities/char_2009.gif) 3 and 1
3 and 1![[thin space (1/6-em)]](https://www.rsc.org/images/entities/char_2009.gif) :
:![[thin space (1/6-em)]](https://www.rsc.org/images/entities/char_2009.gif) 4, respectively. Although the exact reason for the formation of these different structures has not been explored, probably with an increase in the content of DHPM molecules, the availability of growth sites on the surface of CQDs guided the directionality of crystal formation in different shapes. Thus, the formation of the nanocomposites and their structural properties were confirmed by the above characterization techniques.
4, respectively. Although the exact reason for the formation of these different structures has not been explored, probably with an increase in the content of DHPM molecules, the availability of growth sites on the surface of CQDs guided the directionality of crystal formation in different shapes. Thus, the formation of the nanocomposites and their structural properties were confirmed by the above characterization techniques.
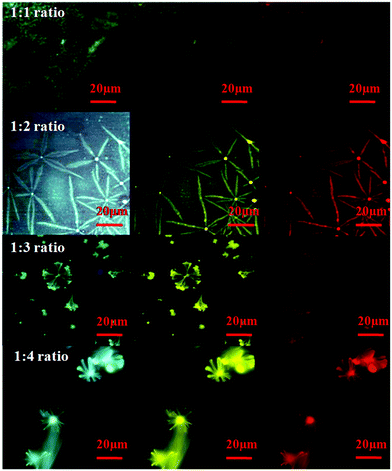 | ||
Fig. 6 Fluorescence microscopy images of CQD–DHPM nanocomposites with CQD![[thin space (1/6-em)]](https://www.rsc.org/images/entities/char_2009.gif) : :![[thin space (1/6-em)]](https://www.rsc.org/images/entities/char_2009.gif) DHPM ratios of 1 DHPM ratios of 1![[thin space (1/6-em)]](https://www.rsc.org/images/entities/char_2009.gif) : :![[thin space (1/6-em)]](https://www.rsc.org/images/entities/char_2009.gif) 1, 1 1, 1![[thin space (1/6-em)]](https://www.rsc.org/images/entities/char_2009.gif) : :![[thin space (1/6-em)]](https://www.rsc.org/images/entities/char_2009.gif) 2, 1 2, 1![[thin space (1/6-em)]](https://www.rsc.org/images/entities/char_2009.gif) : :![[thin space (1/6-em)]](https://www.rsc.org/images/entities/char_2009.gif) 3, and 1 3, and 1![[thin space (1/6-em)]](https://www.rsc.org/images/entities/char_2009.gif) : :![[thin space (1/6-em)]](https://www.rsc.org/images/entities/char_2009.gif) 4 under a blue, green and red filter. 4 under a blue, green and red filter. | ||
In recent years, the interest in dihydropyrimidinones and their analogues as anti-cancer drugs has significantly increased. In contrast to other anti-cancer drugs, which perturb mitosis by binding to the protein tubulin-like natural taxanes, vinca alkaloids and epothilones, monastrols (DHPM derivatives) specifically affect cell division by a new mechanism. Kinesin Eg5, a spindle motor protein, is an attractive therapeutic target to prevent cell cycles by mitosis. Monastrol drugs inhibit kinesin Eg5 to form bipolar spindles by polar migration of centrosomes, resulting in the formation of monoastral spindles, and thus restricting mitosis.8,28,29 For decades, several researchers synthesized DHPM with modifications in its structure to enhance its activity against microbial pathogens and cancer cells of interest.
In this study, we used DHPM (dihydropyrimidinones) alone, CQDs alone and CQD–DHPM (carbon quantum dot–DHPM) nanocomposites with four different CQD![[thin space (1/6-em)]](https://www.rsc.org/images/entities/char_2009.gif) :
:![[thin space (1/6-em)]](https://www.rsc.org/images/entities/char_2009.gif) DHPM ratios of 1
DHPM ratios of 1![[thin space (1/6-em)]](https://www.rsc.org/images/entities/char_2009.gif) :
:![[thin space (1/6-em)]](https://www.rsc.org/images/entities/char_2009.gif) 1, 1
1, 1![[thin space (1/6-em)]](https://www.rsc.org/images/entities/char_2009.gif) :
:![[thin space (1/6-em)]](https://www.rsc.org/images/entities/char_2009.gif) 2, 1
2, 1![[thin space (1/6-em)]](https://www.rsc.org/images/entities/char_2009.gif) :
:![[thin space (1/6-em)]](https://www.rsc.org/images/entities/char_2009.gif) 3, and 1
3, and 1![[thin space (1/6-em)]](https://www.rsc.org/images/entities/char_2009.gif) :
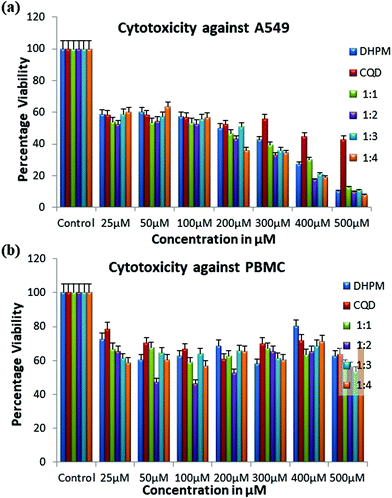
:![[thin space (1/6-em)]](https://www.rsc.org/images/entities/char_2009.gif) 4 to evaluate their cytotoxic activity against the A549 cell line. Analyzing the percentage viability and percentage growth inhibition for the DHPM compounds, we observed a dose-dependent cytotoxicity for all the drugs against the A549 cell line. The percentage viability decreased proportionally with an increase in the drug concentration, as shown in Fig. 7a. After 24 h of treatment, the viability of the A549 cells was reduced to a greater extent at higher concentrations (i.e., above 200 μM) while using the CQD–DHPM nanocomposites (1
4 to evaluate their cytotoxic activity against the A549 cell line. Analyzing the percentage viability and percentage growth inhibition for the DHPM compounds, we observed a dose-dependent cytotoxicity for all the drugs against the A549 cell line. The percentage viability decreased proportionally with an increase in the drug concentration, as shown in Fig. 7a. After 24 h of treatment, the viability of the A549 cells was reduced to a greater extent at higher concentrations (i.e., above 200 μM) while using the CQD–DHPM nanocomposites (1![[thin space (1/6-em)]](https://www.rsc.org/images/entities/char_2009.gif) :
:![[thin space (1/6-em)]](https://www.rsc.org/images/entities/char_2009.gif) 1, 1
1, 1![[thin space (1/6-em)]](https://www.rsc.org/images/entities/char_2009.gif) :
:![[thin space (1/6-em)]](https://www.rsc.org/images/entities/char_2009.gif) 2, 1
2, 1![[thin space (1/6-em)]](https://www.rsc.org/images/entities/char_2009.gif) :
:![[thin space (1/6-em)]](https://www.rsc.org/images/entities/char_2009.gif) 3, and 1
3, and 1![[thin space (1/6-em)]](https://www.rsc.org/images/entities/char_2009.gif) :
:![[thin space (1/6-em)]](https://www.rsc.org/images/entities/char_2009.gif) 4). To establish the optimal treatment concentration for DHPM and its composites, the IC50 values were calculated and compared, as shown in Table 2. The half maximal inhibitory concentration of the DHPM compounds against A549 cells was calculated, with an R2 value of 0.99.
4). To establish the optimal treatment concentration for DHPM and its composites, the IC50 values were calculated and compared, as shown in Table 2. The half maximal inhibitory concentration of the DHPM compounds against A549 cells was calculated, with an R2 value of 0.99.
| S. no. | DHPM composites | Cytotoxicity (IC50 in μM) |
|---|---|---|
| 1 | DHPM (dihydropyrimidinones) | 202.6 |
| 2 | CQD (carbon quantum dots) | >350 |
| 3 | CQD–DHPM nanocomposite (1![[thin space (1/6-em)]](https://www.rsc.org/images/entities/char_2009.gif) : :![[thin space (1/6-em)]](https://www.rsc.org/images/entities/char_2009.gif) 1) 1) |
160.4 |
| 4 | CQD–DHPM nanocomposite (1![[thin space (1/6-em)]](https://www.rsc.org/images/entities/char_2009.gif) : :![[thin space (1/6-em)]](https://www.rsc.org/images/entities/char_2009.gif) 2) 2) |
128.5 |
| 5 | CQD–DHPM nanocomposite (1![[thin space (1/6-em)]](https://www.rsc.org/images/entities/char_2009.gif) : :![[thin space (1/6-em)]](https://www.rsc.org/images/entities/char_2009.gif) 3) 3) |
232.5 |
| 6 | CQD–DHPM nanocomposite (1![[thin space (1/6-em)]](https://www.rsc.org/images/entities/char_2009.gif) : :![[thin space (1/6-em)]](https://www.rsc.org/images/entities/char_2009.gif) 4) 4) |
181.6 |
We used healthy PBMCs to evaluate the cytotoxicity of the compounds against healthy host cells. There are earlier reports of anti-tumor monastrols where the cytotoxicity studies to normal cells were not reported.30 The toxicity of our synthesized DHPM compounds against normal cells (PBMCs) remained low even at the half maximal inhibitory concentration (<20%), as shown in Fig. 7b. In the research work published by Venugopal et al., the DHPM derivatives exhibited up to 20% growth inhibition at 50 μg mL−1, i.e., ∼50 mM.31 The lithium-acetate-mediated Biginelli compounds required more than 100 μM to exert 50% cytotoxic activity against the A549 cell line. In the current study, the viability of PBMCs was found to remain greater than 60% even after 72 h of CQD–DHPM treatment, as shown in Fig. 7b (note that the maximum concentration used for all the drugs was 500 μM). We confirmed that the CQD–DHPM analogues are non-toxic to PBMCs by comparing their activity to that with A549 cells (Table 3). The percentage growth inhibition of the drugs against both the A549 cell line and PBMCs was compared at a concentration of 100 μM, as shown in Table 3. The higher percentage of growth inhibition of cancer cells at lower dosages and much shorter incubation time compared to the normal cells proved that the drugs exhibit inhibition specificity towards A549 cancer cells.
| S. no. | DHPM composites | Percentage (%) of growth inhibition | |
|---|---|---|---|
| A549 (24 h) | PBMCs (72 h) | ||
| 1 | DHPM (dihydropyrimidinones) | 42.6 | 26.42 |
| 2 | CQD (carbon quantum dots) | 43.4 | 19.17 |
| 3 | CQD–DHPM nanocomposite (1![[thin space (1/6-em)]](https://www.rsc.org/images/entities/char_2009.gif) : :![[thin space (1/6-em)]](https://www.rsc.org/images/entities/char_2009.gif) 1) 1) |
46.5 | 32.79 |
| 4 | CQD–DHPM nanocomposite (1![[thin space (1/6-em)]](https://www.rsc.org/images/entities/char_2009.gif) : :![[thin space (1/6-em)]](https://www.rsc.org/images/entities/char_2009.gif) 2) 2) |
47.5 | 20.94 |
| 5 | CQD–DHPM nanocomposite (1![[thin space (1/6-em)]](https://www.rsc.org/images/entities/char_2009.gif) : :![[thin space (1/6-em)]](https://www.rsc.org/images/entities/char_2009.gif) 3) 3) |
44.3 | 35.9 |
| 6 | CQD–DHPM nano composite (1![[thin space (1/6-em)]](https://www.rsc.org/images/entities/char_2009.gif) : :![[thin space (1/6-em)]](https://www.rsc.org/images/entities/char_2009.gif) 4) 4) |
43.4 | 43.13 |
Comparing the DHPM derivatives treated against the breast cancer cell line model by Guido et al. using the MCF7 and MDA-MB-231 cell lines,30 the novel synthesized DHPM molecule and CQD–DHPM nanocomposites in our study were proven to show a significant decrease in cell viability gradually at all concentrations. The CQD–DHPM nanocomposites (1![[thin space (1/6-em)]](https://www.rsc.org/images/entities/char_2009.gif) :
:![[thin space (1/6-em)]](https://www.rsc.org/images/entities/char_2009.gif) 2) had the lowest half maximal inhibitory concentration compared to other combinations. This behavior may be attributed to the number of accessible DHPM molecules in the combination together with the structural advantages of the CQDs. However, CQDs alone also showed inhibitory activity at higher concentrations against A549 cells.22 In the research work published by Guido et al., DHPM and its derivatives were used at concentrations of up to 1 mM.6,30 The DHPM derivatives exhibited over 80% cell growth inhibition with IC50 of around 6 to 35 μM.31 It has been previously shown that monastrol mimic Biginelli DHPM derivatives exhibit cytotoxicity against HepG2 with half maximal inhibitory concentration of 120.62 μg mL−1 and weak toxicity towards HeLa cell lines with IC50 of 200 μg mL−1.6
2) had the lowest half maximal inhibitory concentration compared to other combinations. This behavior may be attributed to the number of accessible DHPM molecules in the combination together with the structural advantages of the CQDs. However, CQDs alone also showed inhibitory activity at higher concentrations against A549 cells.22 In the research work published by Guido et al., DHPM and its derivatives were used at concentrations of up to 1 mM.6,30 The DHPM derivatives exhibited over 80% cell growth inhibition with IC50 of around 6 to 35 μM.31 It has been previously shown that monastrol mimic Biginelli DHPM derivatives exhibit cytotoxicity against HepG2 with half maximal inhibitory concentration of 120.62 μg mL−1 and weak toxicity towards HeLa cell lines with IC50 of 200 μg mL−1.6
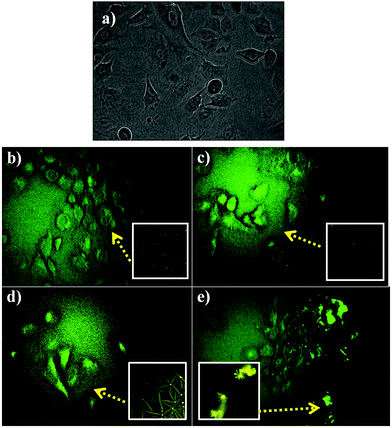
The in vitro examination of DHPM in combination with CQDs was viewed via fluorescence microscopy for tracking the location of the nanocomposites inside the target cells. The microscopic image revealed the entry of the CQD–DHPM nanocomposites in the cells exciting at 450 nm, as shown in Fig. 8. The PL analysis (Fig. 3b) also supports the excitation of the composites at the same wavelength.
This phenomenon of successful fluorescence property of the CQD–DHPM composites is consistent with the report by M. J. Molaei et al.32 that carbon-based materials with a particle size larger than 70 nm can also emit fluorescence and be used for bio-imaging applications, although particles less than 10 nm are commonly used for bioimaging applications.32 Further studies need to be done to elucidate the molecular pathways in the NSCLC cancer cell line death induced by DHPM and its nanocomposites.
Conclusion
We prepared nanocomposites of CQDs and DHPM molecules and confirmed their formation using different characterization techniques. The newly synthesized CQD–DHPM nanocomposites in our study were found to exhibit moderate activity against the A549 cancer cell line at a low concentration. The CQD–DHPM composite with a CQD![[thin space (1/6-em)]](https://www.rsc.org/images/entities/char_2009.gif) :
:![[thin space (1/6-em)]](https://www.rsc.org/images/entities/char_2009.gif) DHPM ratio of 1
DHPM ratio of 1![[thin space (1/6-em)]](https://www.rsc.org/images/entities/char_2009.gif) :
:![[thin space (1/6-em)]](https://www.rsc.org/images/entities/char_2009.gif) 2 exhibited robust cytotoxicity against NSCLC compared to the other ratios and DHPM alone. These composites were more specific to cancer cells and exhibited a very low toxic effect on normal cells (PBMCs). Due to their superior fluorescence properties, these composites show bioimaging capability for excitation at 450 nm. Thus, a multifunctional nanocomposite was developed in this study, which shows decent anti-cancer activity against the NSCLC cell line and can be used as a fluorophore.
2 exhibited robust cytotoxicity against NSCLC compared to the other ratios and DHPM alone. These composites were more specific to cancer cells and exhibited a very low toxic effect on normal cells (PBMCs). Due to their superior fluorescence properties, these composites show bioimaging capability for excitation at 450 nm. Thus, a multifunctional nanocomposite was developed in this study, which shows decent anti-cancer activity against the NSCLC cell line and can be used as a fluorophore.
Conflicts of interest
There are no conflicts to declare.Acknowledgements
The authors acknowledge no conflict of interests. This work is financially supported by Science and Engineering Research Board, Department of Science and Technology, Govt. of India (KM & RRB, Project No. – EMR/2016/005327). ST, HPM, SJ and KM also would like to thank PSG Institutions Management for lab facilities and infrastructural access. We would also acknowledge the technical discussions with Dr Thiagarajan, an ex-faculty of CMMT.References
- L. Yang, Y. Zeng, H. Wu, C. Zhou and L. Tao, J. Mater. Chem. B, 2020, 8, 1383–1388 RSC.
- A. M. Vijesh, A. M. Isloor, S. K. Peethambar, K. N. Shivananda, T. Arulmoli and N. A. Isloor, Eur. J. Med. Chem., 2011, 46, 5591–5597 CrossRef CAS PubMed.
- F. Manetti, A. Santucci, G. A. Locatelli, G. Maga, A. Spreafico, T. Serchi, M. Orlandini, G. Bernardini, N. P. Caradonna, A. Spallarossa, C. Brullo, S. Schenone, O. Bruno, A. Ranise, F. Bondavalli, O. Hoffmann, M. Bologna, A. Angelucci and M. Botta, J. Med. Chem., 2007, 50, 5579–5588 CrossRef CAS PubMed.
- C. Mugnaini, M. Alongi, A. Togninelli, H. Gevariya, A. Brizzi, F. Manetti, C. Bernardini, L. Angeli, A. Tafi, L. Bellucci, F. Corelli, S. Massa, G. Maga, A. Samuele, M. Facchini, I. Clotet-Codina, M. Armand-Ugón, J. A. Esté and M. Botta, J. Med. Chem., 2007, 50, 6580–6595 CrossRef CAS PubMed.
- N. Rioux and A. Castonguay, Carcinogenesis, 1998, 19, 1393–1400 CrossRef CAS PubMed.
- U. Soumyanarayanan, V. G. Bhat, S. S. Kar and J. A. Mathew, Org. Med. Chem. Lett., 2012, 2, 23 CrossRef PubMed.
- S. Terracciano, M. G. Chini, M. C. Vaccaro, M. Strocchia, A. Foglia, A. Vassallo, C. Saturnino, R. Riccio, G. Bifulco and I. Bruno, Chem. Commun., 2016, 52, 12857–12860 RSC.
- G. M. Chin and R. Herbst, Mol. Cancer Ther., 2006, 5, 2580 CrossRef CAS PubMed.
- L. H. S. Matos, F. T. Masson, L. A. Simeoni and M. Homem-de-Mello, Eur. J. Med. Chem., 2018, 143, 1779–1789 CrossRef CAS PubMed.
- F. A. F. Ragab, S. M. Abou-Seri, S. A. Abdel-Aziz, A. M. Alfayomy and M. Aboelmagd, Eur. J. Med. Chem., 2017, 138, 140–151 CrossRef CAS PubMed.
- C. Zappa and S. A. Mousa, Transl. Lung Cancer Res., 2016, 5, 288–300 CrossRef CAS PubMed.
- M. Infante, T. Berghmans, M. A. Heuvelmans, G. Hillerdal and M. Oudkerk, Eur. Respir. J., 2013, 42, 1706 CrossRef PubMed.
- B. S. Holla, B. S. Rao, B. K. Sarojini and P. M. Akberali, Eur. J. Med. Chem., 2004, 39, 777–783 CrossRef CAS PubMed.
- N. S. White and R. J. Errington, Adv. Drug Delivery Rev., 2005, 57, 17–42 CrossRef CAS PubMed.
- L. Bhattacharjee, K. Mohanta, K. Pal, A. L. Koner and R. R. Bhattacharjee, J. Mater. Chem. A, 2016, 4, 2246–2251 RSC.
- A. L. Antaris, H. Chen, S. Diao, Z. Ma, Z. Zhang, S. Zhu, J. Wang, A. X. Lozano, Q. Fan, L. Chew, M. Zhu, K. Cheng, X. Hong, H. Dai and Z. Cheng, Nat. Commun., 2017, 8, 15269 CrossRef CAS PubMed.
- L. Bhattacharjee, R. Manoharan, K. Mohanta and R. R. Bhattacharjee, J. Mater. Chem. A, 2015, 3, 1580–1586 RSC.
- H. Guo, B. You, S. Zhao, Y. Wang, G. Sun, Y. Bai and L. Shi, RSC Adv., 2018, 8, 24002–24012 RSC.
- A.-M. Alam, B.-Y. Park, Z. K. Ghouri, M. Park and H.-Y. Kim, Green Chem., 2015, 17, 3791–3797 RSC.
- Y. Song, S. Zhu and B. Yang, RSC Adv., 2014, 4, 27184–27200 RSC.
- Y. Wang and A. Hu, J. Mater. Chem. C, 2014, 2, 6921–6939 RSC.
- K. S. Prasad, G. Shruthi and C. Shivamallu, Inorg. Chem. Commun., 2019, 101, 11–15 CrossRef CAS.
- Q. Qu, A. Zhu, X. Shao, G. Shi and Y. Tian, Chem. Commun., 2012, 48, 5473–5475 RSC.
- T. Suppan, H. P. Mahendran, S. Jeyaraj, K. Mohanta and R. R. Bhattacharjee, Appl. Catal., A, 2020, 603, 117734 CrossRef CAS.
- F. Vitório, T. M. Pereira, R. N. Castro, G. P. Guedes, C. S. Graebin and A. E. Kümmerle, New J. Chem., 2015, 39, 2323–2332 RSC.
- T. Warsi, L. Bhattacharjee, S. Thangamani, S. K. Jat, K. Mohanta, R. R. Bhattacharjee, R. Ramaswamy, C. Manikyamba and T. V. Rao, Diamond Relat. Mater., 2020, 103, 107701 CrossRef CAS.
- L. Li and T. Dong, J. Mater. Chem. C, 2018, 6, 7944–7970 RSC.
- D. Dallinger and C. O. Kappe, Nat. Protoc., 2007, 2, 317–321 CrossRef CAS PubMed.
- A. S. Mostafa and K. B. Selim, Eur. J. Med. Chem., 2018, 156, 304–315 CrossRef CAS PubMed.
- B. C. Guido, L. M. Ramos, D. O. Nolasco, C. C. Nobrega, B. Y. G. Andrade, A. Pic-Taylor, B. A. D. Neto and J. R. Corrêa, BMC Cancer, 2015, 15, 283 CrossRef PubMed.
- K. N. Venugopala, R. Govender, M. A. Khedr, R. Venugopala, B. E. Aldhubiab, S. Harsha and B. Odhav, Drug Des., Dev. Ther., 2015, 9, 911 CrossRef CAS PubMed.
- M. J. Molaei, RSC Adv., 2019, 9, 6460–6481 RSC.
Footnotes |
| † Electronic supplementary information (ESI) available. See DOI: 10.1039/d1ma00017a |
| ‡ The authors have equal contribution. |
| This journal is © The Royal Society of Chemistry 2021 |


