DOI:
10.1039/D1MA00010A
(Paper)
Mater. Adv., 2021,
2, 2310-2317
Operando analysis of graphite intercalation compounds with fluoride-containing polyatomic anions in aqueous solutions†
Received
7th January 2021
, Accepted 23rd February 2021
First published on 10th March 2021
Abstract
The formation of graphite intercalation compounds (GICs) in aqueous solutions has attracted much attention, but reversibility in the formation/deformation of GICs is a challenging issue to construct highly safe rechargeable batteries. In this study, we used an operando analysis (X-ray diffraction and Raman spectroscopy) to discuss the feasibility of using fluoride-containing polyatomic anions in the formation of GICs in aqueous highly concentrated solutions. We found that the intercalation of anions containing a C2F5 moiety (such as [N(SO2CF3)(SO2CF2CF3)]− or [N(SO2CF2CF3)2]−) does not occur in the bulk of graphite, but only in the surface region. In addition, anions containing a CF3 moiety show different behaviors: SO3CF3− shows greater reversibility and larger stage-number than N(SO2CF3)2− in the formation of GICs. These results provide design guidelines for the reversible intercalation and de-intercalation of anions and their application as a cathode material in aqueous rechargeable batteries.
1 Introduction
Graphite has a lamellar structure, and atoms, molecules, and ions can be intercalated into the interlayers of graphite to form graphite intercalation compounds (GICs).1 One liquid-phase method for synthesizing GICs is an electrochemical approach in which cations and anions in an electrolyte are intercalated into graphite by applying potential or current to graphite electrodes. GICs can be broadly classified into two types: a donor type in which graphite is reduced and cations are intercalated, and an acceptor type in which graphite is oxidized and anions are intercalated. Examples of the former intercalation species are known to be cations such as alkali metals, alkaline earth metals and rare earth metals,2,3 and the latter are halogen molecules,4 metal halides,5 and polyatomic anions such as sulfate ions, nitrate ions and perchlorate ions.6–8 The structure in which intercalation species enter all interlayers of graphite is stage 1, the structure in which the intercalation species enter every two interlayers is called stage 2, and so forth; when there are n layers of graphene between the intercalation species, it is called stage n GIC. The distance between the two graphene layers sandwiching the intercalation species is called the sandwich thickness ds, which increases from the original interlayer distance (d0) of 0.335 nm to 0.370 nm9 for lithium ions and 0.798 nm10 for sulfate ions. The repeat distance Ic in the c-axis can be expressed aswhere n is the stage-number. A typical application of GICs is in lithium-ion batteries, where the intercalation of Li+ ions occurs mainly in a potential region below 0.25 V (vs. Li+/Li), resulting in a negative electrode.11 In addition, anion intercalation can be used for positive electrodes.12
With a growing demand for large-size storage batteries, the development of water-based electrolytes for batteries has attracted much attention in recent years to ensure safety and reduce costs. Therefore, we have attempted to apply GICs in an aqueous electrolyte system. Anion intercalation was studied in highly concentrated strong acids such as sulfuric acid, nitric acid, and CnF2n+1SO3H,13 but there are few reports using non-corrosive neutral aqueous solutions. This is because water oxidation competes with anion intercalation and GICs with anions are thermodynamically unstable and decompose instantly with water in air, making structural analysis difficult. In recent years, the use of highly concentrated aqueous electrolytes has paved the way to overcome these difficulties. It has been reported that the increased activity of anions and the reduced activity of water in the concentrated aqueous electrolyte leads to expansion of the electrolyte potential window14 and reduction of the oxidation rate of water due to local pH changes in neutral aqueous solutions,15 and in the concentrated aqueous electrolyte, this is expected to give relative priority to anion intercalation over water decomposition. We previously reported the intercalation and de-intercalation of FSA anions into graphite in a highly concentrated aqueous solution.16 In addition, Xu et al. found intercalation and de-intercalation reactions by continuously intercalating Br− and Cl− in a highly concentrated aqueous electrolyte.17 Passerini et al. reported a dual ion battery (DIB) with intercalation and de-intercalation reactions of bis(trifluoromethanedulfonyl)amide (TFSA) and trifluoromethansulfonate (OTf) anions on the graphite cathode and deposition and dissolution reaction of zinc on the anode.18 However, when both TFSA and OTf anions are intercalated into graphite, the structural change and intercalation mechanism become complex, and it is difficult to find a factor to improve the battery capacity and cycling characteristics. In this study, we investigated the formation of GICs, the reversibility of intercalation and de-intercalation reactions, and the cycling properties of GICs in an aqueous highly concentrated electrolyte, by comparing different kinds of polyatomic anions. We also aimed to perform a detailed structural analysis of GICs using operando analysis by X-ray diffraction (XRD) and Raman spectroscopy. In addition to LiTFSA and LiOTf, we used 5.0 mol dm−3 (M) lithium (pentafluoroethanesulfonyl)(trifluoroeromethanesulfonyl)amide (LiPTFSA), which has a molar ratio of water/anions = 1.8,19 and 3.8 M lithium bis(pentafluoroethanesulfonyl)amide (LIBETA), which has symmetrical pentafluoroethyl groups. To the best of our knowledge, there are no previous reports on the electrochemical intercalation of OTf and PTFSA anions into graphite and a structural analysis of GICs.
2 Experimental
2.1 Electrochemical and operando measurements
A three-electrode cell was used for the electrochemical measurements. Natural graphite (SNO-15, SEC Carbon) and polyvinylidene fluoride (PVdF, Kureha) with a weight ratio of 9![[thin space (1/6-em)]](https://www.rsc.org/images/entities/char_2009.gif) :
:![[thin space (1/6-em)]](https://www.rsc.org/images/entities/char_2009.gif) 1 were mixed in a solution of N-methylpyrrolidone (NMP). The mixture was stirred for 1 day and applied to a polyimide film (Kapton, Toray) to form working electrodes. Pt mesh and Ag/AgCl were used as the counter and reference electrodes, respectively. Aqueous solutions of 5.2 M Li[N(SO2CF3)2] (LiTFSA), 7.9 M LiSO3CF3 (LiOTf), 5.0 M Li[N(SO2CF3)(SO2CF2CF3)] (LiPTFSA), and 3.8 M Li[N(SO2CF2CF3)2] (LiBETA) were used as electrolytes. Each anion is illustrated in Fig. 1. To analyze the structure of GICs, operando XRD and Raman spectroscopy were performed during electrochemical measurements. An X-ray diffractometer (RINT-2200, Rigaku) with a CuKα line (40 kV, 20 mA) was used in a scan range of 2θ = 20–60° and at a scan speed of 100° min−1. A schematic illustration of an operando XRD cell is shown in Fig. S1 (ESI†). A 515 nm LD-pumped solid-state laser (Cobolt) was used for Raman measurements. Electrochemical oxidation and reduction were repeated for 100 cycles in the solutions of LiTFSA and LiOTf.
1 were mixed in a solution of N-methylpyrrolidone (NMP). The mixture was stirred for 1 day and applied to a polyimide film (Kapton, Toray) to form working electrodes. Pt mesh and Ag/AgCl were used as the counter and reference electrodes, respectively. Aqueous solutions of 5.2 M Li[N(SO2CF3)2] (LiTFSA), 7.9 M LiSO3CF3 (LiOTf), 5.0 M Li[N(SO2CF3)(SO2CF2CF3)] (LiPTFSA), and 3.8 M Li[N(SO2CF2CF3)2] (LiBETA) were used as electrolytes. Each anion is illustrated in Fig. 1. To analyze the structure of GICs, operando XRD and Raman spectroscopy were performed during electrochemical measurements. An X-ray diffractometer (RINT-2200, Rigaku) with a CuKα line (40 kV, 20 mA) was used in a scan range of 2θ = 20–60° and at a scan speed of 100° min−1. A schematic illustration of an operando XRD cell is shown in Fig. S1 (ESI†). A 515 nm LD-pumped solid-state laser (Cobolt) was used for Raman measurements. Electrochemical oxidation and reduction were repeated for 100 cycles in the solutions of LiTFSA and LiOTf.
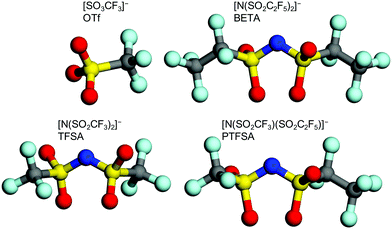 |
| | Fig. 1 Molecular structure of OTf, TFSA, BETA, and PTFSA anions. | |
2.2 Density functional theory calculations
Density functional theory (DFT) calculations were performed with the Vienna Ab initio Simulation Package (VASP).20 For exchange–correlation (XC) interactions between the valence electrons, the Perdew–Burke–Ernzerhof (PBE) functional within the generalized gradient approximation (GGA) was used in combination with the dispersion correction in Grimmes D3 scheme with Becke–Johnson damping.21–23 The electronic states were expanded using a plane wave basis set with a cutoff of 600 eV. The formation energy of stage n GICs per anion was calculated as follows:| | | Ef = E(anion:C24n) − 2nE(C12) − E(anion) | (2) |
where E(anion:C24n), E(C12), and E(anion) are the DFT total energies of anion-GICs, AB-stacking graphite, and isolated anions in a supercell, respectively. Anion in eqn (2) denotes a neutralized anion near graphite electrodes,24,25 and the solution stabilization of anions was neglected since the water/lithium ratios were relatively small (about 2.7 and 2.8 in the solutions of 5.2 M LiTFSA and 7.9 M LiOTf, respectively) and TFSA and OTf anions were not strongly coordinated with water molecules in aqueous highly concentrated solutions.
3 Results and discussion
3.1 Charge–discharge cycles under a constant current
Fig. 2 shows the results of charge–discharge tests in LiTFSA and LiOTf aqueous solutions under a constant current of 300 mA g−1 (based on the weight of graphite). The capacities at the 1st discharge were roughly 35–40 mA h g−1 for both LiTFSA and LiOTf solutions. While the charge and discharge capacities in LiTFSA solution rapidly decreased during cycling, LiOTf solutions showed relatively steady charge–discharge curves. At the 100th discharge, the capacity for LiOTf (30 mA h g−1) was higher than that for LiTFSA (10 mA h g−1). These charge–discharge curves indicate that TFSA might remain in the graphite host during charge–discharge cycles, but OTf anions showed relatively greater reversibility for the formation of GICs in aqueous solutions than TFSA anions.
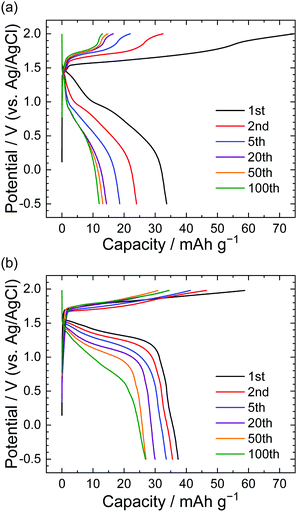 |
| | Fig. 2 Potential profile of graphite electrodes in (a) 5.2 M LiTFSA and (b) 7.9 M LiOTf aqueous solutions. Current density: 300 mA g−1. | |
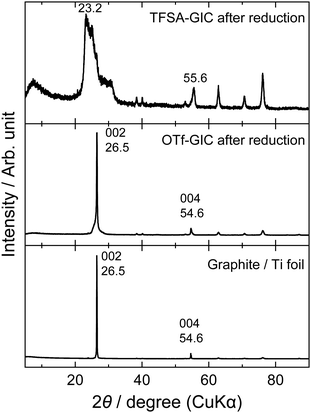
The same behavior can be seen in the XRD patterns after the charge–discharge cycles. Fig. 3 shows ex situ XRD patterns of the graphite electrodes before and after cycling. Prior to XRD measurements, the graphite electrodes were fully reduced to remove anions from the interlayers of graphite. The graphite electrode cycled in the LiOTf solution showed almost unchanged diffraction peaks at 26.5 and 54.6°, which correspond to 002 and 004 diffraction indices of graphite. However, the graphite electrode cycled in the LiTFSA solution shows an irreversible change in structure, and additional peaks clearly appear at around 23, 30, and 56°, which are derived from TFSA anions remaining inside graphite. Generally, these are called “residue compounds”, where the intercalation species are held strongly within the interlayer of graphite. Therefore, TFSA anions may interact more strongly with graphite than OTf anions, and this leads to a destructive change in the graphite structure after a long series of charge–discharge measurements.
 |
| | Fig. 3
Ex situ XRD patterns of graphite electrodes after charge–discharge cycles at a constant current (300 mA g−1) for 100 cycles in 5.2 M LiTFSA and 7.9 M LiOTf aqueous solutions. | |
3.2
Operando XRD measurements during GIC formation/deformation
Next, we investigated the stage transitions of GICs during the application of a constant current using XRD measurements. Fig. 4 shows the potential profiles of the 1st charge–discharge cycle and the patterns of XRD measurements in the LiTFSA solution. As the charge began, the peaks at 26.5 and 54.6° (002 and 004 of graphite) rapidly lost their intensity, and new peaks were observed at around 22–24, 28–32, and 55–57°. According to the sandwich thickness ds = 0.807–0.81 nm for TFSA-GICs reported previously,26–28 the highest intensity peak must have a diffraction index of 00n + 1, where n is the stage-number.1 Based on this assignment of the highest intensity peaks, the stage-numbers of GICs are calculated to be as follows: stage 4 at Point A, stage 3 at Point B, and stage 2 at Point C. As an example, the peak positions (2θ), d values, repeat distances, and sandwich thickness at Point C are shown in Table 1, and these constant values of repeat distance and sandwich distance clearly corroborate the stage-number (stage 2). Stage 2 TFSA-GICs were also obtained in some complex aqueous-based electrolytes,18,27 but we achieved the formation of TFSA-GICs from a simple aqueous electrolyte. Next, as the current was switched to reduction, the peak positions of 00n + 1 and 00n + 2 showed a gradual return toward 26.5° (002graphite) and the peak at around 56.5° toward 54.7° (004graphite). However, even when the potential was sufficiently negative at −0.5 V, the peaks of TFSA-GICs did not completely return to the original graphite positions. This also implies that electrochemical intercalation and de-intercalation were irreversible and that TFSA anions remained in graphite, as mentioned above.7
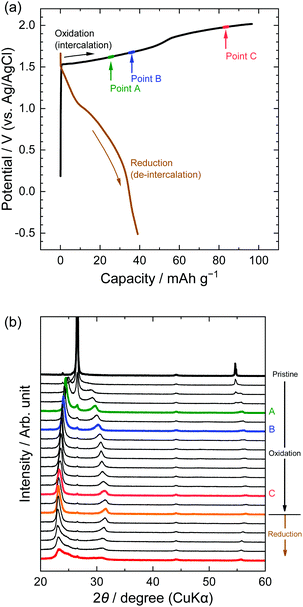 |
| | Fig. 4 (a) Potential profile and (b) operando XRD patterns of graphite electrodes in 5.2 M LiTFSA aqueous solutions. Current density: 300 mA g−1. | |
Table 1
d value, Ic, and ds calculated from operando XRD patterns in 5.2 M LiTFSA at Point C
| Miller index |
2θ/° |
d value/nm |
I
c/nm |
d
s/nm |
| 003 |
23.4 |
0.381 |
1.14 |
0.808 |
| 004 |
31.3 |
0.286 |
1.14 |
0.807 |
| 007 |
56.5 |
0.163 |
1.14 |
0.804 |
Second, the potential profiles and XRD patterns in the LiOTf solution are shown in Fig. 5. Original peaks at 26.5° (002graphite) and 54.7° (004graphite) disappeared by oxidation, and new peaks appeared at around 24, 30, and 55°. Based on the sandwich thickness of ds = 0.80, which was previously reported for OTf-GICs in HCF3SO3,28 we determined the stage-number of OTf-GICs at Points A and B as 4 and 3, respectively. Table 2 shows, for example, the peak positions (2θ), d values, repeat distances, and sandwich thickness of OTf-GIC obtained at Point B. During a subsequent reduction after oxidation, the XRD peaks of OTf-GICs reversibly returned to the original peaks of graphite. Compared with TFSA-GICs, OTf-GICs had a higher reversibility of stage transition and a lower amount of residue formation of OTf anions. Previously, Horn et al. reported only the electrochemical intercalation of OTf anions into graphite in HCF3O3, but no details in the de-intercalation process.29 In addition, Carlin et al. investigated the intercalation and de-intercalation of OTf anions in an ionic liquid (1-ethyl-3-methylimidazolium trifluoromethane sulfonate, EMI-OTf), but reported only the charge/discharge efficiency and no details in the structural analysis of OTf-GICs.30 To the best of our knowledge, this is the first report of the reversible intercalation/de-intercalation of OTf anions on graphite from aqueous electrolytes.
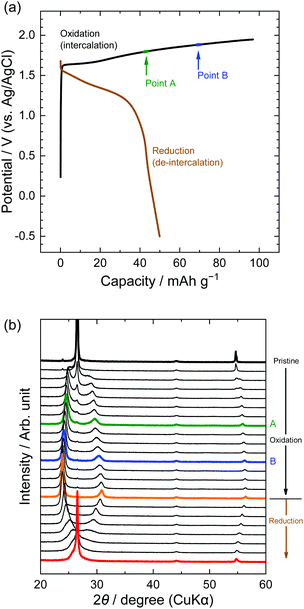 |
| | Fig. 5 (a) Potential profile and (b) operando XRD patterns of graphite electrodes in 7.9 M LiOTf aqueous solutions. Current density: 300 mA g−1. | |
Table 2
d value, Ic, and ds calculated from operando XRD patterns in 7.9 M LiOTf at Point B
| Miller index |
2θ/° |
d value/nm |
I
c/nm |
d
s/nm |
| 004 |
24.2 |
0.368 |
1.48 |
0.804 |
| 005 |
30.3 |
0.295 |
1.47 |
0.801 |
| 009 |
56.1 |
0.164 |
1.47 |
0.801 |
Furthermore, we focus on anions with larger perfluorocarbon moieties: C2F5, LiPTFSA and LiBETA. The PTFSA anion has asymmetric fluorocarbon branches (CF3 and C2F5), and the BETA anion has symmetric branches (C2F5). Fig. 6 shows the potential profiles and XRD patterns of graphite electrodes in LiPTFSA and LiBETA solutions. Both systems had capacities of 20–30 mA h g−1 at reduction, but the XRD patterns were almost unchanged and the intensity of 002graphite was only weakened. These results indicate that no PTFSA-GIC or BETA-GIC formed from concentrated aqueous electrolytes in this study. In the case of amide anions, the formation of GICs is less likely to occur thermodynamically and kinetically as the number of carbons in perfluoroalkyl groups increases. A study that compared different lengths of perfluoroalkyl groups of amide anions in ionic liquids suggested that the intercalation of BETA anions was less likely than that of other small anions such as TFSA, FTFSA ((fluorosulfonyl)(trifluoromethanesulfonyl)amide, [N(SO2CF3)(SO2F)]−), and FSA (bis(fluorosulfonyl)amide, [N(SO2F)2]−) anions. Moreover, Lerner et al. reported that the formation rate of BETA-GICs in 48% hydrofluoric acid was far less than that of TFSA-GICs by chemical oxidation of K2MnF6.31 In this study, we found that PTFSA and BETA anions are unfavorable to form acceptor-type GICs from aqueous concentrated electrolytes.
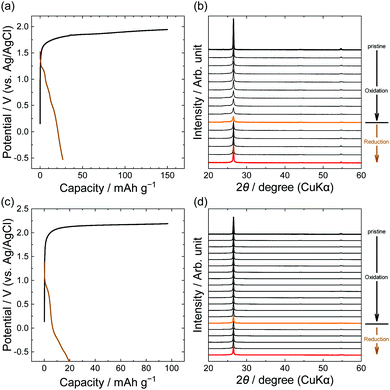 |
| | Fig. 6 Potential profiles and operando XRD patterns of graphite electrodes in 5.0 M LiPTFSA (a and b) and 3.8 M LiBETA (c and d) aqueous solutions. Current density: 15 mA g−1. | |
3.3
Operando Raman spectroscopy during GIC formation/deformation
Structural changes in the near surface of graphite were observed using Raman spectroscopy. Fig. 7 shows the results for LiTFSA solutions; Raman spectra were measured at the points indicated in the potential profiles. The pristine graphite showed a peak at around 1580 cm−1, which is called the G-band derived from an in-plane stretching vibration between adjacent C–C bonds in the E2g mode.1 Intercalation of some ions and molecules into graphite divides the G-band into two peaks: one originating from graphene layers adjacent to intercalation species (called bounding layers) and the other from non-adjacent graphene layers (called interior layers), with the former showing a higher wavenumber. The stage-number of GICs can be roughly calculated from the intensity ratios of the two peaks.
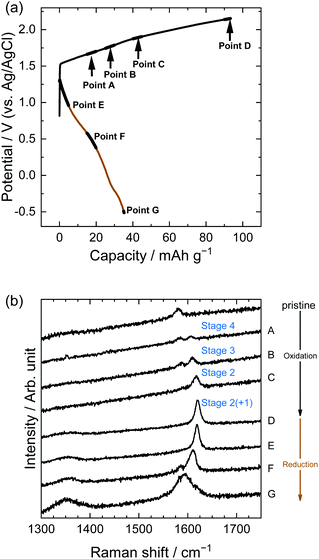 |
| | Fig. 7 (a) Potential profile and (b) operando Raman spectra of graphite electrodes in 5.2 M LiTFSA aqueous solutions. Current density: 300 mA g−1. | |
In the case of LiTFSA, the intensity ratio of the two peaks at Point A was 1![[thin space (1/6-em)]](https://www.rsc.org/images/entities/char_2009.gif) :
:![[thin space (1/6-em)]](https://www.rsc.org/images/entities/char_2009.gif) 1, indicating the formation of stage 4 TFSA-GIC. As the potential increased, the intensity of the interior layers became weaker, and only the peak of the bounding layers was observed at Point C, which implies the formation of stage 2 TFSA-GIC. Furthermore, the peak of bounding layers was shifted more positively at Point D. This means that a mixture of stage 2 and stage 1 TFSA-GICs was formed in the near surface of graphite. Generally, Raman spectra provide information regarding the near surface, and XRD patterns provide information on bulk properties. Therefore, the stage-number determined by Raman spectra became lower than that determined from the XRD pattern. Next, during discharge, TFSA anions were de-intercalated and the G-band moved back, but the peak did not completely return to its original position (Point G). Balabajew et al. performed similar experiments in ionic liquids and found that the G-band of graphite was similarly broadened after a charge–discharge cycle,32 which indicates that TFSA anions remained in graphite and the peak remained at a position higher than 1580 cm−1. This suggests that the TFSA anions remain in both aqueous and ionic liquid systems without completely being de-intercalated from graphite.
1, indicating the formation of stage 4 TFSA-GIC. As the potential increased, the intensity of the interior layers became weaker, and only the peak of the bounding layers was observed at Point C, which implies the formation of stage 2 TFSA-GIC. Furthermore, the peak of bounding layers was shifted more positively at Point D. This means that a mixture of stage 2 and stage 1 TFSA-GICs was formed in the near surface of graphite. Generally, Raman spectra provide information regarding the near surface, and XRD patterns provide information on bulk properties. Therefore, the stage-number determined by Raman spectra became lower than that determined from the XRD pattern. Next, during discharge, TFSA anions were de-intercalated and the G-band moved back, but the peak did not completely return to its original position (Point G). Balabajew et al. performed similar experiments in ionic liquids and found that the G-band of graphite was similarly broadened after a charge–discharge cycle,32 which indicates that TFSA anions remained in graphite and the peak remained at a position higher than 1580 cm−1. This suggests that the TFSA anions remain in both aqueous and ionic liquid systems without completely being de-intercalated from graphite.
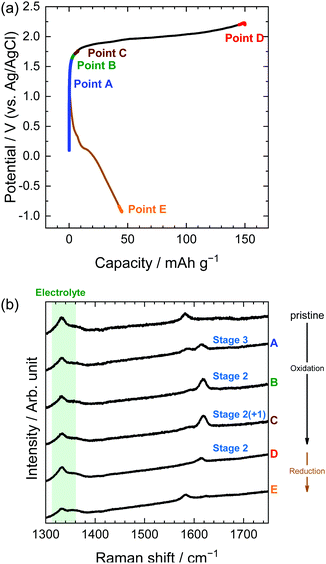
Similarly, in the LiOTf solution, Raman spectra (Fig. 8) show that a mixture of stage 3 and stage 2 OTf-GIC was formed at Point D. At the same electrode potential, we found higher stage-numbers for OTf-GICs than for TFSA-GIC. Therefore, it is reasonable to consider that OTf anions are more difficult to be intercalated into graphite than TFSA anions. As a result, the Raman spectrum of OTf-GIC returned closer to the original position than the spectrum of TFSA-GIC at the end of the 1st cycle. The Raman spectra of graphite electrodes in LiPTFSA and LiBETA solutions are shown in Fig. 9 and 10. While no GIC formation was observed by XRD measurements (Fig. 6) in LiPTFSA or LiBETA solutions, Raman spectra showed the formation of GICs with lower stage-numbers: stage 2 (partly stage 1) PTFSA-GIC and BETA-GIC. PTFSA and BETA anions were intercalated into graphite particles only at the near surface, and GIC formation in the bulk is unlikely to occur. These results suggest that the slower diffusion of bulky amide anions in graphite caused difficulty in the formation of GICs.
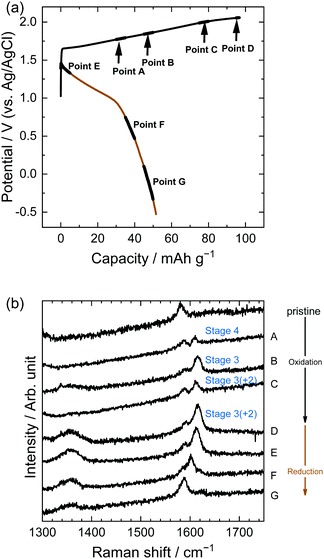 |
| | Fig. 8 (a) Potential profile and (b) operando Raman spectra of graphite electrodes in 7.9 M LiOTf aqueous solutions. Current density: 300 mA g−1. | |
 |
| | Fig. 9 (a) Potential profile and (b) operando Raman spectra of graphite electrodes in 5.0 M LiPTFSA aqueous solutions. Current density: 300 mA g−1. | |
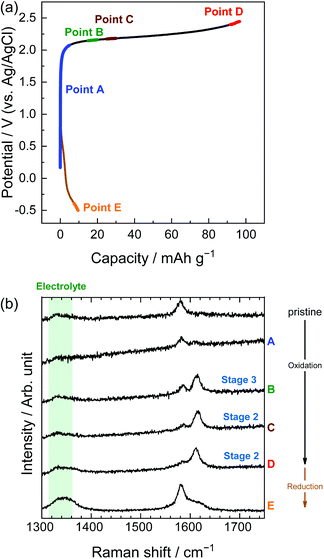 |
| | Fig. 10 (a) Potential profile and (b) operando Raman spectra of graphite electrodes in 3.8 M LiBETA aqueous solutions. Current density: 300 mA g−1. | |
In addition, we performed charge–discharge measurements in a diluted aqueous electrolyte (0.1 M LiTFSA). Fig. S2 (ESI†) shows potential profiles and concomitant operando Raman spectra. Discharge capacity was very limited, and the intercalation of TFSA anions occurred only on the surface of graphite in the diluted aqueous electrolyte.
3.4 Affinity of anions for GIC formation
In this study, we investigated the intercalation and de-intercalation behavior of TFSA, BETA, PTFSA, and OTf anions into and from graphite, based on the results of operando analytical techniques. Here we discuss the relationship between the chemical nature of anions and GIC formation in aqueous solutions.
In terms of the size of anions, Beltrop et al. reported that the onset potentials of anion intercalation into graphite were not mainly determined by the size of anions, but rather were influenced by other properties such as ion pair formation and self-aggregation.33 Therefore, smaller anions are not always preferable as an intercalation species. In addition, Zhou and Sit reported a large variety of formation energies of anion-GICs using DFT calculations: ClO4-GIC > AlCl4-GIC TFSA-GIC > BF4-GIC > PF6-GIC.25 We also calculated the formation energies of GICs with TFSA and OTf anions and found that TFSA-GICs were more stable than OTf-GICs: −0.96 eV for C24TFSA (stage 2) and −0.48 eV for C24OTf (stage 2). Optimized structures of stage 2 GICs of TFSA and OTf are illustrated in Fig. 11. This means that OTf-GICs need higher electrode potentials to form GICs, but OTf anions are more favorable for de-intercalation than TFSA anions. Therefore, OTf-GICs showed a larger stage-number but greater reversibility during prolonged cycling than TFSA-GICs. When considering the intercalation species for use in constructing DIBs, we have to select intercalation species with moderate stability to improve the efficiency and reversibility of DIBs.
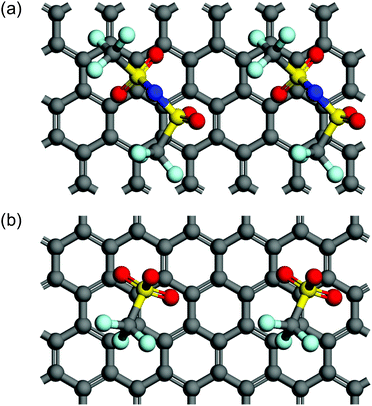 |
| | Fig. 11 Top views of two unit cells of stage 2 models for (a) C24TFSA and (b) C24OTf GICs. Note that a top graphite layer is not shown for clear appearance. | |
4 Conclusions
When OTf and TFSA anions were intercalated and de-intercalated into and from a graphite electrode for 100 cycles under a constant current, the OTf anions showed better capacitance retention than the TFSA anions. Operando measurements of XRD and Raman spectroscopy were carried out, and we clarified the differences in the intercalation and de-intercalation behavior of various anions into graphite. TFSA-GIC was found to be stage 2 in bulk and stage 1 at the surface of GICs, and TFSA anions remained in the bulk of graphite after reduction. PTFSA and BETA anions had longer perfluoroalkyl groups than TFSA anions: intercalation was thermodynamically or kinetically disadvantageous, and occurred only at the surface of graphite particles. OTf-GICs were found to be stage 3 in bulk and stage 2 on the surface of GIC. When GICs were reduced and the anions were desorbed, both XRD and Raman measurements showed that TFSA anions were more likely to remain in the graphite interlayer than OTf anions, indicating that TFSA anions could be intercalated into graphite at lower potential, but were more difficult to de-intercalate from graphite. DFT calculations also confirmed that TFSA-GIC was more stable than OTf-GIC.
Conflicts of interest
There are no conflicts to declare.
Acknowledgements
This work was supported by JSPS KAKENHI Grant Number JP20H02842.
Notes and references
- M. Dresselhaus and G. Dresselhaus, Adv. Phys., 1981, 30, 139–326 CrossRef CAS.
- K. Fredenhagen and G. Cadenbach, Z. Anorg. Allg. Chem., 1926, 158, 249–263 CrossRef CAS.
- N. Emery, C. Hérold, M. dAstuto, V. Garcia, C. Bellin, J. F. Marêché, P. Lagrange and G. Loupias, Phys. Rev. Lett., 2005, 95, 087003 CrossRef CAS.
- W. Rüdorff, Z. Anorg. Allg. Chem., 1941, 245, 383–390 CrossRef.
- H. Thiele, Z. Anorg. Allg. Chem., 1932, 207, 340–352 CrossRef CAS.
- C. Schafhaeutl, J. Prakt. Chem., 1840, 21, 129–157 CrossRef.
- W. Rüdorff, Z. Phys. Chem., 1939, 45B, 42–68 CrossRef.
- W. Rüdorff, Adv. Inorg. Chem. Radiochem., 1959, 1, 223–266 CrossRef.
- D. Guerard and A. Herold, Carbon, 1975, 13, 337–345 CrossRef CAS.
-
A. Hérold, in Intercalated Layered Materials, ed. F. Lévy, Springer, 1979, pp. 323–421 Search PubMed.
- J. B. Goodenough and K.-S. Park, J. Am. Chem. Soc., 2013, 135, 1167–1176 CrossRef CAS PubMed.
- M. Wang and Y. Tang, Adv. Energy Mater., 2018, 8, 1703320 CrossRef.
- H. Boehm, W. Helle and B. Ruisinger, Synth. Met., 1988, 23, 395–400 CrossRef CAS.
- L. Suo, O. Borodin, T. Gao, M. Olguin, J. Ho, X. Fan, C. Luo, C. Wang and K. Xu, Science, 2015, 350, 938–943 CrossRef CAS PubMed.
- Y. Yokoyama, T. Fukutsuka, K. Miyazaki and T. Abe, J. Electrochem. Soc., 2018, 165, A3299–A3303 CrossRef CAS.
- Y. Kondo, Y. Miyahara, T. Fukutsuka, K. Miyazaki and T. Abe, Electrochem. Commun., 2019, 100, 26–29 CrossRef CAS.
- C. Yang, J. Chen, X. Ji, T. P. Pollard, X. Lü, C.-J. Sun, S. Hou, Q. Liu, C. Liu, T. Qing, Y. Wang, O. Borodin, Y. Ren, K. Xu and C. Wang, Nature, 2019, 569, 245–250 CrossRef CAS PubMed.
- H. Zhang, X. Liu, B. Qin and S. Passerini, J. Power Sources, 2020, 449, 227594 CrossRef CAS.
- M. Becker, R.-S. Kühnel and C. Battaglia, Chem. Commun., 2019, 55, 12032–12035 RSC.
- G. Kresse, Phys. Rev. B: Condens. Matter Mater. Phys., 1996, 54, 11169–11186 CrossRef CAS PubMed.
- J. P. Perdew, K. Burke and M. Ernzerhof, Phys. Rev. Lett., 1996, 77, 3865–3868 CrossRef CAS PubMed.
- S. Grimme, J. Antony, S. Ehrlich and H. Krieg, J. Chem. Phys., 2010, 132, 154104 CrossRef PubMed.
- S. Grimme, S. Ehrlich and L. Goerigk, J. Comput. Chem., 2011, 32, 1456–1465 CrossRef CAS PubMed.
- W. Zhou, W. Y. Tong, Y. Wang, D. Y. W. Yu and P. H.-L. Sit, J. Phys. Chem. C, 2019, 123, 18132–18141 CrossRef CAS.
- W. Zhou and P. H. L. Sit, ACS Omega, 2020, 5, 18289–18300 CrossRef CAS PubMed.
- W. Yan and M. M. Lerner, J. Electrochem. Soc., 2001, 148, D83 CrossRef CAS.
- J. M. Wrogemann, S. Künne, A. Heckmann, I. A. Rodríguez-Pérez, V. Siozios, B. Yan, J. Li, M. Winter, K. Beltrop and T. Placke, Adv. Energy Mater., 2020, 1902709 CrossRef CAS.
- S. Karunanithy and F. Aubke, Synth. Met., 1986, 16, 41–53 CrossRef CAS.
- D. Horn and H.-P. Boehm, Mater. Sci. Eng., 1977, 31, 87–89 CrossRef CAS.
- R. T. Carlin, H. C. D. Long, J. Fuller and P. C. Trulove, J. Electrochem. Soc., 1994, 141, L73 CrossRef CAS.
- X. Zhang, N. Sukpirom and M. M. Lerner, Mater. Res. Bull., 1999, 34, 363–372 CrossRef CAS.
- M. Balabajew, H. Reinhardt, N. Bock, M. Duchardt, S. Kachel, N. Hampp and B. Roling, Electrochim. Acta, 2016, 211, 679–688 CrossRef CAS.
- K. Beltrop, P. Meister, S. Klein, A. Heckmann, M. Grünebaum, H.-D. Wiemhöfer, M. Winter and T. Placke, Electrochim. Acta, 2016, 209, 44–55 CrossRef CAS.
Footnote |
| † Electronic supplementary information (ESI) available. See DOI: 10.1039/d1ma00010a |
|
| This journal is © The Royal Society of Chemistry 2021 |
Click here to see how this site uses Cookies. View our privacy policy here.  Open Access Article
 *
*
![[thin space (1/6-em)]](https://www.rsc.org/images/entities/char_2009.gif) :
:![[thin space (1/6-em)]](https://www.rsc.org/images/entities/char_2009.gif) 1 were mixed in a solution of N-methylpyrrolidone (NMP). The mixture was stirred for 1 day and applied to a polyimide film (Kapton, Toray) to form working electrodes. Pt mesh and Ag/AgCl were used as the counter and reference electrodes, respectively. Aqueous solutions of 5.2 M Li[N(SO2CF3)2] (LiTFSA), 7.9 M LiSO3CF3 (LiOTf), 5.0 M Li[N(SO2CF3)(SO2CF2CF3)] (LiPTFSA), and 3.8 M Li[N(SO2CF2CF3)2] (LiBETA) were used as electrolytes. Each anion is illustrated in Fig. 1. To analyze the structure of GICs, operando XRD and Raman spectroscopy were performed during electrochemical measurements. An X-ray diffractometer (RINT-2200, Rigaku) with a CuKα line (40 kV, 20 mA) was used in a scan range of 2θ = 20–60° and at a scan speed of 100° min−1. A schematic illustration of an operando XRD cell is shown in Fig. S1 (ESI†). A 515 nm LD-pumped solid-state laser (Cobolt) was used for Raman measurements. Electrochemical oxidation and reduction were repeated for 100 cycles in the solutions of LiTFSA and LiOTf.
1 were mixed in a solution of N-methylpyrrolidone (NMP). The mixture was stirred for 1 day and applied to a polyimide film (Kapton, Toray) to form working electrodes. Pt mesh and Ag/AgCl were used as the counter and reference electrodes, respectively. Aqueous solutions of 5.2 M Li[N(SO2CF3)2] (LiTFSA), 7.9 M LiSO3CF3 (LiOTf), 5.0 M Li[N(SO2CF3)(SO2CF2CF3)] (LiPTFSA), and 3.8 M Li[N(SO2CF2CF3)2] (LiBETA) were used as electrolytes. Each anion is illustrated in Fig. 1. To analyze the structure of GICs, operando XRD and Raman spectroscopy were performed during electrochemical measurements. An X-ray diffractometer (RINT-2200, Rigaku) with a CuKα line (40 kV, 20 mA) was used in a scan range of 2θ = 20–60° and at a scan speed of 100° min−1. A schematic illustration of an operando XRD cell is shown in Fig. S1 (ESI†). A 515 nm LD-pumped solid-state laser (Cobolt) was used for Raman measurements. Electrochemical oxidation and reduction were repeated for 100 cycles in the solutions of LiTFSA and LiOTf.


![[thin space (1/6-em)]](https://www.rsc.org/images/entities/char_2009.gif) :
:![[thin space (1/6-em)]](https://www.rsc.org/images/entities/char_2009.gif) 1, indicating the formation of stage 4 TFSA-GIC. As the potential increased, the intensity of the interior layers became weaker, and only the peak of the bounding layers was observed at Point C, which implies the formation of stage 2 TFSA-GIC. Furthermore, the peak of bounding layers was shifted more positively at Point D. This means that a mixture of stage 2 and stage 1 TFSA-GICs was formed in the near surface of graphite. Generally, Raman spectra provide information regarding the near surface, and XRD patterns provide information on bulk properties. Therefore, the stage-number determined by Raman spectra became lower than that determined from the XRD pattern. Next, during discharge, TFSA anions were de-intercalated and the G-band moved back, but the peak did not completely return to its original position (Point G). Balabajew et al. performed similar experiments in ionic liquids and found that the G-band of graphite was similarly broadened after a charge–discharge cycle,32 which indicates that TFSA anions remained in graphite and the peak remained at a position higher than 1580 cm−1. This suggests that the TFSA anions remain in both aqueous and ionic liquid systems without completely being de-intercalated from graphite.
1, indicating the formation of stage 4 TFSA-GIC. As the potential increased, the intensity of the interior layers became weaker, and only the peak of the bounding layers was observed at Point C, which implies the formation of stage 2 TFSA-GIC. Furthermore, the peak of bounding layers was shifted more positively at Point D. This means that a mixture of stage 2 and stage 1 TFSA-GICs was formed in the near surface of graphite. Generally, Raman spectra provide information regarding the near surface, and XRD patterns provide information on bulk properties. Therefore, the stage-number determined by Raman spectra became lower than that determined from the XRD pattern. Next, during discharge, TFSA anions were de-intercalated and the G-band moved back, but the peak did not completely return to its original position (Point G). Balabajew et al. performed similar experiments in ionic liquids and found that the G-band of graphite was similarly broadened after a charge–discharge cycle,32 which indicates that TFSA anions remained in graphite and the peak remained at a position higher than 1580 cm−1. This suggests that the TFSA anions remain in both aqueous and ionic liquid systems without completely being de-intercalated from graphite.


