 Open Access Article
Creative Commons Attribution 3.0 Unported Licence
Bright aspects of defects and dark traits of dopants in the photoluminescence of Er2X2O7:Eu3+ (X = Ti and Zr) pyrochlore: an insight using EXAFS, positron annihilation and DFT†
Santosh K.
Gupta
 *ab,
K.
Sudarshan
 ab,
Paramananda
Jena
 c,
P. S.
Ghosh
d,
A. K.
Yadav
 e,
S. N.
Jha
bf and
D.
Bhattacharyya
 be
be
aRadiochemistry Division, Bhabha Atomic Research Centre, Trombay, Mumbai-400085, India
bHomi Bhabha National Institute, Anushaktinagar, Mumbai – 400094, India. E-mail: santoshg@barc.gov.in; santufrnd@gmail.com; Tel: +91-22-25590636
cSchool of Materials Science & Technology, Indian Institute of Technology (Banaras Hindu University), Varanasi-221005, Uttar Pradesh, India
dGlass and Advanced Materials Division, Bhabha Atomic Research Centre, Trombay, Mumbai-400085, India
eAtomic and Molecular Physics Division, Bhabha Atomic Research Centre, Trombay, Mumbai-400085, India
fBeamline Development & Application Section, Bhabha Atomic Research Centre, Trombay, Mumbai-400085, India
First published on 23rd March 2021
Abstract
Understanding the intricacies and fundamental processes of materials involved in dopant- and defect-based luminescence is of paramount importance for scientists and engineers working towards the design of solid-state lighting, optoelectronics, scintillators, etc. The lack of such fundamental information has restricted the design of new oxide-based materials for light-emitting devices and phosphor-converted materials. Here, we have designed Er2Ti2O7 (ETO), Er2Zr2O7 (EZO), Eu3+-doped ETO (EETO), and Eu3+-doped EZO (EEZO) via high-energy ball milling. Structural analysis using X-ray diffraction (XRD) and Raman spectroscopy suggested the stabilization of the ordered pyrochlore structure for ETO and EETO, whereas EZO and EEZO are stabilized in the defect fluorite structure. The ETO and EZO samples exhibited bright blue emission under ultraviolet irradiation. X-ray absorption near edge structure (XANES) analysis completely rules out contributions from Ti3+ or Zr3+ to the host emission via confirming that they exist as tetravalent ions. Extended X-ray absorption fine structure (EXAFS) analysis confirms the presence of a high density of oxygen vacancies (OVs) near the Ti and Zr sites, respectively, in ETO and EZO. The DFT-calculated charge transition levels qualitatively explain the origin of the blue emission of ETO and EZO with the dominant involvement of ionized oxygen vacancies. Positron annihilation lifetime spectroscopy (PALS) suggested that few changes in the defect density or type occurred upon europium doping in EETO. The defect concentration and type change significantly in EEZO with respect to EZO, which is of significant importance due to the possible agglomeration of vacancies into large-size defect clusters in EEZO. Surprisingly, in both hosts, red/orange narrow emission from europium (585–750 nm, 5D0 → 7FJ) was completely absent. Density of state (DOS) calculations suggested that a possible reason for this is that the Eu f-states are dominantly distributed around the bottom edge of the valence band (VB), far from the Fermi energy, electronic band gap, and top edge of the VB actively participating in the electronic transitions. Similarly, the Eu f-states are distributed around the top edge of the conduction band, far from the electronic band-gap region. We believe this work will be quite helpful for selecting suitable hosts and dopants, band gap engineering, and defect tuning in the pursuit of achieving efficient host-to-dopant energy transfer in Eu3+-doped pyrochlore materials.
1. Introduction
The discovery of more economic and sustainable novel materials with intriguing optical and structural properties has been attracting great attention in the global materials science community.1–6 High-performance materials towards solid-state lighting, efficient phosphors, and nuclear waste hosts would serve as a boon to humanity in terms of providing cheap and environmentally benign energy. A2B2O7-type pyrochlore materials have shown tremendous potential in this direction as multifunctional materials for a variety of applications, particularly defect-induced photo/radioluminescence, catalysis, solid oxide fuel cells, and as a nuclear waste host.7–9 Globally, there has been a gradual upsurge in research pertaining to defect- and dopant-induced luminescence in oxide lattices. However, a clear understanding of the origin of defect- and dopant-induced luminescence is still missing. As a result, there is a lack of motivation in designing new kinds of oxide-based optical materials.Nuclear energy is one of the most green, clean and cheap sources of energy, and most countries are investigating it as an alternative to other conventional sources such as thermal, solar, hydel, etc.10 The problem with nuclear energy is the high radioactivity associated with the used fuel, which can be very harmful to humanity because it is long-lived and highly radiotoxic.11 Thus, most countries use a waste immobilization approach wherein the nuclear waste is immobilized in a glass matrix and stored under the earth's crust to remediate its harmful effects.12 However, there are problems associated with the currently used borosilicate glass, such as low radiation stability and potential leaching of some of the components under high temperature and high pressure.13 This is an undesirable situation and could lead to catastrophe if the waste enters the public domain. Thus, researchers worldwide have begun to look for an alternative to borosilicate glass. In this context, A2B2O7 materials with various favourable properties, such as high radiation stability, negligible leaching, and the ability to accommodate large concentrations of lanthanides and actinides at both the A- and B-sites can be used as nuclear waste hosts.14 A2B2O7 compounds exist in two different structures, viz., the ideal pyrochlore (IP) and disordered fluorite (DF) structures, which have the space groups Fd![[3 with combining macron]](https://www.rsc.org/images/entities/char_0033_0304.gif) m and Fm
m and Fm![[3 with combining macron]](https://www.rsc.org/images/entities/char_0033_0304.gif) m, respectively. The phase transition from the pyrochlore to the defect-fluorite structure is an order–disorder transition that is very sensitive to chemical composition and electronic configuration and can be induced by heating or irradiation.14,15 IP is normally formed when the radius ratio falls between 1.46 ≤ r(A3+)/r(B4+) ≤ 1.78. On the other hand, when the radius ratio is less than 1.48, the DF phase is more likely to be stabilized. In other words, when the difference between the radii of the A and B ions is small, DF is the more favourable structure for A2B2O7. The most important point to make here is that when the size difference between A and B is small, they can take up excess radiation by site-swapping and forming an antisite defect. Each structure has its own advantage; the IP structure is preferred for luminescence, thermal barrier coatings, and upconversion, whereas the DF structure is more suitable for nuclear waste hosts, catalysis, oxygen conductors in fuel cells, etc.15 Moreover, the defect density will also be different in the two phases, which can have great implications on various properties such as magnetic, conductivity, and optical properties. Recently, we have explored Nd2Zr2O7 and Gd2Zr2O7, both of which exist in the DF structure, for self-activated emission, luminescence host and speciation of uranium.16,17 Similarly, La2Zr2O7 and La2Hf2O7 pyrochlores, due to their r(A3+)/r(B4+) ratios of greater than 1.46, exist in the IP structure, and have also been explored for use as phosphors, scintillators, thermal sensors, etc.18
m, respectively. The phase transition from the pyrochlore to the defect-fluorite structure is an order–disorder transition that is very sensitive to chemical composition and electronic configuration and can be induced by heating or irradiation.14,15 IP is normally formed when the radius ratio falls between 1.46 ≤ r(A3+)/r(B4+) ≤ 1.78. On the other hand, when the radius ratio is less than 1.48, the DF phase is more likely to be stabilized. In other words, when the difference between the radii of the A and B ions is small, DF is the more favourable structure for A2B2O7. The most important point to make here is that when the size difference between A and B is small, they can take up excess radiation by site-swapping and forming an antisite defect. Each structure has its own advantage; the IP structure is preferred for luminescence, thermal barrier coatings, and upconversion, whereas the DF structure is more suitable for nuclear waste hosts, catalysis, oxygen conductors in fuel cells, etc.15 Moreover, the defect density will also be different in the two phases, which can have great implications on various properties such as magnetic, conductivity, and optical properties. Recently, we have explored Nd2Zr2O7 and Gd2Zr2O7, both of which exist in the DF structure, for self-activated emission, luminescence host and speciation of uranium.16,17 Similarly, La2Zr2O7 and La2Hf2O7 pyrochlores, due to their r(A3+)/r(B4+) ratios of greater than 1.46, exist in the IP structure, and have also been explored for use as phosphors, scintillators, thermal sensors, etc.18
In the present work, we have synthesized Er2Zr2O7 (EZO) and Er2Ti2O7 (ETO) using a solid-state method after ball milling of the constituent oxides. They are considered to be interesting pyrochlore materials and are used in a variety of applications, such as hydrogen storage,19 magnetism,20,21 ceramic pigments,22 optical materials,23etc. Our aim was to stabilize both the IP and DF structures by changing the B-site element from Ti to Zr. We probed the structure and electronic states of ETO and EZO using synchrotron-based X-ray absorption spectroscopy (XAS), which comprises the X-ray near edge structure (XANES) and extended X-ray absorption fine structure (EXAFS) techniques. Both these structures have an abundance of defects, which can lead to interesting optical properties. Langlet et al. reported the temperature-dependent photoluminescence (PL) of an ETO thin-film, but were not able to clearly establish the origin of the photoluminescence, and their work was not focussed on visible spectroscopy.23 The same group also carried out near-infrared PL spectroscopy of Y2Ti2O7–Er2Ti2O7 (YETO) films.24 Saha et al. explored the PL of Er3+ in ETO.25 However, all the above-mentioned works probed the infrared photoluminescence due to the Er3+ ion, and none probed defect-related visible emission in either EZO or ETO. We have probed the PL in undoped EZO and ETO and then corroborated the same using density functional theory (DFT) calculations. Because of their favourable properties, such as moderate phonon energy, wide band gap, structural/thermal stability, and the ability to accommodate a large concentration of lanthanide dopants, A2B2O7 pyrochlores have traditionally been one of the most sought-after luminescence hosts. EZO and ETO pyrochlore systems are considered to be excellent hosts for PL owing to their high structural/thermal/chemical stability, ability to accommodate large dopants at both the A- and B-site, moderate phonon energy, and optimum band gap, dielectric constant and refractive index.9,18 It is expected that upon doping them with europium ions, efficient red emission with high quantum yield, narrow emission and high color purity will be obtained. This expectation is based on the fact that both Er3+ and Eu3+ have same ionic charge and similar sizes, and hence, the doping should be efficient. In fact, doping an activator ion into a crystalline host has been found to be the most efficient strategy for designing advanced, superior and high-performance optoelectronic devices and light-emitting materials.26–28 Despite this, there are no reports available in literature regarding the photoluminescence of lanthanide-doped EZO or ETO. Pokhrel et al.29 reported the PL properties of Er2Hf2O7:Eu3+, but were unable to obtain any europium luminescence for reasons that were not clearly understood. Here, we have changed the lattice to EZO and ETO and doped them with Eu3+ (2.0 mol%) ions to see whether dopant luminescence would be achieved. In addition to the above-mentioned XAS and PL studies, powder XRD studies with Rietveld refinement and Raman studies have been carried out for structural characterisation of the samples, and positron annihilation lifetime studies have been carried out to study the defects. We believe that this work will provide a new dimension in understanding the defect- and dopant-induced luminescence in pyrochlore oxides with a clear-cut design approach in terms of the dopant, choice of A/B site and vacancy tuning.
2. Experimental
The synthesis, instrumental details and theoretical methodology are discussed in the ESI,† as S1–S3.3. Results and discussion
3.1. X-ray diffraction
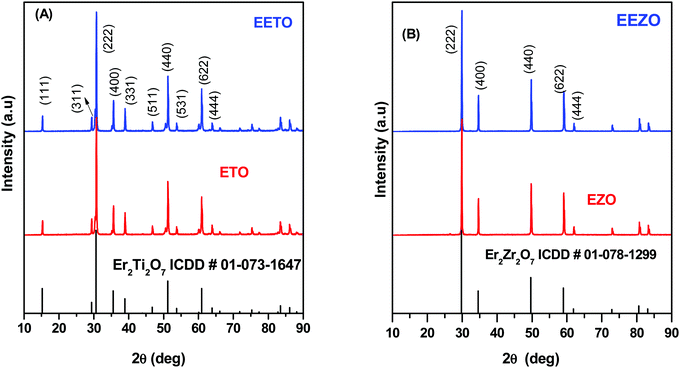
The powder XRD patterns of undoped and Eu3+-doped Er2Ti2O7 and Er2Zr2O7 are shown in Fig. 1A and B. The standard stick patterns of Er2Ti2O7 and Er2Zr2O7 are also given along with the respective XRD patterns for reliable comparison and ascertaining the phase purity. The prominent reflection planes are also marked in the figure. No additional peaks were found in the XRD patterns, confirming that the formed samples consisted of a single phase. The narrow peak profile suggests the highly crystalline nature of the undoped and Eu3+-doped ETO and EZO.It can be seen from the figure that Er2Ti2O7 exhibits reflections corresponding to odd hkl planes due to the pyrochlore superlattice in addition to the fundamental fluorite reflections. The XRD pattern of the ETO sample could be modelled as the cubic system of pyrochlore with the Fd![[3 with combining macron]](https://www.rsc.org/images/entities/char_0033_0304.gif) m space group. Rietveld refinement of the XRD pattern of ETO was also carried out using the FULLPROF Suite. The Rietveld fitting of the XRD pattern of ETO, along with the residuals and Bragg reflections, is given in Fig. S1A (ESI†). The crystal structure of ETO with the Fd
m space group. Rietveld refinement of the XRD pattern of ETO was also carried out using the FULLPROF Suite. The Rietveld fitting of the XRD pattern of ETO, along with the residuals and Bragg reflections, is given in Fig. S1A (ESI†). The crystal structure of ETO with the Fd![[3 with combining macron]](https://www.rsc.org/images/entities/char_0033_0304.gif) m space group is given in Fig. S1B (ESI†). The quality of fit was evaluated based on χ2. The lattice parameters from the Rietveld refinement of the XRD pattern of ETO are given in Table S1 (ESI†). The quality of the fit was found to be very good for both EZO and ETO, and the obtained fit factors such as the profile factor (Rp), weighted profile factor (Rwp), expected weighted profile factor (Rexp) and reduced chi-square (χ2) are tabulated in Tables S1 and S2 (ESI†). The structural parameters obtained are in good agreement with the reported literature.21
m space group is given in Fig. S1B (ESI†). The quality of fit was evaluated based on χ2. The lattice parameters from the Rietveld refinement of the XRD pattern of ETO are given in Table S1 (ESI†). The quality of the fit was found to be very good for both EZO and ETO, and the obtained fit factors such as the profile factor (Rp), weighted profile factor (Rwp), expected weighted profile factor (Rexp) and reduced chi-square (χ2) are tabulated in Tables S1 and S2 (ESI†). The structural parameters obtained are in good agreement with the reported literature.21
Unlike the XRD pattern of Er2Ti2O7, the pattern of Er2Zr2O7 shows peaks corresponding to only even hkl planes (Fig. 1B). This shows that the structure is the defect-fluorite-type with the space group Fm![[3 with combining macron]](https://www.rsc.org/images/entities/char_0033_0304.gif) m. The two cations Er3+ and Zr4+ are disordered. The Rietveld refinement of the XRD profile of EZO is given in Fig. S2A (ESI†), along with the crystal structure of EZO with the Fm
m. The two cations Er3+ and Zr4+ are disordered. The Rietveld refinement of the XRD profile of EZO is given in Fig. S2A (ESI†), along with the crystal structure of EZO with the Fm![[3 with combining macron]](https://www.rsc.org/images/entities/char_0033_0304.gif) m space group (Fig. S2B, ESI†). The structural parameters obtained from the Rietveld refinement of the XRD pattern of EZO are given in Table S2 (ESI†), along with the refinement parameters to indicate the quality of the fit.
m space group (Fig. S2B, ESI†). The structural parameters obtained from the Rietveld refinement of the XRD pattern of EZO are given in Table S2 (ESI†), along with the refinement parameters to indicate the quality of the fit.
The ionic radii of Er3+, Ti4+ and Zr4+ are 100.4 pm (8 CN), 60.5 pm (6 CN) and 72 pm (6 CN), respectively. A smaller difference between the radii of the A and B cations in A2B2O7 pyrochlores induces a degree of randomness between the cations of the A- and B-sites, leading to the formation of the defect fluorite type structure with the Fm![[3 with combining macron]](https://www.rsc.org/images/entities/char_0033_0304.gif) m space group. In the present case, Er2Ti2O7, with an Er3+/Ti4+ radius ratio of 1.659, is a pyrochlore with the Fd
m space group. In the present case, Er2Ti2O7, with an Er3+/Ti4+ radius ratio of 1.659, is a pyrochlore with the Fd![[3 with combining macron]](https://www.rsc.org/images/entities/char_0033_0304.gif) m space group or with Er3+ and Ti4+ occupying the A- and B-sites of the pyrochlore. In the case of Er2Zr2O7, the Er3+/Zr4+ ratio is 1.394, and its crystal structure is observed to be of the defect-fluorite type via XRD. In ETO (Er2Ti2O6O′) with the IP structure, Er, Ti, O and oxygen vacancies (OVs) are all arranged in an ordered arrangement. On the other hand, in EZO [(Er/Zr)4O7], the A/B as well as O/OV sites are all are arranged in a disorderly manner.
m space group or with Er3+ and Ti4+ occupying the A- and B-sites of the pyrochlore. In the case of Er2Zr2O7, the Er3+/Zr4+ ratio is 1.394, and its crystal structure is observed to be of the defect-fluorite type via XRD. In ETO (Er2Ti2O6O′) with the IP structure, Er, Ti, O and oxygen vacancies (OVs) are all arranged in an ordered arrangement. On the other hand, in EZO [(Er/Zr)4O7], the A/B as well as O/OV sites are all are arranged in a disorderly manner.
3.2. X-ray absorption near edge spectroscopy
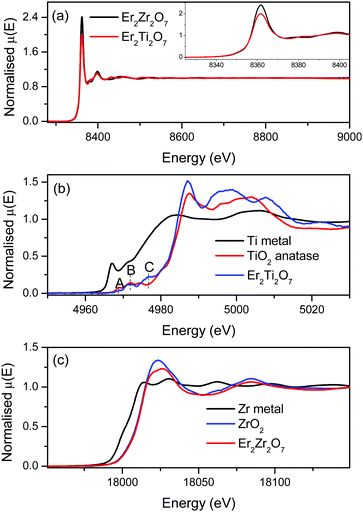
The XAS spectra of Er2Zr2O7 and Er2Ti2O7 at the Er L3 edge are shown in Fig. 2a. The regions near the absorption edge (XANES regions) are shown in the inset of Fig. 2a. The edge position, which gives the oxidation state of the absorbing atom, implies that Er is in same oxidation state in both Er2Zr2O7 and Er2Ti2O7. The normalized XANES spectrum at the Ti K edge of Er2Ti2O7 are shown in Fig. 2b, along with Ti metal and TiO2 (+4 state) standards. The absorption edge position of Er2Ti2O7 is at the same position as that of TiO2, suggesting that the Ti in the sample is in the Ti4+ oxidation state. The transition metal oxides show spectral features (pre-edge) immediately before the absorption edge due to the transition of 1s electrons to unoccupied states just below the continuum.30 The pre-edge peaks are denoted as A, B and C in Fig. 2b. The pre-edge peaks A, B and C are attributed to the 1s–2t2g and 1s–3eg transitions in the octahedral field.31 The normalised XANES spectrum of Er2Zr2O7 at the Zr K edge is shown in Fig. 2c along with Zr metal foil and ZrO2 standards. The edge position of Er2Zr2O7 coincides with that of ZrO2, suggesting that the Zr in the sample is in the Zr4+ oxidation state.3.3. Raman spectroscopy
In the pyrochlores belonging to the Fd![[3 with combining macron]](https://www.rsc.org/images/entities/char_0033_0304.gif) m space group with the structure A2B2O6O′, six Raman-active modes (A1g + Eg + 4F2g) were predicted by factor group analysis.32,33 The Raman spectra of the ETO and EETO samples are shown in Fig. 3. The lower vibration modes are due to the vibration of Er–O and Ti–O (ErO8 and TiO6), whereas the higher wavenumber modes are due to Ti–O stretching. The spectra could be fitted to 9 Lorentzians, marked M1 to M9 in the spectrum. Little difference between the Raman spectra of the undoped and Eu3+-doped samples was observed (Fig. 3A and B), which is in agreement with the XRD results, in which both showed a pyrochlore structure. The positron lifetime studies (discussed later) also indicated that no significant defects were created by Eu3+-doping in ETO. Saha et al.25 reported Raman studies of the pyrochlore Er2Ti2O7 at different temperatures, and the room-temperature Raman spectrum in the range of 40–800 cm−1 was fitted as the sum of 15 Lorentzians with support from the low temperature data. In our case, only the major peaks were considered. The obtained Raman spectra are in close agreement with the literature. Based on the literature, the various Raman modes observed in the present study were assigned to different modes as follows, although the mode accounting may involve uncertainties due to overlapping modes.25,33–36 The M1 at 254 cm−1 is F2g, M2 at 328 cm-1 is a combination of F2g + Eg, M4 at 454 cm−1 is F2g, M5 at 518 cm−1 is A1g and M6 at 592 is F2g. M4 at 400 cm-1 is attributed to Eg with M3 solely attributed to F2g by Banerji et al.37 The modes beyond M7 are due to higher order overtones or have contributions from PL.
m space group with the structure A2B2O6O′, six Raman-active modes (A1g + Eg + 4F2g) were predicted by factor group analysis.32,33 The Raman spectra of the ETO and EETO samples are shown in Fig. 3. The lower vibration modes are due to the vibration of Er–O and Ti–O (ErO8 and TiO6), whereas the higher wavenumber modes are due to Ti–O stretching. The spectra could be fitted to 9 Lorentzians, marked M1 to M9 in the spectrum. Little difference between the Raman spectra of the undoped and Eu3+-doped samples was observed (Fig. 3A and B), which is in agreement with the XRD results, in which both showed a pyrochlore structure. The positron lifetime studies (discussed later) also indicated that no significant defects were created by Eu3+-doping in ETO. Saha et al.25 reported Raman studies of the pyrochlore Er2Ti2O7 at different temperatures, and the room-temperature Raman spectrum in the range of 40–800 cm−1 was fitted as the sum of 15 Lorentzians with support from the low temperature data. In our case, only the major peaks were considered. The obtained Raman spectra are in close agreement with the literature. Based on the literature, the various Raman modes observed in the present study were assigned to different modes as follows, although the mode accounting may involve uncertainties due to overlapping modes.25,33–36 The M1 at 254 cm−1 is F2g, M2 at 328 cm-1 is a combination of F2g + Eg, M4 at 454 cm−1 is F2g, M5 at 518 cm−1 is A1g and M6 at 592 is F2g. M4 at 400 cm-1 is attributed to Eg with M3 solely attributed to F2g by Banerji et al.37 The modes beyond M7 are due to higher order overtones or have contributions from PL.
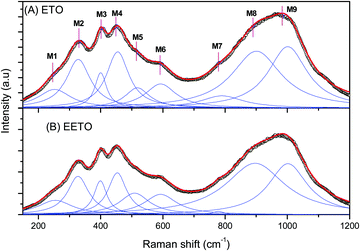 | ||
| Fig. 3 Raman spectra of (A) undoped (ETO) and (B) Eu3+-doped (EETO) Er2Ti2O7. The open symbols represent the experimental data while the solid lines are fit to the spectra. | ||
The Raman spectra of the EZO and EEZO samples are shown in Fig. 4. The substitution of Ti in the lattice for Zr (ETO to EZO) should not significantly change the Raman spectrum, as the Raman active modes in pyrochlores are due to oxygen. Broadening of the peaks in the Raman spectra of EZO and EEZO is evident from a comparison of Fig. 4A and B. The much broader Raman spectra of EZO/EEZO compared to those of ETO/EETO is due to the defects/disordered structure of former compared to the ordered arrangement of ions in the latter. Similar changes are observed between the pyrochlore Y2Ti2O7 and the defect fluorite structure of Y2Ti0.4Zr1.6O7.38 Although the XRD patterns shows that the structures of EZO and EEZO are fluorite, some pyrochlore features are evident from the different modes shown in the figure and their comparison with the modes observed in ETO. This suggests that some pyrochlore-like local ordering is still present in Er2Zr2O7. This is also observed in Y2Sn2−xZrxO7 with Zr substitution as well as the thermally induced structural evolution in Gd2Hf2O7.15,39 Similar short range order and the partial retention of bands attributed to pyrochlore are also observed in the supposedly fluorite-type rare earth hafnates of Dy and Yb under ambient conditions.40
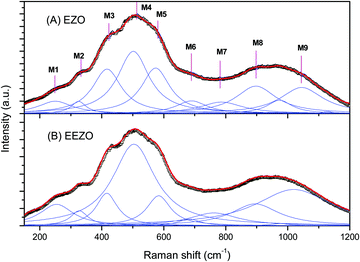 | ||
| Fig. 4 Raman spectra of (A) undoped (EZO) and (B) Eu3+-doped (EEZO) Er2Zr2O7. The open symbols represent the experimental data while the solid lines are fit to the spectra. | ||
3.4. Extended X-ray absorption fine structure
The χ(R) vs. R plots were generated using the μ(E) versus E spectra following the methodology described in ESI,† and are shown in Fig. 5a, and b for Er2Ti2O7 and in Fig. 5c and d for Er2Zr2O7. The structural parameters (atomic coordination and lattice parameters) of Er2Ti2O7 and Er2Zr2O7 used for the simulation of the theoretical EXAFS spectra of the samples were obtained from the XRD results, and the best fit χ(R) versus R plots (fitting range R = 1.0–3.5 Å) of the samples are shown in Fig. 5a–d along with the experimental data. During the fitting, the bond distances and disorder (Debye–Waller) factors (σ2), which give the mean square fluctuations in the distances, were used as fitting parameters and the coordination numbers were kept constant. The fitting results are tabulated in Table 1 for Er2Ti2O7 and Er2Zr2O7.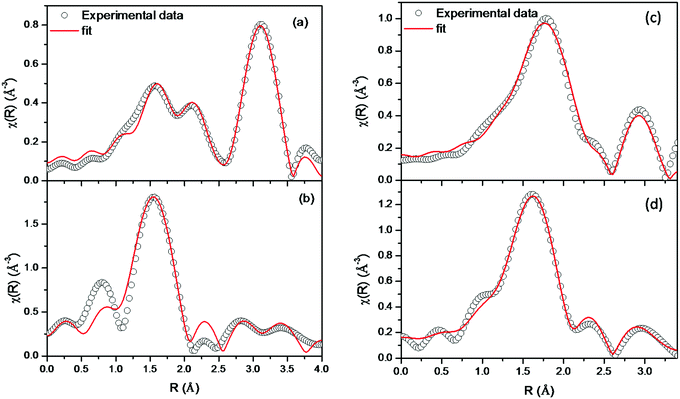 | ||
| Fig. 5 Fourier-transformed EXAFS spectra of Er2Ti2O7 at the (a) Er L3 edge and (b) Ti K-edge, and of Er2Zr2O7 at the (c) Er L3 edge and (d) Zr K-edge. | ||
| Parameter | Path | Er2Ti2O7 | Er2Zr2O7 | Path | Er2Ti2O7 | Path | Er2Zr2O7 |
|---|---|---|---|---|---|---|---|
| R (Å) | Er–O | 2.18 ± 0.01 | 2.26 ± 0.01 | Ti–O | 2.01 ± 0.01 | Zr–O | 2.15 ± 0.01 |
| N | 2.25 ± 0.45 | 7.84 ± 0.76 | 4.98 ± 0.36 | 7.52 ± 0.32 | |||
| (2) | (8) | (6) | (8) | ||||
| σ 2 | 0.0060 ± 0.0011 | 0.0143 ± 0.0011 | 0.0013 ± 0.0009 | 0.0048 ± 0.0009 | |||
| R (Å) | Er–O | 2.43 ± 0.01 | Ti–Er | 3.49 ± 0.01 | Zr–Zr | 3.45 ± 0.02 | |
| N | 6.75 ± 0.90 | 6 | 6 | ||||
| (6) | |||||||
| σ 2 | 0.0163 ± 0.0010 | 0.0091 ± 0.0011 | 0.0103 ± 0.0027 | ||||
| R (Å) | Er–Ti/Zr | 3.49 ± 0.01 | 3.53 ± 0.01 | Ti-Ti | 3.61 ± 0.02 | Zr–Er | 3.53 ± 0.01 |
| N | 6 | 6 | 6 | 6 | |||
| σ 2 | 0.0091 ± 0.0011 | 0.0119 ± 0.0015 | 0.0029 ± 0.0016 | 0.0119 ± 0.0015 | |||
| R (Å) | Er–Er | 3.55 ± 0.02 | 3.59 ± 0.01 | ||||
| N | 6 | 6 | |||||
| σ 2 | 0.0149 ± 0.0027 | 0.0113 ± 0.0017 |
The Fourier transform spectrum of Er2Ti2O7 at the Er L3 edge shows doublet peaks in the first coordination between 1.0–2.5 Å. The spectrum shown in Fourier transform space is phase-uncorrected, which shows coordination peaks slightly shifted to lower bond distances. However, during the fitting, phase correction is applied and the fitting results obtained here represent actual distances. The coordination peaks between 1.0–2.5 Å in Fig. 5a include contributions from two oxygen coordination shells at 2.18 Å and 2.42 Å, respectively, with two and six oxygen atoms in their respective coordination shell. The coordination peak at 3.0 Å is due to contributions from the next-nearest neighbour shells of Er–Zr and Er–Er at 3.49 Å and 3.58 Å, respectively. The local structure around the Ti site in Er2Ti2O7 is different compared to that of the Er site (Fig. 5b). The Ti atoms are coordinated with a single oxygen coordination shell with six oxygens at a distance of 2.01 Å. The peak below 1 Å is due to the background noise, and was not included during the fitting. The doublet peaks between 2.5–3.75 Å are fitted with next nearest neighbour coordination shells of Ti–Er and Ti–Ti at 3.49 Å and 3.60 Å, respectively. It can be seen from the best fit values of oxygen co-ordination (N) given in Table 1 that significant oxygen vacancies exist near the Ti sites in the Er2Ti2O7 sample.
The Fourier transform EXAFS spectrum of Er2Zr2O7 at the Er L3 edge shows quite different coordination peaks from that of Er2Ti2O7. This is due to the different crystal structures of Er2Zr2O7 and Er2Ti2O7, which were also confirmed from the XRD measurements. The Fourier transform spectrum of Er2Zr2O7 (Fig. 5c) shows a single coordination peak as the first-nearest neighbour, which is due to contributions from eight oxygen atoms at a distance of 2.26 Å. The second peak at 3.0 Å has contributions from Er–Zr and Er–Er coordination shells at 3.52 Å and 3.59 Å, respectively. Since the Er and Zr atoms are occupying the same positions in unit cell, which leads to the same coordination geometry, the Fourier transform spectra shown in Fig. 5c and d are quite similar to each other. The first peak at the Zr K edge is due to the eight oxygen atoms at a bond distance of 2.15 Å. This Zr–O bond length is smaller than the Er–O bond length due to the difference in the ionic radii of the eight-coordinated Er3+ and Zr4+.41 The second coordination peak at the Zr K edge (Fig. 5d) has contributions from the Zr–Zr and Zr–Er coordination shells at 3.45 Å and 3.52 Å, respectively. Table 1 shows that the possibilities of oxygen vacancies are also greater at the Zr sites than at the Er sites for the Er2Zr2O7 sample.
3.5. Positron annihilation studies
The positron annihilation lifetime spectra of all the samples could be fitted as the sum of three lifetime components using PALSFit, with the longest-lived component in all cases being less than 0.5% and having a lifetime of 1 to 1.5 ns. This was attributed to positronium formation on the powder surfaces and is not discussed. The other two lifetime components and their relative intensities are given in Table 2. Two components are present in all the samples, with τ1 being lower than the bulk lifetime and τ2 corresponding to the partial trapping of positrons in defect states. The fractional intensity corresponding to the second lifetime component is an indication of the concentration of positrons trapped in the defects or the concentration of defects itself for similar trapping rates in the defects. A similar enhancement in I2 with increasing defect concentration has previously been reported in bismuth-based pyrochlores.42 The intensity-weighted average positron lifetimes were also calculated and are given in Table 2.| Sample | τ 1 (ps) | I 1 (%) | τ 2 (ps) | I 2 (%) | τ ave (ps) |
|---|---|---|---|---|---|
| ETO | 157 ± 15 | 22.7 ± 1.2 | 265 ± 5 | 77.1 ± 1.2 | 240 ± 6 |
| EETO | 151 ± 14 | 24.0 ± 1.2 | 261 ± 5 | 75.9 ± 1.2 | 234 ± 6 |
| EZO | 106 ± 11 | 16.3 ± 0.9 | 223 ± 3 | 83.4 ± 1.0 | 204 ± 4 |
| EEZO | 198 ± 4 | 90.2 ± 0.9 | 342 ± 5 | 9.5 ± 0.3 | 212 ± 5 |
The presence of the second lifetime component of approximately 260 ps and significant intensity in both ETO and EETO indicates the presence of a large concentration of defects. The differences between the positron lifetimes of ETO and EETO are insignificant, showing only a marginal reduction in I2 or a minor reduction in the concentration of defects. The two lifetimes and average lifetimes in EZO differ from those of ETO, as the structure of EZO differs from that of ETO, as seen from XRD. The average lifetime in EZO is close to that of the single positron component reported by Greg et al. in Gd2Zr2O7.43 The intensity of the second component is still large in EZO. This intensity is reduced significantly with an increase in the lifetime in EEZO. This shows that either the concentration of defects decreased significantly, or the type of defects changed so significantly that the positrons are not trapped in the defects of EEZO. It was seen that τ2 also increased from 223 ps in EZO to 342 ps in EEZO, representing the possible agglomeration of vacancies into large-sized defect clusters in EEZO which appear to be low concentration. The PL emission results (discussed later) are in agreement with the assessment of defects in these samples via positron annihilation studies.
3.6. Photoluminescence studies
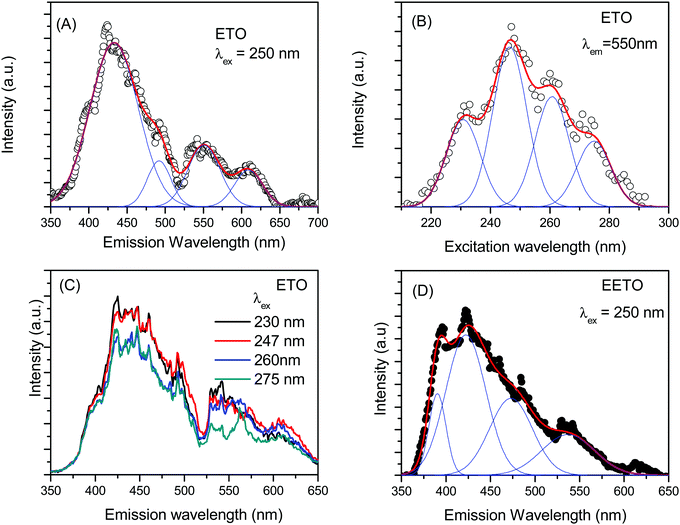
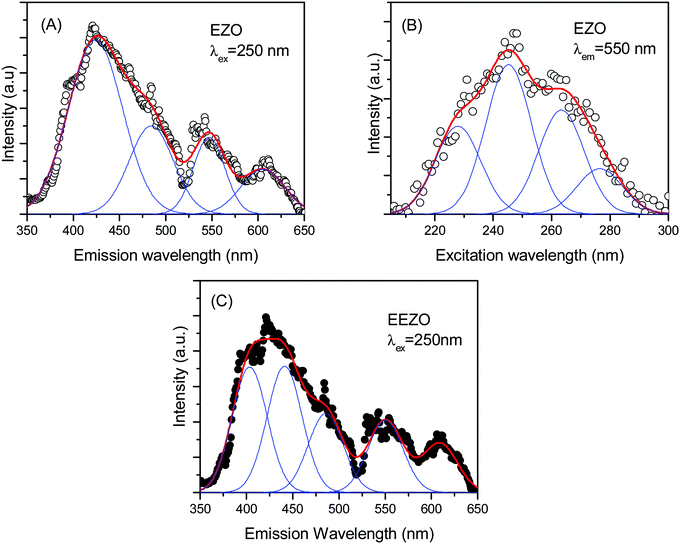
The emission spectrum of ETO with 250 nm excitation is shown in Fig. 6A. The emission spectrum consists of various bands and could be fitted with at least four bands centred at 430, 490, 550 and 608 nm. A small shoulder appeared at approximately 390 nm in the broad band centred at 430 nm, and the intensity of emission falls sharply below this wavelength. The emission wavelength is close to the band gap measured in Er2Ti2O7 and other titanate-based pyrochlores.44 The 430 nm band is attributed to defect-induced emission contributed by various oxygen-related defects whose energy levels lie just below the conduction band in these pyrochlores; this band is the most intense among those observed in the present studies.18 The large concentration of defects in ETO is evident from positron annihilation lifetime spectroscopy, as indicated by the high intensity I2 of positron annihilation from the defect states, and the EXAFS measurements at the Ti K-edge also support this. The 550 nm band represents a combination of nearby transitions in Er3+, namely, 2H11/2 → 4I15/2 and 4S3/2 → 4I15/2, while that 490 nm is due to 4F7/2 → 4I15/2.25,45 The origin of the small peak at approximately 610 nm is not very clear, but it is close to the emission from the 4F7/2 level of Er3+ observed as a band near 625 nm by Mondal et al.46 Various emission peaks from the electronic transitions in Er3+ appear as a broad band due to the crystal field splitting of the ground state due to the field of the surrounding oxygen atoms.47 The excitation spectrum of ETO with the emission fixed at 550 nm is shown in Fig. 6B. It is clearly seen that multiple bands contribute to the emission, and at least four distinct bands could be observed. The bands are centred at 231, 247, 261 and 275 nm. The emission spectra were recorded with an excitation wavelength near each band, and the recorded spectra are shown in Fig. 6C. No noticeable differences were observed except for small changes in the relative intensities of the different bands discussed above, and the emission map with varying excitation wavelength was not studied further. The emission spectrum of Eu3+-doped ETO is shown in Fig. 6D. The four fitted bands are centred at 390, 425, 475 and 540 nm. The first band at 390 nm appears as a shoulder in the emission of ETO, but could be fitted as peak due to the lower intensity of the overlapping band at 425 nm compared to the corresponding band due to defect-induced emission in ETO. No specific indication of the emission from Eu3+ is observed. The other two bands at 475 nm and 540 nm originate from electronic transitions in Er3+. However, the overlap of small intensities from the emission from Eu3+ in the bands ascribed to Eu3+ could lead to variations in the centroids of the bands determined in the EETO samples in addition to the uncertainty in fitting the bands.The emission spectrum of Er2Zr2O7 with excitation at 250 nm is shown in Fig. 7A. As in the case of ETO, the emission spectrum could be fitted as the sum of four bands. The four bands obtained here are centred at 425, 485, 545, and 605 nm. The emission spectra are very much similar to that of ETO, including a shoulder on the band at 425 nm, but with small shifts in the peak positions. The origin of the different bands is as discussed above. The small changes in the peak positions of the emission bands between ETO and EZO are due to the change from Ti to Zr and the resulting changes in the defect energy levels and crystal field splitting, etc. Even in this case, the band at 425 nm is the dominant band. The excitation spectrum of EZO with emission at 550 nm is given in Fig. 7B. Like in the case of ETO, the excitation spectrum consists of multiple excitation bands and could be easily resolved into four bands centred at 228, 245, 263 and 277 nm. The splitting of the conduction band into sub-bands has been shown in the density functional theory calculations of the electronic structure in various A2Ti2O7 (A = lanthanide) compounds.48 Minor changes in the band positions in the excitation spectrum are due to changes in the energy levels in the band structure due to the involvement of Zr 4d levels instead of Ti 3d. The emission spectrum of Eu3+-doped EZO (EEZO) is shown in Fig. 7C. The emission spectrum beyond 510 nm comprising bands at approximately 550 and 610 nm from transitions from various levels in Er3+ is identical to that in EZO. In the first broad band, the shoulder at the lower wavelength side could be extracted as a separate peak due to the lower intensity of the defect emission band. The band centred at 485 nm attributed to emission from the 4F7/2 state of Er3+ remains, but the other defect band centred at 425 nm in EZO appears as two peaks centred at 403 and 441 nm. This is an artefact of fitting arising due to the lowering in the intensity of the 425 nm band due to changes in the defect types in Eu3+-doped Er2Zr2O7, as seen in the positron annihilation studies discussed earlier.
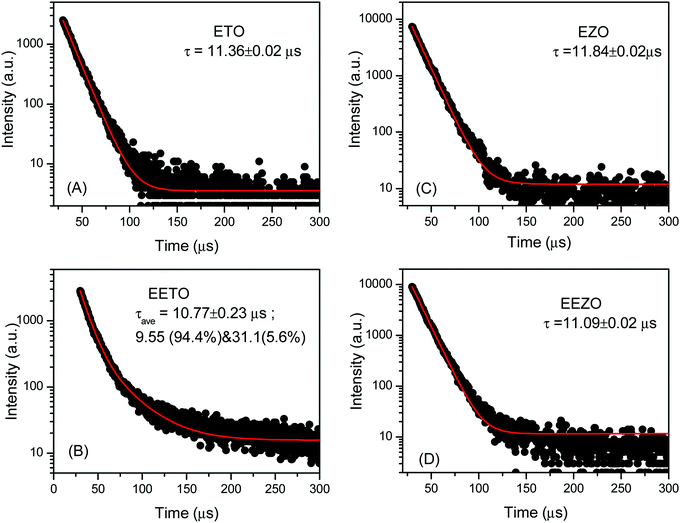
The emission lifetime spectra for the emission at 425 nm were recorded for all the samples and are given in Fig. 8. All the lifetime spectra yielded a single lifetime except for that of EETO, in which a small fraction of a long-lived component is observed. However, it is noted that the average lifetime in this case is in the same range as those of the other samples; the individual lifetime values are given in the figure. There is a marginal reduction in the emission lifetimes of the Eu3+-doped samples with respect to the undoped ones, possibly due to the opening of the emission channels of Eu3+. The intensity of the contribution from Eu3+ was too low to be deciphered from the other emissions, and also resulted in only minimal changes in the emission lifetimes. For the samples, the lifetimes were approximately 9–12 μs, which indicates the involvement of ionized vacancies in the photoluminescence process. The exact nature of the defects involved in the PL of EZO and ETO is confirmed using DFT calculations in the next section.
3.7. Origin of PL in ETO and EZO: DFT calculations of defect energetics
The cations in the ideal fluorite structure are eight-coordinated (A4O8), while the disordered defect-fluorite structure has A4O7. Even though the unit cell is still cubic, one of the oxygen positions is vacant and each cation is coordinated with seven anions. ETO stabilizes in the ordered pyrochlore structure and EZO stabilizes in the disordered fluorite structure. Our DFT-GGA calculated equilibrium lattice parameters of ETO and EZO are compared with experimental data49,50 and previous DFT calculations51 (Table 3). The DFT-GGA calculated lattice parameters and bond lengths of ETO are within 1% and 5% of the experimental values, respectively. Moreover, our DFT-GGA calculated values are in excellent agreement with previous DFT calculations using the full potential linear augmented plane wave (FP-LMTO) method.51 Our DFT-GGA calculated lattice parameter for EZO is within 1.5% of the experimentally measured value.| Property | Er2Ti2O7, ETO (ordered pyrochlore) | Er2Zr2O7, EZO (disordered fluorite) |
|---|---|---|
| Lattice parameter (Å) | 10.119 (10.0762,49 10.07151) | 5.2725 (5.193(2),50 5.1822 [This work]) |
| ErO8 bond lengths (Å) | 2.30–2.56 (2.182, 2.47149) | 2.13–2.49 |
| TiO6/ZrO6 bond lengths (Å) | 2.11–2.15 (1.95549) | 1.99–2.91 |
| x of O48f | 0.332 (0.420,49 0.32851) | — |
| Band gap (eV) | 3.0 (3.051) | 3.2 |
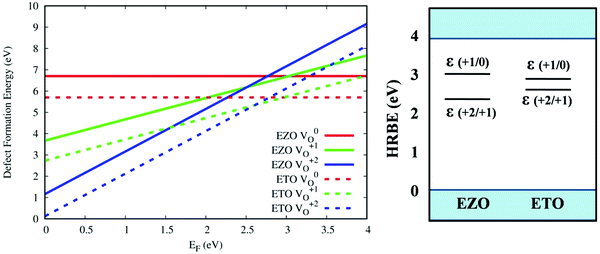
In order to determine the effect of the oxygen vacancies on the photoluminescence properties, defect formation energies in various charge states (V0O, VO+1 and VO+2) were calculated. The oxygen vacancies can be located in the ErO8 or TiO6 polyhedra. In order to find the most energetically favourable location for the oxygen vacancy, two calculations having a neutral oxygen vacancy (V0O) were performed, in which the vacant oxygen site was chosen in the first nearest-neighbour of the ErO8 and TiO6 polyhedra. Our DFT-GGA calculated defect energetics indicated that the introduction of a neutral oxygen vacancy is preferable in the TiO6 octahedra compared to the ErO8 polyhedra, with a vacancy formation energy difference of 2.47 eV. A similar exercise was performed for EZO and it was found that the oxygen vacancy was more favourable in the first nearest neighbour of Zr. To see how the defect formation energies of the oxygen vacancies in the dilute limit varied as a function of the Fermi energy, we have summarized the DFT-calculated formation energies of ETO and EZO in Fig. 9 (left panel). The calculated vacancy formation energy values indicate that the formation of VO+2 defects is favoured in near the valence band in the 0 to 2.65 eV and 0 to 2.30 eV range (on the EF–EV scale) for ETO and EZO, respectively, over VO+1 and V0O defects. This indicates that the oxygen vacancies have a tendency to donate electrons or behave as a n-type defect. Similarly, the formation of VO+1 defects is most favourable in the 2.65 to 2.80 eV and 2.30 eV to 3.0 eV ranges (on the EF–EV scale) for ETO and EZO, respectively, followed by formation of V0O defects. The DFT-GGA calculated electronic band gaps of ETO and EZO are 3.0 eV and 3.2 eV, respectively. We are unable to compare these band gap values as no experimental band gap has been reported in the literature. However, the previous FP-LMTO calculated band gap of ETO matches exactly with our DFT-GGA calculated value.
Fig. 9 (right panel) shows that the defect exhibits two charge-state transition levels: a deep donor level ε(+2/+1) at 2.65 eV and 2.30 eV for ETO and EZO, respectively, and another deep donor level ε(+1/0) at 2.8 eV and 3.0 eV for ETO and EZO, respectively. In this case, the impurity levels are defined as the charge-state transition levels (ε(q1/q2), from q1 to q2), i.e., the Fermi level locations at which the two charge states of the defect have the same formation energy. The obtained impurity levels are shown in a conventional band diagram with respect to the host referred binding energies (HRBE). The charge-state transition level situated at 2.80 eV and 3.0 eV, respectively, for ETO and EZO corresponds to wavelengths of 443 and 413 nm. The experimental photoluminescence emission spectra show a bright emission band at 430 nm and 425 nm, respectively. The DFT-GGA calculated charge transition levels qualitatively explain the origin of the brightest spectral feature of ETO and EZO.
3.8. No europium emission in EEZO and EETO: density of state calculations
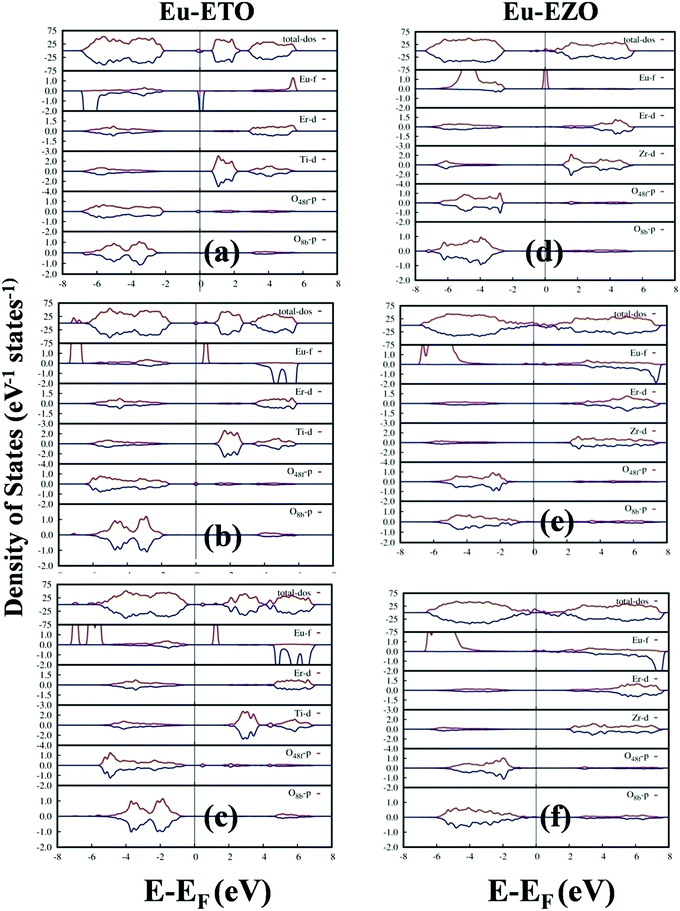
In our calculations, we considered a 1/88 (1.136%) Eu doping level in the defective cells of ETO and EZO in order to determine the effect of Eu doping on the photoluminescence properties of ETO and EZO. Previously, it was explained that the photoluminescence properties of ETO and EZO are dominated by neutral and/or charged oxygen-defect-related states. Fig. 10 shows the total and partial density of states (DOS) of Eu-doped ETO and EZO in the presence of a neutral oxygen vacancy (V0O), oxygen vacancy of charge +1 (VO+1) and oxygen vacancy of charge +2 (VO+2). Initially, two sets of calculations were performed in which the Eu atom was doped in the Er and Ti/Zr positions and the atomic positions were optimized keeping the volume and lattice shape fixed. It was found that Eu atom doped at the Er position was more energetically stable. The DOS shown in Fig. 10 were generated by doping the Eu atom at the Er position. Fig. 10 shows that the Eu f-states are dominantly distributed around the bottom edge of the valence band (VB) far from the Fermi energy, electronic band gap and top edge of the VB actively participating in the electronic transitions. Similarly, the Eu f-states are distributed around the top edge of the conduction band away from the electronic band-gap region. As a result, the active participation of the Eu-f states in electronic transitions giving rise to photoluminescence emission is impossible. This is also corroborated by the fact that the experimental photoluminescence emission of ETO and EZO was scarcely affected by Eu doping.4. Conclusions
In this work, undoped and doped EZO, ETO, EEZO, and EETO microcrystals with differing structures, defects, and ordering were synthesized using a ball-milling method. Rietveld-refined XRD and Raman spectroscopy confirmed the stabilization of undoped and doped ETO/EETO in the ordered pyrochlore structure and of EZO/EEZO in the defect fluorite structure. Synchrotron-based EXAFS measurements and PALS suggested a large concentration of defects in both samples, although the nature and concentration of defects in the zirconium material were quite different than in the titanium counterpart, with the possible formation of defect agglomerates and clusters in the former. Based on the PALS results, the effect of europium in defect evolution was found to be negligible for ETO, whereas it was substantial in the case of EZO. The undoped EZO and ETO hosts exhibited blue photoluminescence under UV light with a few weaker trivalent Er3+ spectral features in the green-yellow-red zone also. XANES studies confirmed that Ti and Zr stabilize in the +4 oxidation state, ruling out any contributions from trivalent Zr3+ and Ti3+ to the PL of EZO and ETO. The intense blue emission of ETO and EZO was ascribed to OVs, which were experimentally probed using EXAFS, and furthermore, the actual transitions involving OVs were confirmed using DFT calculated energetics. No characteristic europium emission was observed after europium doping, which was quite unexpected and interesting. The density of states calculations clearly suggest a mismatch between the Eu3+ f-state and the host band gap, inhibiting any kind of host-to-dopant energy transfer, and, hence, no red europium PL was observed. This work demonstrates the role of energy transfer, the band gap, and the choice of host and dopant in optimizing the optical properties of lanthanide-doped pyrochlore phosphors for efficient optoelectronics and scintillator applications.Conflicts of interest
There are no conflicts of interest to declare.References
- K. Alberi, M. B. Nardelli, A. Zakutayev, L. Mitas, S. Curtarolo, A. Jain, M. Fornari, N. Marzari, I. Takeuchi, M. L. Green, M. Kanatzidis, M. F. Toney, S. Butenko, B. Meredig, S. Lany, U. Kattner, A. Davydov, E. S. Toberer, V. Stevanovic, A. Walsh, N.-G. Park, A. Aspuru-Guzik, D. P. Tabor, J. Nelson, J. Murphy, A. Setlur, J. Gregoire, H. Li, R. Xiao, A. Ludwig, L. W. Martin, A. M. Rappe, S.-H. Wei and J. Perkins, The 2019 materials by design roadmap, J. Phys. D: Appl. Phys., 2018, 52, 013001 CrossRef PubMed.
- K. Khan, A. K. Tareen, M. Aslam, R. Wang, Y. Zhang, A. Mahmood, Z. Ouyang, H. Zhang and Z. Guo, Recent developments in emerging two-dimensional materials and their applications, J. Mater. Chem. C, 2020, 8, 387–440 RSC.
- J. Luo, X. Wang, S. Li, J. Liu, Y. Guo, G. Niu, L. Yao, Y. Fu, L. Gao, Q. Dong, C. Zhao, M. Leng, F. Ma, W. Liang, L. Wang, S. Jin, J. Han, L. Zhang, J. Etheridge, J. Wang, Y. Yan, E. H. Sargent and J. Tang, Efficient and stable emission of warm-white light from lead-free halide double perovskites, Nature, 2018, 563, 541–545 CrossRef CAS PubMed.
- K. Richardson, M. Kang, L. Sisken, A. Yadav, C. Blanco, M. Antia, S. Novak, C. Smith, A. Buff and A. Lepicard, Advances in infrared GRIN: a review of novel materials towards components and devices, Advanced Optics for Defense Applications: UV through LWIR III, International Society for Optics and Photonics, 2018, p. 106270A Search PubMed.
- B. B. Srivastava, S. K. Gupta and Y. Mao, Single red emission from upconverting ZnGa2O4:Yb,Er nanoparticles co-doped by Cr3+, J. Mater. Chem. C, 2020, 8, 6370–6379 RSC.
- C. Sun, K. Li and D. Xue, Searching for novel materials via 4f chemistry, J. Rare Earths, 2019, 37, 1–10 CrossRef CAS.
- A. P. Anantharaman and H. P. Dasari, Potential of pyrochlore structure materials in solid oxide fuel cell applications, Ceram. Int., 2020, 47(4), 4367–4388 CrossRef.
- Q. Deng, R. Gao, X. Li, J. Wang, Z. Zeng, J.-J. Zou and S. Deng, Hydrogenative Ring-Rearrangement of Biobased Furanic Aldehydes to Cyclopentanone Compounds over Pd/Pyrochlore by Introducing Oxygen Vacancies, ACS Catal., 2020, 10, 7355–7366 CrossRef CAS.
- S. K. Gupta, J. P. Zuniga, M. Abdou, M. P. Thomas, M. D. A. Goonatilleke, B. S. Guiton and Y. Mao, Lanthanide-doped lanthanum hafnate nanoparticles as multicolor phosphors for warm white lighting and scintillators, Chem. Eng. J., 2020, 379, 122314 CrossRef CAS.
- M. A. Sullivan, D. Stenger, A. Roma and M. Tynan, The future of nuclear power, Electr. J., 2014, 27, 7–15 CrossRef.
- A. Horvath and E. Rachlew, Nuclear power in the 21st century: Challenges and possibilities, Ambio, 2016, 45, 38–49 CrossRef CAS PubMed.
- N. C. Hyatt and M. I. Ojovan, Materials for Nuclear Waste Immobilization, Multidisciplinary Digital Publishing Institute, 2019 Search PubMed.
- F. Angeli, T. Charpentier, P. Jollivet, D. de Ligny, M. Bergler, A. Veber, S. Gin and H. Li, Effect of thermally induced structural disorder on the chemical durability of International Simple Glass, npj Mater. Degrad., 2018, 2, 31 CrossRef.
- M. Abdou, S. K. Gupta, J. P. Zuniga and Y. Mao, On structure and phase transformation of uranium doped La2Hf2O7 nanoparticles as an efficient nuclear waste host, Mater. Chem. Front., 2018, 2, 2201–2211 RSC.
- S. K. Gupta, M. Abdou, P. S. Ghosh, J. P. Zuniga and Y. Mao, Thermally Induced Disorder–Order Phase Transition of Gd2Hf2O7:Eu3+ Nanoparticles and Its Implication on Photo- and Radioluminescence, ACS Omega, 2019, 4, 2779–2791 CrossRef CAS PubMed.
- S. K. Gupta, P. Ghosh, C. Reghukumar, N. Pathak and R. Kadam, Experimental and theoretical approach to account for green luminescence from Gd2Zr2O7 pyrochlore: exploring the site occupancy and origin of host-dopant energy transfer in Gd2Zr2O7:Eu3+, RSC Adv., 2016, 6, 44908–44920 RSC.
- S. K. Gupta, K. Sudarshan, P. S. Ghosh, A. P. Srivastava, S. Bevara, P. K. Pujari and R. M. Kadam, Role of various defects in the photoluminescence characteristics of nanocrystalline Nd2Zr2O7: an investigation through spectroscopic and DFT calculations, J. Mater. Chem. C, 2016, 4, 4988–5000 RSC.
- S. K. Gupta, M. Abdou, P. S. Ghosh, J. P. Zuniga, E. Manoharan, H. Kim and Y. Mao, On comparison of luminescence properties of La2Zr2O7 and La2Hf2O7 nanoparticles, J. Am. Ceram. Soc., 2020, 103, 235–248 CrossRef CAS.
- L. Zhang, W. Zhang, J. Zhu, Q. Hao, C. Xu, X. Yang, L. Lu and X. Wang, Synthesis of Er2Ti2O7 nanocrystals and its electrochemical hydrogen storage behavior, J. Alloys Compd., 2009, 480, L45–L48 CrossRef CAS.
- J. Gaudet, A. M. Hallas, J. Thibault, N. P. Butch, H. Dabkowska and B. Gaulin, Experimental evidence for field-induced emergent clock anisotropies in the XY pyrochlore Er2Ti2O7, Phys. Rev. B, 2017, 95, 054407 CrossRef.
- N. B. Amor, M. Bejar, M. Hussein, E. Dhahri, M. Valente and E. Hlil, Synthesis, Magnetic Properties, Magnetic Entropy and Arrot Plot of Antiferromagnetic Frustrated Er2Ti2O7 Compound, J. Supercond. Novel Magn., 2012, 25, 1035–1042 CrossRef CAS.
- M. Martos, B. Julián-López, E. Cordoncillo and P. Escribano, Structural and spectroscopic study of a new pink chromium-free Er2(Ti,Zr)2O7 ceramic pigment, J. Am. Ceram. Soc., 2009, 92, 2987–2992 CrossRef CAS.
- M. Langlet, C. Coutier, J. Fick, M. Audier, W. Meffre, B. Jacquier and R. Rimet, Sol–gel thin film deposition and characterization of a new optically active compound: Er2Ti2O7, Opt. Mater., 2001, 16, 463–473 CrossRef CAS.
- M. Langlet, P. Jenouvrier, R. Rimet and J. Fick, Aerosol–gel deposition and spectroscopic characterization of pyrochlore films heavily doped with erbium ions, Opt. Mater., 2004, 25, 141–147 CrossRef CAS.
- S. Saha, S. Prusty, S. Singh, R. Suryanarayanan, A. Revcolevschi and A. Sood, Anomalous temperature dependence of phonons and photoluminescence bands in pyrochlore Er2Ti2O7: signatures of structural deformation at 130 K, J. Phys.: Condens. Matter, 2011, 23, 445402 CrossRef PubMed.
- H. Arfin, J. Kaur, T. Sheikh, S. Chakraborty and A. Nag, Bi3+–Er3+ and Bi3+–Yb3+ Codoped Cs2AgInCl6 Double Perovskite Near-Infrared Emitters, Angew. Chem., Int. Ed., 2020, 59, 11307–11311 CrossRef CAS PubMed.
- W. J. Mir, T. Sheikh, H. Arfin, Z. Xia and A. Nag, Lanthanide doping in metal halide perovskite nanocrystals: spectral shifting, quantum cutting and optoelectronic applications, NPG Asia Mater., 2020, 12, 9 CrossRef CAS.
- G. Pan, X. Bai, D. Yang, X. Chen, P. Jing, S. Qu, L. Zhang, D. Zhou, J. Zhu, W. Xu, B. Dong and H. Song, Doping Lanthanide into Perovskite Nanocrystals: Highly Improved and Expanded Optical Properties, Nano Lett., 2017, 17, 8005–8011 CrossRef CAS PubMed.
- M. Pokhrel, K. Wahid and Y. Mao, Systematic Studies on RE2Hf2O7:5%Eu3+ (RE = Y, La, Pr, Gd, Er, and Lu) Nanoparticles: Effects of the A-Site RE3+ Cation and Calcination on Structure and Photoluminescence, The, J. Phys. Chem. C, 2016, 120, 14828–14839 CrossRef CAS.
- T. Yamamoto, Assignment of pre-edge peaks in K-edge X-ray absorption spectra of 3d transition metal compounds: electric dipole or quadrupole?, X-Ray Spectrometry: An International Journal, 2008, 37, 572–584 CrossRef CAS.
- M. Sahoo, A. Yadav, S. Jha, D. Bhattacharyya, T. Mathews, N. Sahoo, S. Dash and A. Tyagi, Nitrogen location and Ti–O bond distances in pristine and N-doped TiO2 anatase thin films by X-ray absorption studies, J. Phys. Chem. C, 2015, 119, 17640–17647 CrossRef CAS.
- H. Gupta, S. Brown, N. Rani and V. Gohel, A lattice dynamical investigation of the Raman and the infrared frequencies of the cubic A2Hf2O7 pyrochlores, J. Phys. Chem. Solids, 2002, 63, 535–538 CrossRef CAS.
- M. Vandenborre, E. Husson, J. Chatry and D. Michel, Rare-earth titanates and stannates of pyrochlore structure; vibrational spectra and force fields, J. Raman Spectrosc., 1983, 14, 63–71 CrossRef CAS.
- D. Arenas, L. Gasparov, W. Qiu, J. Nino, C. H. Patterson and D. Tanner, Raman study of phonon modes in bismuth pyrochlores, Phys. Rev. B: Condens. Matter Mater. Phys., 2010, 82, 214302 CrossRef.
- M. Maczka, J. Hanuza, K. Hermanowicz, A. Fuentes, K. Matsuhira and Z. Hiroi, Temperature-dependent Raman scattering studies of the geometrically frustrated pyrochlores Dy2Ti2O7, Gd2Ti2O7 and Er2Ti2O7, J. Raman Spectrosc., 2008, 39, 537–544 CrossRef CAS.
- Q. Wang, A. Ghasemi, A. Scheie and S. Koohpayeh, Synthesis, crystal growth and characterization of the pyrochlore Er2Ti2O7, CrystEngComm, 2019, 21, 703–709 RSC.
- A. Banerji, B. Mandal, T. Sairam and A. Tyagi, Pressure induced structural stability studies on Nd2Zr2O7 pyrochlore, Solid State Commun., 2011, 151, 321–325 CrossRef CAS.
- M. Glerup, O. F. Nielsen and F. W. Poulsen, The structural transformation from the pyrochlore structure, A2B2O7, to the fluorite structure, AO2, studied by Raman spectroscopy and defect chemistry modeling, J. Solid State Chem., 2001, 160, 25–32 CrossRef CAS.
- M. de los Reyes, K. R. Whittle, Z. Zhang, S. E. Ashbrook, M. R. Mitchell, L.-Y. Jang and G. R. Lumpkin, The pyrochlore to defect fluorite phase transition in Y2Sn2−xZrxO7, RSC Adv., 2013, 3, 5090–5099 RSC.
- K. M. Turner, D. R. Rittman, R. A. Heymach, C. L. Tracy, M. L. Turner, A. F. Fuentes, W. L. Mao and R. C. Ewing, Pressure-induced structural modifications of rare-earth hafnate pyrochlore, J. Phys.: Condens. Matter, 2017, 29, 255401 CrossRef PubMed.
- R. D. Shannon, Revised effective ionic radii and systematic studies of interatomic distances in halides and chalcogenides, Acta Crystallogr., Sect. A: Cryst. Phys., Diffr., Theor. Gen. Crystallogr., 1976, 32, 751–767 CrossRef.
- H. Du, X. Yao, X. Zhang and H. Weng, Defect structure and dielectric properties of Bi-based pyrochlores probed by positron annihilation, Appl. Surf. Sci., 2006, 253, 1856–1860 CrossRef CAS.
- D. J. Gregg, Z. Zhang, G. J. Thorogood, B. J. Kennedy, J. A. Kimpton, G. J. Griffiths, P. R. Guagliardo, G. R. Lumpkin and E. R. Vance, Cation antisite disorder in uranium-doped gadolinium zirconate pyrochlores, J. Nucl. Mater., 2014, 452, 474–478 CrossRef CAS.
- R. Abe, M. Higashi, Z. Zou, K. Sayama and Y. Abe, Photocatalytic water splitting into H2 and O2 over R2Ti2O7 (R= Y, rare earth) with pyrochlore structure, Chem. Lett., 2004, 33, 954–955 CrossRef CAS.
- V. Venkatramu, S. F. León-Luis, U. R. Rodríguez-Mendoza, V. Monteseguro, F. J. Manjón, A. D. Lozano-Gorrín, R. Valiente, D. Navarro-Urrios, C. Jayasankar and A. Muñoz, Synthesis, structure and luminescence of Er3+-doped Y3Ga5O nano-garnets, J. Mater. Chem., 2012, 22, 13788–13799 RSC.
- K. Mondal, K. Hartman, D. Dasgupta, G. Trifon and M. Dasari, Synthesis and characterization of Y2Ti2O7 and ErxY2−xTi2O7 nanofibers, J. Sol-Gel Sci. Technol., 2015, 73, 265–269 CrossRef CAS.
- B. Malkin, T. Lummen, P. Van Loosdrecht, G. Dhalenne and A. Zakirov, Static magnetic susceptibility, crystal field and exchange interactions in rare earth titanate pyrochlores, J. Phys.: Condens. Matter, 2010, 22, 276003 CrossRef CAS PubMed.
- V. Nemoshkalenko, S. Borisenko, V. Uvarov, A. Yaresko, A. Vakhney, A. Senkevich, T. Bondarenko and V. Borisenko, Electronic structure of the R2Ti2O7 (R = Sm–Er, Yb, Lu) oxides, Phys. Rev. B: Condens. Matter Mater. Phys., 2001, 63, 075106 CrossRef.
- O. Knop, F. Brisse and L. Castelliz, Determination of the crystal structure of erbium titanate, Er2Ti2O7, by X-ray and neutron diffraction, Can. J. Chem., 1965, 43, 2812–2826 CrossRef CAS.
- F. Zhang, M. Lang, U. Becker, R. Ewing and J. Lian, High pressure phase transitions and compressibilities of Er2Zr2O7 and Ho2Zr2O7, Appl. Phys. Lett., 2008, 92, 011909 CrossRef.
- N. Deilynazar, E. Khorasani, M. Alaei and S. J. Hashemifar, First-principles insights into f magnetism: A case study on some magnetic pyrochlores, J. Magn. Magn. Mater., 2015, 393, 127–131 CrossRef CAS.
Footnote |
| † Electronic supplementary information (ESI) available. See DOI: 10.1039/d0ma00978d |
| This journal is © The Royal Society of Chemistry 2021 |

