 Open Access Article
Creative Commons Attribution 3.0 Unported Licence
Li–air battery and ORR activity of nanocarbons produced with good synthesis rate by solution plasma process†
Md. Zahidul
Islam
 a,
Anyarat
Watthanaphanit
b,
Sangwoo
Chae
 a and
Nagahiro
Saito
 *acde
*acde
aDepartment of Chemical Systems Engineering, Graduate School of Engineering, Nagoya University, Nagoya 464-8603, Japan. E-mail: hiro@sp.material.nagoya-u.ac.jp
bDepartment of Chemistry, Faculty of Science, Mahidol University, 272 Thanon Rama VI, Thung Phaya Thai, Ratchathewi, Bangkok 10400, Thailand
cJapan Research for Evolutional Science and Technology (CREST), Japan Science and Technology Agency (JST), Kawaguchi, Saitama 332-0012, Japan
dInstitutes for Innovation for Future Society, Nagoya University, Nagoya 464-8603, Japan
eConjoint Research Laboratory in Nagoya University, Shinshu University, Furo-cho, Chikusa, Nagoya 464-8603, Japan
First published on 4th March 2021
Abstract
Nanocarbons were successfully synthesized from benzene (BZ), nitro-benzene (BZ-NO2) and aniline (BZ-NH2) by solution plasma process (SPP). The SPP was generated by a bipolar pulsed power supply between two tungsten electrodes at room temperature. The synthesized nanocarbons were investigated. The highest synthesis rate, 40 mg min−1, was for the BZ nanocarbon. The transmission electron microscopy (TEM) morphology showed that the nanocarbon sizes were 15–25 nm. The Brunauer–Emmett–Teller (BET) analysis shows a highest surface area of 220 m2 g−1, pore size of 0.45 cm3 g−1, and average pore diameter of 20.0 nm for the BZ nanocarbon. Cyclic voltammetry (CV) in an acidic medium exhibited the oxygen reduction reaction (ORR) of the nanocarbons. The nanocarbon from BZ-NH2 obtained a high special capacity of 15![[thin space (1/6-em)]](https://www.rsc.org/images/entities/char_2009.gif) 500 mA h per g of carbon at the discharge rate of 0.1 mA cm−2 with 1.0 mg carbon loading for the lithium (Li)–air battery. The ORR is an important reaction in Li–air batteries and fuel cells for the application of next-generation batteries and energy conversion devices.
500 mA h per g of carbon at the discharge rate of 0.1 mA cm−2 with 1.0 mg carbon loading for the lithium (Li)–air battery. The ORR is an important reaction in Li–air batteries and fuel cells for the application of next-generation batteries and energy conversion devices.
1. Introduction
Recently, Li–air batteries have been used in energy conversion and storage devices for various applications.1–4 These face critical challenges that result from poor cycle life, low practical energy density, low round-trip efficiency, and high manufacturing costs. To improve the energy storage properties, catalytic activity and reduce the cost, ORR is demanded.5–7Presently, platinum (Pt) is commonly used as a catalyst for ORR but it has high cost in the production and long term instability.8–10 To introduce alternatives to Pt catalysts, nanocarbons and heteroatom-doped nanocarbon have attracted attention. The advantages of nanocarbons and heteroatom-doped nanocarbon are the low production cost, excellent chemical properties and higher electrical conductivity.11,12
Nanocarbons such as carbon black, carbon nanotubes, porous and nonporous carbon materials and graphene have shown large specific surface areas, high conductivity, electrocatalytic activity, mechanical capacity, ultra-light characteristics, and chemical and thermal resistance.13–18 Heteroatom (nitrogen, boron, and phosphorus) doped nanocarbon has shown the higher ORR activity.19–23
Previously, the nanocarbon materials have been successfully synthesized by catalytic or noncatalytic chemical vapor deposition, pyrolysis, electric arc discharge, and direct-current (DC) discharge plasma from various organic solvents.24–29 However, these synthesis techniques are complicated due to their high process temperatures, low production yield, and the processing time.30–33
Recently an energy saving and non-equilibrium liquid phase plasma named solution plasma process (SPP) has been used to synthesize nanocarbon materials at room temperature.34–38 In our laboratory, we conducted various experiments to produce carbon materials from organic solvents by SPP.39–42
In this research, nanocarbons were synthesised by SPP with different frequencies and pulse widths at an electrode distance of 0.75 mm for 30 min. The synthesis rate is the main target in the synthesis of the nanocarbons along with their electrocatalytic activity (such as in Li–air batteries and fuel cells) without thermal treatment compared to the commercial Pt/C catalyst. The catalytic activity for ORR was obtained in acidic medium. The crystallinity, structure, surface area, morphology, elemental composition, electrical conductivity, ORR activity and Li–air battery performance of the nanocarbons were investigated. In the case of the Li–air battery, the N-containing nanocarbon (nanocarbon of BZ-NH2) obtained a high special capacity of 15![[thin space (1/6-em)]](https://www.rsc.org/images/entities/char_2009.gif) 500 mA h per g of carbon compared with the nanocarbon of palm oils.
500 mA h per g of carbon compared with the nanocarbon of palm oils.
2. Experimental procedure
2.1. Materials
Benzene (>99%; Kanto Chemical Co., INC., Japan), nitrobenzene (>99%; Kanto Chemical Co., INC., Japan), aniline (>99%; Kanto Chemical Co., INC., Japan), polyvinylidene fluoride (PVDF, Sigma-Aldrich, Japan), N-methyl-2-pyrrolidone (NMP, Kanto Chemical Co., INC., Japan), acetone (Kanto Chemical Co., INC., Japan) and ethanol (Kanto Chemical Co., INC., Japan) were purchased.2.2. Experimental setup and production procedure
The experimental setup for SPP is shown in Fig. 1. The plasma was generated by a bipolar pulsed power supply (MPS-R06K01C-WP1-6CH, Kurita Co. Ltd, Japan) between two tungsten (W) electrodes (wire type, purity 99.9%, The Nilaco Corporation, Japan) with a 1 mm diameter, covered with an insulating ceramic tube. The electrode gap was 0.75 mm in the beginning. The concentrations of BZ, BZ-NO2, and BZ-NH2 are 50, 18, and 50 mg L−1, respectively. The applied high voltage had different pulse widths (0.5, 1.0 and 2 μs) and repetition frequencies (50, 100, and 150 kHz). The process time was 30 min. The current and voltage waveforms were observed using an oscilloscope (DLM 2022, Yokogawa Meters & Instruments Corporation, Japan) in the range of 0–5 A and 0.6–1.0 kV, respectively.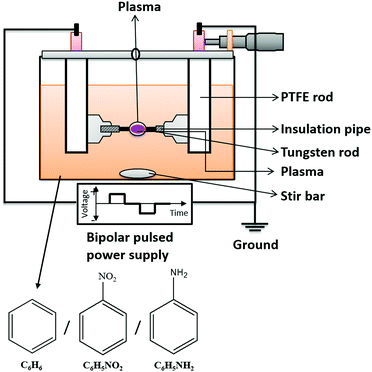 | ||
| Fig. 1 Schematic diagram of experimental setup with precursors BZ, BZ-NO2 and BZ-NH2 for solution plasma process (SPP). | ||
During SPP, the electrodes were adjusted several times, especially at high frequencies of SPP operation (i.e., 100 and 150 kHz) to keep a constant gap distance between the electrodes. Due to erosion, the electrode gap distance increases. This adjustment also has the role in maintaining a stable plasma during the process. If the electrode gap distance increases from 0.75 mm to 1 mm or more, the discharge stops. After the nanocarbon materials synthesis, the remaining liquid and solid phases were separated by filtration then dried at 90 °C for five hours in an oven (DX301, Yamato Co. Ltd, Japan). The weight of nanocarbon was measured using a balance (EK2000i, AS-ONE Co. Ltd, Japan). The carbon yield (Y in %) and synthesis rate (R in mg min−1) were calculated from the amount of carbon powders as:
| Y = (M/M0) × 100 |
2.3. Characterization
The structural properties were investigated by X-ray diffraction (XRD, Rigaku Smart lab, Rigaku Corporation, Japan) with a Cu Kα X-ray radiation source at λ = 0.154 nm in the 2θ range from 3.0 to 90.0 degrees and a scan speed of 3.0 degrees; and Raman spectroscopy (NRS-100, JASCO Corporation, Japan) used a laser with a wavelength of 532.5 nm and 1 mW power to determine the types of nanocarbons. The morphology, shape, and size of the nanocarbons were observed using transmission electron microscopy (TEM, JEM-2500SE, JEOL Ltd, Japan) with an electron gun at 200 kV. The surface area, pore volume, and average pore diameter were observed using the Brunauer–Emmett–Teller (BET, BELSORP-mini-II, BEL JAPAN, INC., Japan) method from the nitrogen adsorption–desorption isotherms at 77 K. The elemental compositions were observed by X-ray photoelectron spectroscopy (XPS, PHI 5000 Versa Probe II; Ulvac-Phi physical Electronics INC., Japan) using a Mg Kα X-ray source with a photon energy of 1253.6 eV. The electrical resistivity and electrical conductivity were determined using a four-point probe method (Laresta-GP, MCP-T610, Mitsubishi Chemical Analytech Co., Ltd, Japan). A concentration of 60 wt% of nanocarbons was mixed with 40 wt% polymer binder (PVDF) and then sonicated in NMP for 30 min. The emulsion was dropped on a glass substrate, then dried in an electric oven at 120 °C for 20 min to form a uniform film.2.4. Electrochemical measurements
Cyclic voltammetry (CV) measurements were conducted using a computer-controlled ALS-CH model 704 ES electrochemical analyzer (CH Instrument Inc.). The ink made by ultrasonication of the catalyst (5.0 mg), ultrapure water (480 mL), ethanol (480 mL), and Nafion® aqueous solution (40 mL) was obtained. The Ag/AgCl solution was applied as the counter and reference electrodes with 0.5 mol L−1 H2SO4 electrolyte under N2 and O2 gas saturation. The scan rate is 20 mV s−1 at −0.2 V to 1.2 V (V vs. Ag/AgCl).2.5. Fabrication of Li–air battery
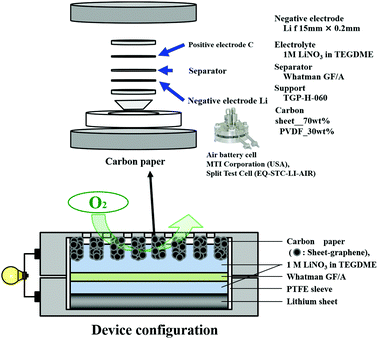
A Li–air battery was fabricated as shown in Fig. 2. The air electrode was fabricated by a mixture of nanocarbon and polyvinylidene difluoride (PVDF) as binder in a weight ratio of 70![[thin space (1/6-em)]](https://www.rsc.org/images/entities/char_2009.gif) :
:![[thin space (1/6-em)]](https://www.rsc.org/images/entities/char_2009.gif) 30 at 8 MPa. Lithium foil (thickness: 1 mm) was purchased (Honjo Chemical Corp., Japan). Air battery cells (MTI Corporation, USA) and the electrode of 1 M LiNO3 in tetraethylene glycol dimethyl ether (TEGDME) were used. Battery tests were conducted with a Solar Tron SI 1280 B at current density of 0.1 mA cm−2 for discharge and 0.5 mA cm−2 for charge. The cut-off voltage in the discharge was set to 2.0 V.
30 at 8 MPa. Lithium foil (thickness: 1 mm) was purchased (Honjo Chemical Corp., Japan). Air battery cells (MTI Corporation, USA) and the electrode of 1 M LiNO3 in tetraethylene glycol dimethyl ether (TEGDME) were used. Battery tests were conducted with a Solar Tron SI 1280 B at current density of 0.1 mA cm−2 for discharge and 0.5 mA cm−2 for charge. The cut-off voltage in the discharge was set to 2.0 V.
3. Results and discussion
3.1. Synthesis rate
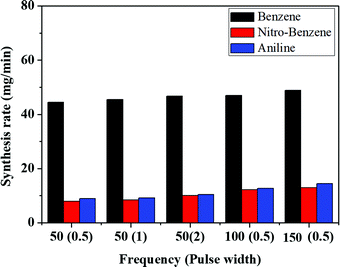
Nanocarbons were synthesized from BZ, BZ-NO2 and BZ-NH2 using SPP. After SPP, the synthesized nanocarbons were separated from the liquid, dried and the synthesis rates calculated (Fig. 3). The highest carbon yields (Y) for BZ, BZ-NO2 and BZ-NH2 are 1.92, 0.32 and 0.48%, respectively, at 150 kHz (see Table S1, ESI†). The nanocarbons were showed the lowest synthesis rates (42, 6 and 7 mg min−1) at 50 kHz, 0.5 μs, and highest synthesis rates (50, 13 and 15 mg min−1) at 150 kHz, 0.5 μs, for BZ, BZ-NO2 and BZ-NH2 respectively. It confirms that when the frequencies were gradually increased, the synthesis rate also increased with them.43 In the case of BZ, the synthesis rate of the nanocarbon was higher than for BZ-NO2 and BZ-NH2 due to their structures. It means that only the π-conjugated bond is successfully enhanced in the nanocarbon synthesis by SPP. The schematic of nanocarbon formation from BZ using SPP is shown in Fig. S1 (ESI†). In this study, the highest synthesis rates of the nanocarbons at 150 kHz, 0.5 μs are described for the future investigation. So far in the paper, we have selected for the discussion only the data corresponding to the frequency of 150 kHz with a pulse width of 0.5 μs.3.2. Morphology and surface area
The TEM images confirmed the morphology. The morphologies of the nanocarbons from BZ, BZ-NO2 and BZ-NH2 by SPP are seen in Fig. 4(a)–(c). The average diameters were in the 15–25 nm range with carbon in a ball-like shape.44 The nanocarbons were agglomerated with a few on the surface. The high-resolution TEM (HRTEM) images are shown in Fig. 4(a′)–(c′). Graphite-like structures with a good nanocarbon crystallinity were observed in the corresponding SAED images in Fig. 4(a′′)–(c′′). The SAED images show the (002), (100), and (101) planes of the nanocarbon. These data are confirmed in the XRD patterns.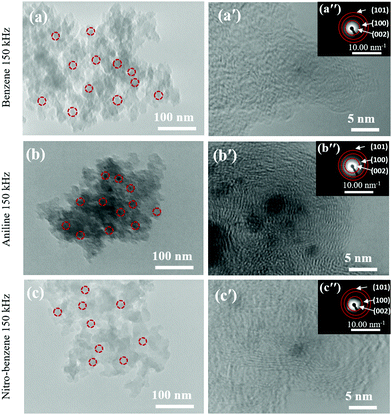 | ||
| Fig. 4 (a–c) TEM images of the nanocarbons; (a′–c′) HRTEM images; and (a′′–c′′) SAED patterns (inset) for BZ, BZ-NH2 and BZ-NO2 at 150 kHz and 0.5 μs. | ||
The nanocarbon characteristics such as surface area, pore size, and diameter were determined using the Brunauer–Emmett–Teller (BET) method (Table S2, ESI†). For the BZ, BZ-NH2 and BZ-NO2 nanocarbons, the BET surface areas were 220, 230 and 222 m2 g−1, the pore volumes were 0.45, 0.49 and 0.46 cm3 g−1, and the average pore diameters were 20.0, 17.0 and 15.0 nm, respectively. The nanocarbon from BZ-NH2 had an enhanced surface area of 230 m2 g−1.
3.3. Structural properties
The measured XRD patterns and Raman spectra are shown in Fig. 5. The XRD patterns of the BZ, BZ-NH2 and BZ-NO2 nanocarbons (Fig. 5(a)) show a large peak at 23° and a small broad peak at 44° which correspond to the (002) and (100)/(101) planes, respectively, of the nanocarbon.45,46 The small and broad carbon shapes suggested that the graphite plane (JCPDS 75-1621) had quite good crystallinity. The sharp peaks of tungsten carbide (WC) (JCPDS #25-1047) are observed in all the samples at 36°, 42°, 62° and 74° corresponding to the (111), (200), (220), (311) and (222) planes respectively.47 In the case of the BZ-NH2 and BZ-NO2 nanocarbons, the WC peaks were increased due to a higher sputtering of the tungsten electrode and the chemical structures compared with the nanocarbon from BZ. The chemical structures of BZ (C–C, C![[double bond, length as m-dash]](https://www.rsc.org/images/entities/char_e001.gif) C and C–H), BZ-NO2 (C–C, C
C and C–H), BZ-NO2 (C–C, C![[double bond, length as m-dash]](https://www.rsc.org/images/entities/char_e001.gif) C, C–N, N
C, C–N, N![[double bond, length as m-dash]](https://www.rsc.org/images/entities/char_e001.gif) O and C–H) and BZ-NH2 (C–C, C
O and C–H) and BZ-NH2 (C–C, C![[double bond, length as m-dash]](https://www.rsc.org/images/entities/char_e001.gif) C, C–N, N–H and C–H) are different. The sputtering rate depends on the chemical structure of the solvents even under the same plasma conditions. During the solution plasma process, the solution conversion pathway has an effect on the results.
C, C–N, N–H and C–H) are different. The sputtering rate depends on the chemical structure of the solvents even under the same plasma conditions. During the solution plasma process, the solution conversion pathway has an effect on the results.
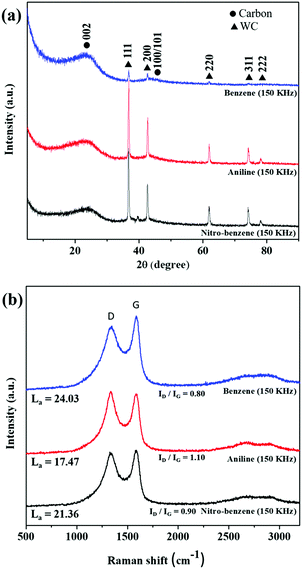 | ||
| Fig. 5 The structural properties of the nanocarbons. (a) XRD patterns, and (b) Raman spectra for the nanocarbons from BZ, BZ-NH2 and BZ-NO2 at 150 kHz and 0.5 μs. | ||
Fig. 5(b) shows that the D (1350 cm−1) and G (1600 cm−1) band Raman peaks were observed in all samples. The D-band showed the structural disorders and defects,48 and the G band referred to sp2 graphite sheet-like structure nanocarbon. The ID/IG ratios of (0.80, 1.10 and 0.9) for the BZ, BZ-NH2 and BZ-NO2 nanocarbons were respectively calculated from the peaks. The ID/IG values indicated the defect sites with degree of graphitization for the nanocarbons.49
The IG/ID ratio is related to the crystallite size La using the Tuinstra–Koenig relationship as follows:50
| La (nm) = (2.4 × 10⁻¹⁰)λ4(IG/ID), |
The XRD and Raman results corresponded with the TEM images and showed that the nanocarbons were graphite-like structures with crystallinity.
3.4. Electrical conductivity and composition
The four-point probe method was applied to the nanocarbons to identify resistance (Ω), surface resistance (Ω cm−2), resistivity (Ω cm−1) and electrical conductivity (S cm−1) (see Tables S3–S5, ESI,† and Fig. 6). So, we observed that when the resistivity (Ω cm−1) of the nanocarbon was decreased, the conductivity was increased. In the case of the BZ nanocarbon, it shows the highest electrical conductivity compared with the nanocarbons from BZ-NH2 and BZ-NO2. The elemental composition was found using XPS spectroscopy, as shown in Fig. S2 (ESI†). The BZ nanocarbon (C1s 99.6, and W4f 0.4 atom%), BZ-NH2 nanocarbon (C1s 98.2, N1s 1.6, and W4f 0.2 atom%), and BZ-NO2 nanocarbon (C1s 97.1, O1s 15.9, N1s 5.0 and W <0.1, atom%) were identified at 150 kHz and 0.5 μs. The XPS spectroscopy data showed that BZ nanocarbon contained carbon (C) and tungsten (W); BZ-NH2 nanocarbon contained carbon (C), nitrogen (N) and tungsten (W); and BZ-NO2 nanocarbon contained carbon (C), oxygen (O), nitrogen (N) and tungsten (W), corresponding with the XRD patterns.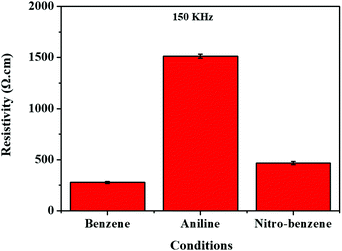 | ||
| Fig. 6 Electrical resistivity using the four probe method for the nanocarbons under various conditions. | ||
3.5. Catalytic activity
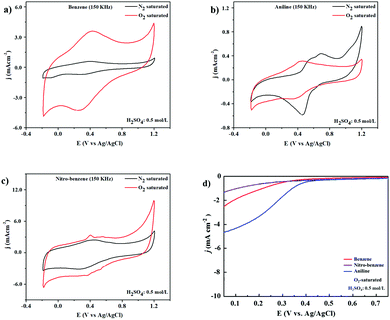
The ORR electrocatalytic activity was also tested in 0.5 mol L−1 H2SO4 solution with N2 and O2 saturation at 20 mV s−1 scan rate, as shown in Fig. 7(a)–(c). The anodic and cathodic peaks are shown in the potential range of −0.2 to 1.2 V. Under N2-saturation featureless CV curves can be observed for the BZ and BZ-NO2 nanocarbons as shown in Fig. 7(a) and (b). On the other hand, the CV curve with O2-saturated electrolyte shows a cathodic peak around 0.4 V corresponding to ORR. The ORR catalytic activity has use in fuel-cell applications as a cathode. Fig. 7d presents the LSV curves of BZ, BZ-NO2 and BZ-NH2 in O2-saturated 0.5 mol L−1 H2SO4 solution at a scan rate of 10 mV s−1 with a rotation speed of 1600 rpm. The LSV curve was obtained with an onset potential of 0.39 V for BZ-NH2. Moreover, the current density of BZ-NH2 was larger than for BZ and BZ-NO2 and was investigated. The BZ-NH2 nanocarbon showed a synergistic effect of N and WC on the ORR activity. The specific capacity shows such a difference to various nanocarbons due to the properties of the tungsten (W), nitrogen (N) and oxygen (O) containing nanocarbons. In the case of BZ-NH2, the synergistic effect of N and WC doping on the ORR activity was compared with BZ and BZ-NO2. BZ-NH2 showed enhanced carbon properties, such as surface area, resistivity, nitrogen configuration and degree of graphitization, which played a role in the improved ORR activity in the acid media compared with BZ and BZ-NO2.3.6. Li–air battery test
The electrochemical performances of the cell voltage and capacity of the Li–air batteries, the discharge of 1.0 mg cm−2 carbon loading in 1.0 atom of dry oxygen at 0.1 mA cm−2 rates, are shown in Fig. 8. The specific capacities of 2800, 3600, 6700 and 15![[thin space (1/6-em)]](https://www.rsc.org/images/entities/char_2009.gif) 000 mA h per g of carbon were identified for the nanocarbons from BZ-NO2, palm oils, BZ and BZ-NH2 respectively at the rate of 0.1 mA cm−2 with the 1.0 mg cm−2 carbon loading. The highest special capacity of 15
000 mA h per g of carbon were identified for the nanocarbons from BZ-NO2, palm oils, BZ and BZ-NH2 respectively at the rate of 0.1 mA cm−2 with the 1.0 mg cm−2 carbon loading. The highest special capacity of 15![[thin space (1/6-em)]](https://www.rsc.org/images/entities/char_2009.gif) 500 mA h per g of carbon was obtained for the BZ-NH2 nanocarbon, compared with the palm oils nanocarbon.
500 mA h per g of carbon was obtained for the BZ-NH2 nanocarbon, compared with the palm oils nanocarbon.
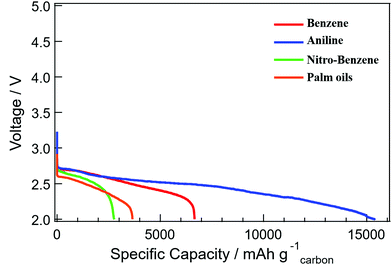 | ||
| Fig. 8 The discharge curves of the Li–air batteries with 1.0 mg carbon loadings at 0.1 mA cm−2 rates for nanocarbons from BZ, BZ-NH2, BZ-NO2 and palm oils. | ||
4. Conclusions
We have synthesized the nanocarbons by solution plasma process. The highest synthesis rate was observed for the nanocarbon from BZ. The graphite-like structure and the 15–25 nm sized nanocarbons were investigated using the TEM images supported by XRD and Raman spectroscopy measurements. In the ORR electrocatalytic activity of the nanocarbons, the cathodic peak at 0.4 V was clearly observed for all samples. The performance of the Li–air battery, with the highest special capacity of 15![[thin space (1/6-em)]](https://www.rsc.org/images/entities/char_2009.gif) 500 mA h per g of carbon for the BZ-NH2 nanocarbon, was compared with the nanocarbon of palm oils. We believe that SPP could be able to synthesise nanocarbons with electrocatalytic activity for applications such as Li–air batteries and fuel cells.
500 mA h per g of carbon for the BZ-NH2 nanocarbon, was compared with the nanocarbon of palm oils. We believe that SPP could be able to synthesise nanocarbons with electrocatalytic activity for applications such as Li–air batteries and fuel cells.
Conflicts of interest
There are no conflicts to declare.Acknowledgements
This research was financially supported by Core Research for Evolutional Science and Technology (CREST) of Japan Science and Technology Agency (JST). The grant number is JST/CREST∼Grant No. GJPMJCR12L1∼.Notes and references
- S. W. Lee, N. Yabuuchi, B. M. Gallant, S. Chen, B.-S. Kim, P. T. Hammond and Y. Shao-Horn, Nat. Nanotechnol., 2010, 5, 531 CrossRef CAS PubMed.
- A. Chen and P. Holt-Hindle, Chem. Rev., 2010, 110, 3767 CrossRef CAS PubMed.
- X. Ma, H. Meng, M. Cai and P. Shen, J. Am. Chem. Soc., 2012, 134, 1954 CrossRef CAS PubMed.
- Y. Zhao, L. Yang, S. Chen, X. Wang, Y. Ma, Q. Wu, Y. Jiang, W. Qian and Z. Hu, J. Am. Chem. Soc., 2013, 135, 1201 CrossRef CAS PubMed.
- B. Winther-Jensen, O. Winther-Jensen, M. Forsyth and D. R. MacFarlane, Science, 2008, 321, 671 CrossRef CAS PubMed.
- Y. Zheng, Y. Jiao, J. Chen, J. Liu, J. Liang, A. Du, W. Zhang, Z. Zhu, S. C. Smith, M. Jaroniec, G. Q. Lu and S. Z. Qiao, J. Am. Chem. Soc., 2011, 133, 20116 CrossRef CAS PubMed.
- Z. Schnepp, Y. Zhang, M. J. Hollamby, B. R. Pauw, M. Tanaka, Y. Matsushita and Y. Sakka, J. Mater. Chem. A, 2013, 1, 13576 RSC.
- H. Wang, T. Maiyalagan and X. Wang, ACS Catal., 2012, 2, 781 CrossRef CAS.
- C. Soldano, A. Mahmood and E. Dujardin, Carbon, 2010, 48, 2127–2150 CrossRef CAS.
- A. Manikandan, L. Lee, Y.-C. Wang, C.-W. Chen, Y.-Z. Chen, H. Medina, J.-Y. Tseng, Z. M. Wang and Y.-L. Chueh, J. Mater. Chem. A, 2017, 5, 13320–13328 RSC.
- Z. Yang, W. Sun, L. Wang, Z. Wan, J. Wang, S. Wang and G. Liu, Corros. Sci., 2020, 175, 108860 CrossRef CAS.
- M. Topsakal, H. Şahin and S. Ciraci, Phys. Rev. B: Condens. Matter Mater. Phys., 2012, 85, 155445 CrossRef.
- J. Liang, Y. Jiao, M. Jaroniec and S. Z. Qiao, Angew. Chem., Int. Ed., 2012, 51, 11496–11500 CrossRef CAS PubMed.
- Q. Lv, W. Si, J. He, L. Sun, C. Zhang, N. Wang, Z. Yang, X. Li, X. Wang and W. Deng, Nat. Commun., 2018, 9, 1–11 CrossRef PubMed.
- S. Chen, A. Zehri, Q. Wang, G. Yuan, X. Liu, N. Wang and J. Liu, ChemistryOpen, 2019, 8, 58–63 CrossRef CAS PubMed.
- W. Lei, H. M. Barnes, J. Zhang and Z. Cai, Wood Fiber Sci., 2017, 49, 22–32 Search PubMed.
- S. W. Lee, B. M. Gallant, H. R. Byon, P. T. Hammond and Y. Shao-Horn, Energy Environ. Sci., 2011, 4, 1972 RSC.
- S. W. Lee, B.-S. Kim, S. Chen, Y. Shao-Horn and P. T. Hammond, J. Am. Chem. Soc., 2009, 131, 671 CrossRef CAS PubMed.
- A. Watthanaphanit, G. Panomsuwan and N. Saito, RSC Adv., 2014, 4, 1622 RSC.
- G. Panomsuwan, A. Watthanaphanit, T. Ishizaki and N. Saito, Phys. Chem. Chem. Phys., 2015, 17, 13794 RSC.
- T. Ishizaki, S. Chiba, Y. Kaneko and G. Panomsuwan, J. Mater. Chem. A, 2014, 2, 10589–10598 RSC.
- T. Morishita, T. Ueno, G. Panomsuwan, J. Hieda, A. Yoshida, M. A. Bratescu and N. Saito, Sci. Rep., 2016, 6, 36880 CrossRef CAS PubMed.
- X. Hu, X. Shen, O. Takai and N. Saito, J. Alloys Compd., 2013, 552, 351–355 CrossRef CAS.
- S. Chae, G. Panomsuwan, M. A. Bratescu, K. Teshima and N. Saito, ACS Appl. Nano Mater., 2019, 2, 1350–1355 CrossRef CAS.
- C. Chokradjaroen, S. Kato, K. Fujiwara, H. Watanabe, T. Ishii and T. Ishizaki, Sustainable Energy Fuels, 2020, 4, 4570–4580 RSC.
- O. L. Li, S. Chiba, Y. Wada, G. Panomsuwan and T. Ishizaki, J. Mater. Chem. A, 2017, 5, 2073–2082 RSC.
- M. A. Bratescu, O. Takai and N. Saito, J. Alloys Compd., 2013, 562, 74–83 CrossRef CAS.
- K. Hyun, T. Ueno, O. L. Li and N. Saito, RSC Adv., 2016, 6, 6990–6996 RSC.
- C. H. Choi, S. H. Park and S. I. Woo, J. Mater. Chem., 2012, 22, 12107–12115 RSC.
- G. Panomsuwan, N. Saito and T. Ishizaki, J. Mater. Chem. A, 2015, 3, 9972–9981 RSC.
- N. Thongwichit, O. L. H. Li, W. Yaowarat, N. Saito and U. Suriyapraphadilok, Jpn. J. Appl. Phys., 2016, 55, 01AE10 CrossRef.
- J. Kim, J. Chun, S.-G. Kim, H. Ahn and K. C. Roh, J. Electrochem. Sci. Technol., 2017, 8, 338–343 CrossRef CAS.
- D.-w. Kim, O. L. Li and N. Saito, Phys. Chem. Chem. Phys., 2014, 16, 14905–14911 RSC.
- O. Takai, Pure Appl. Chem., 2008, 80, 2003–2011 CAS.
- G. Panomsuwan, N. Saito and T. Ishizaki, Phys. Chem. Chem. Phys., 2015, 17, 6227 RSC.
- W. Wang, S. Chakrabarti, Z. Chen, Z. Yan, M. O. Tade, J. Zou and Q. Li, J. Mater. Chem. A, 2014, 2, 2390–2396 RSC.
- T. Sudare, T. Ueno, A. Watthanaphanit and N. Saito, Phys. Chem. Chem. Phys., 2015, 17, 30255–30259 RSC.
- K. Hyun, T. Ueno, O. L. Li and N. Saito, RSC Adv., 2016, 6, 6990–6996 RSC.
- T. Morishita, T. Ueno, G. Panomsuwan, J. Hieda, A. Yoshida, M. A. Bratescu and N. Saito, Sci. Rep., 2016, 6, 36880 CrossRef CAS PubMed.
- J. Kang, O. L. Li and N. Saito, Nanoscale, 2013, 5, 6874 RSC.
- D. Kim, O. L. Li, P. Pootawang and N. Saito, RSC Adv., 2014, 4, 16813 RSC.
- S. Lee, Y. Heo, M. A. Bratescu, T. Ueno and N. Saito, Phys. Chem. Chem. Phys., 2017, 19, 15264–15272 RSC.
- O. L. Li, H. Hayashi, T. Ishizaki and N. Saito, RSC Adv., 2016, 6, 51864 RSC.
- D. Kim, O. L. Li and N. Saito, Phys. Chem. Chem. Phys., 2015, 17, 407 RSC.
- G. Panomsuwan, S. Chiba, Y. Kaneko, N. Saito and T. Ishizaki, J. Mater. Chem. A, 2014, 2, 18677 RSC.
- X. Zhang and Z. Lix, Nanoscale, 2012, 4, 707–714 RSC.
- T. Murphy, R. Hayes, S. Imberti, G. G. Warr and R. Atkin, Phys. Chem. Chem. Phys., 2014, 16, 13182–13190 RSC.
- K. F. Adekunle, Open J. Polym. Chem., 2015, 5, 34–40 CrossRef CAS.
- N. Taufiqurrahmi and S. Bhatia, Energy Environ. Sci., 2011, 4, 1087–1112 RSC.
- L. G. Cançado, K. Takai, T. Enoki, M. Endo, Y. A. Kim, H. Mizusaki, A. Jorio, L. N. Coelho, R. M. Paniago and M. A. Pimenta, Appl. Phys. Lett., 2006, 88, 163106 CrossRef.
Footnote |
| † Electronic supplementary information (ESI) available. See DOI: 10.1039/d0ma00926a |
| This journal is © The Royal Society of Chemistry 2021 |

