
 Open Access Article
 This Open Access Article is licensed under a Creative Commons Attribution-Non Commercial 3.0 Unported Licence
Dual function organic active materials for nonaqueous redox flow batteries†
N. Harsha
Attanayake
 ab,
Zhiming
Liang
a,
Yilin
Wang
cd,
Aman Preet
Kaur
ab,
Sean R.
Parkin
a,
Justin K.
Mobley
a,
Randy H.
Ewoldt
cd,
James
Landon
ef and
Susan A.
Odom
*ab
ab,
Zhiming
Liang
a,
Yilin
Wang
cd,
Aman Preet
Kaur
ab,
Sean R.
Parkin
a,
Justin K.
Mobley
a,
Randy H.
Ewoldt
cd,
James
Landon
ef and
Susan A.
Odom
*ab
aDepartment of Chemistry, University of Kentucky, Lexington, KY 40506, USA
bJoint Center for Energy Storage Research, University of Kentucky, Lexington, KY 40506, USA
cDepartment of Mechanical Science and Engineering, University of Illinois, Urbana-Champaign, Illinois 61820, USA
dJoint Center for Energy Storage Research, University of Illinois, Urbana-Champaign, Illinois 61820, USA
eDepartment of Chemical and Materials Engineering, University of Kentucky, Lexington, KY 40506, USA
fCenter for Applied Energy Research, University of Kentucky, Lexington, KY 40511, USA
First published on 31st December 2020
Abstract
Nonaqueous electrolytes require the inclusion of supporting salts to achieve sufficient conductivity for battery applications. In redox flow batteries (RFBs) wherein solutions contain active species at molar values, the presence of supporting salts can reduce the solubility of organic active materials, limiting battery capacity. Here we sought to design organic materials in which permanently charged substituents keep ionic conductivity high while at the same time increasing the maximum concentration of the charge-storing redox moiety to operate all organic supporting-salt-free full flow cell cycling for the first time. Toward this goal, we synthesized redox-active phenothiazine and viologen derivatives bearing permanent charges. We employed these highly soluble materials as RFB electrolytes without adding supporting salts. Using an anion-selective membrane, a flow cell containing 0.25 M active species cycled stably over 100 cycles (433 h), losing an average of only 0.14% capacity per cycle and 0.75% per day, with post-cycling analysis showing no evidence of decomposition. Further, higher concentration cycling (0.75 M – electron) accessing both reductions of viologen, achieved a cell potential of 1.80 V with 18.3 A h L−1, high volumetric capacity, only losing an average of 0.90% capacity per day. These results show a new avenue to improve two performance aspects with one molecular modification.
Introduction
The demand for scalable stationary electrical energy storage systems is expanding due to the need to implement a greater quantity of intermittent renewable energy sources, including solar and wind, onto the electrical grid.1,2 Over the past few decades, a number of grid-scale energy storage technologies have been introduced, including thermal, pumped hydro, compressed air, and chemical/electrochemical systems.2 As storage needs increase, electrochemical devices have received more attention, as they can be installed without the geographical/geological restrictions placed on technologies that require movement of air or water, and have the benefit of being more energy dense.3 Redox flow batteries (RFBs) have been recognized as a promising technology for grid-scale energy storage because of improved safety versus metal-ion batteries, their decoupled energy and power, and simple manufacturing.4–6 Despite these promising characteristics, high system prices (>$500 per kW h in 2014) and limited bankability have prevented widespread adoption of RFBs.7,8 The development of high performing, scalable, low-cost redox-active materials is crucial to facilitating the implementation of these sustainable energy storage systems.State-of-the-art RFBs are based on aqueous chemistries that include metals (e.g. vanadium, iron/bromine), with those containing organic species more recently catching up in performance.9–11 Transitioning from aqueous chemistries to nonaqueous counterparts offers an opportunity to achieve higher energy densities by raising cell voltages via accessing redox events with greater differences in potential, enabled by the wider electrochemical windows of nonaqueous electrolytes compared to their aqueous counterparts.12–15 Additionally, the design space of redox couples can be expanded with nonaqueous electrolytes by allowing the inclusion of species that are otherwise incompatible with aqueous systems due to limited solubility and/or stability in aqueous solutions, or that possess redox potentials that lie outside the electrochemical stability window of aqueous electrolytes.13,14,16
Redox-active organic molecules are of particular interest for low-cost RFBs because they consist of earth abundant elements (e.g. carbon, oxygen, and hydrogen). Further, molecular species (rather than metal ions) provide an opportunity to modify physical and electrochemical properties (e.g. solubility, electrochemical stability, redox potential, and ionic conductivity) to better meet performance requirements.6,17–19 While recent molecular engineering efforts have focused on multi-property optimization to increase active species solubility and stability for high energy density RFBs,14,16 to date, only a few molecular cores have shown promise as potential active materials, including derivatives of benzoquinone,20,21 anthraquinone,18,22–24 nitroxyl radicals,19,25 dialkoxybenzenes,26,27 phenazine,13,17,28 cyclopropeniums,12,29 pyridiniums,16,30 viologen,31–35 and phenothiazine.6,14,35,36 Although a large variety of organic redox couples demonstrate stable cycling in nonaqueous RFBs, in many cases, results were obtained from flow cells operated at low concentrations,4,26,30,33,36 some of which are a result of limited active species solubility – especially in their charged forms. It is important to evaluate active materials at concentrations used in commercial cells so that performance metrics and limitations can be identified.
Supporting electrolytes play a critical role in nonaqueous RFBs wherein polar aprotic solvents are used to dissolve the active materials that store energy in the solution phase. In general, organic solvents have low ionic conductivities compared to the electrolytes employed in RFBs. For instance, the ionic conductivities of acetonitrile (ACN) and propylene carbonate (PC) are 6 × 10⁻⁷ mS cm−1 and 1 × 10⁻⁵ mS cm−1, respectively,37 whereas typical RFB supporting electrolytes have ionic conductivities ranging from approximately 3–60 mS cm−1 for nonaqueous and from 80–400 mS cm−1 for aqueous systems.37,38 Thus, RFBs based on nonaqueous electrolytes require supporting salts for sufficiently high ionic conductivity. Furthermore, supporting salts are required to balance electroneutrality while charging and discharging the cell. However, high supporting salt concentrations may suppress the solubility of the active species in one or more states of charge, reducing the volumetric capacity of the cell.6,39 In addition, higher concentrations of supporting salt may limit the ionic conductivity of the membrane and increase area specific resistance (ASR), which prevent flow cells from operating at high current densities.39,40 According to a recently proposed techno-economic model, future pricing for supporting salts in nonaqueous RFB electrolytes must reach a value of approximately $5 kg−1 in order to reach the United States Department of Energy cost target ($150 per kW h).7,41 Therefore, developing multifunctional active species that serve as redox-active species as well as serving as the supporting salt in the RFB environment could eliminate the use of costly supporting salts. For this purpose, Milshtein et al. introduced metal–organic compounds containing common ions (tetrafluoroborates) to operate supporting-salt-free nonaqueous RFBs at low concentrations as a proof-of-concept demonstration.42 Further, Robinson et al. demonstrated the feasibility of doing supporting-salt-free symmetric nonaqueous RFB cycling utilizing an ionic cyclopropenium derivative.43 However, an all organic full flow cell cycling in a supporting-salt-free environment has not yet been reported.56 In a common ion-exchange system, both redox-active species (posolyte and negolyte) contained positively charged groups, and common counter ions migrate between positive and negative sides of the cell through an ion-exchange membrane to maintain the electroneutrality of the cell. Inspired by these studies, we sought to develop highly soluble, all-organic, common-ion-exchange active materials to be applied in nonaqueous RFBs in the absence of supporting salt.
Here we report the synthesis and characterization of two redox-active materials that simultaneously enhance solubility and ionic conductivity in the polar aprotic solvent ACN, as illustrated in Fig. 1. In one case, we incorporated a branched ionic group in the alkyl substituent of a posolyte material. In the second, glycol chains at the N positions of the negative material. The phenothiazine core in EPRT-TFSI (ethylpromethazine bis(trifluoromethanesulfonyl)imide, Fig. 1, red) is oxidized to its radical cation form (total species charge +2) during charging, while MEEV-(TFSI)2 (bis(2-(2-methoxyethoxy)ethyl)viologen bis(bis(trifluoromethanesulfonyl)imide), Fig. 1, blue) is reduced from a dication to its radical cation form (species charge +1); at the same time, the TFSI− (green) migrates from the negolyte to the posolyte through an ion-exchange membrane. In both cases, the solubility and ionic conductivity of redox-active materials increased. Furthermore, both the active species and the counter ions contribute to the ionic conductivity in nonaqueous solvents. This dual property improvement allowed us to study all-organic, redox-active ionic species in a supporting-salt-free environment at high concentrations in full flow cell cycling experiments for the first time.
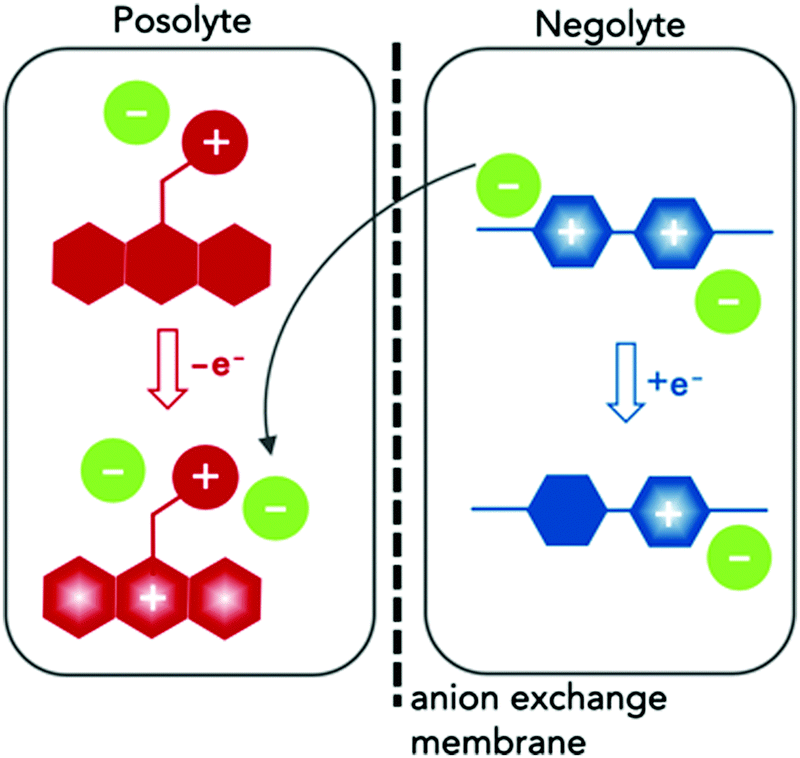 | ||
| Fig. 1 Schematic of the charging process in redox flow cell containing dual-function active materials. During charging, the neutral conjugated core of the ionic phenothiazine (red) is oxidized to its radical cation form, and the dicationic viologen (blue) core is reduced to its radical cation form. Movement of one TFSI− ion (green) from the negolyte solution to the posolyte solution serves to balance charge. | ||
Results and discussion
Synthesis
EPRT-TFSI was prepared in three steps from commercially available materials. First, promethazine hydrochloride was treated with aqueous potassium carbonate to yield neutral promethazine (PRT, or 2-(N,N-dimethylamino)propylphenothiazine). An ethyl group was installed at the trialkylated N position of PRT to yield the ionic phenothiazine, ethylpromethazine bromide (EPRT-Br). Finally, bromide was exchanged with the bis(trifluoromethanesulfonyl)imide (TFSI−) to yield ethylpromethazine bis(trifluoromethanesulfonyl)imide (EPRT-TFSI). Bis(2-(2-methoxyethoxy)ethyl)viologen bis(bis(trifluoromethanesulfonyl)imide) (MEEV-(TFSI)2) was synthesized via the double alkylation of 4,4′-bipyridine and subsequent ion exchange of bromide with TFSI−. The reaction schemes for the synthesis of EPRT-TFSI and MEEV-(TFSI)2 are shown in Fig. 2. Also shown are the thermal ellipsoid plots from X-ray diffraction of single crystals of both products. Synthetic procedures and characterization details are reported in the ESI.†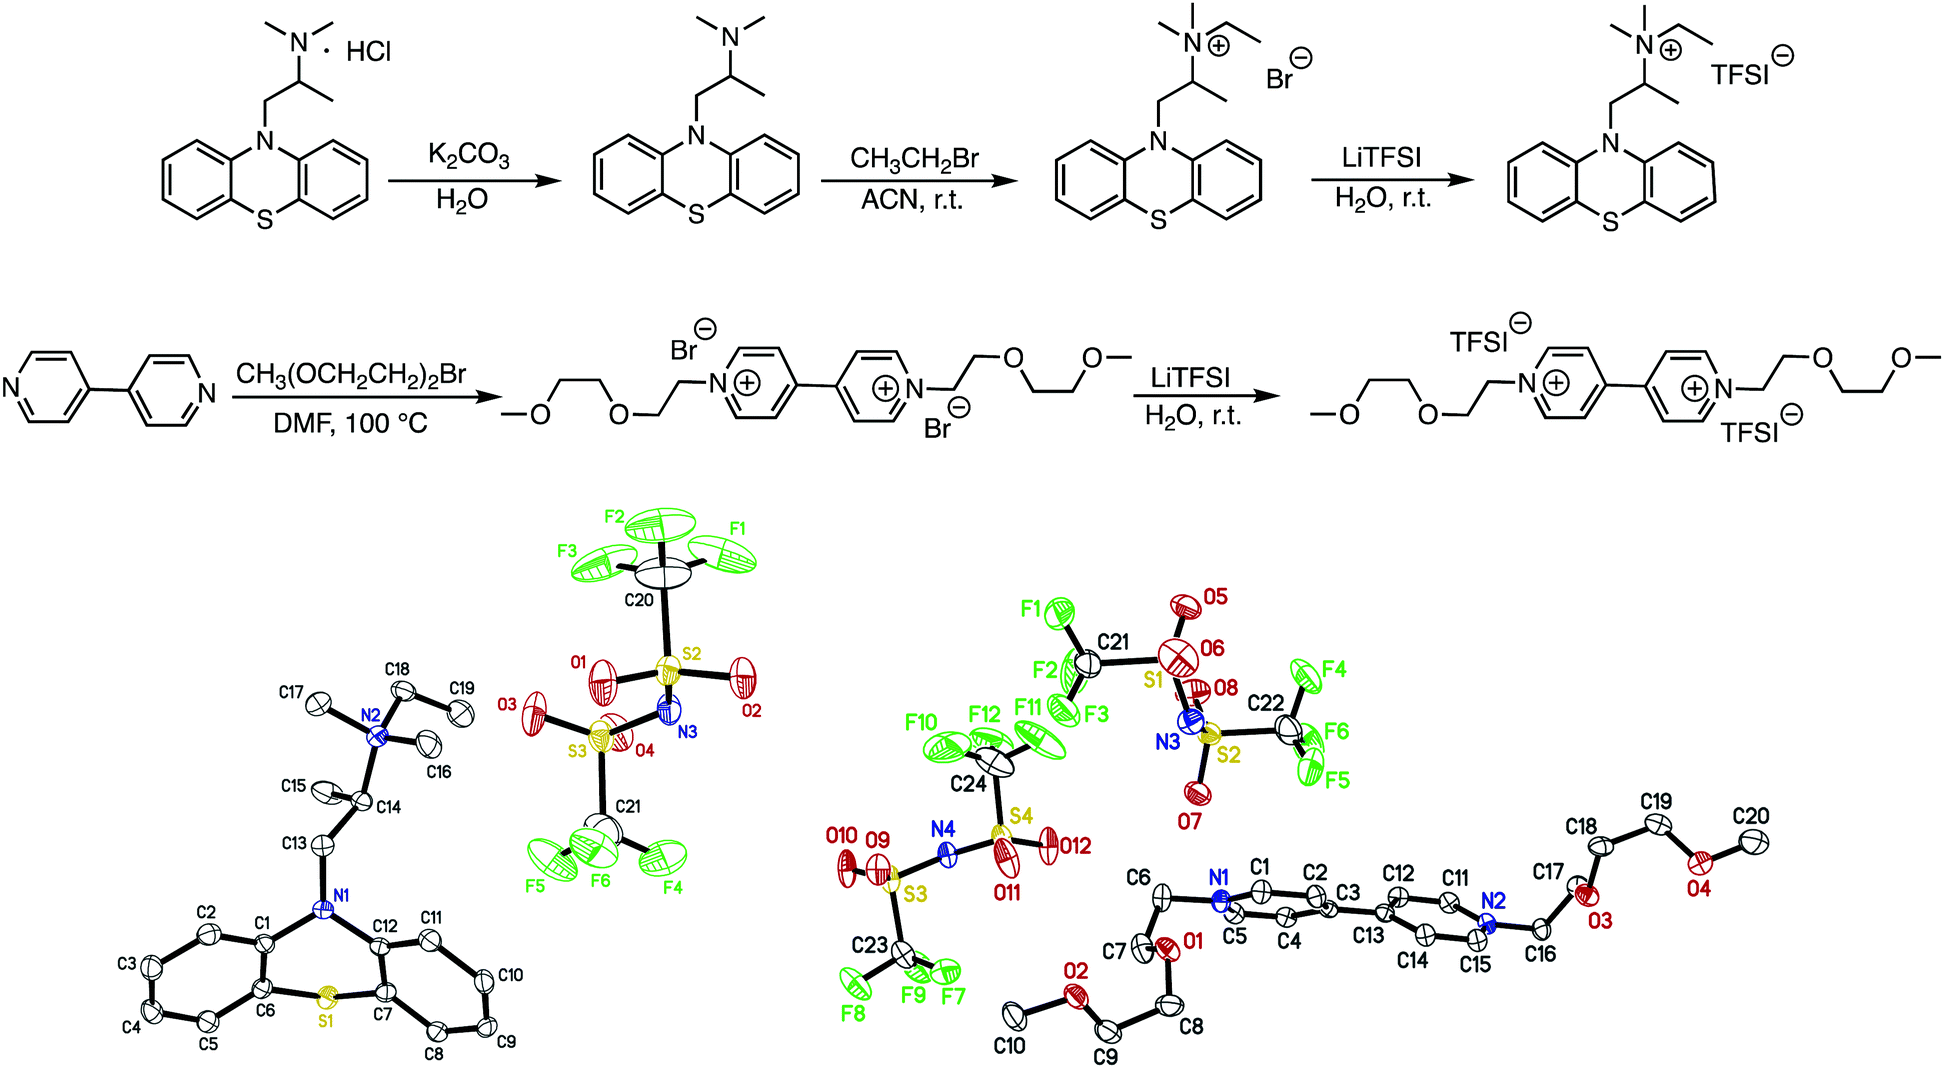 | ||
| Fig. 2 Synthesis of ethylpromethazine bis(trifluoromethanesulfonyl)imide (EPRT-TFSI) and bis(2-(2-methoxyethoxy)ethyl)viologen bis(bis(trifluoromethanesulfonyl)imide) (MEEV-(TFSI)2). Thermal ellipsoid (50% probability) plots of EPRT-TFSI (bottom left) and MEEV-(TFSI)2 (bottom right), obtained from single-crystal X-ray diffraction experiments. | ||
Ionic conductivity, viscosity, and diffusivity
To determine the viability of performing electrochemical analyses of EPRT-TFSI and MEEV-(TFSI)2 in the absence of supporting electrolyte, the ionic conductivities of solutions containing 0.25, 0.50, 0.75, and 1.00 M in active materials were measured. For comparison, the ionic conductivity of the commercially available supporting salt tetraethylammonium bis(trifluoromethanesulfonyl)imide (TEATFSI) – selected because of the common TFSI anion and, also containing a nitrogen-based cation – was measured at the same concentrations. Further, because ionic conductivity depends on the ionic strength, viscosity, and diffusivity of an active species, the viscosity and diffusivity of the active species were measured at these concentrations. Fig. 3 shows the ionic conductivity (Fig. 3a), viscosity (Fig. 3b), and diffusivity (Fig. 3c) in ACN for each electrolyte solution as a function of concentration, with a summary of data provided in Table 1, with additional details and data provided in Section V of the ESI.†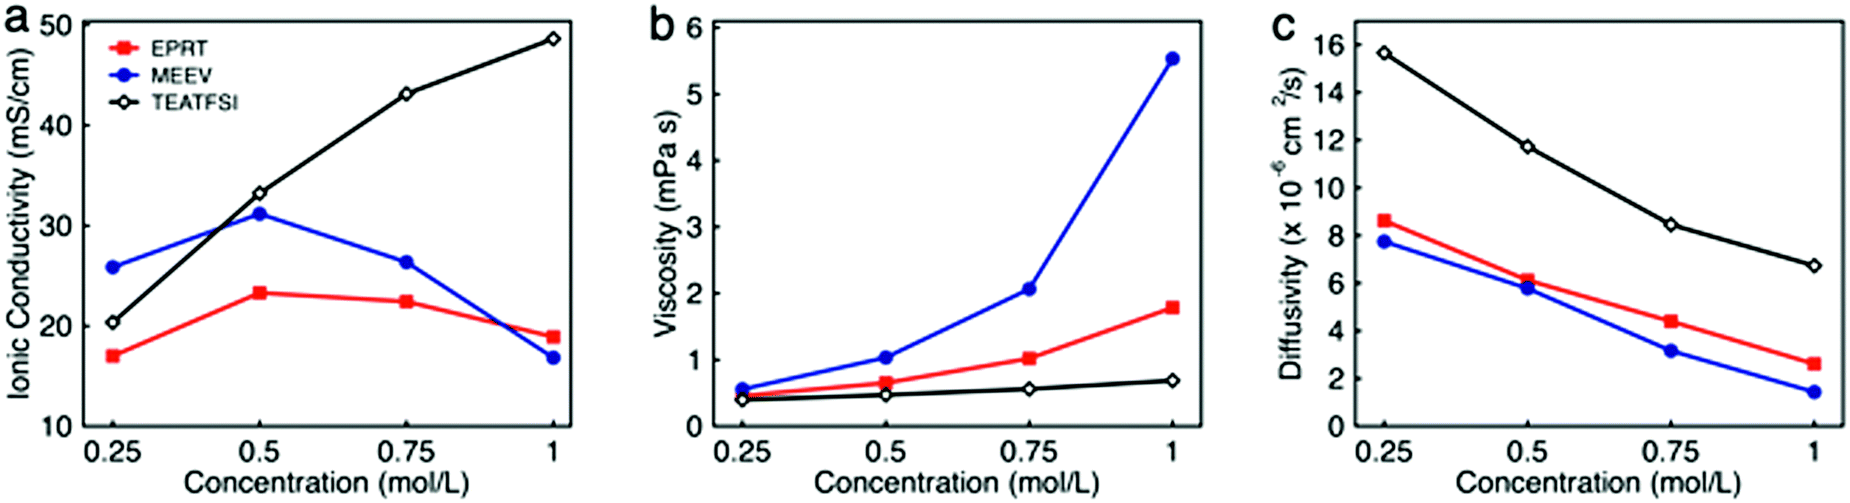 | ||
| Fig. 3 The ionic conductivity (a), viscosity (b), and diffusivity (c) of EPRT-TFSI, MEEV-(TFSI)2, and TEATFSI at 0.25, 0.50, 0.75, and 1.00 M in ACN. The uncertainties associated with measurements are reported in the Table S1 (ESI†), as the uncertainty bars are smaller than the symbol size on the graphs. | ||
| Solution | Concentration (M) | Conductivity (mS cm−1) | Viscosity (mPa s) | Diffusivity (×10−6 cm2 s−1) |
|---|---|---|---|---|
| The diffusivity of cationic, EPRT+, MEEV2+, and TEA+ were measured in CD3CN.a Values from ref. 37. | ||||
| ACN | N/A | 6 × 10⁻¹⁰![[thin space (1/6-em)]](https://www.rsc.org/images/entities/char_2009.gif) a a |
0.34a | N/A |
| EPRT-TFSI in ACN | 0.25 | 17.00 | 0.458 | 8.62 |
| 0.50 | 23.30 | 0.652 | 6.12 | |
| 0.75 | 22.43 | 1.02 | 4.40 | |
| 1.00 | 18.91 | 1.78 | 2.62 | |
| MEEV-(TFSI)2 in ACN | 0.25 | 25.86 | 0.556 | 7.75 |
| 0.50 | 31.18 | 1.03 | 5.78 | |
| 0.75 | 26.36 | 2.07 | 3.16 | |
| 1.00 | 16.83 | 5.53 | 1.43 | |
| TEA-TFSI in ACN | 0.25 | 20.35 | 0.396 | 15.6 |
| 0.50 | 33.22 | 0.472 | 11.7 | |
| 0.75 | 43.14 | 0.560 | 8.46 | |
| 1.00 | 48.63 | 0.687 | 6.73 | |
Ionic conductivity measurements were carried out on EPRT-TFSI, MEEV-(TFSI)2, and TEATFSI at 0.25, 0.50, 0.75, and 1.00 M in ACN at 25 °C using an Orion Star A212 conductivity meter (Thermo Scientific). (See Section V.1 of the ESI† for details.) At 0.25 M, MEEV-(TFSI)2 exhibited the highest ionic conductivity, presumably due to the higher ionic strength of the divalent cation in MEEV-(TFSI)2 compared to EPRT-TFSI and TEATFSI, which are both monovalent. The conductivity of MEEV-(TFSI)2 is greater than the conductivity of EPRT-TFSI at all the concentrations except at 1 M. For both species, the maximum conductivity occurred at 0.5 M. For TEATFSI, the ionic conductivity increased from 0.25 to 1.00 M, with a more gradual increase at higher concentrations. We suspected that the trend results from the difference of cation size – with TEA being the smallest – and that the conductivities of EPRT-TFSI and MEEV-(TFSI)2 decreased >0.5 M due to decreased species diffusivity resulting from increased solution viscosity. To test this hypothesis, we proceed with measuring viscosities and diffusion coefficients.
The dynamic viscosities of electrolyte solutions (in ACN) were measured at 25 °C using a microfluidic pressure-driven flow viscometer (m-VROC, RheoSense, Inc.).44,45 Each fluid sample was pushed through a microfluidic channel at a known volume flow rate, and viscosity was determined from the generated steady-state pressure drop resulting from the flow resistance. (See further details in Section V.2 of the ESI.†) The viscosities of all three ionic electrolytes at 0.25 M in ACN are slightly higher than the viscosity of pure ACN (0.34 mPa s). Viscosities increased proportional to molecular volume (and hydrodynamic radius), with MEEV-(TFSI)2 > EPRT-TFSI > TEATFSI. Viscosity increased monotonically and non-linearly as a function of concentration for all systems. The initial linear increase (c < 0.50 M) is typically proportional to the molecule's hydrodynamic volume.46 However, from moderate to high concentrations (0.50 to 1.00 M), the viscosity of MEEV-(TFSI)2 and EPRT-TFSI increased rapidly and non-linearly compared to the viscosity of TEATFSI, which implies stronger solute–solute interactions in these systems, e.g. which may lead to the formation of ion pairs or other structures at non-dilute concentrations. The local maximum in conductivity corresponds to the strong increase in viscosity, i.e. second-order non-dilute interactions and non-linear increase of the viscosity measurements. In addition to the dynamic viscosity at four different concentrations, dynamic viscosity of EPRT-TFSI and MEEV-(TFSI)2 was measured as a function of the applied shear rate (5000–30000 s−1) to determine whether the electrolytes exhibit Newtonian behavior. As shown in Fig. S11 (ESI†), both 1 M EPRT-TFSI and MEEV-(TFSI)2 do not exhibit considerable shear thickening or shear thinning, even at the highest shear rate probed. This result confirms that EPRT-TFSI and MEEV-(TFSI)2 demonstrate Newtonian constant viscosity (less than 10% variation) for this range of shear rates. This result shows that viscosity is primarily a function of concentration, not shear rate, and therefore the fluidity of the electrolytes should not be affected by the flow rate when materials cycle in a flow cell. While decreased conductivity occurs due to non-linear viscosity increase at high concentrations, the diffusivity is expected to decrease as a function of concentration, for all concentrations, due to viscosity increase even in the dilute limit.
The diffusion coefficient (or diffusivity) reflects the mobility of the ionic species. In general, diffusivity decreases with molecular size due to the larger solvated radius associated with larger molecular size.47 However, the viscosity of the medium greatly affects the diffusivity as described in the Stokes–Einstein equation.33 Thus, diffusion coefficients of positive counterparts of all three ionic species (EPRT+, MEEV2+, and TEA+) were determined by a pulse gradient NMR method. EPRT-TFSI, MEEV-(TFSI)2, and TEATFSI samples were prepared in CD3CN for NMR analysis. Spectra from samples of varying concentrations were collected at 25 °C on a 500 MHz JEOL ECZr spectrometer equipped with a Royal Probe. The spectra were collected by arraying the pulse gradient. Using the JEOL Delta Software, a representative peak in the 1H NMR spectrum of each sample was selected, and the diffusion coefficient was determined using diffusion analysis as the fitting algorithm. (See Section V.3 of the ESI† for details.) As shown in Fig. 3c, the diffusivity of ionic electrolytes varies according to the size of the molecule (TEATFSI > EPRT-TFSI > MEEV-(TFSI)2). In addition, the diffusivity of ionic electrolytes decreases with concentration due to the monotonic increase of viscosity as a function of concentration, as we expected.
For these systems to achieve sufficient conductivity in the absence of supporting salts, there must be a non-linear increase, even at high concentrations. Thus, we estimated the ionic conductivity of electrolytes by considering only the measured viscosity and diffusivity at each concentration (0.25, 0.50, 0.75, 1.00 M) as an external validation using the Nernst–Einstein and Stokes–Einstein equations for conductivity estimates. (See Section V.4 of the ESI† for calculations of the hydrodynamic radii of cations and anion, hydrodynamic volume of each species, and ionic conductivities.) The calculations show that the estimated conductivities have the same trends and similar magnitudes as the measured conductivities, confirming that measured conductivities are in good agreement with both measured viscosities and diffusivity data (Fig. S13, ESI†). Overall, EPRT-TFSI and MEEV-(TFSI)2 were the most conductive (23.30 and 31.18 mS cm−1, respectively) at 0.5 M, with values comparable to the commercially available electrolyte TEATFSI (33.22 mS cm−1) at the same concentration. Finally, this conductivity analysis revealed that newly developed ionic-organic electrolytes are promising for implementation in RFBs without requiring supporting salts.
Cyclic voltammetry
Cyclic voltammetry (CV) was used to investigate electrochemical properties, including redox potentials, kinetics, and chemical reversibility, and to measure diffusion coefficients associated with EPRT-TFSI and MEEV-(TFSI)2 in the presence and absence of supporting salt, allowing us to determine whether active species maintain their redox activity without a supporting salt. 100% iR correction was applied to compensate for solution resistance before performing each CV analysis. Fig. 4 shows cyclic voltammograms of individual active species (red and blue) and as an equimolar mixture of each (black) at 10 mM, both in ACN only (solid lines) and in a 0.5 M TEATFSI/ACN solution (dashed lines). Corresponding values for half-wave potentials, peak-to-peak separations, peak-current ratios, and diffusion coefficients are reported in Table 2.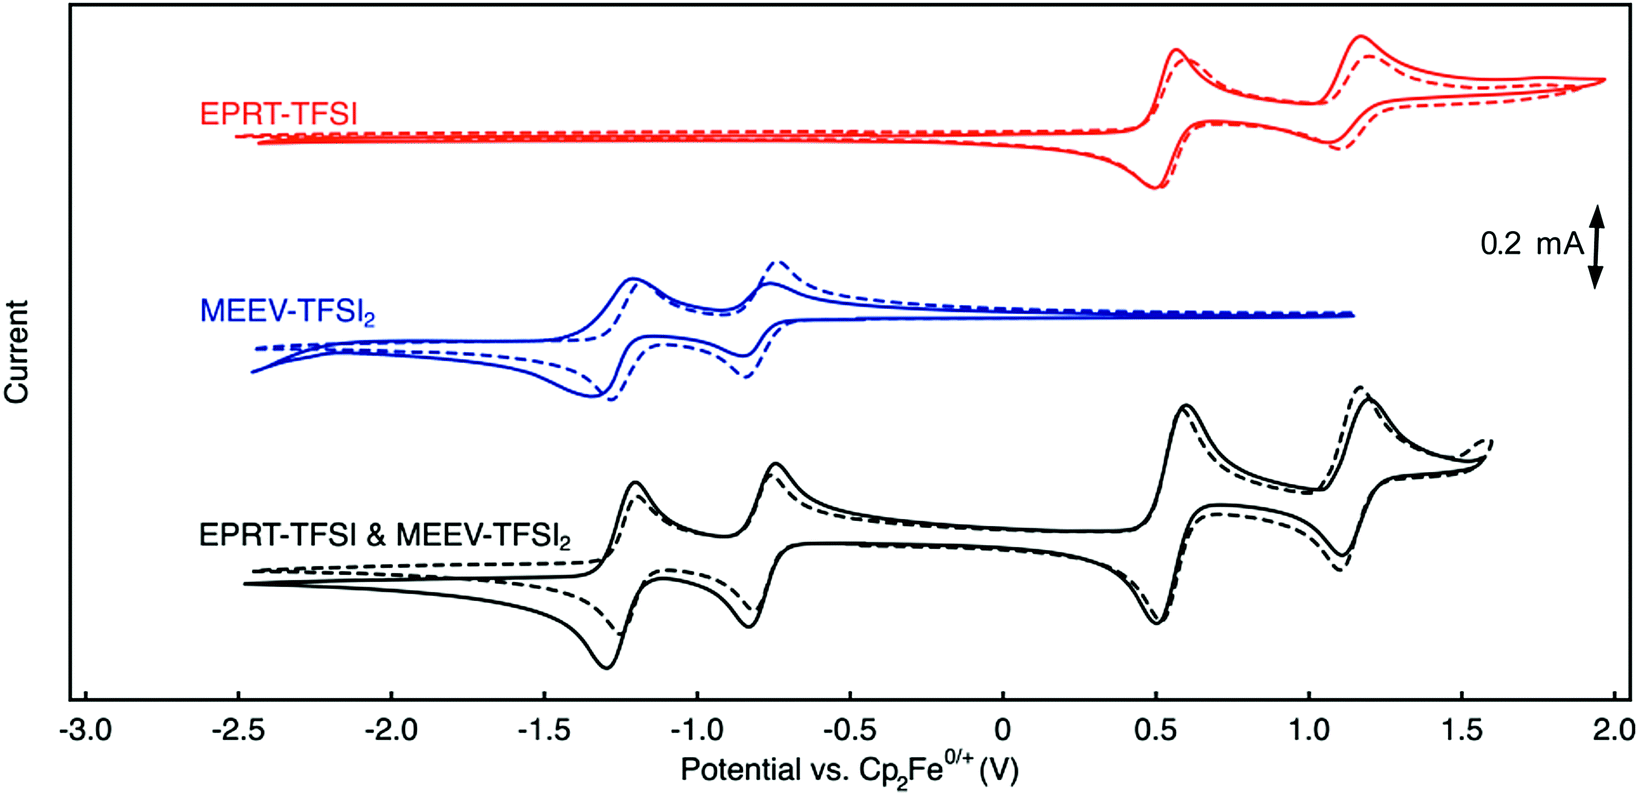 | ||
| Fig. 4 Cyclic voltammograms of EPRT-TFSI (red, top traces), MEEV-(TFSI)2 (blue, middle traces), and an equimolar combination of both EPRT-TFSI and MEEV-(TFSI)2 (black, lower traces) at 10 mM in ACN with no supporting salts (solid-line) and in ACN with 0.5 M TEATFSI (dashed-line). CV experiments were performed at a scan rate of 100 mV s−1, and 100% iR correction was applied. All voltammograms are referenced to ferrocene/ferrocenium at 0 V. | ||
| Solution | Solubility (M) | 1st redox event | 2nd redox event | Diffusion coefficient (×10−6 cm2 s−1) | ||||
|---|---|---|---|---|---|---|---|---|
| E 1/2 vs. Cp2Fe0/+ (V) | Peak-current ratio | Peak separation (mV) | E 1/2 vs. Cp2Fe0/+ (V) | Peak-current ratio | Peak separation (mV) | |||
| EPRT-TFSI in ACN | 1.27 | 0.55 | 1.04 | 73 | 1.12 | 1.85 | 108 | 4.97 |
| EPRT-TFSI in 0.5 M TEATFSI/ACN | 1.11 | 0.55 | 1.03 | 59 | 1.12 | 1.20 | 96 | 15.3 |
| MEEV-(TFSI)2 in ACN | 1.07 | −0.79 | 1.10 | 76 | −1.26 | 1.08 | 109 | 9.32 |
| MEEV-(TFSI)2 in 0.5 M TEATFSI/ACN | 0.91 | −0.79 | 1.02 | 56 | −1.24 | 1.03 | 57 | 9.81 |
The first redox events of both EPRT-TFSI and MEEV-(TFSI)2 are chemically (peak-current ratios of 1.03 and 1.02) and electrochemically (peak separations of 59 and 56 mV) reversible in 0.5 M TEATFSI/ACN. The active materials exhibited similar chemical reversibility (peak-current ratios of 1.04 and 1.10) in the absence of supporting salt. Analysis of the peak-to-peak separations of EPRT-TFSI and MEEV-(TFSI)2 with no supporting salt shows that their electro-kinetics are slightly slower (peak separations of 73 and 76 mV). However, peak-to-peak separations of an equimolar mixture (10 mM each) of EPRT-TFSI and MEEV-(TFSI)2 shows enhanced kinetics (peak separations of 66 and 57 mV), confirming that the previously observed, relatively larger peak-to-peak separations are not a result of sluggish kinetics but are instead due to lower solution conductivity for the active species at 10 mM in ACN (EPRT-TFSI: 1.21 mS cm−1 and MEEV-(TFSI)2: 2.39 mS cm−1). EPRT-TFSI shows only one fully reversible oxidation; two successive reduction events are observed for MEEV-(TFSI)2. With a peak-current ratio of 1.85 and a peak-to-peak separation of 108 mV in ACN, the second oxidation of EPRT-TFSI is less chemically and electrochemically reversible than the first oxidation event. While not fully reversible, the reversibility improved in 0.5 M TEATFSI/ACN, with the second oxidation showing a peak-current ratio of 1.20 and a peak-to-peak separation of 96 mV. Overall, EPRT-TFSI showed a more reversible second oxidation in TEATFSI/ACN electrolyte system compared to the other N-substituted phenothiazines that we have reported so far in the same electrolyte; while further experimentation will need to be conducted for verification. Based on our previous CV results of an N-substituted phenothiazine in different electrolytes, we suspect that a higher concentration of TFSI− stabilizes the dication form of EPRT.14,36,48,49 For MEEV-(TFSI)2, in addition to a reversible first reduction, the second reduction is also chemically reversible in both the presence and absence of the supporting salt (peak current ratios of 1.08 and 1.03). Although the second reduction of MEEV-(TFSI)2 is electrochemically reversible in 0.5 M TEATFSI/ACN (peak separation of 57 mV), it shows noticeably less electrochemical reversibility in the absence of the supporting salt (109 mV).
EPRT-TFSI and MEEV-(TFSI)2 show similar redox potentials in 0.5 M TEATFSI/ACN and in ACN, with E0/+ at 0.55 V versus Cp2Fe0/+ for EPRT-TFSI, and E2+/+at −0.79 V and E+/0 at −1.24 versus Cp2Fe0/+ for MEEV-(TFSI)2 (Table 2, Fig. 4 and Fig. S14, ESI†). EPRT-TFSI exhibits a higher oxidation potential (0.55 V versus Cp2Fe0/+) than N-substituted phenothiazines with neutral substituents (e.g. EPT at 0.27 V and MEEPT at 0.31 V versus Cp2Fe0/+),6 which is due to the stronger electron withdrawing character of the tetraalkylammonium substituent relative to alkyl and glycol groups.50,58 Therefore, introducing a positively charged group at the N position of phenothiazine not only raises the conductivity but also the oxidation potential, which is desirable for achieving higher cell voltages. The position of the first oxidation of EPRT-TFSI and the first reduction of MEEV-(TFSI)2 leads to a theoretical cell voltage of 1.34 V for a supporting-salt-free flow cell (Fig. 4). If the concentration of EPRT-TFSI were doubled and the MEEV-(TFSI)2 were utilized as a two-electron-accepting material, a cell potential of 1.80 V could be achieved.
In addition to NMR studies, analysis of variable scan rate voltammograms (Fig. S15, ESI†) allows for an estimation of diffusion coefficients of the redox-active species in the presence and absence of supporting salt using Randles–Sevcik analysis47 (Table 2 and Fig. S15c, f, ESI†). The diffusion coefficients measured with supporting salt show slightly higher diffusivity values (EPRT-TFSI: 15.3 × 10⁻⁶ cm2 s−1 and MEEV-(TFSI)2: 9.81 × 10⁻⁶ cm2 s−1) compared to those obtained without supporting salt (EPRT-TFSI: 4.97 × 10⁻⁶ cm2 s−1 and MEEV-(TFSI)2: 9.32 × 10⁻⁶ cm2 s−1), which may be due to the low ionic conductivity at 10 mM in active species. The diffusivity study further supports the slow kinetics observed in the absence of the supporting salt in CV conditions. EPRT-TFSI shows a higher diffusion coefficient than MEEV-(TFSI)2 in 0.5 M TEATFSI/ACN, which agrees with the relative hydrodynamic radii of the molecules as previously discussed. Overall, the electrochemical analysis suggests that a supporting-salt-free flow cell containing EPRT-TFSI and MEEV-(TFSI)2 is feasible.
Solubility
Achieving higher active material concentrations serves to increase the volumetric energy density. With that in mind, we determined the solubility of EPRT-TFSI and MEEV-(TFSI)2 in ACN and in 0.5 M TEATFSI/ACN (Table 2). Both EPRT-TFSI and MEEV-(TFSI)2 dissolved at >1 M in ACN (EPRT-TFSI at 1.27 M and MEEV-(TFSI)2 at 1.08 M), yet the solubility of both materials is significantly reduced (by 13% for EPRT-TFSI and 15% for MEEV-(TFSI)2) in 0.5 M TEATFSI/ACN. This preliminary solubility analysis demonstrates that the concentration, and thus the volumetric capacity, of redox-active materials can be raised by removing supporting salts from the system.Crossover, resistance, and flow cell cycling
With ionic conductivities and electrochemical characteristics of EPRT-TFSI and MEEV-(TFSI)2 showing promising characteristics for a supporting-salt-free nonaqueous RFB, we proceeded with further experiments to screen materials for flow cell cycling. To complete the variety of measurements including flow cell cycling at high concentrations, scalable syntheses are required. For this purpose, we scaled up the synthesis of EPRT-TFSI and MEEV-(TFSI)2, performing reactions in batches as large as 20–40 grams. The products were purified via simple laboratory techniques such as filtration and crystallization, as reported in the ESI,† and did not require column chromatography.Crossover tests were conducted with the aim of minimizing active materials crossover during cycling.51 We evaluated crossover with the anion exchange membrane FAPQ-375-PP because the active materials both have a net charge of +1 or +2 in their relevant states of charge, giving preference for TFSI− migration over the active species. In addition to evaluating the crossover rates of EPRT-TFSI and MEEV-(TFSI)2N-(2-(2-methoxyethoxy)ethyl)phenothiazine (MEEPT), a non-ionic phenothiazine, was analyzed to determine whether the charged substituents mitigate crossover. Small-volume in-house glass-blown stationary H cells were used to compare the crossover trends of ionic vs. non-ionic active materials (Fig. S16, ESI†). The active materials dissolved at 0.2 M in ACN (left side) and paired with ACN (right side) was housed in an H cell, which was separated by two layers of FAPQ-375-PP. Addition of a chemical oxidant (NOBF4 for the MEEPT and EPRT-TFSI) or a reducing agent (sodium metal for the MEEV-(TFSI)2) to both sides of the cell at 24 h was used to visualize the crossover (see photograph in Fig. S16, ESI†), wherein it is evident that the majority of all materials remains on the original side of the cell. For quantitative analysis, before adding the visualizing reagents, crossover was measured by extracting aliquots of solution from each side of the H cell at 0, 1, 6, 12, and 24 h, then systematically diluting each sample and recording cyclic voltammograms (Fig. S18b–d, ESI†), the integration of which showed the relative ratios of material on each side of the cell (see the ESI† for additional details and data (Fig. S16–S18)). As expected, the results show that the rate of crossover decreased with higher net molecular weight with MEEPT < EPRT-TFSI < MEEV-(TFSI)2, with 10.5, 4.1, and 2.1% of material having crossed over after 24 h, respectively (Fig. S18, ESI†). Even though static H cell conditions differ from the dynamic flow cell cycling conditions, crossover trends would remain the same due to the size and charge of active species.
In addition to limiting crossover, it is important that the pairing of the membrane and active materials does not lead to significant increases in ASR, which could result from chemical reactions with the membrane and/or pore blockage due to physisorption. Using a custom-built small-volume flow cell with interdigitated flow field,4 ASR was measured using impedance spectroscopy, with cell resistance measured as the X intercept of the Nyquist plots.52 Comparing a cell assembled with 0.5 M active species (0.5 M EPRT-TFSI/ACN on the positive side and MEEV-(TFSI)2/ACN on the negative side) and to another containing 0.5 M TEATFSI/ACN (both sides), impedance analysis reveals that the EPRT-TFSI/MEEV-(TFSI)2/ACN system shows moderate cell resistance (20.1 Ω cm2), similar to the TEATFSI/ACN cell (18.9 Ω cm2) (Fig. S19, ESI†). This negligible difference may be due to differences in conductivity between the active materials and the commercial supporting salt and/or variability in the cell assembly. Importantly, the low ASR results indicate that EPRT-TFSI and MEEV-(TFSI)2 can be cycled in a RFB using an anion exchange membrane at a high concentration without additional supporting salt.
Cycling stability is a critical factor in determining the lifetime of flow cells. The capacity losses in most RFBs are caused by either active species crossover through membrane or separator,15 disproportionation reactions of active molecules,14,53 or molecular decomposition.16,54 However, losses due to species crossover can be restored to some extent by electrolyte remixing and hydraulic pressure regulation.15,55,56 We assembled two flow cells with active species concentrations of 0.5 M under two different configurations. First, 0.5 M of each active species was dissolved separately in ACN (positive side: 0.5 M EPRT-TFSI; negative side: 0.5 M MEEV-(TFSI)2); in the second, both electrolytes contained equimolar amounts of the active species (both sides: 0.25 M EPRT-TFSI and 0.25 M MEEV-(TFSI)2). Before conducting constant current cell cycling, we performed variable rate cycling to determine the appropriate current density in separated or mixed cells. The rate studies were performed at four different current densities (5, 10, 15, and 20 mA cm−2) with five charge/discharge cycles at each current density. Then, five more cycles were recorded at the initial current density (5 mA cm−2) to determine whether high current densities led to capacity fade. The charge and discharge capacities are shown in Fig. 5c (separated) and Fig. 5d (mixed) along with coulombic efficiencies. In both the separated and mixed cells, the accessed capacities decreased at higher current densities, consistent with greater cell polarization at higher current densities.14 From the second cycle in the initial and final sets of 5 mA cm−2 cycling, 20% and 10% of capacity fade occurred in the separated and mixed cells, respectively; this loss might result from charged species crossover during the experiment (run time: 259 h for the separated electrolytes cell, 125 h for the mixed electrolytes cell). In addition, the rate studies (Fig. 5a–d) indicate that the supporting-salt-free flow cell can operate even at current densities of 20 mA cm−2 with >50% of the theoretical capacity accessed in both cases (67% in the separated electrolytes cell, 51% in the mixed electrolytes cell).
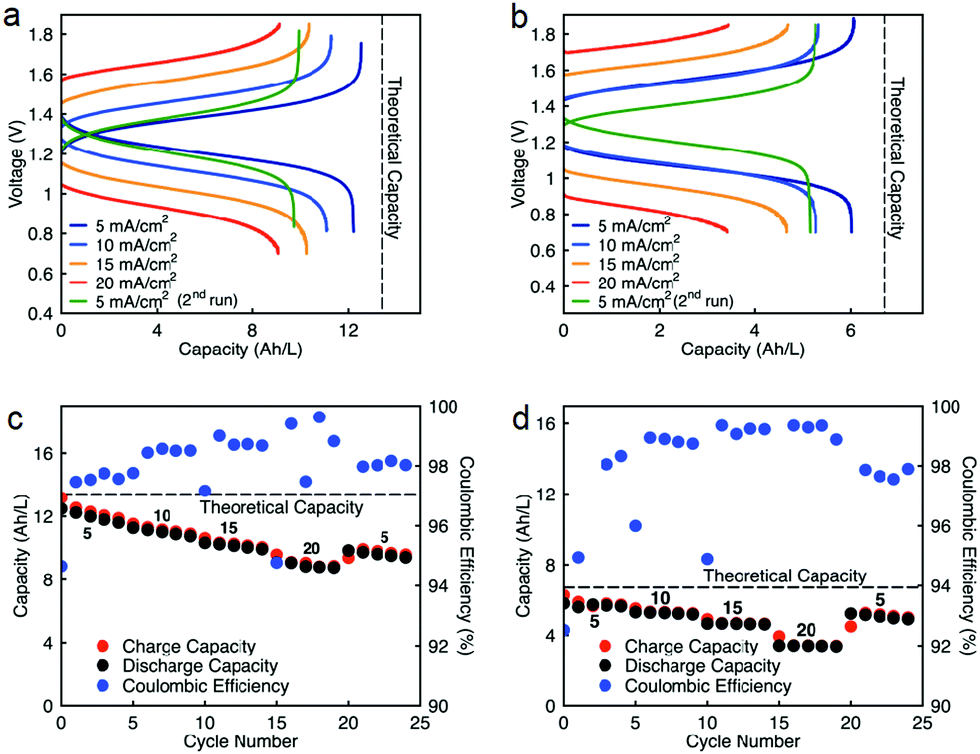 | ||
| Fig. 5 Rate study of EPRT-TFSI and MEEV-(TFSI)2 in separated and mixed flow cells in ACN without supporting salt. Charge and discharge voltage versus capacity for various current densities (5, 10, 15, 20, and 5 mA cm−2) of 0.5 M active species in a separated flow cell (a), 0.25 M active species in a mixed flow cell (b). Capacity versus cycle number for various current densities of 0.5 M active species in a separated flow cell (c), 0.25 M active species in a mixed flow cell (d). The potential cut-offs for each flow cell experiment ranged from 1.85 to 0.70 V. The theoretical capacities for the separated and mixed flow cells are 13.4 A h L−1 (134 mA h) and 6.7 A h L−1 (67 mA h), respectively. 10 mL of electrolyte solution was utilized in each side of flow cell. The total experiment runtimes for rate studies were 259 h (a and c) and 125 h (b and d). | ||
Constant current flow cell cycling was conducted at 10 mA cm−2 to evaluate the long-term stability of active materials in a supporting-salt-free flow cell environment; 10 mA cm−2 was selected by balancing the fraction of capacity accessed with coulombic efficiencies and taking into account experimental run times. First, we tested active materials in a separated electrolytes flow cell at active materials concentration of 0.5 M. Fig. 6c shows the charge capacities, discharge capacities, and coulombic efficiencies versus cycle number. Although we planned to run this cell for 100 cycles, due to complications resulting from a power outage, we stopped cell cycling after 74 cycles. Initially, 88% of theoretical capacity was accessed (11.89 A h L−1) in this cycling experiment. Over 74 cycles (605.5 h, 26 days), 42.83% of capacity fade was observed. The flow cell maintained 98.5–99.2% of coulombic efficiency (Fig. 6c) with 71.1–75.2% of voltage efficiency and 70.1–74.7% of energy efficiency (Fig. S23a, ESI†). After 74 cycles, we disassembled the cell and stored the posolyte and negolyte in glass vials in an argon-filled glove box. Post-cycling CV analysis was performed to determine whether the capacity fade was due to crossover and/or decomposition. The voltammograms of the cycled posolyte and negolyte are shown in Fig. S24a (ESI†). As evidenced by CV results, active species crossover was the cause of capacity fade. Importantly, no redox-center decomposition was evident.
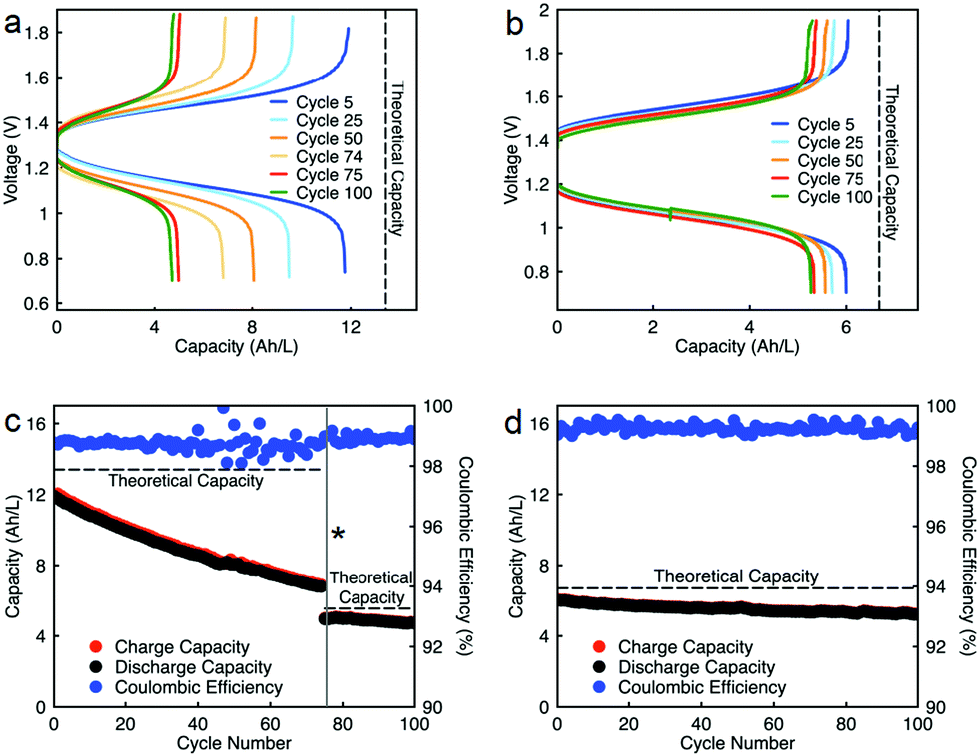 | ||
| Fig. 6 Constant current cycling of EPRT-TFSI and MEEV-(TFSI)2 in separated and mixed flow cells in ACN without supporting salt at 10 mA cm−2 current density. Charge and discharge voltage as a function of capacity of 0.5 M active species in a separated flow cell (a), 0.25 M active species in a mixed flow cell (b). Capacity versus cycle number at a current density of 10 mA cm−2 and active species concentrations of 0.5 M in a separated flow cell (c), or 0.25 M active species in a mixed flow cell (d). The potential cut-offs for each flow cell experiment ranged from 1.85 to 0.70 V. The theoretical capacities for the separated cell are, from cycle 1–74; 13.4 A h L−1 (134 mA h) and from cycle 75–100; 5.51 A h L−1 (5.51 mA h, considering electrolyte volume loss during the cell disassembly). The theoretical capacity of the flow cell is 6.7 A h L−1 (67 mA h). 10 mL of electrolyte solution was utilized in each side of flow cell. The total experiment runtimes for constant current cycling were 716 h (c) and 433 h (d). The asterisk (*) in plot “c” denotes that constant current cycling was stopped due to a power outage and was restarted after two months. | ||
For the mixed electrolyte configuration, the cell was assembled with the same electrolyte on both sides of the cell (0.25 M EPRT-TFSI and 0.25 M MEEV-(TFSI)2), cycling at rate of 10 mA cm−2. Fig. 6d shows charge and discharge capacities as well as coulombic efficiencies versus cycle number of the mixed electrolytes cell. At first, 91% of the theoretical capacity (6.01 A h L−1) was accessed. The capacity retention over 100 cycles (433 h, 19 days) was remarkable for a small molecule nonaqueous RFB (86.51%), with 99.87% capacity retention per cycle or 99.25% per day. Furthermore, the mixed electrolytes cell had coulombic efficiencies of 99.1–99.4% (Fig. 6d), with voltage and energy efficiencies as 66.6–72.8% and 64.6–70.6% (Fig. S23b, ESI†), respectively. Post-cycling CV analysis (Fig. S24b, ESI†) supports that the capacity fade was not due to the active materials decomposition, as no new redox waves were observed. Therefore, it is likely that most of the capacity decay resulted from asymmetric charge species crossover rather than active species decomposition. Over the course of the experiment, the solution volumes in the two electrolyte reservoirs became more unequal, which supports our hypothesis that active species crossed over because of a concentration or pressure gradient.
Since capacity retention increased upon mixing electrolytes, we revisited the cycled electrolytes of the 0.5 M separated electrolyte cell that had stopped after 74 cycles. Two months after cycling had stopped, we mixed the solutions from both sides of the cell, divided the volume in half, putting them on each side of a flow cell with a new membrane stack. We then cycled the cell at the same current density (10 mA cm−2). The cell cycling results are shown in the Fig. 6a and c, starting from 75th cycle. The new cell showed a capacity of 4.95 A h L−1 at the 75th cycle, which is about 90% of the theoretical capacity of a 0.25 M mixed electrolytes cell. Indeed, the increase in capacity retention (with 99.82% capacity retention per cycle) of new cell containing combined electrolytes from the originally separated electrolyte cell shows that the previous capacity fade resulted from both active species crossover and species imbalance.
Because we knew that we could not run a cell with separated electrolytes without losing capacity due to species crossover, for demonstration of cell cycling at higher concentrations of active materials, we chose to proceed with mixed electrolyte cells as membrane technology is not well developed yet to get the advantage of our highly stable new redox active species. Thus, we assembled a flow cell containing 0.75 M EPRT-TFSI and 0.75 M MEEV-(TFSI)2 on both sides of the flow cell. We selected 0.75 M as the active species concentration since it is the highest achievable solubility after mixing an equimolar amount of EPRT-TFSI and MEEV-(TFSI)2. As shown in Fig. 7a and Fig. S20 (ESI†), first, a rate study was performed to determine the appropriate current density for constant current cycling. Due to the high viscosity of mixed electrolyte at near saturation condition, the flow cell cycling was done using one layer of FAPQ-375-PP membrane to minimize the cell resistance. As evidenced by the results of the variable rate study experiment (Fig. 7a and Fig. S20, ESI†), the flow cell was only operated at low current densities due to the high cell resistance (impedance analysis is provided in Fig. S22, ESI†).
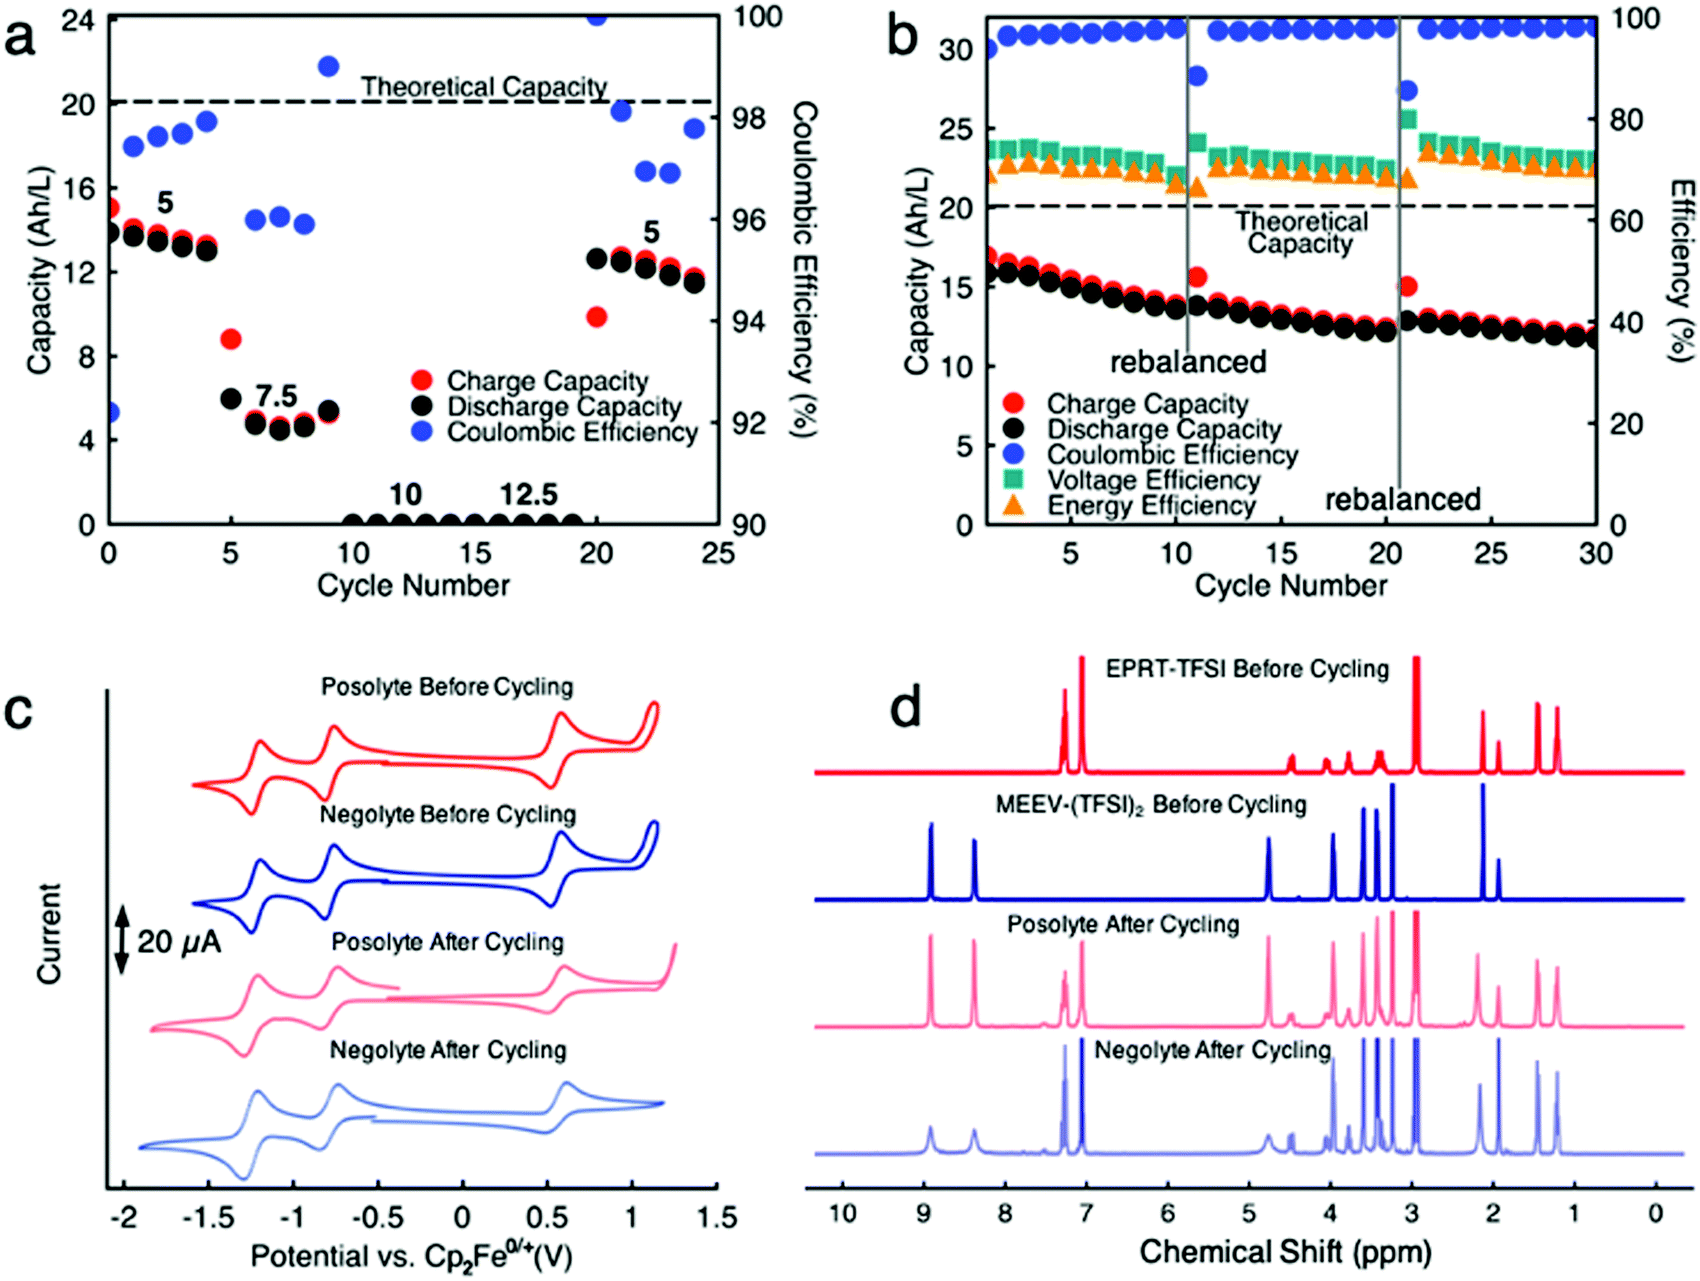 | ||
| Fig. 7 Rate study and constant current cycling of EPRT-TFSI and MEEV-(TFSI)2 in a mixed flow cell. Capacity versus cycle number for various current densities (5, 7.5, 10, 12.5, and 5 mA cm−2) of 0.75 M active species in a mixed flow cell (a), capacity versus cycle number at 5 mA cm−2 current density of 0.75 M active species in a mixed flow cell. The potential cutoffs imposed during the flow cell experiment were 1.85 to 0.70 V. The theoretical capacity is 20.1 A h L−1 (201 mA h), and the total experimental runtime were 230 h (a) and 638.5 h (b). Both sides of cell contained 0.75 M EPRT-TFSI and 0.75 M MEEV-(TFSI)2 in ACN with no supporting salts. Constant current cycling (b) was stopped at cycle number 10 and 20, then rebalanced and restarted. 10 mL of electrolyte solution was utilized in each side of flow cell. Cyclic voltammetry scans (100 mV s−1) of the posolyte (red) and negolyte (blue) before and after constant current cycling (c), at approximately 10 mM in active material in ACN. 100% iR correction was applied. 1H NMR spectra of posolyte (red) and negolyte (blue) before and after constant current cycling (d). | ||
Based on the results of the variable rate study, constant current cycling was conducted at 5 mA cm−2 to evaluate long-term stability. Initially, the flow cell accessed 16.9 A h L−1 capacity, which is 84% of the theoretical value (Fig. 7b and Fig. S21, ESI†). A reduced capacity retention is observed (0.99% capacity decay per day), compared to the previously conducted 0.25 M mixed flow cell, which may have been caused by a higher rate of active species crossover due to using only one layer of FAPQ-375-PP membrane, high active species concentration, large cell polarization, and longer charge–discharge time (∼22 h per cycle). Therefore, the flow cell was rebalanced (stopped cycling, electrolytes removed from the flow cell and remixed, then reloaded) after every 10 cycles, aiming to recover the decayed capacity by rebalancing electrolytes. As we had hoped, the capacity increased after each rebalancing (Fig. S21, see cycles 11 and 21, ESI†), but the capacity retention continuously decreased, which might be due to the steady crossover through charged–discharged species concentration gradient or pressure gradient via viscosity changes of the electrolyte during the cycling and cell polarization. The lower coulombic efficiency (96 to 97%) further supports the active species crossover argument. In addition, 74 to 72% of voltage efficiency and 70 to 69% of energy efficiency (Fig. 7b) are demonstrated at near saturation conditions.
To determine if active species had undergone chemical decomposition during high concentration, long term cycling (638.5 h, 27 days), we performed post cell cycling analyses on the cycled active species. As shown in Fig. 7c, we recorded CVs of cycled electrolytes (posolyte and negolyte) and compared them with the freshly mixed electrolytes. The cycled solutions exhibited similar redox events as the initial solutions, supporting no redox center decomposition or formation occurring during cycling. The resulting reduced redox reversibility of the cycled solution is presumably caused by different molecular interactions in the cycled solution due to formation of new charged species. In addition to CVs, we acquired 1H NMR of cycled electrolytes. Note that no precipitate was observed in flow fields or tanks. Before preparing samples for NMR analysis, a small portion of posolyte and negolyte was diluted with ACN to determine if the contents were soluble; no solid remained in this test. An excess of sodium thiosulfate was added to electrolytes and then aerated to quench any radical species in the EPRT-TFSI and MEEV-(TFSI)2, as they are paramagnetic and would convolute the NMR spectrum. The sodium thiosulfate was filtered, solvent (ACN) evaporated, and the remnants re-dissolved in CD3CN for 1H NMR analysis. Fig. 7d shows 1H NMR spectra of fresh EPRT-TFSI, MEEV-(TFSI)2, cycled posolyte, and cycled negolyte. A comparison of cycled electrolytes with fresh electrolytes reveal that active materials did not undergo appreciable decomposition during flow cell cycling. The 1H NMR of cycled solutions show peak broadening in some peaks, which may be due to the presence of trace amounts of radicals in the sample. However, the post cell cycling analysis further supports that active species are indeed chemically stable and that observed capacity decay is not a result of the active material decomposition, but rather is a result of asymmetric charged species crossover through the anion exchange membrane and/or cell polarization due to poor mass transfer at high concentration (1.5 M species in each side) of active species.
While EPRT-TFSI is only capable of reversibly donating one electron in ACN, MEEV-(TFSI)2 can reversibly accept two electrons, as shown Fig. 4. Thus far, we demonstrated flow cell cycling only considering the first reversible redox event of MEEV-(TFSI)2. However, accessing the reversible second reduction of MEEV-(TFSI)2 during flow cell cycling would increase the theoretical cell voltage from 1.34 to 1.80 V, which would increase the energy density by ca. 34%. Besides that, less MEEV-(TFSI)2 is necessary for flow cell cycling, which decreases the active material requirement and also lowers the viscosity of the electrolyte, potentially allowing the flow cell operation to cycle at relatively higher currents at high active species concentrations. As the EPRT-TFSI (one-electron) and MEEV-(TFSI)2 (two-electron) combination offers notable benefits towards high concentration flow cell cycling, we assembled another mixed flow cell with 0.750 M EPRT-TFSI and 0.375 M MEEV-(TFSI)2 on both sides of the cell. As expected, the flow cell demonstrated comparatively lower cell resistance (impedance analysis is provided in Fig. S22, ESI†), enabling cycling at a current density of 10 mA cm−2. The flow cell accessed 91% of the theoretical capacity, 18.3 A h L−1, which is one of the highest volumetric capacities reported for a nonaqueous RFBs (Fig. 8a and b).57 The two-electron cycling cell showed improved capacity retention (84% of capacity retention over 35 cycles; losing average capacity of 0.48% per cycle, 0.90% per day) compared to the 0.75 M one-electron cycling cell (74% of capacity retention over 30 cycles; losing average capacity of 0.88% per cycle, 0.99% per day), perhaps due to the lowered charge–discharge time (∼13 h per cycle), reduced rate of charged species crossover, and improved mass transfer at lower concentration of MEEV-(TFSI)2. In addition, the two-electron flow cell demonstrates 97% coulombic efficiency, 75–65% of voltage efficiency, and 73–64% of voltage efficiency.
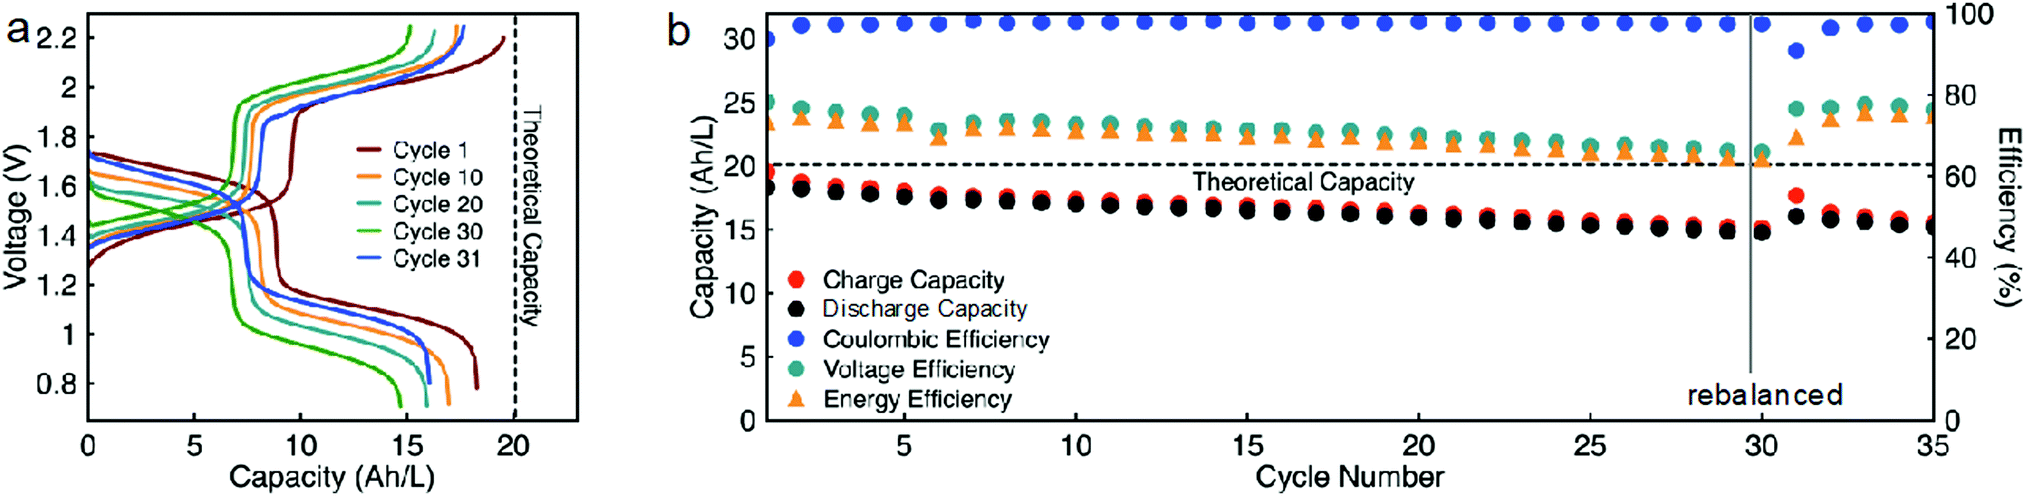 | ||
| Fig. 8 Constant current cycling of EPRT-TFSI and MEEV-(TFSI)2 at 10 mA cm−2 in a mixed flow cell, charging and discharging voltage, as a function of capacity (a), capacity versus cycle number (b). The potential cut-offs imposed during the flow cell experiment were 2.25 to 0.60 V. The theoretical capacity is 20.1 A h L−1 (201 mA h), and the total experiment runtime was 449 h. Both sides of cell contain 0.750 M EPRT-TFSI and 0.375 M MEEV-(TFSI)2 in ACN with no supporting salt. 10 mL of electrolyte solution was utilized in each side of flow cell. Constant current cycling (b) was stopped at cycle number 30 then rebalanced and restarted. | ||
Conclusions
In this work we demonstrated stable, highly soluble, and ionically conductive redox-active organic molecules and their performance in a supporting-salt-free nonaqueous redox flow cell. We synthesized permanently charged redox-active materials to simultaneously enhance the solubility and ionic conductivity in acetonitrile via simple synthetic, scalable strategies. Although solutions of active species of at least 1 M could be prepared, these new materials exhibited the highest ionic conductivities at 0.5 M in ACN, with a value on the same order of magnitude as the commercially available supporting electrolyte TEATFSI. The ionic conductivity dropped in ACN after 0.5 M due to the high viscosity (and low diffusivity) at near saturation points of these highly concentrated ionic active species. EPRT-TFSI and MEEV-(TFSI)2 exhibited similar chemical and electrochemical reversibility with and without a supporting electrolyte, confirming the feasibility of operating these materials in a nonaqueous RFB in the absence of supporting salt. Preliminary flow cell cycling studies at moderate concentrations (0.5 M separated and 0.25 M mixed) demonstrated that active species crossover, not materials decomposition, is responsible for the loss of capacity with time. Further, accessing the reversible second reduction of MEEV-(TFSI)2 during flow cell cycling, we were able to achieve a higher volumetric capacity (18.3 A h L−1) with only a 0.90% capacity decay per day at 0.75 M Faradaic concentration. Future studies will focus on ways to modify electrolyte composition to obtain lower viscosities at high concentrations, resulting in a higher cell capacity. Still, the crossover of active species limits the volumetric capacity to half of its value, meaning suitable membranes need to be made available to prevent crossover of these permanently charged organic species. Progress in this area could double battery capacity.Author contributions
S. A. O. and N. H. A. conceived of the idea. S. A. O., J. L., R. H. E., J. K. M., and N. H. A. led the team in project planning and experimental design. N. H. A. and A. P. K. synthesized and characterized organic compounds. S. R. P. performed X-ray analysis. Z. L. and N. H. A. conducted redox flow battery studies and post-cycling analysis. N. H. A. measured solubility, ionic conductivity, and performed cyclic voltammetry analysis. Y. W. and N. H. A. performed viscosity measurements. J. K. M. and N. H. A. carried out diffusivity studies. Y. W. and R. H. E. modelled and predicted conductivity. N. H. A., S. A. O., Y. W., R. H. E., and J. K. M. wrote the manuscript, and all authors discussed experimental results and contributed to revising drafts of the manuscript.Conflicts of interest
There are no conflicts to declare.Acknowledgements
The Ewoldt and Odom groups thank the Department of Energy for funding through the Joint Center for Energy Storage Research. The Odom group thanks the National Science Foundation for support (CBET Award 1805103). Sean Parkin thanks the NSF MRI program, award CHE-1625732. We also thank the group of Fikile Brushett for providing flow cells and advice in cycling experiments. We thank Jeff Babbit for making the H cells used in crossover studies.References
- D. Heide, L. Von Bremen, M. Greiner, C. Hoffmann, M. Speckmann and S. Bofinger, Renewable Energy, 2010, 35, 2483–2489 CrossRef.
- I. Gyuk, M. Johnson, J. Vetrano, K. Lynn, W. Parks, R. Handa, L. Kannberg, S. Hearne, K. Waldrip and R. Braccio, Grid Energy Storage, US Department of Energy, Washington DC, 2013.
- J. Winsberg, T. Hagemann, T. Janoschka, M. D. Hager and U. S. Schubert, Angew. Chem., Int. Ed., 2017, 56, 686–711 CrossRef CAS.
- J. D. Milshtein, J. L. Barton, R. M. Darling and F. R. Brushett, J. Power Sources, 2016, 327, 151–159 CrossRef CAS.
- P. Alotto, M. Guarnieri and F. Moro, Renewable Sustainable Energy Rev., 2014, 29, 325–335 CrossRef CAS.
- J. D. Milshtein, A. P. Kaur, M. D. Casselman, J. A. Kowalski, S. Modekrutti, P. L. Zhang, N. H. Attanayake, C. F. Elliott, S. R. Parkin, C. Risko, F. R. Brushett and S. A. Odom, Energy Environ. Sci., 2016, 9, 3531–3543 RSC.
- R. M. Darling, K. G. Gallagher, J. A. Kowalski, S. Ha and F. R. Brushett, Energy Environ. Sci., 2014, 7, 3459–3477 RSC.
- V. Viswanathan, A. Crawford, D. Stephenson, S. Kim, W. Wang, B. Li, G. Coffey, E. Thomsen, G. Graff and P. Balducci, J. Power Sources, 2014, 247, 1040–1051 CrossRef CAS.
- J. M. Stauber, S. Zhang, N. Gvozdik, Y. Jiang, L. Avena, K. J. Stevenson and C. C. Cummins, J. Am. Chem. Soc., 2018, 140, 538–541 CrossRef CAS.
- J. Ye, Y. Cheng, L. Sun, M. Ding, C. Wu, D. Yuan, X. Zhao, C. Xiang and C. Jia, J. Membr. Sci., 2018, 572, 110–118 CrossRef.
- D. Reynard, C. R. Dennison, A. Battistel and H. H. Girault, J. Power Sources, 2018, 390, 30–37 CrossRef CAS.
- Y. Yan, S. G. Robinson, M. S. Sigman and M. S. Sanford, J. Am. Chem. Soc., 2019, 141, 15301–15306 CrossRef CAS.
- G. Kwon, K. Lee, M. H. Lee, B. Lee, S. Lee, S.-K. Jung, K. Ku, J. Kim, S. Y. Park and J. E. Kwon, Chem, 2019, 5, 2642–2656 CAS.
- N. H. Attanayake, J. A. Kowalski, K. V. Greco, M. D. Casselman, J. D. Milshtein, S. J. Chapman, S. R. Parkin, F. R. Brushett and S. A. Odom, Chem. Mater., 2019, 31, 4353–4363 CrossRef CAS.
- W. Duan, J. Huang, J. A. Kowalski, I. A. Shkrob, M. Vijayakumar, E. Walter, B. Pan, Z. Yang, J. D. Milshtein, B. Li, C. Liao, Z. Zhang, W. Wang, J. Liu, J. S. Moore, F. R. Brushett, L. Zhang and X. Wei, ACS Energy Lett., 2017, 2, 1156–1161 CrossRef CAS.
- T. P. Vaid and M. S. Sanford, Chem. Commun., 2019, 55, 11037–11040 RSC.
- A. Hollas, X. Wei, V. Murugesan, Z. Nie, B. Li, D. Reed, J. Liu, V. Sprenkle and W. Wang, Nat. Energy, 2018, 3, 508–514 CrossRef CAS.
- B. Huskinson, M. P. Marshak, C. Suh, S. Er, M. R. Gerhardt, C. J. Galvin, X. Chen, A. Aspuru-Guzik, R. G. Gordon and M. J. Aziz, Nature, 2014, 505, 195–198 CrossRef CAS.
- Y. Liu, M.-A. Goulet, L. Tong, Y. Liu, Y. Ji, L. Wu, R. G. Gordon, M. J. Aziz, Z. Yang and T. Xu, Chem, 2019, 5, 1861–1870 CAS.
- L. Hoober-Burkhardt, S. Krishnamoorthy, B. Yang, A. Murali, A. Nirmalchandar, G. S. Prakash and S. Narayanan, J. Electrochem. Soc., 2017, 164, A600–A607 CrossRef CAS.
- Z. Yang, L. Tong, D. P. Tabor, E. S. Beh, M. A. Goulet, D. De Porcellinis, A. Aspuru-Guzik, R. G. Gordon and M. J. Aziz, Adv. Energy Mater., 2018, 8, 1702056 CrossRef.
- W. Wang, W. Xu, L. Cosimbescu, D. Choi, L. Li and Z. Yang, Chem. Commun., 2012, 48, 6669–6671 RSC.
- J. Cao, M. Tao, H. Chen, J. Xu and Z. Chen, J. Power Sources, 2018, 386, 40–46 CrossRef CAS.
- M. Wu, Y. Jing, A. A. Wong, E. M. Fell, S. Jin, Z. Tang, R. G. Gordon and M. J. Aziz, Chem, 2020, 1432, 1432–1442 Search PubMed.
- X. Wei, W. Xu, M. Vijayakumar, L. Cosimbescu, T. Liu, V. Sprenkle and W. Wang, Adv. Mater., 2014, 26, 7649–7653 CrossRef CAS.
- J. Huang, L. Su, J. A. Kowalski, J. L. Barton, M. Ferrandon, A. K. Burrell, F. R. Brushett and L. Zhang, J. Mater. Chem. A, 2015, 3, 14971–14976 RSC.
- F. R. Brushett, J. T. Vaughey and A. N. Jansen, Adv. Energy Mater., 2012, 2, 1390–1396 CrossRef CAS.
- G. Kwon, S. Lee, J. Hwang, H.-S. Shim, B. Lee, M. H. Lee, Y. Ko, S.-K. Jung, K. Ku and J. Hong, Joule, 2018, 2, 1771–1782 CrossRef CAS.
- C. S. Sevov, S. K. Samaroo and M. S. Sanford, Adv. Energy Mater., 2017, 7, 1602027 CrossRef.
- K. H. Hendriks, C. S. Sevov, M. E. Cook and M. S. Sanford, ACS Energy Lett., 2017, 2, 2430–2435 CrossRef CAS.
- J. Luo, B. Hu, C. Debruler and T. L. Liu, Angew. Chem., Int. Ed., 2018, 57, 231–235 CrossRef CAS.
- C. DeBruler, B. Hu, J. Moss, J. Luo and T. L. Liu, ACS Energy Lett., 2018, 3, 663–668 CrossRef CAS.
- B. Hu and T. L. Liu, J. Energy Chem., 2018, 27, 1326–1332 CrossRef.
- E. S. Beh, D. De Porcellinis, R. L. Gracia, K. T. Xia, R. G. Gordon and M. J. Aziz, ACS Energy Lett., 2017, 2, 639–644 CrossRef CAS.
- J. Chai, A. Lashgari, X. Wang and C. K. Williams, J. Mater. Chem. A, 2020, 8, 15715–15724 RSC.
- J. A. Kowalski, M. D. Casselman, A. P. Kaur, J. D. Milshtein, C. F. Elliott, S. Modekrutti, N. H. Attanayake, N. Zhang, S. R. Parkin, C. Risko, F. R. Brushett and S. A. Odom, J. Mater. Chem. A, 2017, 5, 24371–24379 RSC.
- K. Gong, Q. Fang, S. Gu, S. F. Y. Li and Y. Yan, Energy Environ. Sci., 2015, 8, 3515–3530 RSC.
- V. M. Lobo and J. Quaresma, Physical sciences data, 1989, vol. 41 Search PubMed.
- S. M. Laramie, J. D. Milshtein, T. M. Breault, F. R. Brushett and L. T. Thompson, J. Power Sources, 2016, 327, 681–692 CrossRef CAS.
- J. D. Milshtein, J. L. Barton, T. J. Carney, J. A. Kowalski, R. M. Darling and F. R. Brushett, J. Electrochem. Soc., 2017, 164, A2487–A2499 CrossRef CAS.
- R. Dmello, J. D. Milshtein, F. R. Brushett and K. C. Smith, J. Power Sources, 2016, 330, 261–272 CrossRef CAS.
- J. D. Milshtein, S. L. Fisher, T. M. Breault, L. T. Thompson and F. R. Brushett, ChemSusChem, 2017, 10, 2080–2088 CrossRef CAS.
- S. G. Robinson, Y. Yan, K. H. Hendriks, M. S. Sanford and M. S. Sigman, J. Am. Chem. Soc., 2019, 141, 10171–10176 CrossRef CAS.
- V. A. Iyer, J. K. Schuh, E. C. Montoto, V. P. Nemani, S. Qian, G. Nagarjuna, J. Rodríguez-López, R. H. Ewoldt and K. C. Smith, J. Power Sources, 2017, 361, 334–344 CrossRef CAS.
- J. Zhang, R. E. Corman, J. K. Schuh, R. H. Ewoldt, I. A. Shkrob and L. Zhang, J. Phys. Chem. C, 2018, 122, 8159–8172 CrossRef CAS.
- J. T. Edward, J. Chem. Educ., 1970, 47, 261–270 CrossRef CAS.
- R. G. Compton and C. E. Banks, Understanding Voltammetry, Imperial College Press, London, 2nd edn, 2011 Search PubMed.
- K. A. Narayana, M. D. Casselman, C. F. Elliott, S. Ergun, S. R. Parkin, C. Risko and S. A. Odom, ChemPhysChem, 2015, 16, 1179–1189 CrossRef CAS.
- A. P. Kaur, O. C. Harris, N. H. Attanayake, Z. Liang, S. R. Parkin, M. H. Tang and S. A. Odom, Chem. Mater., 2020, 32, 3007–3017 CrossRef CAS.
- L. P. Hammett, J. Am. Chem. Soc., 1937, 59, 96–103 CrossRef CAS.
- M. Sanford, A. Shrestha, K. Hendriks, M. Sigman and S. Minteer, Chem. – Eur. J., 2020, 26, 5369–5373 CrossRef.
- N. S. Hudak, L. J. Small, H. D. Pratt and T. M. Anderson, J. Electrochem. Soc., 2015, 162, A2188–A2194 CrossRef CAS.
- J. Huang, B. Pan, W. Duan, X. Wei, R. S. Assary, L. Su, F. R. Brushett, L. Cheng, C. Liao, M. S. Ferrandon, W. Wang, Z. Zhang, A. K. Burrell, L. A. Curtiss, I. A. Shkrob, J. S. Moore and L. Zhang, Sci. Rep., 2016, 6, 32102–32111 CrossRef CAS.
- M.-A. Goulet, L. Tong, D. A. Pollack, D. P. Tabor, S. A. Odom, A. Aspuru-Guzik, E. E. Kwan, R. G. Gordon and M. J. Aziz, J. Am. Chem. Soc., 2019, 141, 8014–8019 CAS.
- X. Wei, B. Li and W. Wang, Polym. Rev., 2015, 55, 247–272 CrossRef CAS.
- K. E. Rodby, T. J. Carney, Y. A. Gandomi, J. L. Barton, R. M. Darling and F. R. Brushett, J. Power Sources, 2020, 227958 CrossRef CAS.
- L. Zhang, Y. Qian, R. Feng, Y. Ding, X. Zu, C. Zhang, X. Guo, W. Wang and G. Yu, Nat. Commun., 2020, 11, 1–11 CAS.
- N. H. Attanayake, A. P. Kaur, T. M. Suduwella, C. F. Elliott, S. R. Parkin and S. A. Odom, New J. Chem., 2020, 44, 18138–18148 RSC.
Footnote |
| † Electronic supplementary information (ESI) available: Experimental details, NMR spectra, viscosity, conductivity, diffusivity, cyclic voltammetry, modelled and predicted conductivity, flow cell experiments. CCDC 1955957 and 1955958. For ESI and crystallographic data in CIF or other electronic format see DOI: 10.1039/d0ma00881h |
| This journal is © The Royal Society of Chemistry 2021 |