 Open Access Article
Polypyrrole–polyaniline copolymer coated green rice husk ash as an effective adsorbent for the removal of hexavalent chromium from contaminated water†
Soumi
Dutta
a,
Suneel Kumar
Srivastava
 *b and
Ashok Kumar
Gupta
*c
aSchool of Water Resources, Indian Institute of Technology Kharagpur, Kharagpur, West Bengal–721302, India
bDepartment of Chemistry, Indian Institute of Technology Kharagpur, Kharagpur, West Bengal–721302, India. E-mail: sunit@chem.iitkgp.ac.in
cEnvironmental Engineering Division, Department of Civil Engineering, Indian Institute of Technology Kharagpur, Kharagpur, West Bengal–721302, India. E-mail: agupta@civil.iitkgp.ac.in
First published on 17th February 2021
Abstract
The acute toxicity and mobility of hexavalent chromium [Cr(VI)] in water and wastewater pose a severe risk to the environment and human health. In view of this, the present work is focused on the fabrication and characterization of polypyrrole–polyaniline coated rice husk ash (termed as PPY–PANI@RHA) by in situ polymerization and its application as an adsorbent in the removal of Cr(VI) from the aqueous solution. Our findings have shown a Cr(VI) removal rate of ∼98% at room temperature (303 K) under optimum conditions with an adsorbent dose of 0.8 g L−1, an adsorbate concentration of 50 mg L−1, a solution pH of ∼2, and a contact time of 300 min. The adsorption of Cr(VI) followed the Elovich kinetics and is better described using the Freundlich isotherm with a maximum adsorption capacity of 769.15 mg g−1. The co-existing ion study result shows that the Cr(VI) removal efficiency is slightly decreased in the presence of high concentrations of Na+, Mg2+, Ca2+, Cl−, HCO3−, NO3−, SO42− and PO43− ions. Thermodynamic investigations have shown that the adsorption phenomenon of Cr(VI) on PPY–PANI@RHA is endothermic, feasible, and spontaneous in nature. Additionally, the reusability study of the spent PPY–PANI@RHA adsorbent indicated its high removal efficiency for several times. Finally, PPY–PANI@RHA was also successfully used to remove Cr(VI) ions from the highly polluted raw tannery wastewater sample. Our findings clearly demonstrated that PPY–PANI-coated rice hush ash could be an alternative as an effective bio adsorbent in the removal of Cr(VI) for wastewater treatment and benefit the industries in the future.
1. Introduction
The scarcity of safe water is a global threat leading to a severe risk to the environment and human health. This is substantiated by developing sustainable approaches for the successful remediation of pollutants from contaminated water.1–3 In this regard, chromium (Cr) is one of the most common heavy metal pollutants usually present in trace amounts in natural waters due to its wide range of application in electroplating, steel production, pigments, alloying, tanning of leather, textile dyes, chemical manufacturing, metal corrosion, inhibitors, refractory bricks, batteries, mordants, and several other industrial applications.4–8 The discharge of untreated or poorly treated effluents coming from such industries always poses a severe threat to the abiotic and the biotic environment leading to the contamination of natural resources of soil and water.1,9 Though Cr exists in several oxidation states ranging from II to VI, only trivalent chromium (Cr(III)) and hexavalent chromium (Cr(VI)) species remain the most stable and common forms of Cr in the environment.10 Cr(III) exists in the form of oxides, hydroxides, and sulphates, and is insoluble in water. However, its lower mobility enables it to be mostly bound to the organic matter in soil and aquatic environments. This is also considered a micronutrient for humans and is necessary for sugar and lipid metabolism. In contrast, Cr(VI) is more toxic than Cr(III) and shows high solubility in water under circumneutral pH conditions, and poses a serious risk to human health on exposure.11 In humans, it leads to mutations, skin corrosion, lung cancer, irritations in the respiratory tract and eyes, gastric damage, etc.12 The World Health Organization (WHO) recommends 0.05 mg L−1 of Cr(VI) in drinking water as the permissible limit.13 According to the US Environmental Protection Agency (EPA), the acceptable limit of Cr(VI) for industrial effluent discharge into surface water is 0.10 mg L−1.14Among different methodologies, adsorption is considered to be the most acceptable technique for the removal of Cr(VI) from wastewater. This is mainly due to easy operation, high selectivity, high removal efficiency, and reusability property in the adsorption of Cr(VI).6,15 Therefore, several studies have been performed for the removal of Cr(VI) using various adsorbents such as silica, activated carbon, clay, metal oxides, bauxite, biomaterials, zeolites, layered double hydroxide, etc.5,16–18 Besides, hybrid materials, such as titanium cross-linked chitosan,19 magnetic carbon nanoadsorbent,20 C@TiO2,21etc., have also been employed as adsorbents in the separation of pollutants from contaminated water. The choice of hybrid nanocomposites in this and several other works is guided by its high surface/volume ratio, high selectivity, better mechanical properties, high effective surface area, a large number of active sites, and high reactivity.22–24
Recently, conducting polymers, in particular polyaniline (PANI) and polypyrrole (PPY), have been receiving considerable attention due to their multifaceted applications, such as electrochemical display devices, molecular electronics, non-linear optics, sensors, electromagnetic shielding batteries, water treatment, supercapacitors, wave-absorbing fields, etc.25–29 Besides, PANI and PPY have also been used as adsorbents in the remediation of Cr(VI) from aqueous media.30–34 The choice of PANI and PPY in this work was mainly guided by their easy bulk synthesis, biocompatibility, redox properties, large specific surface area, non-toxicity, and low cost.32,35–39 Furthermore, the presence of a nitrogen atom with a lone pair of electrons in PPY and PANI through its efficient binding (electrostatic/hydrogen) in the macromolecular chains facilitates the removal of Cr(VI) ions from contaminated water.40–42 In this context, limited work has been reported on the removal of Cr(VI) using the PANI–PPY copolymer as an adsorbent.10,43 However, after treatment, eluting the PANI and PPY powder is a very tedious and expensive task due to its intrinsic hydrophilicity.39 Furthermore, the processability of PANI and PPY remains another grey area for their potential commercial applications.44 Therefore, different approaches have been directed to conducting polymers, such as grafting of polyaniline to a non-conducting poly-(p-phenylene terephthalamide) polymer,45 pyrrole–styrene graft copolymer,46etc. In addition, reports are also available on the adsorption of Cr(VI) ions from contaminated water using polypyrrole/calcium rectorite composites,6 core–shell Fe3O4/PANI microspheres,34 PPy/Fe3O4 magnetic nanocomposites,38 capsular polypyrrole hollow nanofibers,30 chitosan/polypyrrole,47 polyaniline@Ni(OH)2,48 flake-like polyaniline/montmorillonite nanocomposites,49 Fe3O4@Arg–PPy,50 sodium alginate–polyaniline nanofibers,51 bacteria cell templated porous polyaniline,42 alkyl-substituted polyaniline/chitosan,52 polypyrrole-modified layered double hydroxides,53 graphene/SiO2@polypyrrole,54 and PANI-coated electrospun adsorbent membranes.55
In recent years, attention has been paid to harnessing a wide variety of low-cost natural materials and evaluating their efficiency and adsorption capacity in removing harmful contaminants from water.56 In this regard, much effort has been devoted to fabricating various PPY and PANI coatings on low-cost, ecofriendly promising bio-adsorbents, such as sawdust, sugarcane bagasse, rice husks, rice husk ash, chitin, coconut coir and used them as an adsorbent for the removal of heavy metals from wastewater.41,44,57–59 Among these, owing to its production in Asia in enormous quantities, sustainable, and low-cost rice husk has been receiving considerable attention as an effective adsorbent for the removal of various pollutants from water and wastewaters.60 Studies have also been conducted on utilizing rice husk in the preparation of rice husk ash (RHA) comprising SiO2 (∼94.50%), CaO (∼1.80%), Al2O3 (∼0.29%), and other minor mineral element composition and using it as an adsorbent in the removal of pollutants present in contaminated water.41,60–62 The inclusion of silica in a variety of conjugated polymers is reported to alter their physical properties. For example, according to Dutta and De,63 the effective surface area increases with the SiO2 concentration, and the conjugation length of PANI is reduced after the incorporation of silica. This aspect is found to be very useful in the processability and recycling of PANI incorporated silica in making it an effective adsorbent in the removal of Cr(VI) from aqueous solutions.64 However, no efforts were made on the synthesis of the PPY–PANI copolymer coated on RHA as an easily processable adsorbent in the removal of Cr(VI) from aqueous media. It is anticipated that an increase in the surface area of the PPY–PANI composite could enhance the uptake of pollutants compared to the PPY and PANI alone through adsorption. Alternatively, PPY–PANI polymers could also overcome the restraint of the rareness of new conjugated π-bond-containing monomers.65,66
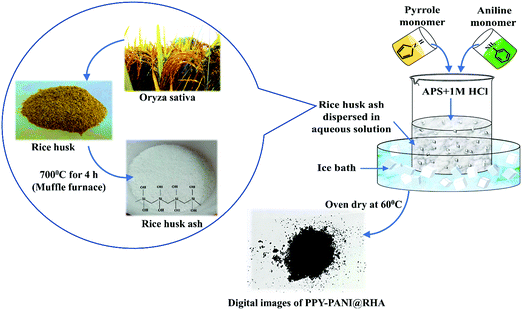
In view of this, the present work is focused on the synthesis of PPY–PANI composite coated rice husk ash (RHA) and explore its utility as a potential adsorbent in the removal of Cr(VI) from contaminated water. The preparative method involved in situ deposition of the PPY–PANI composite coated by in situ chemical oxidative polymerization on rice husk ash (referred to as PPY–PANI@RHA) and characterization. Subsequently, investigations have been conducted to evaluate its ability as an adsorbent for selective removal of Cr(VI) from contaminated aqueous solutions, including real wastewater. Our studies have shown significantly enhanced maximum adsorption capacity (769.15 mg g−1) of Cr(VI) compared to that of several other adsorbents. The effect of various parameters including pH, dose, time, initial concentration, and co-existing ions on Cr(VI) adsorption efficiency has also been investigated in this study. Furthermore, the adsorption kinetics, adsorption isotherms, and thermodynamics of the adsorption process have also been studied. Finally, an adsorption study on the removal of Cr(VI) from industrial contaminated effluents has also shown promising outcomes.
2. Experimental section
2.1. Materials and reagents
Details about the materials and reagents are provided in the ESI.†2.2. Material synthesis
2.3. Adsorption experiments
The adsorption experiments were conducted in polyethylene bottles (Tarson Co. Ltd, India) with a capacity of 250 ml containing 100 ml of aqueous Cr(VI) solutions of different concentrations and 0.8 g L−1 of PPY–PANI@RHA (adsorbent dosage) unless otherwise mentioned. The solution pH was maintained at ∼2 using 0.1 M HCl, and then the sample bottles were placed in a thermostatic shaker for agitation at 200 ± 10 rpm in the time range of 2 to 700 min. Subsequently, the adsorbent was separated by filtering the respective solution using 0.22 μm Whatman Nylon filter membranes. Thereafter, the Cr(VI) content in the supernatant liquid was evaluated by using a UV–visible spectrophotometer. The maximum intensity of absorbance (540 nm) was measured corresponding to the formation of the intense red-violet chromophore complex due to the reaction between Cr(VI) and 1,5-diphenyl carbazide in acidic medium.6,67 Accordingly, the % removal of Cr(VI) was calculated as follows: | (1) |
 | (2) |
2.4. Desorption and reusability experiments
The adsorption–desorption tests were implemented to study the regeneration and reusability of the spent adsorbent for the removal of Cr(VI). Accordingly, 0.8 g L−1 dose of PPY–PANI@RHA was added to 100 ml of 100 mg L−1 of Cr(VI) solutions and subjected to agitation for 4 hours at 200 rpm followed by collection of the spent adsorbent by filtering the solutions. In desorption experiments, Cr(VI)-loaded PPY–PANI@RHA were treated with NaOH (0.1 to 1 M) solution for 4 hours at 200 rpm, then filtered, and the concentration of Cr(VI) in the residual solution was evaluated. After that, the surface of the spent adsorbent was activated and regenerated by treating it with 2 M HCl for 2 hours, followed by collection and drying of the sample for reuse.6,38 Subsequently, five successive desorption–adsorption cycles were performed to confirm the reusability properties of PPY–PANI@RHA for the adsorption of Cr(VI) from aqueous solutions.2.5. Characterization technique
The details about the various techniques used in the characterization of the material are provided in the ESI.†3. Results and discussion
3.1. Characterization of PPY–PANI@RHA
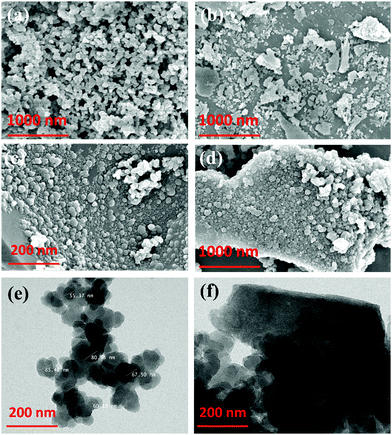
HR-TEM analysis was also performed to gain a clear understanding of the prepared PPY–PANI and PPY–PANI@RHA composites, and the corresponding findings are displayed in Fig. 2(e) and (f), respectively. It visibly demonstrated a uniform size spherical morphology of PPY–PANI polymer matrixes by forming an interconnected network. HR-TEM studies further reaffirmed our contention based on FE-SEM on the formation of uniformly deposited PPY–PANI on the surface of RHA and successful formation of the PPY–PANI@RHA composite. The composition of PPY–PANI@RHA has also been studied by thin film standardless quantitative analysis inferred from TEM analysis and the corresponding findings are displayed in Fig. S1 (ESI†). The presence of the C, N, O, and Si peaks indicate the co-existence of polypyrrole, polyaniline, and rice husk ash in the composite material (PPY–PANI@RHA).
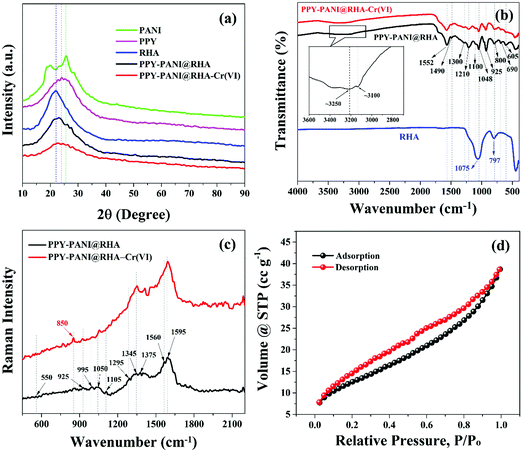
![[double bond, length as m-dash]](https://www.rsc.org/images/entities/char_e001.gif) N stretching), 1552 cm−1 (C–N stretching), and 1300 cm−1 (N–H deformation),74 along with 1490 cm−1 (C–C bonding of benzenoid structure), 1105 cm−1 (vibration in the –NH+
N stretching), 1552 cm−1 (C–N stretching), and 1300 cm−1 (N–H deformation),74 along with 1490 cm−1 (C–C bonding of benzenoid structure), 1105 cm−1 (vibration in the –NH+![[double bond, length as m-dash]](https://www.rsc.org/images/entities/char_e001.gif) structure) and 795 cm−1 (C–Cl out-of-plane bending vibration) could be attributed to the presence of doped polyaniline in PPY–PANI@RHA.75,76 The FTIR spectra of PPY–PANI@RHA also indicate the presence of a broad peak at ∼3250 cm−1 corresponding to the symmetric and unsymmetrical N–H stretching.22 The absorption band in the range of ∼3100 cm−1 is characteristic of stretching vibrations of
structure) and 795 cm−1 (C–Cl out-of-plane bending vibration) could be attributed to the presence of doped polyaniline in PPY–PANI@RHA.75,76 The FTIR spectra of PPY–PANI@RHA also indicate the presence of a broad peak at ∼3250 cm−1 corresponding to the symmetric and unsymmetrical N–H stretching.22 The absorption band in the range of ∼3100 cm−1 is characteristic of stretching vibrations of ![[double bond, length as m-dash]](https://www.rsc.org/images/entities/char_e001.gif) C–H.23 The presence of overlapped absorption bands of PPY, PANI, and RHA is a clear indication of PPY–PANI deposited on the surface of silica in rice husk ash.10,77 The change in the intensity and shape of the peaks in PPY–PANI@RHA and Cr(VI) adsorbed PPY–PANI@RHA confirmed the presence of interactions between PPY, PANI, RHA, and Cr(VI) ions with the porous surface of PPY, PANI, and RHA, respectively.44
C–H.23 The presence of overlapped absorption bands of PPY, PANI, and RHA is a clear indication of PPY–PANI deposited on the surface of silica in rice husk ash.10,77 The change in the intensity and shape of the peaks in PPY–PANI@RHA and Cr(VI) adsorbed PPY–PANI@RHA confirmed the presence of interactions between PPY, PANI, RHA, and Cr(VI) ions with the porous surface of PPY, PANI, and RHA, respectively.44
![[double bond, length as m-dash]](https://www.rsc.org/images/entities/char_e001.gif) C and C–C bonds along with the entire chain, respectively.53,78,79 In addition, another band located at 925 cm−1 along with a doublet at 1345 and 1375 cm−1 appeared due to the ring deformation associated with bipolaron and ring-stretching modes of polypyrrole, respectively.78–80 Furthermore, a transition is observed from reduced to oxidized polypyrrole in the range of 1560 cm−1 to 1620 cm−1.81Fig. 3(c) also shows the presence of peaks at around 550 cm−1 due to the bending vibrations of Si–Ob–Si bonds (oxygen bridging two silicate tetrahedra). In addition, another peak is also observed at 1050 cm−1, corresponding to the stretching vibrations of Si–Onb bonds (non-bridging oxygen bonded to Si).82 All these findings clearly demonstrate the incorporation of PPY–PANI and RHA in the synthesized composite material. The Raman spectra of Cr(VI) adsorbed PPY–PANI@RHA show the appearance of a peak at ∼849.7 cm−1 due to the interaction between chromate ions and PPY–PANI composites.18,83
C and C–C bonds along with the entire chain, respectively.53,78,79 In addition, another band located at 925 cm−1 along with a doublet at 1345 and 1375 cm−1 appeared due to the ring deformation associated with bipolaron and ring-stretching modes of polypyrrole, respectively.78–80 Furthermore, a transition is observed from reduced to oxidized polypyrrole in the range of 1560 cm−1 to 1620 cm−1.81Fig. 3(c) also shows the presence of peaks at around 550 cm−1 due to the bending vibrations of Si–Ob–Si bonds (oxygen bridging two silicate tetrahedra). In addition, another peak is also observed at 1050 cm−1, corresponding to the stretching vibrations of Si–Onb bonds (non-bridging oxygen bonded to Si).82 All these findings clearly demonstrate the incorporation of PPY–PANI and RHA in the synthesized composite material. The Raman spectra of Cr(VI) adsorbed PPY–PANI@RHA show the appearance of a peak at ∼849.7 cm−1 due to the interaction between chromate ions and PPY–PANI composites.18,83
3.2. Batch study on Cr(VI) removal from aqueous solution using PPY–PANI@RHA
Effect of solution pH on the adsorption of Cr(VI)
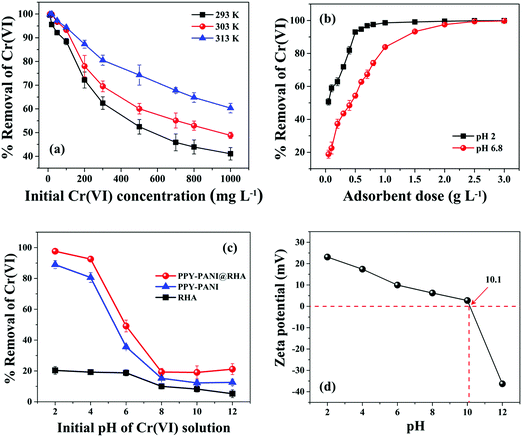
The pH of the solution plays a very significant role in the adsorption of chromium species due to its control on the surface charges of the adsorbent.38Fig. 4(c) refers to the room temperature variation of % Cr(VI) removal as a function of initial pH of the solution corresponding to a fixed amount (0.8 g L−1) of RHA, PPY–PANI, and PPY–PANI@RHA. It is clearly evident that the adsorption characteristic of the Cr(VI) is highly dependent on pH as well as the nature of the adsorbents. Fig. 4(c) shows that the separation of Cr(VI) is considerably lower in the presence of RHA and PPY–PANI adsorbents over the entire range of pH. In contrast, the removal efficiency Cr(VI) in the presence of PPY–PANI@RHA decreased sharply from 97.64% to 21.18%, corresponding to pH values of 2 to 12, respectively. Therefore, all other adsorption experiments were conducted at pH 2 to ensure the maximum removal of Cr(VI) by the PPY–PANI@RHA. It may be noted that Cr(VI) exists in several stable forms such as CrO42−, HCrO4−, and Cr2O72− in aqueous solutions depending on the pH of the solution and chromium concentration.87 When pH is in the range of 1 to 5, HCrO4− is reportedly one of the most dominant species with only a small amount of Cr2O72− and H2CrO4 in Cr(VI).6 In contrast, HCrO4− is rapidly converted to CrO42− with an increase in the pH value. Our findings showed a maximum Cr(VI) removal rate of 97.64% from the aqueous solution at an optimum pH value of 2. It is anticipated that PPY chains are highly protonated for the solution, with its pH in the range of 1–5. This accounts for the ion-exchange between doped Cl− ions on the adsorbent surface with the HCrO4− ions in the Cr(VI) solution.6,10,85In order to strengthen this above statement, the point of zero charge (PZC) on the surface of PPY–PANI@RHA was estimated by studying the pH variation with zeta (ζ) potential, as displayed in Fig. 4(d). The PZC of PPY–PANI@RHA corresponding to the pH value of 10.1 (pHPZC), below and above this value, indicates the adsorbent surface to be positively and negatively charged, respectively.50,87 This reforms our earlier contention that the surface of the PPY–PANI@RHA at pH < pHPZC is highly protonated with positive charge amine functional groups (–NH–, –N <, –NH2) and facilitates the electrostatic attraction of HCrO4− species and accounts for its effective removal from aqueous solutions.40,50 Our findings also showed that surface protonation becomes insignificant with increasing pH in alkaline environments. This could be ascribed to the negatively charged ions (OH−) developed on the adsorbent surface.59 As a result, the significantly low adsorption efficiency of the PPY–PANI@RHA is observed due to the electrostatic repulsion between the adsorbent surface and negatively charged Cr(VI) species.48 In addition, as the pH of the solution is increased (pH > pHPZC), excess OH− ions present in the solution could also compete with negatively charged Cr(VI) species (i.e., CrO42−) for the adsorption sites in PPY–PANI@RHA and results in the poor removal of Cr(VI).6,47 Thus, it is clearly seen that the initial solution pH has a significant impact on the adsorption of Cr(VI) from contaminated water.
3.3. Sorption kinetics study
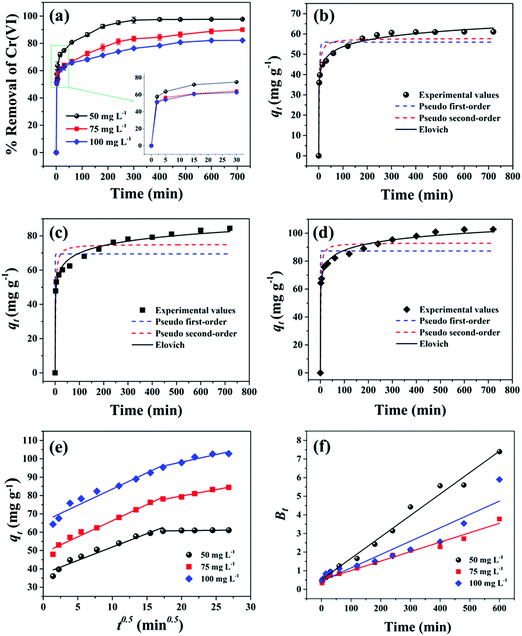
The kinetics of Cr(VI) ion adsorption on PPY–PANI@RHA has been investigated by fitting the experimental data based on the effect of contact time into the pseudo-first-order, pseudo-second-order, Elovich, intraparticle diffusion, and Boyed kinetics models as described in Table S1 (ESI†). Fig. 5(b–f) accordingly show the effect of the adsorption rate of Cr(VI) based on different kinetic models corresponding to the initial Cr(VI) concentrations of 50, 75, and 100 mg L−1, respectively. Table S2 (ESI†) records the kinetic parameters and statistical values for Cr(VI) adsorption on PPY–PANI@RHA related to different models corresponding to 50, 75, and 100 mg L−1 concentrations of Cr(VI) in aqueous solution. The higher correlation coefficient (R2) values and lower root mean square error (RMSE) values clearly demonstrated the better fitting of the experimental data in the Elovich model. In all probability, the chemisorption process played a significant role in the adsorption of Cr(VI) ions on the surface functional groups present in PPY–PANI@RHA.88The Webber-Morris intraparticle diffusion model has also been used to study the rate defining steps in the adsorption process of Cr(VI) ions on PPY–PANI@RHA, and the corresponding details are described in Table S1 (ESI†). The variation of qtversus t0.5 plots in Fig. 5(e) is found to be non-linear, comprising two different slopes with none of these passing through the origin that suggested the sorption process to be controlled by more than one mechanism such as intraparticle/film diffusion.39,89 The initial steeper portion in the plot leads to the rapid extraction of Cr(VI) by PPY–PANI@RHA, mainly followed by surface/film diffusion. Subsequently, the gradual slope indicated a slow adsorption rate and is ascribed to the pore or intra-particle diffusion.10,90
Fig. 5(f) displays the Boyed plots corresponding to the adsorption of Cr(VI) ions for the initial Cr(VI) concentrations of 50, 75, and 100 mg L−1 on PPY–PANI@RHA in order to confirm the rate-limiting steps. These plots were found to be without passing through the origin in all the three Cr(VI) initial concentrations. These suggested external mass transfer (film diffusion) as the rate-determining step in the adsorption of Cr(VI) on PPY–PANI@RHA.16,89,91 However, the higher co-relation coefficient values (R2) and lower root mean square error (RMSE) values, as inferred from Table S2 (ESI†), for the three different initial Cr(VI) concentrations suggest the following order in the fitting of kinetics models for the adsorption of Cr(VI) onto PPY–PANI@RHA: Elovich model > PSO > Boyed > Intraparticle diffusion > PFO.
3.4. Sorption isotherm study
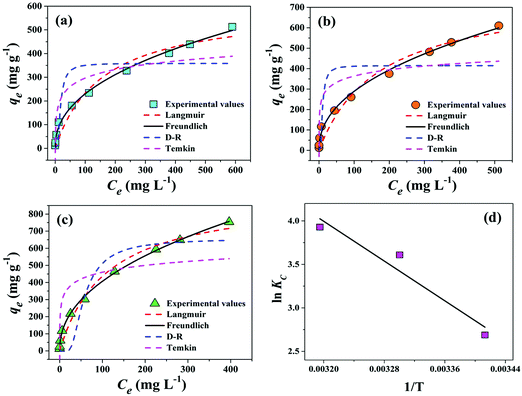
The interaction between solid (adsorbent) and liquid phases (adsorbate species) has been used to study using the Langmuir, Freundlich, Dubinin–Radushkevich (D–R), and Temkin adsorption isotherms as provided in Table S3 (ESI†). Fig. 6(a–c) show the fitting of experimental data in the form of adsorption capacity of the adsorbent at equilibrium (qe) versus adsorbate concentration at equilibrium (Ce) for all these absorption isotherms at 293 K, 303 K, and 313 K temperatures. Table S4 (ESI†) provides the respective isotherm parameters for the adsorption of Cr(VI) on PPY–PANI@RHA. The higher values of the correlation coefficient (R2 ∼ 0.99) corresponding to the Freundlich isotherm indicated its best-fitting at all the temperatures. It is also inferred that adsorption of Cr(VI) is not limited to the monolayer adsorption phenomenon and could be successfully applied to multilayer adsorption over the heterogeneous porous surface of PPY–PANI@RHA.59 However, according to Yang et al. and Boparai et al. the Freundlich isotherm equation could be applicable to both monolayer adsorption (chemisorption) as well as multilayer adsorption (van der Waals adsorption) processes.90,92 The maximum adsorption capacities (qmax) of the PPY–PANI@RHA in Cr(VI) adsorption were found to be 596.97, 769.15, and 914.17 mg g−1 at 293 K, 303 K, and 313 K, respectively. In addition, the isotherm parameter values KF, qmax, and b are increased with the increase of temperature inferred endothermic behavior of the adsorption process.6,85 The comparison of Langmuir maximum adsorption capacity (qmax) values for the removal of Cr(VI) from aqueous solutions by different adsorbents in the literature is summarized in Table S5 (ESI†). It is observed that the maximum Cr(VI) adsorption capacity of the PPY–PANI@RHA is significantly higher compared to those of other reported adsorbents. Therefore, PPY–PANI@RHA nanocomposites could be considered as a promising adsorbent for Cr(VI) removal due to their high adsorption capacity and simple and cost-effective synthesis.3.5. Thermodynamics study
The thermodynamic parameters, for instance, the standard free surface energy change (ΔG0, kJ mol−1), change in standard enthalpy (ΔH0, kJ mol−1), and change in standard entropy (ΔS0, kJ mol−1 K−1) help in understanding the nature of the adsorption of an adsorbate on an adsorbent at any given temperature. In view of this, ΔG0, ΔH0 and ΔS0 were calculated at three different temperatures (293 K, 303 K, and 313 K) for the adsorption of Cr(VI) on PPY–PANI@RHA with a fixed concentration (50 mg L−1) of initial Cr(VI) solution and adsorbent dose (0.8 g L−1) according to the following equations:| ΔG0 = −RTlnKC | (3) |
 | (4) |
| ΔG0 = ΔH0 − TΔS0 | (5) |
The negative values of ΔG0 in Table S6 (ESI†) suggested that the adsorption of Cr(VI) on PPY–PANI@RHA is found to be a spontaneous process.69
3.6. Co-existing ion study
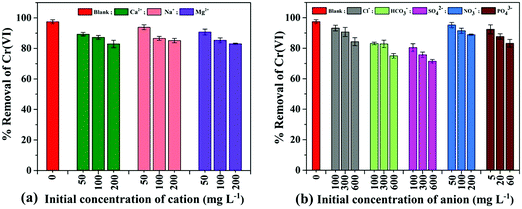
Industrial wastewater consists of a variety of other co-existing ions (cations and anions) along with Cr(VI) interference in the adsorption processes.6 In general, co-cations interfere with the positively charged adsorbates, and co-anions interfere with the negatively charged adsorbates. Therefore, the effect of other co-ions (cations: Ca2+, Na+, and Mg2+; anions: Cl−, HCO32−, SO42−, NO3−, and PO43−) on Cr(VI) ion adsorption using PPY–PANI@RHA was studied, and the corresponding findings are graphically represented in Fig. 7(a) and (b). The experiment was conducted by adding different electrolytes such as NaNO3, Mg(NO3)2·6H2O, NaCl, Al(NO3)3·9H2O, Na2SO4, and Na2HPO4·2H2O by varying their concentrations (5 to 600 mg L−1) separately in the aqueous solution containing a fixed Cr(VI) concentration (50 mg L−1) and at pH∼2. Investigations show that more than 90% Cr(VI) removal is achieved even in the presence of Ca2+, Na+, Mg2+, NO3− (initial concentration of 50 mg L−1), Cl− (initial concentration of 100 mg L−1), and PO43− (initial concentration 5 mg L−1) ions which implies the absence of competitive influence of these co-ions in Cr(VI) adsorption at low concentrations.18 However, % removal of Cr(VI) slightly decreased to around 85% with the increase of the initial concentration of Ca2+, Na+, Mg2+, Cl−, NO3− and PO43−, respectively, as displayed in Fig. 7. In all probability, the removal of Cr(VI) is not significantly altered due to the repulsion between positively charged co-ions and the protonated adsorbent surface in acidic pH.6In contrast, the % removal of Cr(VI) decreased from ∼83 to 75% and 80 to 71% in the presence of HCO3− and SO42− for the initial concentration ranging from 100 to 600 mg L−1, respectively. These findings also suggested that interference is directly proportional to the size of the cations or solubility of the electrolytes and is inversely proportional to the charge on the cations and bond dissociation energy of the electrolytes.17,59 Our results also indicated that Cr(VI) adsorption has significantly interfered in the presence of a high concentration of anions (Cl−, PO43−, HCO3− and SO42−) due to competitive adsorption with Cr(VI) ions (HCrO4−) on PPY–PANI@RHA.6,35 The results also indicated that higher the concentration of co-existing ions, greater the interference on the adsorption of Cr(VI) ions on PPY–PANI@RHA due to the high competition for adsorbent sites. These studies indicate the possible successful application of PPY–PANI@RHA in the removal of Cr(VI) from industrial wastewater as well.
3.7. Proposed adsorption mechanism
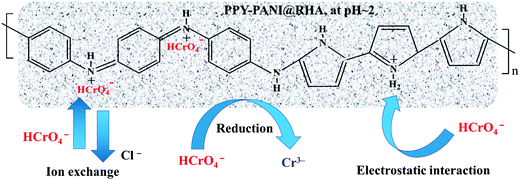
The possible Cr(VI) adsorption mechanism by the PPY–PANI@RHA adsorbent could be described as depicted in Fig. 8. It is a well-established fact that pH plays a very significant role in controlling the adsorption mechanism.38,39 As described earlier in a pH study, the predominated Cr(VI) species is generally HCrO4− at lower pH.6,7 Therefore, it is anticipated that highly protonated polymeric chains in acidic medium could be accounted for the ion-exchange between doped Cl− ions present on the surface of the adsorbent with the HCrO4− ions in the Cr(VI) solution.6,10,85 Besides, strong electrostatic attraction due to the presence of a highly protonated PPY–PANI@RHA surface with positively charged amine functional groups (–NH–, –N <, –NH2) and HCrO4− species, as well as the contribution of the porous structure of PPY–PANI@RHA, could also facilitate the enhanced removal of Cr(VI) from aqueous solutions.40,50 Alternatively, the possibility of Cr(VI) reduction to Cr(III) in the acidic environment due to the high redox potential (range: 1.33–1.38 V) also could not be ruled out.73.8. Desorption and reusability study
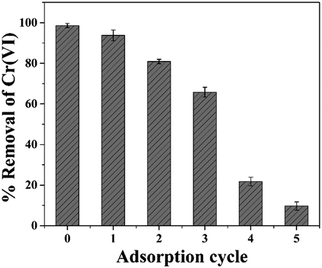
The desorption of hexavalent chromium is an essential aspect of the regeneration of spent adsorbent for industrial applications. In view of this, Cr(VI) desorption was performed by treating the spent adsorbent (PPY–PANI@RHA–Cr(VI)) with 0.01–1 M NaOH solution, which accelerates the deprotonation of –NH3+ groups on the surface of PPY–PANI@RHA, resulting in the decrease of electrostatic attraction between these groups and Cr(VI) species (HCrO4−).6,10,15 It was noted that desorption efficiency varied from ∼7.1% to 29.4%, corresponding to 0.01, 0.2, 0.5, and 1 M NaOH, as displayed in Fig. S4 (ESI†). Such a low desorption efficiency of Cr(VI) could be ascribed to the reduction of Cr(VI) to Cr(III) species.10,47 Subsequently, the regenerated adsorbent was successfully subjected to adsorption of Cr(VI) for five desorption/adsorption cycles, and the findings are displayed in Fig. 9. According to these findings, the removal efficiency in the first and second cycles corresponds to 94 and 80%. However, in the 3rd cycle the Cr(VI) removal efficiency decreased to ∼65%, followed by a continuous drastic reduction in the fourth and fifth cycles. The observed decrease in the Cr(VI) removal efficiency of the spent material is in all probability due to the disintegration/deterioration of PPY–PANI in PPY–PANI@RHA composites.6 Alternatively, the rupture of the polymer chain by a repeated reaction of oxidation with highly oxidizing Cr(VI) species could decrease the mass sorption sites in the spent adsorbent, which could also be accounted for the decrease in the adsorption capacity of used PPY–PANI@RHA.37 Our findings demonstrated that spent PPY–PANI@RHA could be successfully reused up to three times with a high Cr(VI) removal efficiency in a sustainable manner.3.9. Removal of Cr(VI) ions from real industrial effluent samples
A Cr(VI) bearing wastewater sample was collected from the common effluent treatment plant (CETP), Kolkata leather complex (West Bengal, India), and subjected to removal of Cr(VI) using PPY–PANI@RHA. The amount of chromium in the tannery effluent varied depending on the leather processing events. The Cr(VI) concentration was found to be ∼51.33 mg L−1. The characterization of the collected wastewater sample, including TSS, TDS, BOD5, COD, and other co-existing parameters, is provided in Table S7 (ESI†). Fig. S5(a) (ESI†) shows the rate of % removal and adsorption capacity of Cr(VI) with the variation of PPY–PANI@RHA doses (0.5 to 5 g L−1) at a fixed time (300 min) and by keeping other parameters the same. The result shows that with the increase of adsorbent dose, the % removal of Cr(VI) from the wastewater sample is increased, and the corresponding adsorption capacity is decreased. Furthermore, experiments were conducted to study the % removal of Cr(VI) from the wastewater sample by varying the contact time (2 to 300 min) at three different adsorbent doses of 1, 2.5, and 5 g L−1, as displayed in Fig. S5(b) (ESI†). Our finding shows that the Cr(VI) removal efficiency is improved with the increase of adsorbent dose, and at 300 min, it achieved ∼63, 80, and 84% of Cr(VI) removal corresponding to 1, 2.5, and 5 g L−1 of adsorbent dose, respectively. These findings demonstrated that PPY–PANI@RHA could efficiently remove the Cr(VI) ions from the highly polluted tannery wastewater.4. Conclusions
PPY–PANI@RHA nanocomposites were prepared by oxidative polymerization of pyrrole and aniline on the surface of rice husk ash and characterized by XRD, FTIR, Raman spectroscopy, FE-SEM, HR-TEM, BET surface area analysis, porosity and pore volume measurements. Subsequently, PPY–PANI@RHA was used as an adsorbent to study the effect of adsorbate initial concentration, adsorbent dose, pH of the aqueous solution, and contact time on the removal of Cr(VI) from contaminated water in the batch study. Our findings showed PPY–PANI@RHA to be very effective as an adsorbent exhibiting about ∼98% removal of Cr(VI) from contaminated water (pH ∼ 2), corresponding to an initial Cr(VI) concentration of 50 mg L−1 and an adsorbent dose of 0.8 g L−1. The adsorption of Cr(VI) on PPY–PANI@RHA is well described by the Elovich kinetics as well as the Freundlich isotherm model. Additionally, the thermodynamic study demonstrates the nature of Cr(VI) adsorption phenomenon is spontaneous and endothermic. Furthermore, the experiment shows that the removal efficiency of Cr(VI) using PPY–PANI@RHA is not significantly altered in the presence of moderate concentrations of Ca2+, Na+, Mg2+, and Cl−, NO3−, PO43− co-existing ions. Desorption and regeneration studies have also been carried out on the reusability of the PPY–PANI@RHA composite for several times. Finally, our investigations successfully demonstrated the suitability of the prepared PPY–PANI@RHA adsorbent in removing Cr(VI) ions from the highly polluted raw tannery wastewater sample.Conflicts of interest
There are no conflicts to declare.Acknowledgements
S. D. is thankful to the Indian Institute of Technology Kharagpur for providing the fellowship. The authors are also grateful to the authority of the CETP, Kolkata leather complex, West Bengal, India, for helping during Cr(VI) contaminated wastewater sample collection.Notes and references
- C. B. Godiya, L. A. Martins Ruotolo and W. Cai, J. Mater. Chem. A, 2020, 8, 21585–21612 RSC.
- A. P. Panda, P. Rout, K. K. Jena, S. M. Alhassan, S. A. Kumar, U. Jha, R. K. Dey and S. K. Swain, J. Mater. Chem. A, 2019, 7, 9933–9947 RSC.
- A. P. Panda, P. Rout, S. A. Kumar, U. Jha and S. K. Swain, J. Mater. Chem. A, 2020, 8, 4318–4333 RSC.
- Z. Ren, D. Kong, K. Wang and W. Zhang, J. Mater. Chem. A, 2014, 2, 17952–17961 RSC.
- K. Perikamana, I. M. Sasidharan Pillai, A. K. Gupta and A. Sulaiman, J. Environ. Sci. Health, Part A: Toxic/Hazard. Subst. Environ. Eng., 2013, 48, 67–78 CrossRef CAS PubMed.
- Y. Xu, J. Chen, R. Chen, P. Yu, S. Guo and X. Wang, Water Res., 2019, 160, 148–157 CrossRef CAS PubMed.
- M. Sharma, M. Joshi, S. Nigam, S. Shree, D. K. Avasthi, R. Adelung, S. K. Srivastava and Y. Kumar Mishra, Chem. Eng. J., 2019, 358, 540–551 CrossRef CAS.
- M. Sharma, M. Poddar, Y. Gupta, S. Nigam, D. K. Avasthi, R. Adelung, R. Abolhassani, J. Fiutowski, M. Joshi and Y. K. Mishra, Mater. Today Chem., 2020, 17, 100336 CrossRef CAS.
- P. C. Grevatt, US Environmental Protection Agency, Washington DC, 1998.
- M. Bhaumik, A. Maity, V. V. Srinivasu and M. S. Onyango, Chem. Eng. J., 2012, 181–182, 323–333 CrossRef CAS.
- B. Qiu, H. Gu, X. Yan, J. Guo, Y. Wang, D. Sun, Q. Wang, M. Khan, X. Zhang, B. L. Weeks, D. P. Young, Z. Guo and S. Wei, J. Mater. Chem. A, 2014, 2, 17454–17462 RSC.
- A. Zhitkovich, Chem. Res. Toxicol., 2011, 24, 1617–1629 Search PubMed.
- Guidelines for Drinking-Water Quality, World Health Organization (WHO), Geneva, 3rd edn, 2006.
- EPA (Environmental Protection Agency), Environmental Pollution Control Alternatives, EPA/625/5-90/025, EPA/625/4-89/023, Cincinnati, US, 1990.
- V. E. Pakade, N. T. Tavengwa and L. M. Madikizela, RSC Adv., 2019, 9, 26142–26164 RSC.
- J. Acharya, J. N. Sahu, B. K. Sahoo, C. R. Mohanty and B. C. Meikap, Chem. Eng. J., 2009, 150, 25–39 CrossRef CAS.
- M. Ghosh and S. Mishra, Arabian J. Sci. Eng., 2017, 42, 4391–4400 CrossRef CAS.
- J. Hu, G. Chen and I. M. C. Lo, Water Res., 2005, 39, 4528–4536 CrossRef CAS PubMed.
- L. Zhang, W. Xia, X. Liu and W. Zhang, J. Mater. Chem. A, 2015, 3, 331–340 RSC.
- J. Huang, Y. Li, Y. Cao, F. Peng, Y. Cao, Q. Shao, H. Liu and Z. Guo, J. Mater. Chem. A, 2018, 6, 13062–13074 RSC.
- Y. Li, Q. Shen, R. Guan, J. Xue, X. Liu, H. Jia, B. Xu and Y. Wu, J. Mater. Chem. C, 2020, 8, 1025–1040 RSC.
- K. Manna and S. K. Srivastava, ACS Sustainable Chem. Eng., 2017, 5, 10710–10721 CrossRef CAS.
- B. Butoi, A. Groza, P. Dinca, A. Balan and V. Barna, Polymers, 2017, 9, 732 CrossRef PubMed.
- P. Xie, Y. Li, Q. Hou, K. Sui, C. Liu, X. Fu, J. Zhang, V. Murugadoss, J. Fan and Y. Wang, et al. , J. Mater. Chem. C, 2020, 8, 3029–3039 RSC.
- R. Panigrahi and S. K. Srivastava, Sci. Rep., 2015, 5, 7638 CrossRef PubMed.
- V. Elayappan, V. Murugadoss, Z. Fei, P. J. Dyson and S. Angaiah, Eng. Sci., 2020, 10, 78–84 CAS.
- H. Gu, H. Zhang, C. Gao, C. Liang, J. Gu and Z. Guo, ES Mater. Manuf., 2018, 1, 3–12 Search PubMed.
- R. V. Ingle, S. F. Shaikh, P. K. Bhujbal, H. M. Pathan and V. A. Tabhane, ES Mater. Manuf., 2020, 8, 54–59 CAS.
- S. Li, A. Jasim, W. Zhao, L. Fu, M. W. Ullah, Z. Shi and G. Yang, ES Mater. Manuf., 2018, 1, 41–49 Search PubMed.
- J. Zhao, Z. Li, J. Wang, Q. Li and X. Wang, J. Mater. Chem. A, 2015, 3, 15124–15132 RSC.
- W. Sun, W. Zhang, H. Li, Q. Su, P. Zhang and L. Chen, RSC Adv., 2020, 10, 8790–8799 RSC.
- R. Zhang, H. Ma and B. Wang, Ind. Eng. Chem. Res., 2010, 49, 9998–10004 CrossRef CAS.
- H. Eisazadeh, J. Appl. Polym. Sci., 2007, 104, 1964–1967 CrossRef CAS.
- X. Han, L. Gai, H. Jiang, L. Zhao, H. Liu and W. Zhang, Synth. Met., 2013, 171, 1–6 CrossRef CAS.
- M. Janmohammadi, M. Baghdadi, T. M. Adyel and N. Mehrdadi, Sci. Total Environ., 2021, 752, 141850 CrossRef CAS PubMed.
- J. Wang, K. Zhang and L. Zhao, Chem. Eng. J., 2014, 239, 123–131 CrossRef CAS.
- K. K. Krishnani, S. Srinives, B. C. Mohapatra, V. M. Boddu, J. Hao, X. Meng and A. Mulchandani, J. Hazard. Mater., 2013, 252–253, 99–106 CrossRef CAS.
- U. O. Aigbe, R. Das, W. H. Ho, V. Srinivasu and A. Maity, Sep. Purif. Technol., 2018, 194, 377–387 CrossRef CAS.
- S. Dutta, K. Manna, S. K. Srivastava, A. K. Gupta and M. K. Yadav, Sci. Rep., 2020, 10, 4982 CrossRef CAS PubMed.
- S. Deng and Y. P. Ting, Environ. Sci. Technol., 2005, 39, 8490–8496 CrossRef CAS.
- N. A. S. A. Reyad, HBRC J., 2017, 13, 297–301 CrossRef.
- K. Gong, S. Guo, Y. Zhao, Q. Hu, H. Liu, D. Sun, M. Li, B. Qiu and Z. Guo, J. Mater. Chem. A, 2018, 6, 16824–16832 RSC.
- V. D. Thao, B. L. Giang and T. V. Thu, RSC Adv., 2019, 9, 5445–5452 RSC.
- M. Ghorbani and H. Eisazadeh, Composites, Part B, 2013, 45, 1–7 CrossRef CAS.
- A. Andreatta, A. J. Heeger and P. Smith, Polym. Commun., 1990, 31, 275 CAS.
- A. Nazzal and G. Street, J. Chem. Soc., Chem. Commun., 1985, 375–376 RSC.
- R. Karthik and S. Meenakshi, Desalin. Water Treat., 2015, 56, 1587–1600 CrossRef CAS.
- M. Bhaumik, V. K. Gupta and A. Maity, J. Environ. Chem. Eng., 2018, 6, 2514–2527 CrossRef CAS.
- J. Chen, X. Hong, Y. Zhao, Y. Xia, D. Li and Q. Zhang, J. Mater. Sci., 2013, 48, 7708–7717 CrossRef CAS.
- M. Chigondo, H. K. Paumo, M. Bhaumik, K. Pillay and A. Maity, J. Mol. Liq., 2019, 275, 778–791 CrossRef CAS.
- R. Karthik and S. Meenakshi, Int. J. Biol. Macromol., 2015, 72, 711–717 CrossRef CAS PubMed.
- A. G. Yavuz, E. Dincturk-Atalay, A. Uygun, F. Gode and E. Aslan, Desalination, 2011, 279, 325–331 CrossRef CAS.
- S. Sahu, P. Kar, N. Bishoyi, L. Mallik and R. K. Patel, J. Chem. Eng. Data, 2019, 64, 4357–4368 CrossRef CAS.
- W. Fang, X. Jiang, H. Luo and J. Geng, Chemosphere, 2018, 197, 594–602 CrossRef CAS PubMed.
- G. Dognani, P. Hadi, H. Ma, F. C. Cabrera, A. E. Job, D. L. S. Agostini and B. S. Hsiao, Chem. Eng. J., 2019, 372, 341–351 CrossRef CAS.
- K. Swarnalakshmi, P. Chinnaiyan, S. Nivetha and A. S. Nair, Mater. Today: Proc, 2018, 5, 24248–24257 CAS.
- H. D. da Rocha, E. S. Reis, G. P. Ratkovski, R. J. da Silva, F. D. S. Gorza, G. C. Pedro and C. P. de Melo, J. Taiwan Inst. Chem. Eng., 2020, 110, 8–20 CrossRef CAS.
- M. Ghorbani, M. S. Lashkenari and H. Eisazadeh, Synth. Met., 2011, 161, 1430–1433 CrossRef CAS.
- X. Huang, G. Dognani, P. Hadi, M. Yang, A. E. Job and B. S. Hsiao, ACS Sustainable Chem. Eng., 2020, 8, 4734–4744 CrossRef CAS.
- M. Ahmaruzzaman and V. K. Gupta, Ind. Eng. Chem. Res., 2011, 50, 13589–13613 CrossRef CAS.
- F. Ghorbani, A. M. Sanati and M. Maleki, Environ. Stud. Persian Gulf, 2015, 2, 56–65 Search PubMed.
- S. K. Shukla, in Green Materials for Wastewater Treatment, ed. Mu. Naushad and E. Lichtfouse, Springer International Publishing, Cham, 2020, vol. 38, pp. 131–148 Search PubMed.
- K. Dutta and S. K. De, Phys. Lett. A, 2007, 361, 141–145 CrossRef CAS.
- X. Li, N. Dai, G. Wang and X. Song, J. Appl. Polym. Sci., 2008, 107, 403–408 CrossRef CAS.
- T. A. Tikish, A. Kumar and J. Y. Kim, Adv. Mater. Sci. Eng., 2018, 1–5 Search PubMed.
- F. Fusalba and D. Bélanger, J. Phys. Chem. B, 1999, 103, 9044–9054 CrossRef CAS.
- S. Balasubramanian and V. Pugalenthi, Talanta, 1999, 50, 457–467 CrossRef CAS PubMed.
- R. Khan, A. Jabbar, I. Ahmad, W. Khan, A. N. Khan and J. Mirza, Constr. Build. Mater., 2012, 30, 360–365 CrossRef.
- M. Bhaumik, A. Maity, V. V. Srinivasu and M. S. Onyango, J. Hazard. Mater., 2011, 190, 381–390 CrossRef CAS.
- K. He, C. Qin, Q. Wen, C. Wang, B. Wang, S. Yu, C. Hao and K. Chen, J. Appl. Polym. Sci., 2018, 135, 6289 CrossRef.
- N. Malek and A. M. Yusof, Malays. J. Anal. Sci., 2007, 11, 76–83 Search PubMed.
- P. Prabunathan, K. Sethuraman and M. Alagar, RSC Adv., 2014, 4, 47726–47734 RSC.
- M. Ghorbani and H. Eisazadeh, Synth. Met., 2012, 162, 1429–1433 CrossRef CAS.
- V. Vickackaite and V. Ciuvasovaite, Cent. Eur. J. Chem., 2007, 5, 727–738 CAS.
- H.-H. Wu, C.-W. Chang, D. Lu, K. Maeda and C. Hu, ACS Appl. Mater. Interfaces, 2019, 11, 35702–35712 CrossRef CAS PubMed.
- A. Yelil Arasi, J. Juliet Latha Jeyakumari, B. Sundaresan, V. Dhanalakshmi and R. Anbarasan, Spectrochim. Acta, Part A, 2009, 74, 1229–1234 CrossRef PubMed.
- C. Merlini, B. S. Rosa, D. Müller, L. G. Ecco, S. D. A. S. Ramôa and G. M. O. Barra, Polym. Test., 2012, 31, 971–977 CrossRef CAS.
- S. Weng, J. Zhou and Z. Lin, Synth. Met., 2010, 160, 1136–1142 CrossRef CAS.
- H. Bai, Q. Chen, C. Li, C. Lu and G. Shi, Polymer, 2007, 48, 4015–4020 CrossRef CAS.
- Y.-C. Liu and B.-J. Hwang, Synth. Met., 2000, 113, 203–207 CrossRef CAS.
- P. A. Herrera Herrera, N. C. Santana and J. A. Martinez, ECS Trans., 2018, 84, 243–256 CrossRef.
- M. Deng, G. Zhang, X. Peng, J. Lin, X. Pei and R. Huang, Mater. Lett., 2016, 163, 36–38 CrossRef CAS.
- Z. Ren, X. Xu, X. Wang, B. Gao, Q. Yue, W. Song, L. Zhang and H. Wang, J. Colloid Interface Sci., 2016, 468, 313–323 CrossRef CAS PubMed.
- A. S. Hammad, H. Noby, M. F. Elkady and A. H. El-Shazly, IOP Conf. Ser.: Mater. Sci. Eng., 2018, 290, 012001 Search PubMed.
- M. Bhaumik, S. Agarwal, V. K. Gupta and A. Maity, J. Colloid Interface Sci., 2016, 470, 257–267 CrossRef CAS PubMed.
- J. Lu, Z. Liu, Z. Wu, W. Liu and C. Yang, Sep. Purif. Technol., 2020, 237, 116346 CrossRef CAS.
- Y. Pang, G. Zeng, L. Tang, Y. Zhang, Y. Liu, X. Lei, Z. Li, J. Zhang, Z. Liu and Y. Xiong, Chem. Eng. J., 2011, 175, 222–227 CrossRef CAS.
- F.-C. Wu, R.-L. Tseng and R.-S. Juang, Chem. Eng. J., 2009, 150, 366–373 CrossRef CAS.
- S. Nethaji, A. Sivasamy and A. B. Mandal, Int. J. Environ. Sci. Technol., 2013, 10, 231–242 CrossRef CAS.
- H. K. Boparai, M. Joseph and D. M. O’Carroll, J. Hazard. Mater., 2011, 186, 458–465 CrossRef CAS PubMed.
- L. Ai, M. Li and L. Li, J. Chem. Eng. Data, 2011, 56, 3475–3483 CrossRef CAS.
- C. Yang, J. Colloid Interface Sci., 1998, 208, 379–387 CrossRef CAS PubMed.
- E. Mekonnen, M. Yitbarek and T. R. Soreta, South Afr. J. Chem., 2015, 68, 45–52 CAS.
Footnote |
| † Electronic supplementary information (ESI) available. See DOI: 10.1039/d0ma00862a |
| This journal is © The Royal Society of Chemistry 2021 |

