 Open Access Article
A selective detection of nanomolar-range noxious anions in water by a luminescent metal–organic framework†
Pooja
Daga
 a,
Sourav
Sarkar
b,
Prakash
Majee
 a,
Debal Kanti
Singha
 ab,
Sayani
Hui
b,
Partha
Mahata
 *b and
Sudip Kumar
Mondal
 *a
*a
aDepartment of Chemistry, Siksha-Bhavana, Visva-Bharati University, Santiniketan-731235, West Bengal, India. E-mail: sudip.mondal@visva-bharati.ac.in
bDepartment of Chemistry, Jadavpur University, Jadavpur, Kolkata-700 032, West Bengal, India. E-mail: parthachem@gmail.com
First published on 17th December 2020
Abstract
A new metal–organic framework (MOF) showed excellent recognition ability toward five toxic oxo-anions, namely arsenate (HAsO42−), phosphate (PO43−), permanganate (MnO4−), chromate (CrO42−), and dichromate (Cr2O72−) in aqueous medium upon irradiation with UV light. The MOF [Y(tp)(ox)0.5(H2O)2]·H2O, 1 and a 20% Tb-doped MOF [Y0.8Tb0.2(tp)(ox)0.5(H2O)2]·H2O, 1a were synthesized by the self-assembly of Y(III)/Tb(III), terephthalic acid (H2tp), and oxalic acid (H2ox) under hydrothermal conditions. The crystal structure of 1 demonstrated three-dimensional structures with water occupying a one-dimensional channel. Upon UV light exposure, an aqueous suspension of 1a exhibited strong green luminescence. This luminescence showed a colour change when water was contaminated by the said anions. Several other interfering anions were also tested to establish its selectivity as a chemosensor toward the aforementioned anions. The estimated limit of detection (LOD) of 1a for these anions was 41.7, 33.5, 19.6, 40.8, and 43.9 nM for HAsO42−, PO43−, MnO4−, CrO42−, and Cr2O72−, respectively, which were significantly lower than the levels recommended for these anions in the aqueous environment. The root of the luminescence quenching of 1a in the presence of such a low concentration of aforementioned anions was due to the interruption of the sensitization process of the Tb centre. Anions HAsO42−, PO43−, and MnO4− entered the channel of MOF and interacted with Y3+/Tb3+ centres at the molecular-level, which hampered the energy flow from the ligand to the metal centre through a weakening of Tb–O bonds of carboxylates, resulting in a quenching of the Tb centre emission with a concomitant enhancement of the ligand centre emission. Additionally, in the case of the MnO4− ion, an inner filter effect also contributed to the quenching of the Tb centre emission, but to a smaller extent. For CrO42− and Cr2O72− anions, the inner filter effect is the key mechanism for the luminescence intensity reduction. Besides, these analytes could also reduce the energy flow from the ligand to the lanthanide ion, which led to the luminescence quenching.
Introduction
Anions play crucial roles in chemical, biological, medicinal, catalytic, industrial, and environmental processes.1,2 Importantly, the presence of some particular toxic anions, namely HAsO42−, PO43−, MnO4−, CrO42−, and Cr2O72−, in water is becoming one of the foremost critical problems for public health as well as for environmental sustainability. Arsenic, one of the most toxic and carcinogenic metalloids, is naturally present as arsenate at a very high concentration in groundwater in different regions of the world.3 Some natural sources and industrial processes, such as mining, smelting, and coal-fired power plants, contribute to the presence of arsenic in air, water, and soil.4,5 Arsenate interrupts the Kreb cycle by affecting the conversion of ATP to ADP through permanent replacement of phosphate groups.6 Arsenic can easily accumulate in the human body through drinking water and contaminated food,3 which are among the biggest threats to human health. Arsenic-contaminated water can induce numerous health problems, such as cancers of the skin, liver, lung, and bladder, cardiovascular disease, gastrointestinal disease, diabetes, dermal toxicity, and neurodegenerative disorders.7,8 The maximum contaminant limit for arsenic in drinking water is 10 ppb as recommended by the World Health Organization (WHO) and U.S. Environment Protection Agency (USEPA).9Phosphates are important constituents in the human body, being a part of DNA materials and also living systems.10 Phosphates also help in many biological systems, such as in signal transduction and energy storage,11 and the determination of its concentration in body fluids can aid recognizing several diseases, including hyperparathyroidism and Fanconi syndrome.12 Phosphates are considered to be among the main component of biomolecules.10 Phosphates are widely distributed in the industrial and agricultural fields, such as food and beverage additives, synthetic fertilizers, animal feed, and domestic detergents. The recommended phosphate intake is 800 mg day−1. Too much phosphate can cause severe health problems, such as kidney damage and osteoporosis, whereas phosphate shortage can be caused by the extensive use of medicine. The source of phosphates in the environment is mainly from industrial processes, and domestic and agricultural wastewater, where they act as a pollutant that can cause water eutrophication, which leads to the accumulation of excessive pollution in aquatic ecosystems, such as the depletion of dissolved oxygen, excessive algal growth accompanied by red tide, and a decrease in water quality.12,13
Other anion pollutants, namely MnO4−, CrO42−, and Cr2O72−, can serve as strong oxidizing agents in both industrial and laboratory processes.14 Excess MnO4− ions can cause a hazardous effect on human health, such as gastrointestinal disorders, liver and kidney damage, and deformity.15 If a large amount of MnO4− is swallowed in water, it can cause skin irritation and has adverse effects on the respiratory tract.16 Dichromate (Cr2O72−) and chromate (CrO42−) have been widely used in various industrial processes; for example, electroplating, paint, leather tanning, pigment production, wood preservation, pesticides, and metallurgy.17 Being carcinogenic, it is very harmful to human health and the environment.18 An excess ingestion of Cr2O72− and CrO42− may lead to skin allergy and ulcers, renal failure, cancer, deformity, and gene mutation.19,20 Given this concern, for the sake of human health and environmental protection, it is highly desired to detect these undesirable mutagenic anions by developing suitable and efficient sensor materials.
In recent times, the luminescence-based detection method has demonstrated appreciable advantages, such as a rapid response time, high sensitivity, selectivity, reversibility, and easy manipulation, over other technology-based methods.21,22 In the currently reported literature, various materials, such as quantum dots, nanomaterials, conjugated polymers, and organic molecules, have been developed for sensing these toxic anions.23–26 However, all these materials have some limitations, such as poor stability, complicated synthesis procedure, easy interference from other analytes, environmental toxicity, and lack of control over the molecular organisation.27 Nowadays, metal–organic frameworks (MOFs) stand out as a unique type of sensor among other modern luminescent sensors. MOFs are rapidly becoming attractive to researchers due to their crystalline nature, well-defined designable structure, unusual flexibility, and mild synthetic condition,28,29 and also have incredible potential applications in gas storage, separation,30 catalysis,31 ion-exchange, and sensing,22,32 among others. Some factors, including the variable oxidation state, formal charges, coordination environment around the metal ions, and different binding modes of organic ligands, respond to the structural identity of MOFs.33–35 This versatile behaviour of MOFs can be utilized in a detection mechanism even at the molecular-level. MOFs can selectively recognize small molecules and can also interact with them via coordinate bonds, hydrogen bonds, π–π interactions, and by electron-transfer and energy-transfer processes.36
In particular, lanthanide MOFs (Ln MOFs) are highly desired luminescent materials, because they possess amazing features such as a high coordination number, flexible structure, large Stoke's shift, sharp emission peaks, long-lived emission, and high quantum yield,37 that show luminescent properties via the antenna effect, where they have an aromatic ligand response as sensitizers.18 In this process after excitation, the organic ligands go to the excited state, from which a part of the energy is transferred to the metal centre, resulting in a metal-centred luminescence. Detection of these anions has already been attempted by a number of pure lanthanide-based MOFs,38,39 but the detection of these anions by the naked eye with superior sensitivity has not yet been explored as the pure lanthanide-based MOFs undergo a self-quenching phenomenon.40–42 Minimization of this self-quenching can be performed by ensuring the separation between two adjacent emissive lanthanide centres and this can be done by using a very little amount of emissive lanthanide centres.41,43,44 Moreover, Ln MOFs that are doped with inert lanthanides have attracted immense interest.45
Considering the previous literature reports, Yan et al. reported a luminescent MOF for the detection of MnO4−, CrO42−, and Cr2O72− by a luminescence quenching effect.46 Liu's group reported a lanthanide-based MOF that could selectively and sensitively detect PO43− and AsO43− ions in an aqueous solution.47 Zou and co-workers synthesized two lanthanide-based MOFs for the recognition of CrO42− and Cr2O72− anions through luminescence quenching.48 Morsali et al. constructed a zinc-based MOF with potential ability for the quantitative detection of MnO4− and Cr2O72− ions.49 A lanthanide coordination polymer based on metal-centred luminescence for sensing MnO4− ions was reported by Yang et al.50 Cheng and co-workers exploited a lanthanide MOF for sensing PO43− ions.39 To date, several MOFs have been reported for separately sensing these toxic ions in an aqueous phase,16,39,51–53 while a few MOFs for sensing MnO4−, CrO42−, and Cr2O72− simultaneously have been reported,49 but no such MOF has been reported that can detect all five pollutants in our study (HAsO42−, MnO4−, PO43−, CrO42−, Cr2O72−) in aqueous media simultaneously. Based on the above considerations, we synthesized a 20% terbium-doped yttrium-based metal–organic framework, [Y0.8Tb0.2(tp)(ox)0.5(H2O)2]·H2O (1a) hydrothermally using Y(III), Tb(III), terephthalic acid, and oxalic acid for the selective detection of these noxious anions. The structure of the pure Y compound (1) was determined using single-crystal X-ray diffraction. The crystal structure of 1 showed a three-dimensional (3D) structure with water occupying one-dimensional (1D) channels. Compound 1a exhibited intense green emission when excited at 280 nm and showed significant luminescence quenching in the case of all these detectable ions. Also, 1a could act as a phosphor material, in which the MOF itself acts as the host lattice while the Tb(III) ion and tp ligand behave as the activator and sensitizer, respectively. The mechanism behind the high selectivity and sensitivity of 1a toward these oxo-anions is explained in detail herein.
Experimental section
Materials
All the reagents employed were commercially available and used as received without further purification. Y(NO3)3·6H2O (Sigma Aldrich, 99.9%), Tb(NO3)3·xH2O (Alfa Aeser, 99.9%), terephthalic acid (tp) (Merck, 98%), oxalic acid dihydrate (ox) (Merck, 99%) and NaOH (Merck, 99%) were used for the synthesis. Na2HAsO4·7H2O (Himedia, 98.5%), K3PO4 (Sigma Aldrich, 98%), KMnO4 (Merck, 99%), K2CrO4 (Merck, 99.5%), K2Cr2O7 (Merck, 99.5%), Na2CO3 (Merck, 99.5%), NaI (Merck, 99%), NaF (Merck, 97%), NaCl (Merck, 99%), NaBr (Merck, 99%), NaNO2 (Merck, 99%), NaNO3 (Merck, 99.5%), Na2SO4 (Merck, 99%) and CH3COONa.3H2O (Merck, 99%) were used for the detection experiments. Doubly distilled water was used throughout the entire experiment.Instrumentation
X-ray powder diffraction patterns were measured on a Bruker D8 Advance X-ray diffractometer equipped with Cu Kα radiation (λ = 1.5418 Å) in the 2θ range between 5°–50° at room temperature. FTIR spectra for both compounds (1 and 1a) were recorded on a Bruker ALPHA II spectrometer in an attenuated total reflectance (ATR) mode in the spectral range 4000–600 cm−1. Thermogravimetric analysis (TGA) was carried out using a Perkin-Elmer Diamond instrument STA 6000 analyzer. The experiments were performed in a nitrogen atmosphere (flow rate = 20 mL min−1) at a heating rate of 20 °C per minute, in the temperature range of 45 °C to 900 °C. Field-emission scanning electron microscopy (FE-SEM) and energy dispersive analysis of X-rays (EDX) were carried out using a Zeiss GeminiSEM 450 field-emission scanning electron microscope, operating at an accelerating voltage of 5 kV.Single-crystal structure determination
A suitable single crystal was selected under a polarising microscope and glued to thin glass fibre. Diffraction measurements were carried out on a Bruker AXS smart Apex CCD diffractometer with Mo Kα (λ = 0.71073 Å) radiation at room temperature. Data were collected with an ω scan width of 0.3°. A total of 606 frames were collected in three different settings of φ (0°, 90°, 180°) keeping the sample-to-detector distance fixed at 6.03 cm and the detector position (2θ) fixed at −25°. The data were reduced using SAINTPLUS54 and semi-empirical absorption corrections were applied using SADABS.55 The structure was solved by direct methods and refined using the SHELXS-9756 program present in the WinGx suite of programs (Version 1.63.04a).57 All the hydrogen atoms of the carboxylic acids were initially located in the difference Fourier maps and for the final refinement, the hydrogen atoms were placed in geometrically ideal positions and held in the riding mode. Final refinement included the atomic positions for all the atoms, anisotropic thermal parameters for all the non-hydrogen atoms, and isotropic thermal parameters for all the hydrogen atoms. Full matrix least-squares refinement against |F2| was performed using the WinGx package of programs. A summary of the crystallographic data and structure refinements is shown in Table 1. Crystallographic data for 1 were deposited with the Cambridge Crystallographic Data Centre, CCDC 2035451.†| R 1 = Σ||F0| − |Fc||/Σ|F0|; wR2 = {Σ[w(F02 − Fc2)2]/Σ[w(F02)2]}1/2. w = 1/[σ2(F0)2 + (aP)2 + bP], P = [max.(F02,0) + 2(Fc)2]/3, where a = 0.0756 and b = 3.2972. | |
|---|---|
| Empirical formula | C9H4O9Y |
| Formula weight | 345.03 |
| Crystal system | Monoclinic |
| Space group | P21/c(No. 14) |
| a (Å) | 8.2467(16) |
| b (Å) | 18.774(4) |
| c (Å) | 7.7968(16) |
| α (deg) | 90 |
| β (deg) | 105.817(6) |
| γ (deg) | 90 |
| Volume (Å3) | 1161.4(4) |
| Z | 4 |
| T (K) | 273(2) |
| ρ calc (g cm−3) | 1.973 |
| μ (mm−1) | 5.062 |
| θ range (deg) | 2.170 to 27.101 |
| λ (Mo Kα) (Å) | 0.71073 |
| R indices [I > 2σ(I)] | R 1 = 0.0555, wR2 = 0.1449 |
| R indices (all data) | R 1 = 0.0766, wR2 = 0.1576 |
Photoluminescence measurements
The photoluminescence spectra were recorded on a Hitachi F-7100 spectrofluorometer using a xenon lamp as the excitation source. The suspension of 1a was prepared by immersing 5 mg of powdered sample in 5 mL of water, and the mixture was then ultrasonicated for 45 min. The excitation and emission slit width was set at 5 nm. The photomultiplier voltage used was 700 V. The cut-off filter was set at 420 nm to exclude the ligand centre luminescence. For the luminescence measurements, 50 μL of stock solution was used in 2 mL of water in a quartz cuvette. The solutions of anions (5 × 10⁻³ M) were prepared in water for the sensing experiments. A Shimadzu UV 3101PC spectrophotometer was used to record the UV-Visible spectra. The entire experiment was conducted at room temperature.Luminescence lifetime measurements
Time-correlated single-photon counting (TCSPC) measurements were carried out at room temperature on a HORIBA Jobin Yvon instrument using a nanosecond pulse lamp as the excitation source and utilizing a Hamamatsu MCP photomultiplier (R3809) detector. The excitation wavelength was selected at 280 nm and the emission decay curve was monitored at 420 nm. All the decays were de-convoluted and fitted with a double-exponential function using Igor software.Quantum yield measurements
Luminescence quantum yields (QYs) were calculated using the following equation:58 | (1) |
Result and discussion
Crystal structure
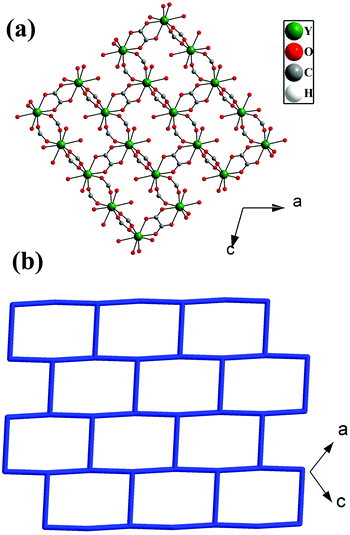
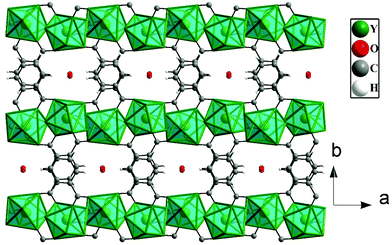
The asymmetric unit of 1 consists of one Y3+ ion, one terephthalate ion (tp), half oxalate ion, two coordinated water molecules and one extra framework water molecule (see ESI,† Fig. S1). Here, Y3+ is eight coordinated by four carboxylate oxygen atoms of terephthalate ions, two oxygen atoms of oxalates and two water molecules. Each oxalate ion connects two Y3+ ions in a μ2-bridging mode and each terephthalate ion uses the μ4-η1:η1:η1:η1 bridging mode to connect four Y3+ ions in compound 1 (see ESI,† Fig. S2). The Y–O bonds have average distances of 2.37 Å and the O–Y–O bond angles are in the range of 66.96 (13)°–147.46(16)°. The selected bond distances and bond angles are listed in Tables S1 and S2 (ESI†).The Y3+ ions are connected by the carboxylates of terephthalates and oxalates to form a two-dimensional (2D) structure in the ac plane (Fig. 1a). The 2D structure can be simplified based on network topology. Here the Y3+ ions act as T-shaped three-connected nodes and the connectivity among the Y3+ ions resembles brick-wall topologies with a 63 Schläfli symbol (Fig. 1b). The 2D structures are further connected by the terephthalates to form 3D structures with 1D water occupying the channels (Fig. 2).
Characterization and thermal stability
The selected X-ray diffraction patterns for both 1 and 1a are shown in Fig. S3 (ESI†). To confirm the phase purity, the X-ray patterns were compared with the simulated XRD pattern generated based on the structure determined using single-crystal XRD. The experimental patterns were in good agreement with the simulated one. The FTIR spectra of 1 and 1a are shown in Fig. S4 and S5 (ESI†), respectively. The thermal stability of both compounds was investigated and a weight loss was found with the increase in temperature. Fig. S6 (ESI†) outlines the TGA plot for 1. The curve indicates that the first weight loss of 6% took place up to a temperature of 180 °C. The calculated weight loss of 5.2% was well consistent with the experimental result and was due to the loss of one guest aqua molecule. The second step involved a total weight loss of 17% (calculated 16%) up to a temperature of 230 °C and was due to the elimination of the coordinated water molecule. In the last step, above 427 °C, decomposition of the framework occurred. Similarly, the TGA plot of 1a revealed that the weight loss occurred in three distinct steps (as shown in Fig. S7, ESI†). The first weight loss of 5.1% (calculated 5.01%) up to 175 °C could be attributed to the loss of one lattice water molecule. The second step involved a total weight loss of 14% (calculated 15%) up to 225 °C, which could be related to the removal of two coordinated water molecules. The weight loss above 445 °C may be due to the disintegration of the framework. This result proved that 1 and 1a were stable up to 427 °C and 445 °C, respectively, suggesting their remarkable thermal stability. The size and morphology of 1a were evaluated using field-emission scanning electron microscopy (FE-SEM) of a well-ground powdered sample (Fig. S8, ESI†). The EDX elemental mapping analyses were carried out on a well-ground sample of 1a comprising several crystals, which revealed the presence of Tb and Y with a molar ratio of about 1![[thin space (1/6-em)]](https://www.rsc.org/images/entities/char_2009.gif) :
:![[thin space (1/6-em)]](https://www.rsc.org/images/entities/char_2009.gif) 4 and the homogeneous distribution of elements in 1a (Fig. S9, ESI† and Fig. 3).
4 and the homogeneous distribution of elements in 1a (Fig. S9, ESI† and Fig. 3).
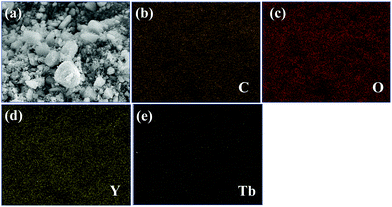 | ||
| Fig. 3 (a) SEM image in which elemental mapping is performed in 1a and elemental mapping images, (b) C K, (c) O K, (d) Y L and (e) Tb L. | ||
Photoluminescence measurements
The photoluminescence spectra of 1a were studied at room temperature using its suspension in water. The emission spectra for both the ligand centre and metal centre were recorded at an excitation wavelength of 280 nm (Fig. S10, ESI†). Sample 1a exhibited four Tb3+-centred emissions at around 490, 546, 583 and 621 nm, which are known to be due to 5D4 → 7F6, 5D4 → 7F5, 5D4 → 7F4 and 5D4 → 7F3 transitions, respectively. Because of these four emission bands, the suspension appeared bright green when irradiated with UV light. The corresponding excitation spectra were also recorded by monitoring the emission wavelengths at 546 nm. Sample 1a also showed two emission bands around 340 and 420 nm due to ligand centre transitions. In the absence of metal centre emissions, these ligand-centred bands were responsible for the bluish colour of the suspension under UV light. The bright green metal centre emissions of 1a were used in this work for recognizing five toxic oxo-anions in aqueous media.Recognition of toxic oxo-anions
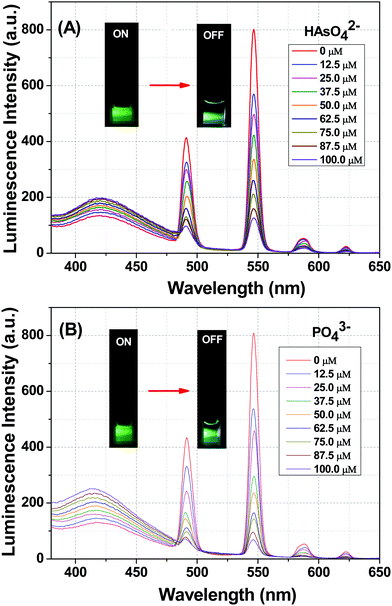
The photoluminescence-based titrations were performed with the incremental addition of various anion solutions to an aqueous suspension of 1a. The emission intensities of the metal centre peaks were found to be quenched to a great extent upon the cumulative addition (up to 100 μM) of the toxic oxo-anions (HAsO42−, PO43−, MnO4−, CrO42− and Cr2O72−). A concomitant increase in the emission intensity of the ligand-centred peaks was also observed for HAsO42−, PO43− and MnO4− anions, which was evident from Fig. 4(A), (B) and Fig. S11 (ESI†), respectively, upon the gradual addition of HAsO42−, PO43− and MnO4− anions (up to 100 μM) to 1a. Fig. S12 and S13 (ESI†) represent the luminescence spectra of 1a upon the incremental addition of CrO42− and Cr2O72− ions, respectively. Here, in these cases, there was no significant change in the ligand centre emission. The quenching efficiency (η) was calculated by monitoring the intensity at 546 nm using the familiar equation: η = (1 − I/I0) × 100%, where I0 is the initial luminescence intensity of the suspension of 1a and I is the luminescence intensity after the addition of the analytes. The calculated values of η were found to be 83.74%, 91.62%, 92.92%, 88.39% and 74.19% for HAsO42−, PO43−, MnO4−, CrO42− and Cr2O72−, respectively. The luminescence titration experiments were also performed for several other anions, namely CH3COO−, F−, Br−, CO32−, Cl−, I−, SO42−, NO2− and NO3−, but the emission spectra showed no significant responses (Fig. S14–S22, ESI†). These quenching behaviours are represented in the bar diagram in Fig. S23 (ESI†) after the addition of 100 μM of all the anions to the aqueous suspension of 1a. The 3D bar diagram (Fig. 5) obtained by plotting [(I0/I) − 1] against the concentration of anions suggested that 1a can act as a remarkable luminescent turn-off chemosensor for the selective detection of these toxic anions in aqueous media.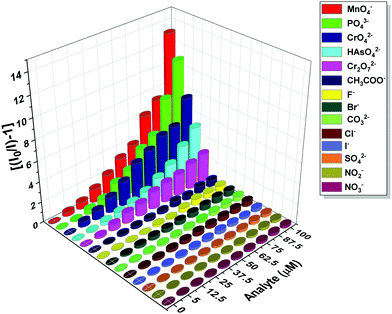 | ||
| Fig. 5 Plot of [(I0/I) − 1] against the concentration of analytes for 1a after the addition of 100 μM of these analytes. | ||
The limit of detection (LOD) of 1a towards HAsO42−, PO43−, MnO4−, CrO42− and Cr2O72− were determined from the luminescence data in the ultra-low concentration range of these anions (please see Fig. S24–S28 and Table S3 in the ESI† for details). The LOD values were calculated to be 41.7, 33.5, 19.6, 40.8 and 43.9 nM for HAsO42−, PO43−, MnO4−, CrO42− and Cr2O72−, respectively. These values are much lower than the standard limit of these anions in drinking water. The maximum permissible level of arsenic in drinking water is 10 ppb as suggested by the World Health Organization.52,60 The detection requirement of phosphate discharge criteria in the water environment is reported to be 6.4–320 μM.61 The permissible level of MnO4− and CrO42− in drinking water is 50 μg L−1 as recommended by the US Environmental Protection Agency and World Health Organization.49
The quenching constant (KSV) was obtained from the Stern–Volmer (SV) equation, (I0/I) = KSV[M] + 1, where I0 is the initial luminescence intensity, I is the luminescence intensity after the addition of analytes and [M] is the molar concentration of the analytes. By plotting the luminescence intensity ratio (I0/I) vs. the analyte concentration (up to 25 μM), KSV values were obtained from the linear fitting (Fig. S29, ESI†). The KSV (slope) values were calculated to be 2.3 × 10⁴, 3.4 × 10⁴, 5.2 × 10⁴, 5.8 × 10⁴ and 4.2 × 10⁴ M−1 for HAsO42−, PO43−, MnO4−, CrO42− and Cr2O72−, respectively. Comparisons of the LOD values and the KSV values with the previously reported MOF-based luminescence probe for these anions are given in Table 2, and Tables S4 and S5 (ESI†). From these comparisons, we can claim that 1a is one of the best chemosensors of the toxic oxo-anions in terms of sensitivity.
| Sl. no. | Luminescent sensor | Anions detected | Medium | LOD | K SV (M−1) | Ref. |
|---|---|---|---|---|---|---|
| NM = not mentioned. | ||||||
| 1. | NH2-MIL-88(Fe) | HAsO42− | H2O | 4.2 ppb | NM | 52 |
| 2. | UiO-66-NH2 | PO43− | HEPES buffer | 1.25 μM | NM | 12 |
| 3. | TbNTA–H2O | PO43− | H2O | NM | NM | 62 |
| 4. | {[Eu5(OH)6(TZI)3(DMA)1.5(H2O)10.5]·DMA·0.5H2O}n | HAsO42− | H2O | NM | 92![[thin space (1/6-em)]](https://www.rsc.org/images/entities/char_2009.gif) 249 249 |
47 |
| 5. | {[Tb5(OH)6(TZI)3(DMA)1.5(H2O)10.5]·DMA·0.5H2O}n | HAsO42− | H2O | NM | 90![[thin space (1/6-em)]](https://www.rsc.org/images/entities/char_2009.gif) 485 485 |
47 |
| 6. | {[Eu5(OH)6(TZI)3(DMA)1.5(H2O)10.5]·DMA·0.5H2O}n | PO43− | H2O | NM | 55![[thin space (1/6-em)]](https://www.rsc.org/images/entities/char_2009.gif) 858 858 |
47 |
| 7. | {[Tb5(OH)6(TZI)3(DMA)1.5(H2O)10.5]·DMA·0.5H2O}n | PO43− | H2O | NM | 96![[thin space (1/6-em)]](https://www.rsc.org/images/entities/char_2009.gif) 067 067 |
47 |
| 8. | [Pr(L10)(NO3)(H2O)2]n | PO43− | H2O | 1.0 μM | 4.48 × 10³ | 63 |
| 9. | {[Eu1.5(BTB)1.5(H2O)]3DMF}n | PO43− | H2O | 10 μM | 7.97 × 10³ | 64 |
| 10. | {Eu2L3(DMF)}·2DMF | PO43− | HEPES buffer | 6.62 μM | 4.0 × 10³ | 61 |
| 11. | [Y0.8Tb0.2(tp)(ox)0.5(H2O)2]·H2O | HAsO42− | H2O | 41.7 nM | 2.30 × 10⁴ | This work |
| 12. | [Y0.8Tb0.2(tp)(ox)0.5(H2O)2]·H2O | PO43− | H2O | 33.5 nM | 3.4 × 10⁴ | This work |
However, for the real-world applications of 1a, it is highly desirable to check the selectivity towards various toxic anions over other competing anions as they may be present along with these detectable anions. Hence, we performed the luminescence-based titration experiments with a suspension of 1a in aqueous solution. To the suspension of 1a, an aqueous solution of 12.5 μM of other anions, such as F−, I−, Br−, CO32−, SO42−, NO2−, Cl−, NO3− and CH3COO−, were added one after the other followed by the stepwise addition of 12.5 μM of the targeted anions until it reached a total concentration of 100 μM. From Fig. S30 (ESI†), it was observed that the addition of HAsO42− decreased the luminescence intensity remarkably even in the presence of all the other interfering ions. Similarly, selectivity experiments were repeated for PO43−, MnO4− and CrO42− using the aforementioned procedure (Fig. S31–S33, ESI†). There was a minor change in the luminescence intensity of the compound after adding other competing anions, but the turn-off behaviour increased sharply with the gradual addition of HAsO42−, PO43−, MnO4−, CrO42− and Cr2O72− ions despite other co-existing anion being present in the solution. This showed that 1a possessed remarkable selectivity and sensitivity towards these oxo-anions in water.
Chemical stability
It is always recommended to check the chemical stability of a chemosensor in the presence of the target analytes. Consequently, first, the powdered form of 1a was immersed in water for 24 h. Then its PXRD patterns were measured, and remained well consistent with the simulated one (Fig. S34, ESI†). Similarly, the PXRD patterns were also taken for 1a immersed in an aqueous solution of HAsO42−, PO43−, MnO4−, CrO42− and Cr2O72− anions (Fig. S34, ESI†). The comparison showed that the PXRD patterns also maintained their integrity in the presence of these detectable anions. These results confirmed the stability of the 3D framework of 1a in an aqueous medium and also after the detection experiments.Lifetime decay analysis
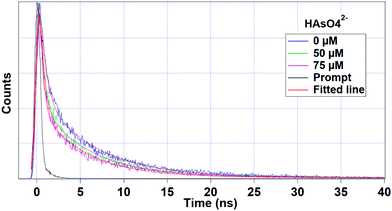
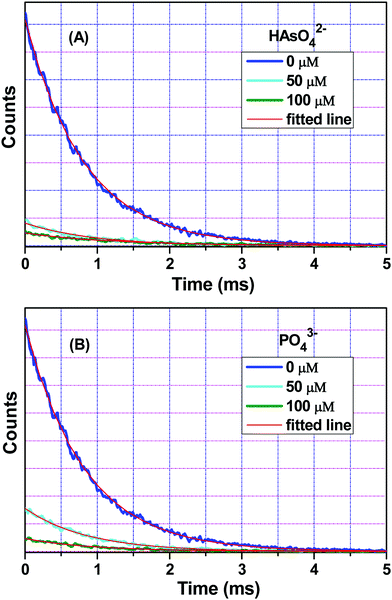
Fig. 6 interprets the luminescence lifetime decay curves of the ligand-centred emission (λem = 420 nm) of 1a along with the biexponential fitted lines before and after the introduction of 75 μM of HAsO42− anions. The average lifetime of 1a was found to be 2.40 ns in an aqueous suspension. After the addition of 75 μM of HAsO42− anions, the average lifetime was reduced to 1.20 ns (Table 3). However, the decay curves in the case of the other anions did not show significant changes in lifetime (Table 3), with the decay curves shown in Fig. S35–S38 (see ESI†). For the anions MnO4−, CrO42− and Cr2O72−, no change in lifetime was observed before and after their addition to 1a, as could be expected in the case of an inner filter effect. However, for HAsO42− and PO43−, where there is no chance of an inner filter effect, further investigation is required to confirm the mechanism. Using the quantum yield data (Fig. S39, see ESI†), we calculated the radiative (Kr) and non-radiative (Knr) rate constants of the excited ligand centre using eqn (2) and (3), the values of which are also included in Table 3. This clearly indicated the increase in the ratio of radiative rate constant over non-radiative rate constants in the case of HAsO42−and PO43− and the opposite in the case of MnO4−, CrO42− and Cr2O72− ions. | (2) |
 | (3) |
| Anions added | Concentration (μM) | a 1 | a 2 | τ 1 (ns) | τ 2 (ns) | 〈τ〉 (ns) | ϕ | K r (× 10−7) (s−1) | K nr (× 10−7) (s−1) |
|---|---|---|---|---|---|---|---|---|---|
| HAsO42− | 0 | 0.68 | 0.32 | 0.60 | 6.20 | 2.40 | 0.26 | 10.80 | 30.90 |
| 50 | 0.78 | 0.22 | 0.40 | 5.70 | 1.60 | 0.31 | 19.40 | 43.10 | |
| 75 | 0.82 | 0.18 | 0.30 | 5.30 | 1.20 | 0.34 | 28.30 | 55.00 | |
| PO43− | 0 | 0.68 | 0.32 | 0.60 | 6.20 | 2.40 | 0.26 | 10.80 | 30.90 |
| 50 | 0.70 | 0.30 | 0.60 | 6.20 | 2.30 | 0.34 | 14.80 | 28.70 | |
| MnO4− | 0 | 0.68 | 0.32 | 0.60 | 6.20 | 2.40 | 0.26 | 10.80 | 30.90 |
| 50 | 0.69 | 0.31 | 0.60 | 6.10 | 2.30 | 0.20 | 8.70 | 34.80 | |
| CrO42− | 0 | 0.68 | 0.32 | 0.60 | 6.20 | 2.40 | 0.26 | 10.80 | 30.90 |
| 50 | 0.63 | 0.37 | 0.70 | 6.50 | 2.80 | 0.20 | 7.10 | 28.60 | |
| Cr2O72− | 0 | 0.68 | 0.32 | 0.60 | 6.20 | 2.40 | 0.26 | 10.80 | 30.90 |
| 50 | 0.67 | 0.33 | 0.70 | 6.40 | 2.60 | 0.21 | 8.00 | 30.40 |
FTIR experiments
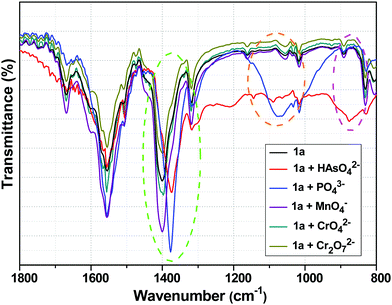
Fig. 8 shows the FTIR spectra of 1a with and without HAsO42−, PO43−, MnO4−, CrO42− and Cr2O72− anions. The peak at 1400 cm−1 of 1a, which could be ascribed to the symmetric stretching vibration of carboxylate group (O![[double bond, length as m-dash]](https://www.rsc.org/images/entities/char_e001.gif) C–O−), was shifted to 1372 and 1377 cm−1 in the presence of HAsO42− and PO43− anions, respectively.13,52 The appearance of the band at 875 cm−1 corresponded to the As–O bond.65–67 The generation of the broad peak in the range of 1200–900 cm−1 confirmed the presence of a PO43− anion in the 3D structure of the framework.12 The shifts in the symmetric stretching vibration frequencies indicated the weakening of the Y/Tb-carboxylate bond, which was a consequence of the interaction between the anions (HAsO42− and PO43−) and metal centre (Y/Tb) of 1a. In the presence of MnO4−, CrO42− and Cr2O72− anions, there was no significant change in the FTIR spectra of 1a (Fig. 8).
C–O−), was shifted to 1372 and 1377 cm−1 in the presence of HAsO42− and PO43− anions, respectively.13,52 The appearance of the band at 875 cm−1 corresponded to the As–O bond.65–67 The generation of the broad peak in the range of 1200–900 cm−1 confirmed the presence of a PO43− anion in the 3D structure of the framework.12 The shifts in the symmetric stretching vibration frequencies indicated the weakening of the Y/Tb-carboxylate bond, which was a consequence of the interaction between the anions (HAsO42− and PO43−) and metal centre (Y/Tb) of 1a. In the presence of MnO4−, CrO42− and Cr2O72− anions, there was no significant change in the FTIR spectra of 1a (Fig. 8).
Mechanism of luminescence quenching
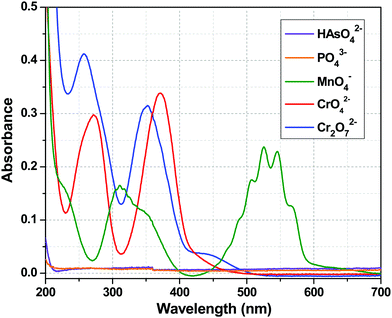
The luminescence intensity of the Tb3+ centre of 1a depended only on the efficiency of the energy flow from the ligand (tp) excited state to the excited state of the Tb3+ ion, i.e. the sensitization process. The Tb3+ centre is transparent to the UV light because of the spin forbidden nature of its electronic transitions. So, the quenching of the metal centre luminescence is indicative of the interruption of the sensitization process, which may result due to several factors. First, from the chemical stability experiments, it can be concluded that the quenching did not arise from the destruction of the framework. The second possibility is the absorption of excitation light by the added anions resulting in an inner filter effect. To understand that, let us concentrate on the UV-Visible absorption spectra of these anions (Fig. 9). At 280 nm (excitation wavelength), CrO42− and Cr2O72− had considerable absorbance, so one can argue about the inner filter effect of these two anions. The absorbance value for MnO4− ion was very much less at 280 nm. However, HAsO42− and PO43− anions did not possess any absorption band in the entire range of 200–700 nm, so the absorption of excitation light should not be the cause of the quenching in these two cases. Third, the HAsO42− and PO43− anions entered the channel of the MOF and interacted with Y3+/Tb3+ ions via covalent or coordinate type bonds, which weakened the Y/Tb–O bonds (Y/Tb-carboxylate). This implies that the bonding of the tp ligands with the Tb3+ ions became weak and the sensitization process was hampered. This was reflected in the lifetime decay results and in the alteration of the values of the radiative and non-radiative rate constants (Table 3). The increase in the emission intensity of the ligand centre peak was a consequence of the cut down of the sensitization process (Fig. 4). The interactions between the anions and the MOF are evident from the FTIR spectra (Fig. 8). So, in the case of HAsO42− and PO43− anions, there was a molecular-level attachment of anions with 1a, resulting in the alteration of the energy flow paths, which leads to a disruption of the sensitization process, resulting in a huge quenching of the metal centre luminescence. It is important to note that the SO42− anions did not show a similar behaviour though structurally they are related with the other two anions. This phenomenon can be explained based on Pauling's rules.68 Among the three anions (HAsO42−, PO43−, SO42−), the charge on the central element is highest for S (+6) in SO42−, while it is +5 for the other two anions (As and P). As a result, according to Pauling rule, SO42− has a lesser tendency to interact the metal ions (Y3+/Tb3+) than the HAsO42− or PO43− anions. For CrO42− and Cr2O72− anions, there was a possibility of the inner filter effect as there was a considerable absorption band at an excitation wavelength (280 nm), but for MnO4− ions, the absorption was much less compared to CrO42− and Cr2O72− anions. So, the possibility of an inner filter effect was a minor factor for the quenching of the metal centre emission in the case of MnO4− ions, but it was a major contributor in the case of CrO42− and Cr2O72− anions. Thus, it can be observed from the increase in ligand centre emission that MnO4− ions interrupted the ligand to metal energy transfer prominently, resulting in the quenching of the Tb centre emission (Fig. S11, ESI†). From Fig. S12 and S13 (ESI†), it can be seen that there was no notable change in the ligand centre emission for CrO42− and Cr2O72− anions, which indicated that interruption of ligand to metal energy transfer was also taking place to some extent in addition to the inner filter effect for these two anions. So, it may be stated that these analytes can significantly absorb the excitation light, ultimately reducing the energy flow from the ligand to the lanthanide ion, which leads to the luminescence quenching.69Conclusion
We have demonstrated a terbium-doped metal–organic framework, [Y0.8Tb0.2(tp)(ox)0.5(H2O)2]·H2O, 1a, as a chemosensor of five oxo-anions, namely HAsO42−, PO43−, MnO4−, CrO42− and Cr2O72−, in an aqueous medium. Here, 1a was synthesized hydrothermally and characterized by PXRD, TGA, FTIR, SEM, EDX and elemental mapping analysis. It was found to be both thermally and chemically stable. Its structure was confirmed through a single-crystal X-ray diffraction experiment of pure Y-based MOF (1). 1a exhibited bright green luminescence upon UV light irradiation as a result of the efficient sensitization process from the ligand (tp) to the terbium centre. The calculated detection limits of 1a for HAsO42−, PO43−, MnO4−, CrO42− and Cr2O72− ions were found to be 41.7, 33.5, 19.6, 40.8 and 43.9 nM, respectively, which are much better than most of the reported results and much lower than the permissible amount in water as recommended by the WHO. The selectivity of 1a towards these five anions was established in the presence of other interfering anions. The experimental results from electronic absorption spectroscopy, luminescence lifetime decay analysis and vibrational spectroscopy confirmed the luminescence quenching mechanism of 1a in the presence of HAsO42−, PO43−, MnO4−, CrO42− and Cr2O72− anions. The molecular-level interactions between the metal ions (Y3+/Tb3+) of the MOF and these anions (HAsO42− and PO43−) probably hampered the sensitization of the terbium centre through the weakening of the Tb–O bonds and consequently, the quenching of terbium centre emission occurred. The luminescence quenching of 1a in the presence of MnO4− arose due to the interruption of the ligand to metal energy transfer through the molecular-level interaction, with a slight contribution from the inner filter effect. The luminescence quenching of 1a for CrO42− and Cr2O72− ions mainly arose due to the inner filter effect and some contribution from the reduction of the energy flow from the ligand to the metal centre.Conflicts of interest
There are no conflicts of interest to declare.Acknowledgements
SKM thanks the DST-PURSE Program of Visva-Bharati (SR/PURSE Phase2/42(G) & Phase2/42(C)). P. Mahata thanks Jadavpur University for research support under RUSA2.0 and UGC, New Delhi for Start-up grant. S. Sarkar and P. Majee thanks CSIR, Government of India for the JRF and SRF fellowships.References
- N. Busschaert, C. Caltagirone, W. Van Rossom and P. A. Gale, Chem. Rev., 2015, 115, 8038–8155 CrossRef CAS.
- P. A. Gale, Acc. Chem. Res., 2006, 39, 465–475 CrossRef CAS.
- B. J. Abu Tarboush, A. Chouman, A. Jonderian, M. Ahmad, M. Hmadeh and M. Al-Ghoul, ACS Appl. Nano Mater., 2018, 1, 3283–3292 CrossRef CAS.
- J. Chen and B. P. Rosen, Biosensors, 2014, 4, 494–512 CrossRef.
- B. K. Mandal and K. T. Suzuki, Talanta, 2002, 58, 201–235 CrossRef CAS.
- V. C. Ezeh and T. C. Harrop, Inorg. Chem., 2012, 51, 1213–1215 CrossRef CAS.
- D. Kozul Courtney, H. Hampton Thomas, C. Davey Jennifer, A. Gosse Julie, P. Nomikos Athena, L. Eisenhauer Phillip, J. Weiss Daniel, E. Thorpe Jessica, A. Ihnat Michael and W. Hamilton Joshua, Environ. Health Perspect., 2009, 117, 1108–1115 CrossRef CAS.
- T. S. Y. Choong, T. G. Chuah, Y. Robiah, F. L. Gregory Koay and I. Azni, Desalination, 2007, 217, 139–166 CrossRef CAS.
- G. WHO, World Health Organization, 2011, 216, 303–304.
- R. L. P. Adams, J. T. Knowler and D. P. Leader, The Biochemistry of the Nucleic Acids, Springer, Netherlands, 2013 Search PubMed.
- M. S. Han and D. H. Kim, Angew. Chem., Int. Ed., 2002, 41, 3809–3811 CrossRef CAS.
- J. Yang, Y. Dai, X. Zhu, Z. Wang, Y. Li, Q. Zhuang, J. Shi and J. Gu, J. Mater. Chem. A, 2015, 3, 7445–7452 RSC.
- X. Song, Y. Ma, X. Ge, H. Zhou, G. Wang, H. Zhang, X. Tang and Y. Zhang, RSC Adv., 2017, 7, 8661–8669 RSC.
- K. Wang, M. Zhu, S. Ma, X. Li, M. Zhang and E. Gao, Polyhedron, 2019, 166, 60–64 CrossRef CAS.
- J.-X. Wu and B. Yan, J. Colloid Interface Sci., 2017, 504, 197–205 CrossRef CAS.
- B. Ding, S. X. Liu, Y. Cheng, C. Guo, X. X. Wu, J. H. Guo, Y. Y. Liu and Y. Li, Inorg. Chem., 2016, 55, 4391–4402 CrossRef CAS.
- B. Dhal, H. N. Thatoi, N. N. Das and B. D. Pandey, J. Hazard. Mater., 2013, 250–251, 272–291 CrossRef CAS.
- W. Liu, Y. Wang, Z. Bai, Y. Li, Y. Wang, L. Chen, L. Xu, J. Diwu, Z. Chai and S. Wang, ACS Appl. Mater. Interfaces, 2017, 9, 16448–16457 CrossRef CAS.
- R. Lv, J. Wang, Y. Zhang, H. Li, L. Yang, S. Liao, W. Gu and X. Liu, J. Mater. Chem. A, 2016, 4, 15494–15500 RSC.
- S. Chen, Z. Shi, L. Qin, H. Jia and H. Zheng, Cryst. Growth Des., 2017, 17, 67–72 CrossRef CAS.
- J. R. Lakowicz, Principles of Fluorescence Spectroscopy, Springer US, 2013 Search PubMed.
- Z. Hu, B. J. Deibert and J. Li, Chem. Soc. Rev., 2014, 43, 5815–5840 RSC.
- J. Massue, S. J. Quinn and T. Gunnlaugsson, J. Am. Chem. Soc., 2008, 130, 6900–6901 CrossRef CAS.
- J.-M. Bai, L. Zhang, R.-P. Liang and J.-D. Qiu, Chem. – Eur. J., 2013, 19, 3822–3826 CrossRef CAS.
- Z. Liu, G. Li, T. Xia and X. Su, Sens. Actuators, B, 2015, 220, 1205–1211 CrossRef CAS.
- H. Liu, J. Rong, G. Shen, Y. Song, W. Gu and X. Liu, Dalton Trans., 2019, 48, 4168–4175 RSC.
- B. Gole, W. Song, M. Lackinger and P. S. Mukherjee, Chem. – Eur. J., 2014, 20, 13662–13680 CrossRef CAS.
- Y. Cui, Y. Yue, G. Qian and B. Chen, Chem. Rev., 2012, 112, 1126–1162 CrossRef CAS.
- W. P. Lustig, S. Mukherjee, N. D. Rudd, A. V. Desai, J. Li and S. K. Ghosh, Chem. Soc. Rev., 2017, 46, 3242–3285 RSC.
- Y. He, W. Zhou, R. Krishna and B. Chen, Chem. Commun., 2012, 48, 11813–11831 RSC.
- J. Liu, L. Chen, H. Cui, J. Zhang, L. Zhang and C.-Y. Su, Chem. Soc. Rev., 2014, 43, 6011–6061 RSC.
- H. Wang, W. P. Lustig and J. Li, Chem. Soc. Rev., 2018, 47, 4729–4756 RSC.
- Z.-J. Lin, J. Lü, M. Hong and R. Cao, Chem. Soc. Rev., 2014, 43, 5867–5895 RSC.
- B. Li, M. Chrzanowski, Y. Zhang and S. Ma, Coord. Chem. Rev., 2016, 307, 106–129 CrossRef CAS.
- Z. Yin, Y.-L. Zhou, M.-H. Zeng and M. Kurmoo, Dalton Trans., 2015, 44, 5258–5275 RSC.
- J. Cheng, X. Zhou and H. Xiang, Analyst, 2015, 140, 7082–7115 RSC.
- Y. Cui, B. Chen and G. Qian, Coord. Chem. Rev., 2014, 273, 76–86 CrossRef.
- C. Chen, X. Zhang, P. Gao and M. Hu, J. Solid State Chem., 2018, 258, 86–92 CrossRef CAS.
- Y. Cheng, H. Zhang, B. Yang, J. Wu, Y. Wang, B. Ding, J. Huo and Y. Li, Dalton Trans., 2018, 47, 12273–12283 RSC.
- J. D. Einkauf, J. M. Clark, A. Paulive, G. P. Tanner and D. T. de Lill, Inorg. Chem., 2017, 56, 5544–5552 CrossRef CAS.
- C.-L. Choi, Y.-F. Yen, H. H. Y. Sung, A. W. H. Siu, S. T. Jayarathne, K. S. Wong and I. D. Williams, J. Mater. Chem., 2011, 21, 8547–8549 RSC.
- D. K. Singha, S. Bhattacharya, P. Majee, S. K. Mondal, M. Kumar and P. Mahata, J. Mater. Chem. A, 2014, 2, 20908–20915 RSC.
- J.-W. Ye, J.-M. Lin, Z.-W. Mo, C.-T. He, H.-L. Zhou, J.-P. Zhang and X.-M. Chen, Inorg. Chem., 2017, 56, 4238–4243 CrossRef CAS.
- D. T. de Lill, A. de Bettencourt-Dias and C. L. Cahill, Inorg. Chem., 2007, 46, 3960–3965 CrossRef CAS.
- B. Yan, Acc. Chem. Res., 2017, 50, 2789–2798 CrossRef CAS.
- Y.-T. Yan, F. Cao, W.-Y. Zhang, S.-S. Zhang, F. Zhang and Y.-Y. Wang, New J. Chem., 2018, 42, 9865–9875 RSC.
- F. Liu, W. Gao, P. Li, X.-M. Zhang and J.-P. Liu, J. Solid State Chem., 2017, 253, 202–210 CrossRef CAS.
- J.-Y. Zou, L. Li, S.-Y. You, Y.-W. Liu, H.-M. Cui, J.-Z. Cui and S.-W. Zhang, Dalton Trans., 2018, 47, 15694–15702 RSC.
- N. Abdollahi and A. Morsali, Anal. Chim. Acta, 2019, 1064, 119–125 CrossRef CAS.
- J.-L. Shi, P. Xu, X.-G. Wang, B. Ding, X.-J. Zhao and E.-C. Yang, Z. Anorg. Allg. Chem., 2018, 644, 1598–1606 CrossRef CAS.
- R. Minmini, S. Naha and S. Velmathi, Sens. Actuators, B, 2017, 251, 644–649 CrossRef CAS.
- D. Xie, Y. Ma, Y. Gu, H. Zhou, H. Zhang, G. Wang, Y. Zhang and H. Zhao, J. Mater. Chem. A, 2017, 5, 23794–23804 RSC.
- J. Zhang, J. Wu, L. Gong, J. Feng and C. Zhang, ChemistrySelect, 2017, 2, 7465–7473 CrossRef CAS.
- SMART (V 5.628), SAINT (V 6.45a), XPREP, SHELXTL, Bruker AXS Inc, Madison, USA, 2004.
- G. M. Sheldrick, Siemens Area Correction Absorption Correction Program, University of Göttingen, Göttingen, Germany, 1994 Search PubMed.
- G. M. Sheldrick, SHELXL-97 Program for Crystal Structure Solution and Refinement, 1997 Search PubMed.
- L. Farrugia, J. Appl. Crystallogr., 1999, 32, 837–838 CrossRef CAS.
- A. M. Brouwer, Pure Appl. Chem., 2011, 83, 2213 CAS.
- B. B. Craig, J. Kirk and M. A. J. Rodgers, Chem. Phys. Lett., 1977, 49, 437–440 CrossRef CAS.
- W. H. Organization, Guidelines for Drinking-water Quality, World Health Organization, 1993.
- P. Chandra Rao and S. Mandal, Inorg. Chem., 2018, 57, 11855–11858 CrossRef CAS.
- H. Xu, Y. Xiao, X. Rao, Z. Dou, W. Li, Y. Cui, Z. Wang and G. Qian, J. Alloys Compd., 2011, 509, 2552–2554 CrossRef CAS.
- E. Gao, N. Sun, Y. Zhan, X. Qiu, Y. Ding, S. Zhang and M. Zhu, RSC Adv., 2016, 6, 85704–85709 RSC.
- H. Xu, C.-S. Cao and B. Zhao, Chem. Commun., 2015, 51, 10280–10283 RSC.
- C. Wang, X. Liu, J. P. Chen and K. Li, Sci. Rep., 2015, 5, 16613 CrossRef CAS.
- M. Pena, X. Meng, G. P. Korfiatis and C. Jing, Environ. Sci. Technol., 2006, 40, 1257–1262 CrossRef CAS.
- S. Hou, Y.-n. Wu, L. Feng, W. Chen, Y. Wang, C. Morlay and F. Li, Dalton Trans., 2018, 47, 2222–2231 RSC.
- L. Pauling, C. University and C. U. Press, The Nature of the Chemical Bond and the Structure of Molecules and Crystals: An Introduction to Modern Structural Chemistry, Cornell University Press, 1960 Search PubMed.
- C. Zhang, L. Sun, Y. Yan, H. Shi, B. Wang, Z. Liang and J. Li, J. Mater. Chem. C, 2017, 5, 8999–9004 RSC.
Footnote |
| † Electronic supplementary information (ESI) available. CCDC 2035451. For ESI and crystallographic data in CIF or other electronic format see DOI: 10.1039/d0ma00811g |
| This journal is © The Royal Society of Chemistry 2021 |

