
 Open Access Article
 This Open Access Article is licensed under a Creative Commons Attribution-Non Commercial 3.0 Unported Licence
Multiple electrochemically accessible colour states in surface-confined metal–organic monolayers: stepwise embedding of individual metal centres†
Nadia O.
Laschuk
,
Rana
Ahmad
,
Iraklii I.
Ebralidze
 ,
Jade
Poisson
,
Franco
Gaspari
,
E. Bradley
Easton
and
Olena V.
Zenkina
*
,
Jade
Poisson
,
Franco
Gaspari
,
E. Bradley
Easton
and
Olena V.
Zenkina
*
Faculty of Science, Ontario Tech University, 2000 Simcoe Street North, Oshawa, ON L1H 7K4, Canada. E-mail: olena.zenkina@ontariotechu.ca; Web: https://faculty.ontariotechu.ca/zenkina/
First published on 21st December 2020
Abstract
Sequential covalent embedding of cobalt, osmium, and iron complexes of 4′-(pyridin-4-yl)-2,2′:6′,2′′-terpyridine to surface-enhanced supports pre-functionalized with a templating layer results in hetero-bimetallic (Os–Fe and Co–Fe) and hetero-trimetallic (Co–Os–Fe) monolayer materials. During sequential embedding, each subsequent metal complex deposits onto unoccupied sites of the templating layer leading to densely packed functional materials. Electrochemical and XPS results show that the packing density of Fe(II) species on the surface of the resulting materials is higher than those of pre-deposited Co(II) and Os(II) isostructural complexes. Moreover, according to Raman spectroscopy results, Fe-containing molecules experience steric hindrance when anchored to sequentially deposited Os– or Co–Os materials. The oxidation states of the metal centres in these materials can be successively electrochemically changed resulting in distinct colour-to-colour transitions. Importantly, monolayer materials formed on the conductive surface-enhanced indium-tin-oxide support can operate as entire working electrodes, which, in combination with a polymer gel electrolyte and an indium tin oxide/glass counter electrode, result in two-electrode electrochromic devices (ECDs). Upon operation these devices demonstrate some deterioration of the change in optical density (ΔOD), however, this deterioration is mostly due to gel electrolyte decomposition. The nature of the material allows easy replacement of the electrolyte and the counter electrode. Re-assembly of Co–Fe ECD using a new gel electrolyte and an ITO-glass counter electrode results in almost complete ΔOD recuperation.
Introduction
Electrochromic (EC) materials that are able to change colour and transparency upon the application of external voltage1 are used in displays, signage, smart-boards, and energy-saving smart windows.2 There is a very high demand for novel stable and responsive electrochromic materials (ECMs) that are able to switch between multiple coloured states to support the functionality of multicolour electronic devices. In addition, there is evidence of light and colour influence on the emotional state, heart rates and overall human behaviour,3 therefore, aesthetic benefits of colour tunability should also be taken into consideration upon the design of ECMs for smart building coatings, EC windows, etc. While ECMs of many different colours could be accessed using various manufacturing technologies and a wide range of individual components, not many reported EC systems have demonstrated multichromic properties, i.e., the ability to support multiple colour-to-colour transitions within the same film. The vast majority of non-plasmonic ECMs invented to date are limited to one transition between the coloured and transparent or bleached state.4–6 Multichromic properties are relatively rare for all classes of ECMs ranging from conductive polymers,7 organic molecules,8–10 transition metal complexes,11–14 and composite materials.15 Metal–organic complexes that form supramolecular structures or framework-supramolecular metallopolymers are a very promising class of ECMs that often show higher stability than organic analogues and better performance than pure metal–oxide EC surfaces.16–18 The incorporation of two or more different redox-active metal ions in the metallopolymer allows multiple coloured transitions due to a combination of the metal-to-ligand charge transfer (MLCT) and intervalence charge transfer (IVCT) transitions. Multiple factors such as the distance between metal centres, coordination environment and interconnectivity, as well as thicknesses of the metal coordination wire and coordination network define electrochemical addressability within the system, rates of the electron transfer, and colour transitions. Huguchi et al. reported the synthesis of a series of Fe–Ru and Fe–Os based bimetallo-supramolecular EC polymers by the stepwise coordination of corresponding metal ions to bis(terpyridyl)benzene followed by a spin- or spray-coating of the polymer onto ITO/glass surfaces.13,19 Resulting materials demonstrate two distinct colour-to-colour EC transitions based on different redox potentials of the metal ions. Covalent attachment of EC molecules to conductive electrodes by using suitable phosphonic,20 silane21 linkers or by diazonium coupling6 normally improves the overall stability of the resulting electrochromic devices (ECDs). Layer-by-layer deposition of multiple metal–organic units on a flat conductive support is a very beneficial strategy to prepare effective ECMs. Although thicker EC layers are expected to cause a more prominent change in the optical density, there are thickness limitations associated with through-layer charge transfer. The synergistic combination of a durable transparent conductive metal oxide (TCO) support that has an enhanced surface-to-volume ratio with EC counterparts allows faster ion/electron-transfer within the EC layer and provides additional stability to the system.22,23 In certain cases, thicker metal–organic layers can demonstrate interesting charge trapping properties and need an alternative stimulus such as external light or extra voltage for charge release. For example, Lahav and van der Boom have demonstrated2 that separating a transparent metal oxide electrode and a layer of iron12 or cobalt24 polypyridyl-based EC polymer using a layer of isostructural ruthenium-based metal–organic complex leads to a situation where the Ru(II) complex blocks charge transfer and traps positive charge stored in the Fe(III) or Co(III) layer. The consecutive charging and discharging of these ECMs are accompanied by several colour-to-colour transitions.We have introduced the concept of monolayer ECMs by covalently embedding a single molecular layer of EC transition metal complex onto a TCO with an enhanced surface area.25 This technology utilizes conventional chemistry26,27 and offers materials with ultra-high cycling durability28 and excellent colouration efficiency.29 The design of ECMs based on covalent anchoring of metal–organic complexes to a surface-enhanced conductive support (SES) pre-functionalized with a templating layer (Scheme 1) has numerous advantages. The monolayer nature of the EC component makes these materials atom efficient, benefitting from fast electron transfer, and excellent colouration efficiency. Fine-tuning the sterics and electronics of the ligand28 leads to materials of different colours that can be switched between coloured and bleached states by applying a small voltage. The covalent attachment of EC molecules to the support provides exceptional stability and allows thousands of cycles to be performed with little-to-no deterioration of change in optical density (ΔOD).28
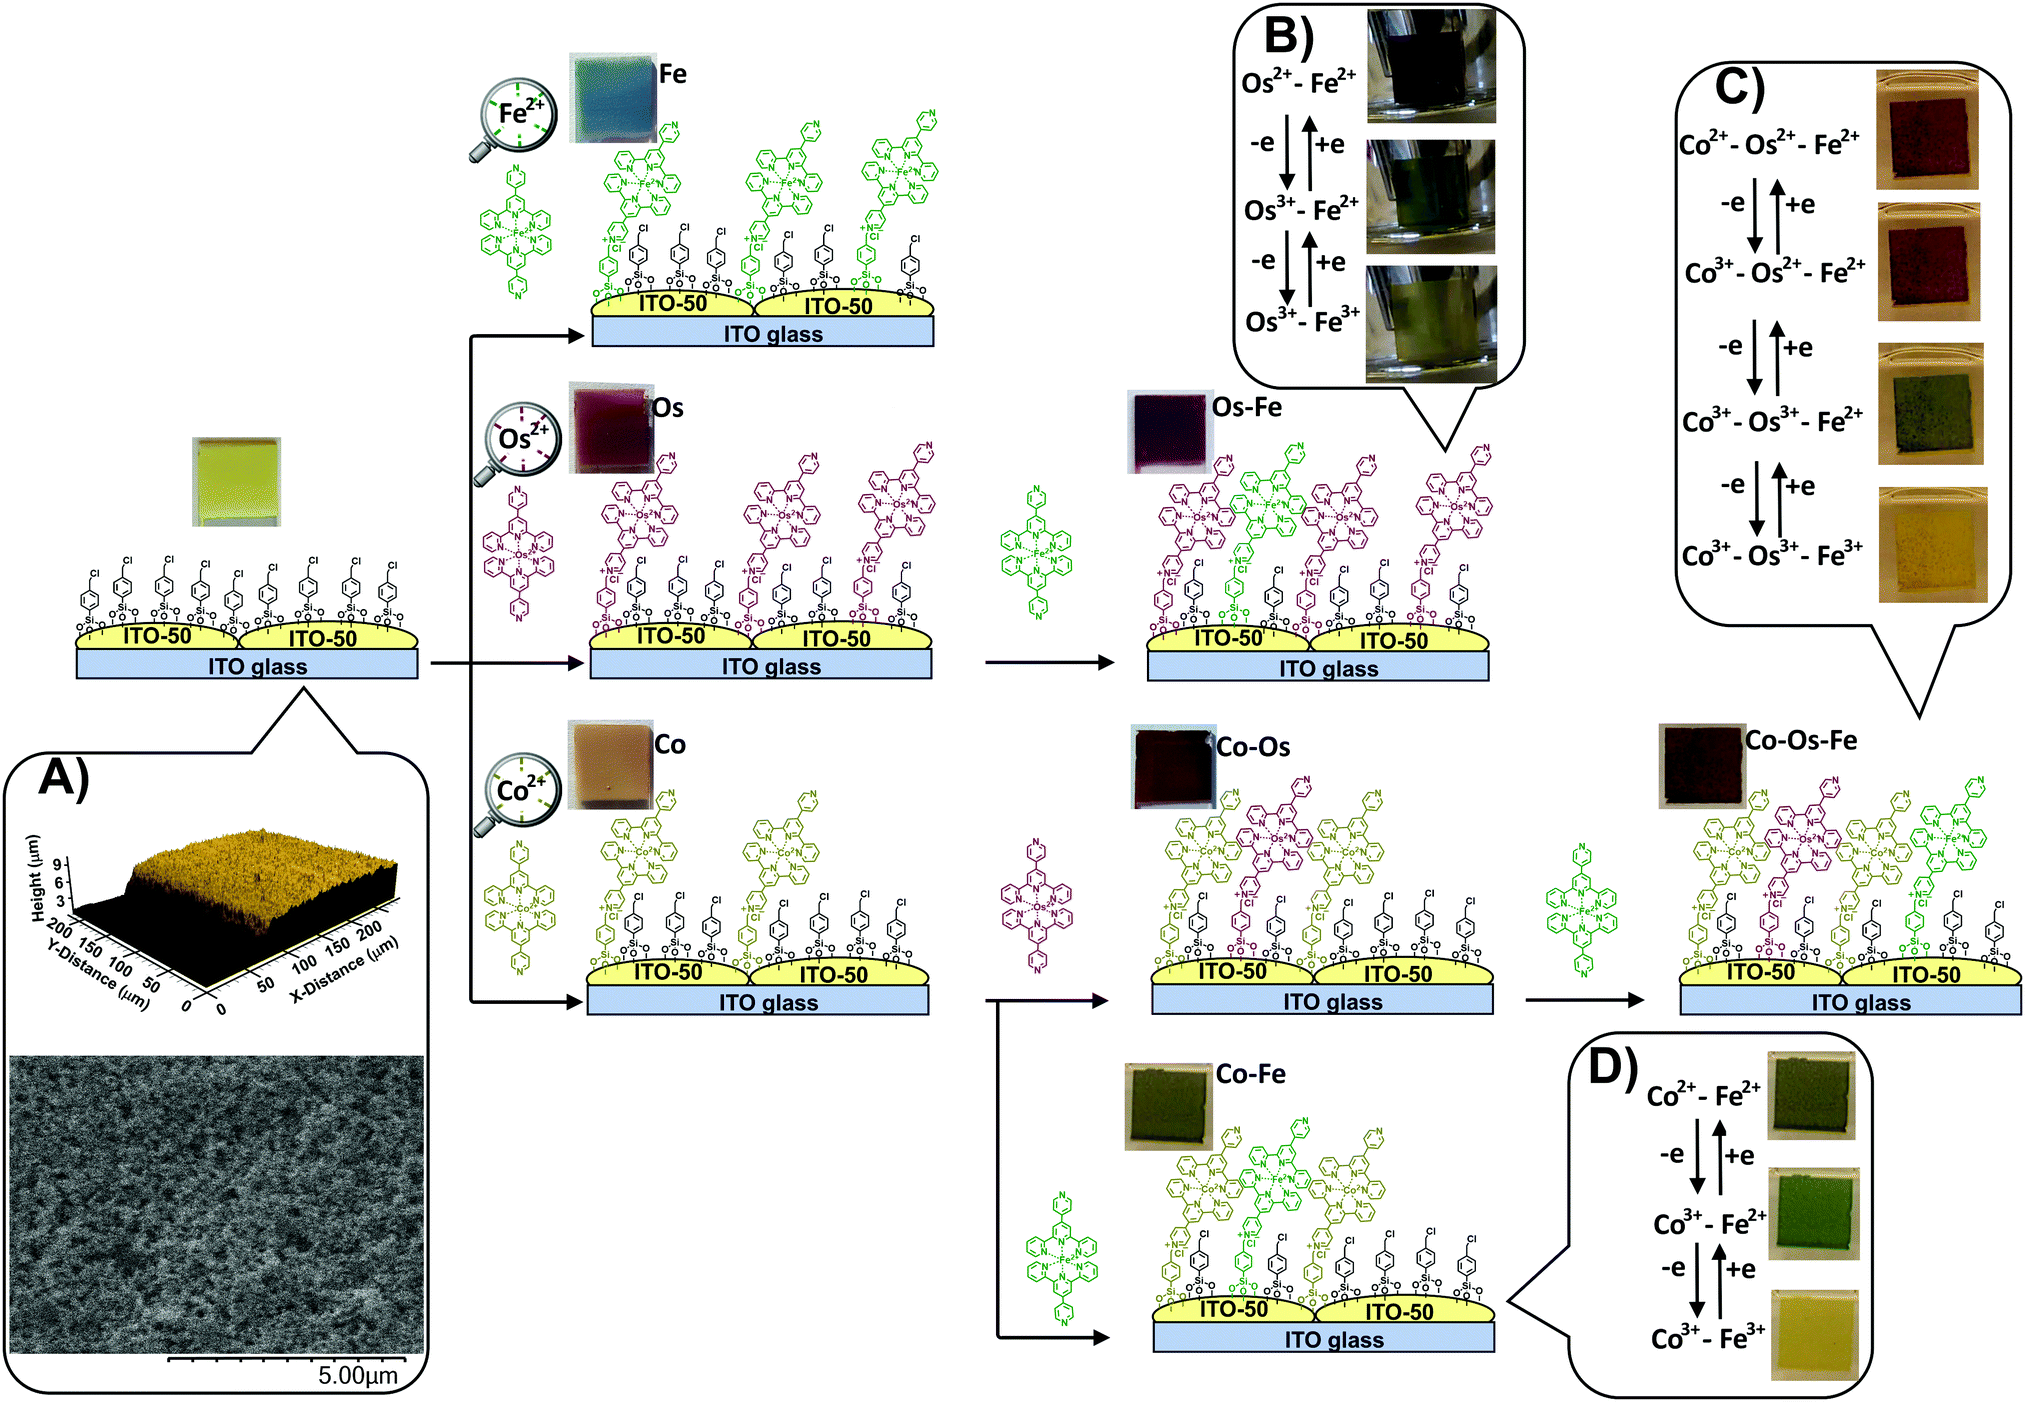 | ||
| Scheme 1 Stepwise deposition of Co, Os, and Fe complexes of 4′-(pyridin-4-yl)-2,2′:6′,2′′-terpyridine on the surface-enhanced support bearing 4-(chloromethyl)phenyl siloxane results in materials with a wide variety of colours. Inset (A) shows a typical optical profile (up) and typical SEM image (below) of the support. Insets (B–D) show the colour changes upon electrochemical addressing the oxidation state of the metal centres in covalently-anchored monolayer molecules. | ||
Along with the metal–organic complexes, a surface-enhanced support is essential for this type of ECMs. It is made by screen printing conductive indium tin oxide (ITO-50) nanoparticles on a highly conductive (RS = 4–10 Ω) ITO/glass substrate (Scheme 1, inset A) providing a Brunauer–Emmett–Teller (BET) specific surface area of 30 m2 g−1 of SES.25
The simultaneous deposition of several metal complexes leads to ECMs where metal centres can be separately electrochemically addressed, resulting in several distinct colour-to-colour changes.30 The sequential deposition of individual metal complexes is expected to result in the formation of a densely packed monolayer, which, in turn, will lead to more efficient materials with a large number of achievable colour shades.
Here we report a controlled procedure for sequential deposition of cobalt(II), osmium(II), and iron(II) complexes of 4′-(pyridin-4-yl)-2,2′:6′,2′′-terpyridine from the corresponding solutions onto ITO SES pre-functionalized with a 4-(chloromethyl)phenyl siloxane templating layer.
Results and discussion
Traditionally, red, yellow, and blue are considered three primary colours from which all other colours can be derived. When individually deposited on a light-yellow SES, the iron(II) complex leads to blue, osmium(II) complex results in wine red, and cobalt(II) complex results in pale brown colour (see details in Table 1). During the sequential deposition, each subsequent coloured complex is expected to deposit onto unoccupied sites of the templating layer via conventional alkylation of the 4-pyridyl moiety of the complex with a halocarbon (chloromethyl) group of the templating layer forming quaternary ammonium salts (Scheme 1). Different combinations of these complexes on the surface will lead to a variety of colours.| Material | L* | a* | b* | Colour/hue | CDa |
|---|---|---|---|---|---|
| a CD was determined as the difference in colour coordinates caused by the oxidation of the corresponding metal centre: CD = ((ΔL*)2 + (Δa*)2 + (Δb*)2)1/2. | |||||
| Support | 67 | −1 | 48 | Brass/yellow | — |
| Fe2+ | 45 | −5 | −11 | Bismarck/blue | — |
| Os2+ | 30 | 18 | 3 | Tawny port/red | — |
| Co2+ | 54 | 11 | 24 | Pale brown/brown | — |
| Os2+–Fe2+ | 27 | 22 | 4 | Tawny port/red | — |
| Os3+–Fe2+ | 38 | −5 | 14 | Woodland/green | 18.2 |
| Os3+–Fe3+ | 49 | −1 | 28 | Yellow metal/yellow | 41.0 |
| Co2+–Os2+ | 25 | 21 | 3 | Wine berry/red | — |
| Co2+–Fe2+ | 39 | −2 | 17 | Verdigris/grey | — |
| Co3+–Fe2+ | 41 | −10 | 19 | Woodland/green | 8.5 |
| Co3+–Fe3+ | 59 | 1 | 44 | Luxor gold/yellow | 32.7 |
| Co2+–Os2+–Fe2+ | 25 | 15 | 25 | Baker's chocolate/brown | — |
| Co3+–Os2+–Fe2+ | 32 | 14 | 26 | Dark brown/brown | 7.1 |
| Co3+–Os3+–Fe2+ | 40 | −2 | 34 | Olivetone/green | 19.6 |
| Co3+–Os3+–Fe3+ | 56 | 7 | 45 | Reef gold/yellow | 21.4 |
The change in the oxidation state of certain metal centres upon adjusting the applied potential is visible to the naked eye (Scheme 1, insets B–D) and can be tracked from the UV-vis spectra (Fig. 1A–C). Indeed, the sequential deposition of Os(II) and Fe(II) complexes results in the Os–Fe material of tawny port colour, which is very close to a wine berry colour that is achieved by stepwise deposition of Co(II) and Os(II) complexes (Co–Os ECM). Stepwise deposition of Co(II) and Fe(II) complexes leads to light grey colour complexes. Electrochemical oxidation of Co(II) to Co(III) in the Co–Os material results in an insignificant colour difference (CD), which is perceptible only through close observation. As a result, the Co–Os system cannot be considered as truly multichromic and will not be discussed here.
 | ||
| Fig. 1 The change in absorbance of ECMs assembled into a solid-state device upon application of different potentials: (A) Os–Fe, (B) Co–Fe, and (C) Co–Os–Fe. Raman spectra (D) of sequentially deposited Os–Fe, Co–Fe, and Co–Os–Fe ECMs (top) and Fe ECM (bottom). Representative XPS spectra showing the presence of (E) Co, (F) Fe, and (G) Os on the surface of Co–Os–Fe ECM. | ||
In contrast, the Os–Fe system demonstrates two distinct colour changes (Scheme 1, inset B) from tawny port to woodland green upon oxidation of Os(II) to Os(III) followed by woodland to yellow metal colour transition upon oxidation of Fe(II) to Fe(III). The oxidation state and therefore the colour of the metal centres in ECM fabricated by the sequential deposition of Co(II), Os(II), and Fe(II) complexes (Co–Os–Fe) can be individually addressed too (Fig. 1C and Scheme 1, inset C). Interestingly, the transition from 2+ to 3+ oxidation state accompanied by the disappearance of colour in ECMs containing one-type metal moieties takes place upon application of +1.3 V for Co, +2.1 V for Os, and +2.4 V for Fe, respectively. The shift or redox potentials towards each other in hetero-bimetallic and hetero-trimetallic ECDs observed here is consistent with the results of Higuchi and Kurth observed on hetero-bimetallic (Fe–Ru) metalorganic polymers31 and are associated with metal–metal interactions.32
While similar to Co–Os ECM, the Co(II) to Co(III) transition in the Co–Os–Fe material results in slight lightening (see numerical values in CIE in L*a*b* coordinates in Table 1), the change in the oxidation state of Fe and Os complexes leads to two distinct colour changes. In more detail, oxidation of osmium in Co–Os–Fe ECM results in slight lightening (higher L* values) and significant increase of green (negative a*) and yellow (positive b*) components leading to rain forest green colour. Subsequent oxidation of iron centres results in further lightening, the increase of the red (positive a*) and yellow components leading to the reef gold yellow colour. Finally, the Co–Fe ECM also demonstrates two colour-to-colour changes (Scheme 1, inset D). The oxidation of cobalt centres leads to light grey to woodland green colour transition, while subsequent oxidation of iron centres results in the conversion of woodland green to luxor gold yellow.
The ability to perform particular colour-to-colour transitions is determined by the quantity and composition of the metal centres on the surface. Raman spectra of ECMs were measured using 532 nm as the excitation wavelength, which can lead to enhanced transitions related to the chromophore33 (Fig. 1D). All materials demonstrate peaks at 1023, 1292, 1365, 1474, 1538, and 1614 cm−1, characteristic of pyridine ring stretches of metal complexes.34 Interestingly, Co–Fe ECM demonstrates higher intensity absorption in the 2230 to 3300 cm−1 region than that of Os-containing ECMs (Fig. 1D, top). Similar higher intensity absorption associated with symmetric C–H stretching is observed for Fe ECM (Fig. 1D, bottom). The intensity of a particular C–H bond symmetric stretching depends on the angle at which the bond is located in relation to the surface. Maximum intensity will be expected for the stretching of C–H bond normal (90°) to the surface, while the intensity will fall with the decrease in the angle.35 Raman results allow us to suggest that Fe-containing molecules have a similar on-surface orientation when deposited on the templating layer of bare or Co-pre-functionalized SES. In contrast, when sequentially deposited on Os– or Co–Os ECMs, Fe-containing molecules experience steric hindrance and change the native angle to the surface.
To get a better idea about the surface coverage and metal ion stoichiometry, a combination of cyclic voltammetry (CV) and X-ray photoelectron spectroscopy (XPS) was used. The peak current plotted vs. cycling rates of developed ECMs (Fig. S1–S3, ESI†) are highly linear (R2 ≥ 0.952), which is consistent with the monolayer nature of the materials and thus can be used for the determination of the surface coverage Γm:
 | (1) |
The insignificant difference in the peak potential of iron and osmium at Co–Os–Fe ECM allows the determination of their total but not individual content. From CV measurements of Co–Os–Fe ECM, the overall Fe and Os surface coverage is 28 molecules nm−2 of the device, while the surface coverage of Co is 8 molecules nm−2 of the device. The analysis of Co 2p, Fe 2p and Os 4f XPS peaks (Fig. 1E–G) after applying Wagner sensitivity factors36 allows the determination of Co![[thin space (1/6-em)]](https://www.rsc.org/images/entities/char_2009.gif) :Os:Fe stoichiometry as 1.0:1.6:4.5, which corresponds to 5 cobalt, 8 osmium, and 22 iron-containing molecules deposited at one nm2 of the device. Applying a similar algorithm to Os–Fe ECM results in 7 osmium and 16 iron-bearing molecules at one nm2 of the device. Finally, Co–Fe ECM contains 4 cobalt and 16 iron complexes at one nm2 of the device. The lower packing density of the d7 Co(II) bis-terpyridine-based complex can result from the 19 electron nature of the complex, while formally isostructural d6 Os and Fe complexes, existing in a stable 18 electron configuration, have in fact different electronics. The difference in electronic configuration results in different steric effects of the metal complex, which proceeds through changes in the geometry around the metal centre. In more detail, to reduce the energy, the Co(II) complex is expected to lower the symmetry demonstrating a Jahn–Teller geometrical distortion, as recently shown for similar Co(II) complexes.37 Finally, the templating layer itself was shown to have different binding affinities to formally similar molecular units.38 The results show that the stepwise deposition of cobalt, osmium, and iron complexes on the SES leads to a coating with a high content of iron species on the surface that is not achievable by simultaneous deposition.30 This, in turn, allows reaching a variety of green shades.
:Os:Fe stoichiometry as 1.0:1.6:4.5, which corresponds to 5 cobalt, 8 osmium, and 22 iron-containing molecules deposited at one nm2 of the device. Applying a similar algorithm to Os–Fe ECM results in 7 osmium and 16 iron-bearing molecules at one nm2 of the device. Finally, Co–Fe ECM contains 4 cobalt and 16 iron complexes at one nm2 of the device. The lower packing density of the d7 Co(II) bis-terpyridine-based complex can result from the 19 electron nature of the complex, while formally isostructural d6 Os and Fe complexes, existing in a stable 18 electron configuration, have in fact different electronics. The difference in electronic configuration results in different steric effects of the metal complex, which proceeds through changes in the geometry around the metal centre. In more detail, to reduce the energy, the Co(II) complex is expected to lower the symmetry demonstrating a Jahn–Teller geometrical distortion, as recently shown for similar Co(II) complexes.37 Finally, the templating layer itself was shown to have different binding affinities to formally similar molecular units.38 The results show that the stepwise deposition of cobalt, osmium, and iron complexes on the SES leads to a coating with a high content of iron species on the surface that is not achievable by simultaneous deposition.30 This, in turn, allows reaching a variety of green shades.
The analysis of photoemission signals allows the determination of the chemical state of elements on the surface. Thus, as prepared Co–Os–Fe ECM exhibits a Co 2p3/2 peak located at 781.1 eV similar to that reported for the related Co(II) complex;18,39,40 the Fe 2p3/2 peak is centred at 708.5 eV, typical for Fe(II),13,14 and Os 4f7/2 peak is observed at 51.9 eV, characteristic of Os(II).13,14 The N 1s spectra of ECMs (Fig. S4, ESI†) contain two states: with a binding energy (BE) of 400 eV corresponding to aromatic nitrogen atoms (N) bound to metal ions, and with BE = 402 eV characteristic of the quaternized (N+) nitrogen atoms. A shift towards higher BE values in comparison to non-complexed nitrogen atoms27 is consistent with the decrease of the electron density on the nitrogen atoms caused by binding to metal ions. The N:N+ ratio for Os–Fe, Co–Fe, and Co–Os–Fe are 6.6:1.0, 6.7:1.0, and 6.9:1.1, respectively, which is close to the expected 7:1 stoichiometry. Interestingly, the full width at half maximum (FWHM) of the N state of Co–Fe ECM equal to 1.9 eV is smaller than that of Os–Fe and Co–Os–Fe ECMs, which are 2.2 and 2.3 eV, respectively. The peak broadening is in good agreement with the presence of several nitrogen-bonded species on the surface. Moreover, the broadening of the N peak component in Os-containing materials is expected due to a more electron rich Os centre.
The electron transfer rate constants (kET) of materials were determined by the Laviron method in a 3-electrode cell. The cell was filled with an anhydrous deoxygenated electrolyte (0.1 M TBAHFP in CH3CN), included an ECM as a working electrode, a Pt counter electrode and a Ag/AgNO3 reference electrode. Although kET for the Co species of each material can be unambiguously determined, the convergence of Os and Fe peaks at fast CV scan rates allows the determination of the joint electron transfer rate for Os and Fe species. The electron transfer rate constants summarized in Table S1 (see ESI†) are in the range of 3.1 to 5.0 s−1, which are comparable to those reported for vinylferrocene covalently bound to ITO.41
Electrochemical impedance spectroscopy (EIS) was applied to evaluate the change in the internal resistance of ECMs with different metal–metal combinations. To do so, the impedance was measured at the applied bias of each metal center's half-wave potential (represented as E1/2(M)). While there was an overlap of the Os2+/3+ and Fe2+/3+ redox potential on the Co–Os–Fe ECM, there was a minor peak separation observed for the Fe–Os, allowing for separate analysis. The EIS data is presented as a Nyquist plot (Z′′ vs. Z′ where Z′′ is the imaginary impedance and Z′ is the real impedance) (Fig. 2A–C), which allowed further characterization through a plot of Z′ vs. ω−1/2 (where ω is the angular frequency), referred to as the Randles plot (Fig. 2D–F). At lower frequencies, the approximately linear region obtains a slope according to the equation Z′ = σω−1/2 in which σ is the Warburg coefficient that was used to evaluate the ion mobility within the material. From this parameter, the diffusion coefficient (D) is calculated using eqn (2):
 | (2) |
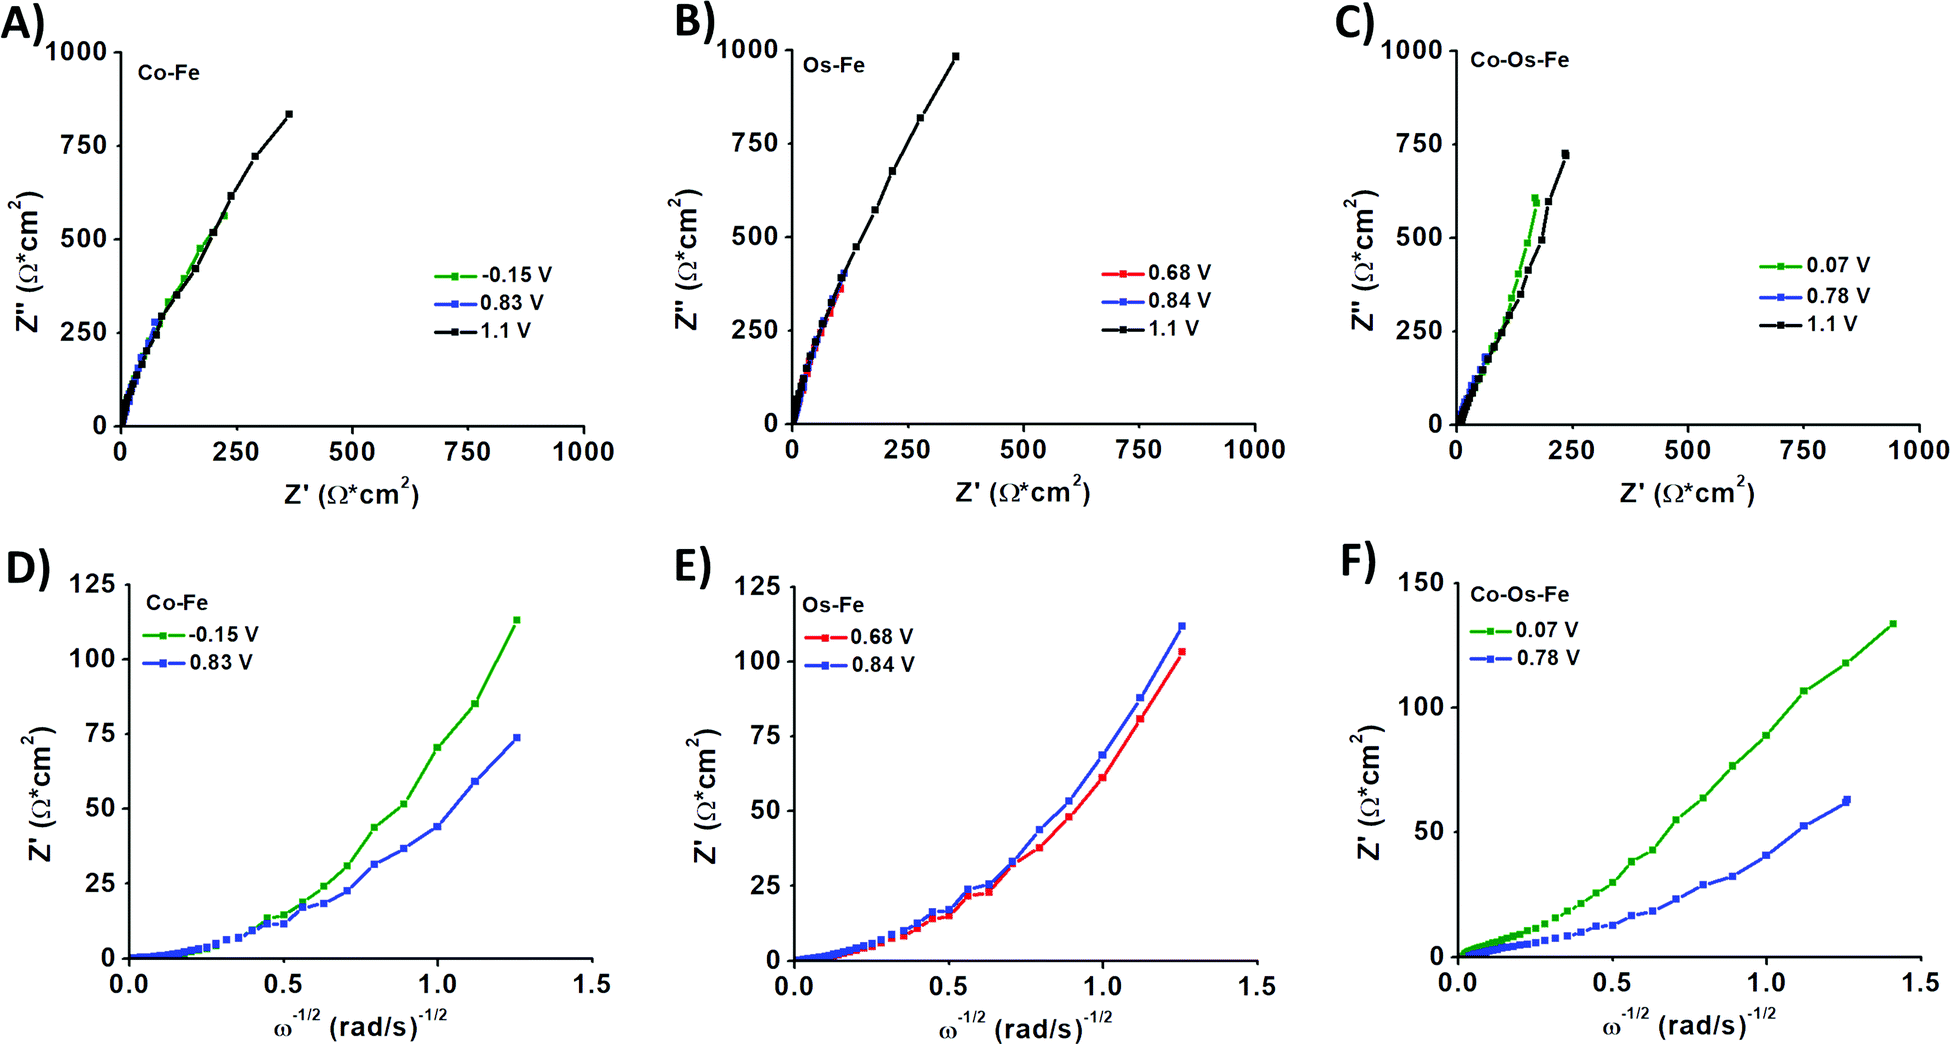 | ||
| Fig. 2 The Nyquist plots for sequentially deposited (A) Co–Fe, (B) Os–Fe, and (C) Co–Os–Fe ECMs. The Randles plots for (D) Co–Fe, (E) Os–Fe, and (F) Co–Os–Fe ECMs. The measurements were performed in a 3-electrode cell. | ||
A larger magnitude of D represents faster ion mobility.42,43 Fastest ion mobility was observed for the Co–Os–Fe ECM, 4.4 × 10⁻⁹ cm2 s−1 at the Fe–Os half-wave potential and 2.0 × 10⁻⁹ cm2 s−1 at the Co half-wave potential. Slower ion mobility is observed for Co–Fe ECM, 2.7 × 10⁻⁹ cm2 s−1 for Fe and 1.1 × 10⁻⁹ cm2 s−1 for Co. The slowest ion mobility was observed for Os–Fe, which was calculated separately due to reasonable peak separation in the CV, 1.1 × 10⁻⁹ cm2 s−1 for Fe and 1.4 × 10⁻⁹ cm2 s−1 for Os. Therefore, improved ionic mobility is observed upon Co–Os–Fe metal mixing. Moreover, the internal resistance (RΣ) represents the sum of the ionic (Rion) and electronic (Relec) resistance in the porous layer.44 Projecting the Warburg length to the Z′ axis allows one to obtain the magnitude of RΣ/3, which can be isolated to solve for RΣ (Fig. 2D–F). Relec is assumed to be much smaller than Rion, and thus RΣ equals the magnitude of Rion.45 Materials with larger magnitudes of Rion will experience slower ionic mobility, and vice versa. There is a decline in Rion when the three complexes are mixed together on the Co–Fe–Os ECM, which would allow better ion mobility, as observed for the diffusion coefficient.
The sheet resistances (RS) were measured to be 149 Ω sq−1 for Fe–Co, 164 Ω sq−1 for Fe–Os, and 156 Ω sq−1 for Co–Os–Fe ECMs, respectively. While similar in magnitude, there is a slight trend with Fe–Co having the lowest RS, followed by Co–Os–Fe, and finally Fe–Os with the highest RS, which aligns to the trend of the average RΣ values (Table S2, ESI†).
ECDs were built as a 2-electrode cell where an ECM working electrode and ITO/glass counter electrode were separated by a polymer gel electrolyte. Colouration (tc) and bleaching (tb) times of ECDs are summarized in Table 2. The colouration and bleaching at a wavelength of λmax = 600 nm that corresponds to the redox of iron species do not exceed 3.1 s. In contrast, transitions of the osmium species at 515 and 700 nm take longer (Table 2).
| Material | λ max | t c (s) | t b (s) | CE (cm2 C−1) |
|---|---|---|---|---|
| a λ max is the wavelength of the absorbance peak maxima. | ||||
| Os–Fe | λ 515 | 8.6 | 9.0 | 1102 |
| λ 600 | 1.0 | 3.1 | 901 | |
| λ 700 | 8.8 | 10.0 | 657 | |
| Co–Fe | λ 515 | 1.2 | 7.8 | 73 |
| λ 600 | 0.6 | 1.6 | 921 | |
| Co–Os–Fe | λ 515 | 1.0 | 2.0 | 387 |
| λ 600 | 0.9 | 1.3 | 1315 | |
| λ 700 | 1.4 | 1.5 | 601 | |
The slower switching times are the result of the disparity between the ionic mobilities of liquid vs. gel electrolytes. Gel electrolytes are well known to experience ion mobility magnitudes lower than liquid electrolytes, but their implementation is necessary for real device design to avoid electrolyte leaks that would occur using a liquid-type electrolyte.46
Interestingly, the ECMs containing cobalt species demonstrate faster colour transitions at λmax = 515 nm and λmax = 700 nm, which originate from osmium bearing molecules, perhaps, due to intervalence charge transfer.47 This effect might also influence the colouration efficiency (CE) of the materials. To define the CE of the devices operating in their linear region for changes in both optical density and charge density, two sets of graphs were plotted (Fig. 3) following the methodology described by Fabretto et al.48 Although the packing density of iron-bearing moieties in Co–Fe is comparable with those of Os–Fe ECM, the CE at the characteristic wavelength of iron is slightly larger in Co–Fe ECM. Moreover, intervalence charge transfer in Co–Os–Fe ECM might be the reason for a decrease of colouration efficiency (Fig. 3) at wavelengths characteristic to cobalt (515 nm) and osmium (515 and 700 nm) accompanied by an increase in colouration efficiency at the characteristic wavelength of iron-bearing molecules (600 nm).
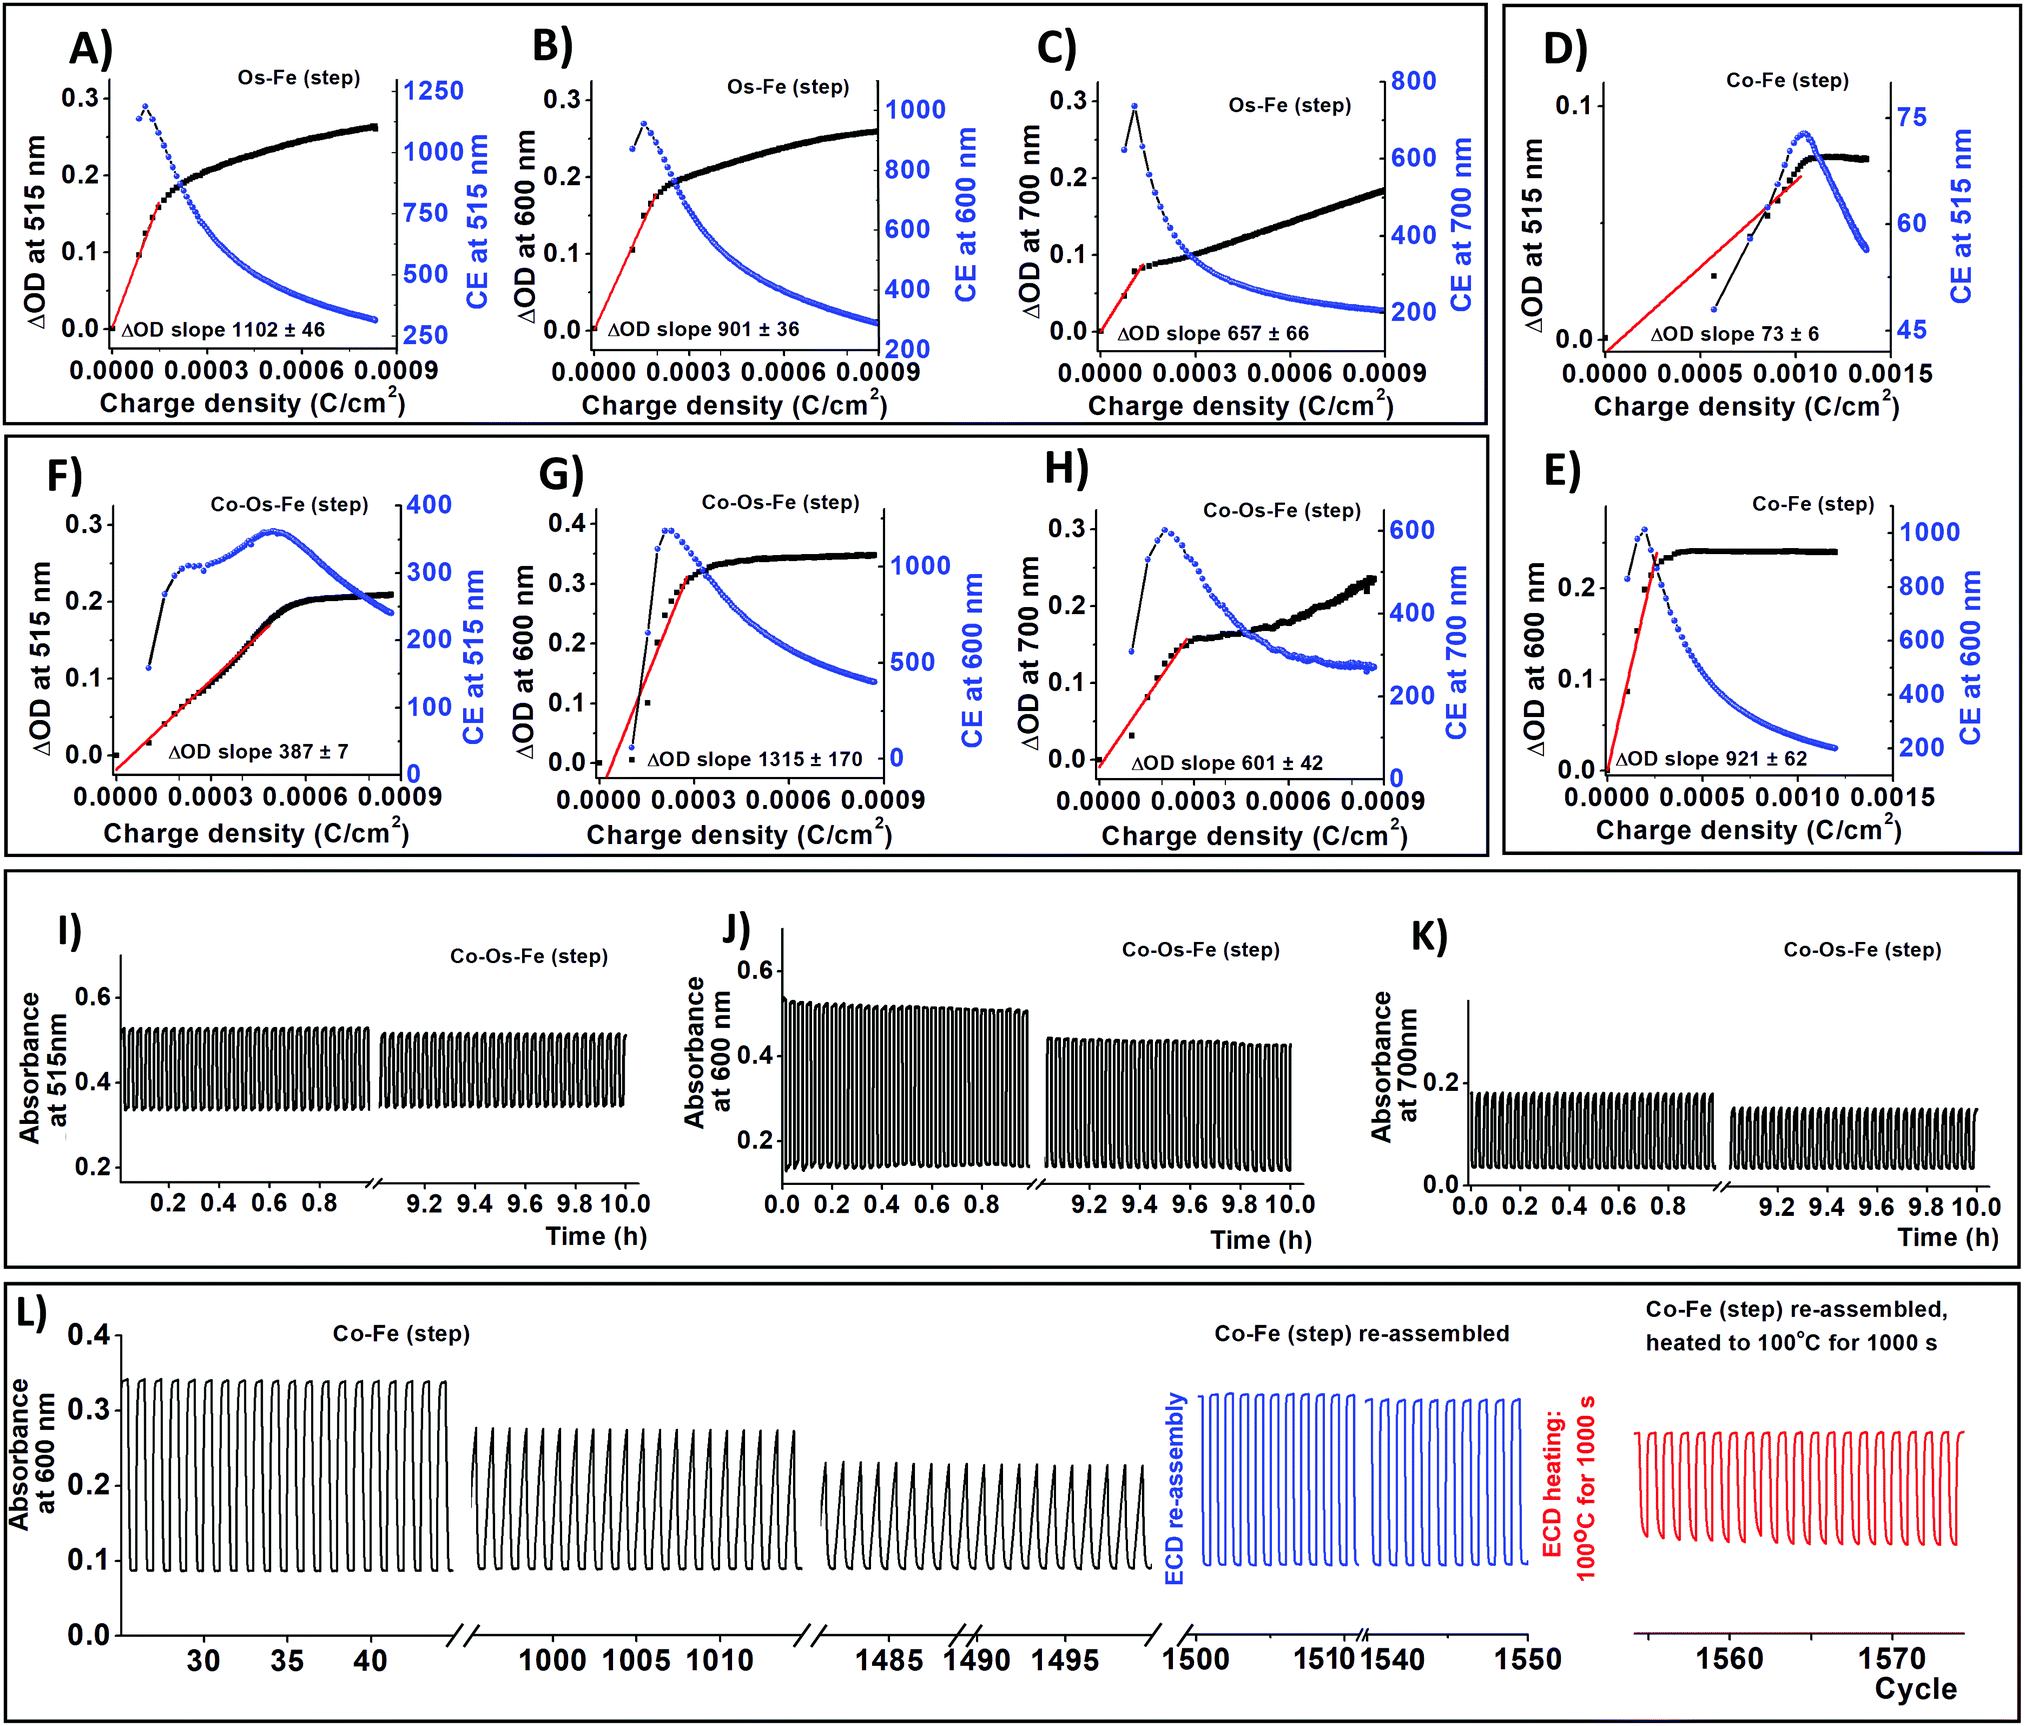 | ||
| Fig. 3 Colouration efficiency (CE) of ECDs at different wavelength: Os–Fe at (A) 515 nm, (B) 600 nm, (C) 700 nm; Co–Fe at (D) 515 nm, (E) 600 nm; and Co–Os–Fe at (F) 515 nm, (G) 600 nm, (H) 700 nm. Chronoabsorptometry of Co–Os–Fe ECD upon cycling between −1 V and 3 V with 60 s hold at a wavelength characteristic of MLCT for the corresponding complexes: (I) 515 nm – Co and Os, (J) 600 nm – Fe, and (K) 700 nm – Os. Long-term cycling stability experiment performed for Co–Fe ECD by following the absorbance at 600 nm: (L) after 1500 cycles, the ΔOD retention is 63%. Disassembly of ECD followed by ECM cleaning from waste gel electrolyte and re-assembly using the new gel electrolyte and counter ITO/glass electrode results in ECD with restored properties (ΔOD retention is 96%). When ECD is heated to 100 °C for 1000 s and then cooled down, the ΔOD retention is 60%. | ||
As we have mentioned before, the covalent bonding of each individual EC molecule to the conductive support often grants long-term stability to the resulting ECDs. Continuous cycling between −1 and 3V with 60 s hold time for 10 h results in insignificant ΔOD decay (Fig. 3 and Fig. S8, S9, ESI†). Co–Fe ECD was used to estimate long term stability since it demonstrates the worst retention of ΔOD at 600 nm (78% after 10 h cycling). Fresh Co–Fe ECD exhibits a ΔOD600nm of 24%. After 1000 cycles, the ΔOD600nm of Co–Fe ECD decreases to 18.5% (ΔOD600nm retention is 77%); while after 1500 cycles, ΔOD600nm falls to 15% (ΔOD600nm retention 63%). The shape change of spectroelectrochemical curves upon cycling (Fig. 2L) suggests that gel electrolyte decomposition is responsible for the ΔOD deterioration.25 After 50 h of continuous cycling, Co–Fe ECD was disassembled, the resulting ECM was sonicated in acetonitrile to remove the used electrolyte, and then re-assembled into ECD using a new gel electrolyte and an ITO-glass counter electrode. The re-assembled ECD demonstrates almost complete property recuperation (ΔOD600nm = 23%, ΔOD600nm retention is 96%).
We have also performed a temperature stability experiment following the procedure recently reported by Higuchi for his ECDs based on ditopic bis-terpyridine Fe-supramolecular polymer.49 Briefly, Co–Fe ECD, re-assembled after a long-term stability test, was heated to 100 °C for 1000 s and cooled down to 25 °C. After this, the ΔOD600nm drops to 14.5% (ΔOD600nm retention is 60%). The drop in ΔOD for both systems results from gel electrolyte deterioration, which in turn, decreases ionic mobility through the device.49
Experimental
Materials
Cobalt(II) tetrafluoroborate hexahydrate, iron(II) tetrafluoroborate hexahydrate, ethylene glycol, 2-acetylpyridine, 4-pyridinecarboxaldehyde, ferrocene, propylene carbonate, sodium hydroxide, aqueous ammonia solution 25%, silver nitrate, and ITO nanopowder <50 nm particle size (mentioned in the main text as ITO-50) were purchased from Millipore Sigma. Ammonium hexafluorophosphate, ammonium hexachloroosmate(IV), lithium trifluoromethanesulfonate, potassium hydroxide, poly(methyl methacrylate), and tetra-n-butylamonium hexafluorophosphate were obtained from Alfa Aesar. Solvents (ethyl alcohol, hexane, isopropanol, and anhydrous acetonitrile) were purchased from VWR. All reagents were used without purification, except for hexane which was purged for 20 min in N2 over molecular sieves before use. ITO coated glass (ITO/glass) was purchased from Delta Technologies Limited: 10 × 35 × 0.7 mm, coating on one side, RS = 4–10 Ω, with cut edges.Surface enhanced support
ITO coated glass (ITO glass) was submerged in basic piranha for 15 min. CAUTION! Piranha solution is an extremely dangerous oxidizing agent and should be handled with care using appropriate personal protection. (Basic piranha was obtained by adding 10 mL of aqueous ammonia solution (25%) to 50 mL of deionized (DI) water and heating to 60 °C. Then the heat was removed and 10 mL of hydrogen peroxide (30%) was added. The solution was used immediately after preparation). ITO/glass pieces were placed separately in the basic piranha for 15 min, washed 3× with DI H2O, 3× with isopropanol, dried in a N2 stream, heated in an oven at 130 °C for 2h and used for screen printing of the surface enhance support. The ITO-50 paste for screen printing was formulated using a PQ-N04 planetary ball milling machine by Across International, equipped with 75 mL agate jars and 6 mm agate beads, operating for 24 h at 200 rpm as previously reported.29 Screen printing of the paste on ITO glass was performed with a 90 T polyester mesh screen by Mismatic, S.n.c. The printing procedure was repeated several times to achieve a suitable thickness of the support. A drying step of 5 min at 120 °C was performed between each layer printing. The annealing of screen-printed films was performed by increasing the temperature from 20 °C to 500 °C at 5 °C min−1, holding films at 500 °C for 1 h, followed by increasing the temperature from 500 °C to 600 °C at 5 °C min−1 and holding the film at 600 °C for 1 h.Templating layer deposition was performed in N2-filled MBraun LABstar Pro glovebox. Screen printed supports annealed to ITO glass slides were submerged into 1:50 (v/v) solution of 4-(chloromethyl)phenyltrichlorosilane in anhydrous hexane for 20 min onto the ITO-50 substrates. Then the slides were rinsed in a glove box 3× with hexane, 3× with acetonitrile, and dried in a vacuum.
Synthesis of ligand and metal complexes
4′-(Pyridin-4-yl)-2,2′:6′,2′′-terpyridine was synthesized according to the published procedure.50 Os(II), Co(II), and Fe(II) complexes of 4′-(pyridin-4-yl)-2,2′:6′,2′′-terpyridine were synthesized by using previously reported procedures.50,51ECM fabrication
Slides pre-functionalized with the templating layer were placed into Ace-glass pressure tubes filled with N2, and a 0.4 mM solution of the desired metal complex in acetonitrile was added. The tube was sealed and heated at 95 °C for 100 h in the dark and then cooled down to room temperature. The slides were rinsed with acetonitrile (3 × 20 mL) prior to submersion into the pressure tube, followed by the addition of 0.4 mM solution of the next metal complex, filling the tube with N2, sealing, and repeating heat treatment. This was repeated for the third metal, if necessary for the desired ECM. Sequential deposition of metal complexes was performed in the following order: Co2+, Os2+, and then Fe2+, as required for the specific ECM. For all ECMs, once the final metal complex was deposited, the ECM was rinsed in air with hexane (3 × 20 mL), sonicated in hexane for 5 min, and then rinsed with acetonitrile (3 × 20 mL). A solid-state ECD setup was similar to the one reported by van der Boom.52 Briefly, ECDs were obtained by covering ECM with a gel–electrolyte and a top ITO electrode.Instrumentation
UV-vis spectra of ECMs were recorded on a PerkinElmer 750S UV-vis spectrophotometer equipped with 60 mm integrating sphere in the diffuse reflectance mode. Long term cycling was recorded using Lambda 750's Timedrive software, with cycling from −1 V hold (60 s) to +3 V hold (60 s). Cyclic voltammograms (CVs) at sweep rates of 200–5 mV s−1 and electrochemical impedance spectroscopy (EIS) measurements were recorded using a Solartron Analytical 1470E potentiostat. For EIS, the Solartron was coupled to an SI 1260 impedance/gain phase analyzer, measuring from 80 × 103 to 0.1 Hz with a 5 mV amplitude signal. EIS impedance was measured at all bias potentials demonstrating redox activity, and additionally 1.1 V vs. Fc/Fc+ as the Cdl, which was specifically chosen to ensure consistency in the baseline with the different metal combinations. CVs using sweep rates of 1600–400 mV s−1 were recorded using a Pine Wavedriver potentiostat AFCBP1. All CVs were performed using 0.1 M TBAHFP in CH3CN as the electrolyte, which was purged with N2 for 5 min prior to measurement. The ECMs were connected as the working electrode in a plate evaluating cell from BioLogic. A Pt counter electrode and Ag/AgNO3 reference electrode (0.01 M in the electrolyte) were used. All CVs were normalized to the geometric area of the electrode within the plate evaluating cell. All potentials reported here have been corrected to the ferrocene/ferrocenium (Fc/Fc+) potential. XPS measurements were performed using a Thermo Scientific K-Alpha instrument equipped with a monochromated Al Kα (1486.7 eV) X-ray source and 180° double-focusing hemispherical analyzer with effective charge compensation. A smart fit algorithm was used for background subtraction and Powell peak-fitting algorithm was used for data analysis. Raman spectroscopy was performed using an inVia confocal Raman Microscope by Renishaw (2400 mm−1 (vis) grating, including a Renishaw Centrus OMCN39 CCD detector). The laser used was a Nd:YAG with 50 mW power output and nm λexcitation = 532 nm. Scanning electron microscopy (SEM) images were recorded using a Hitachi FlexSEM 1000.Conclusions
Sequential deposition of Co(II), Os(II), and Fe(II) complexes of 4′-(pyridin-4-yl)-2,2′:6′,2′′-terpyridine on surface-enhanced ITO supports leads to Os–Fe, Co–Fe, and Co–Os–Fe ECMs. The ability to one-by-one address the oxidation state of the metal centres allows each ECM to exhibit two distinct colour-to-colour transitions. The colouration efficiencies at the characteristic wavelength corresponding to osmium and iron transitions in Os–Fe ECM are comparable but the switching time of osmium in this system is relatively high (up to 10 s). In contrast, the introduction of cobalt to reach Co–Os–Fe ECM leads to lower colouration efficiencies related to the osmium oxidation state change with faster (up to 2 s) switching times. The trends observed in electrochemical impedance spectroscopy align to other electrochemical measurements, including the electron transport constants (kET) and chronoabsorptometry measurements (tb and tc). Faster electron kinetics were found for Co–Os–Fe and Co–Fe ECMs. While the kET value for Co–Fe at the Co half-wave potential is relatively fast compared to its diffusion coefficient, the material experiences relatively low internal resistance at this half-wave potential, suggesting improved electron transfer. Finally, the slowest values of electron transport were observed for Os–Fe ECM, which is unsurprising due to the higher resistance values. The ability to combine several isostructural metal complexes that results in different individual colours such as blue (Fe2+), wine-red (Os2+), and pale-brown (Co2+) with the native yellow colour of the surface-enhanced ITO support opens a door for the development of advanced multistate ECMs that demonstrate multichromic transitions, through which all other colours can be derived.Conflicts of interest
There are no conflicts to declare.Acknowledgements
The authors acknowledge the Natural Sciences and Engineering Research Council (NSERC) of Canada for the Discovery Grants program funding (RGPIN-2020-05152, RGPIN-2016-05823) and the Canada Foundation for Innovation for equipment support. N. O. L. acknowledges funding support through NSERC's Alexander Graham Bell Canada Graduate Scholarship-Doctoral (CGS D). J. P. acknowledges financial support from the NSERC USRA. Authors acknowledge Andrew J. Hynes for screen printing of SES.Notes and references
- V. Rai, R. S. Singh, D. J. Blackwood and D. Zhili, Adv. Eng. Mater., 2020, 2000082, DOI:10.1002/adem.202000082.
- M. Lahav and M. E. van der Boom, Adv. Mater., 2018, 30, 1706641, DOI:10.1002/adma.201706641.
- A. Al-Ayash, R. T. Kane, D. Smith and P. Green-Armytage, Color Res. Appl., 2016, 41, 196–205, DOI:10.1002/col.21949.
- J.-T. Wu, H.-T. Lin and G.-S. Liou, ACS Appl. Mater. Interfaces, 2019, 11, 14902–14908, DOI:10.1021/acsami.9b00402.
- Z.-j. Huang, H.-r. Mou, J.-p. Xie, F. Li, C.-B. Gong, Q. Tang and X.-K. Fu, Sol. Energy Mater. Sol. Cells, 2020, 206, DOI:10.1016/j.solmat.2019.110293.
- S. R. Jena and J. Choudhury, Chem. Commun., 2020, 56, 559–562, 10.1039/c9cc06920h.
- M. E. Mulholland, D. Navarathne, S. Khedri and W. G. Skene, New J. Chem., 2014, 38, 10.1039/c4nj00027g.
- Y. Alesanco, A. Viñuales, J. Palenzuela, I. Odriozola, G. Cabañero, J. Rodriguez and R. Tena-Zaera, ACS Appl. Mater. Interfaces, 2016, 8, 14795–14801, DOI:10.1021/acsami.6b01911.
- J. Sun, X. Lv, P. Wang, Y. Zhang, Y. Dai, Q. Wu, M. Ouyang and C. Zhang, J. Mater. Chem. C, 2014, 2, 10.1039/c4tc00516c.
- P. Zhang, X. Xing, Y. Wang, I. Murtaza, Y. He, J. Cameron, S. Ahmed, P. J. Skabara and H. Meng, J. Mater. Chem. C, 2019, 7, 9467–9473, 10.1039/c9tc02919b.
- H. Keisar, M. Lahav and M. E. Boom, ChemPhysChem, 2019, 20, 2403–2407, DOI:10.1002/cphc.201900784.
- Y. Hamo, M. Lahav and M. E. van der Boom, Angew. Chem., Int. Ed., 2020, 59, 2612–2617, DOI:10.1002/anie.201912333.
- M. K. Bera, Y. Ninomiya and M. Higuchi, ACS Appl. Mater. Interfaces, 2020, 12, 14376–14385, DOI:10.1021/acsami.9b21966.
- N. Malik, M. Lahav and M. E. der Boom, Adv. Electron. Mater., 2020, 2000407, DOI:10.1002/aelm.202000407.
- J. Zhang, J.-p. Tu, D. Zhang, Y.-q. Qiao, X.-h. Xia, X.-l. Wang and C.-d. Gu, J. Mater. Chem., 2011, 21, 10.1039/c1jm13069b.
- J. Zhang, J. Wang, C. Wei, Y. Wang, G. Xie, Y. Li and M. Li, Nat. Commun., 2020, 11, DOI:10.1038/s41467-020-16255-z.
- S. Pai, M. Schott, L. Niklaus, U. Posset and D. G. Kurth, J. Mater. Chem. C, 2018, 6, 3310–3321, 10.1039/c7tc04177b.
- Y. Liu, R. Sakamoto, C.-L. Ho, H. Nishihara and W.-Y. Wong, J. Mater. Chem. C, 2019, 7, 9159–9166, 10.1039/c9tc02257k.
- C.-W. Hu, T. Sato, J. Zhang, S. Moriyama and M. Higuchi, J. Mater. Chem. C, 2013, 1, 10.1039/c3tc30440j.
- J. Poisson, H. L. Geoffrey, I. I. Ebralidze, N. O. Laschuk, J. T. S. Allan, A. Deckert, E. B. Easton and O. V. Zenkina, J. Phys. Chem. C, 2018, 122, 3419–3427, DOI:10.1021/acs.jpcc.7b10900.
- L. Motiei, M. Altman, T. Gupta, F. Lupo, A. Gulino, G. Evmenenko, P. Dutta and M. E. van der Boom, J. Am. Chem. Soc., 2008, 130, 8913–8915, DOI:10.1021/ja802470g.
- M. Nunes, C. Moura, A. R. Hillman and C. Freire, Langmuir, 2017, 33, 6826–6837, DOI:10.1021/acs.langmuir.7b01380.
- B.-C. Pan, W.-H. Chen, T.-M. Lee and G.-S. Liou, J. Mater. Chem. C, 2018, 6, 12422–12428, 10.1039/c8tc04469d.
- R. Balgley, Y. M. Algavi, N. Elool Dov, M. Lahav and M. E. van der Boom, Angew. Chem. Int. Ed., 2018, 57, 13459–13464, DOI:10.1002/anie.201807453.
- J. T. S. Allan, S. Quaranta, I. I. Ebralidze, J. G. Egan, J. Poisson, N. O. Laschuk, F. Gaspari, E. B. Easton and O. V. Zenkina, ACS Appl. Mater. Interfaces, 2017, 9, 40438–40445, DOI:10.1021/acsami.7b11848.
- P. C. Mondal, V. Singh and M. Zharnikov, Acc. Chem. Res., 2017, 50, 2128–2138, DOI:10.1021/acs.accounts.7b00166.
- I. Pisagatti, G. Gattuso, A. Notti, M. F. Parisi, G. Brancatelli, S. Geremia, F. Greco, S. Millesi, A. Pappalardo, L. Spitaleri and A. Gulino, RSC Adv., 2018, 8, 33269–33275, 10.1039/c8ra06792a.
- N. O. Laschuk, I. I. Ebralidze, J. Poisson, J. G. Egan, S. Quaranta, J. T. S. Allan, H. Cusden, F. Gaspari, F. Y. Naumkin, E. B. Easton and O. V. Zenkina, ACS Appl. Mater. Interfaces, 2018, 10, 35334–35343, DOI:10.1021/acsami.8b10666.
- N. O. Laschuk, A. Obua, I. I. Ebralidze, H. M. Fruehwald, J. Poisson, J. G. Egan, F. Gaspari, F. Y. Naumnkin, E. B. Easton and O. V. Zenkina, ACS Appl. Electron. Mater., 2019, 1, 1705–1717, DOI:10.1021/acsaelm.9b00408.
- N. O. Laschuk, R. Ahmad, I. I. Ebralidze, J. Poisson, E. B. Easton and O. V. Zenkina, ACS Appl. Mater. Interfaces, 2020, 12, 41749–41757, DOI:10.1021/acsami.0c11478.
- M. Higuchi, Y. Akasaka, T. Ikeda, A. Hayashi and D. G. Kurth, J. Inorg. Organomet. Polym., 2009, 19, 74–78, DOI:10.1007/s10904-008-9243-7.
- D. G. Kurth and M. Higuchi, Soft Matter, 2006, 2, 915–927, 10.1039/b607485e.
- G. Sewell, R. J. Forster and T. E. Keyes, J. Phys. Chem. A, 2008, 112, 880–888, DOI:10.1021/jp077542o.
- E. Campagnoli, J. Hjelm, C. J. Milios, M. Sjodin, Z. Pikramenou and R. J. Forster, Electrochim. Acta, 2007, 52, 6692–6699, DOI:10.1016/j.electacta.2007.04.096.
- T. C. Strekas and P. S. Diamandopoulos, J. Phys. Chem., 1990, 94, 1986–1991, DOI:10.1021/j100368a049.
- C. D. Wagner, L. E. Davis, M. V. Zeller, J. A. Taylor, R. H. Raymond and L. H. Gale, Surf. Interface Anal., 1981, 3, 211–225, DOI:10.1002/sia.740030506.
- H. Ferreira, M. M. Conradie and J. Conradie, Inorg. Chim. Acta, 2019, 486, 26–35, DOI:10.1016/j.ica.2018.10.020.
- H. Keisar, G. de Ruiter, A. H. Velders, P. Milko, A. Gulino, G. Evmenenko, L. J. W. Shimon, Y. Diskin-Posner, M. Lahav and M. E. van der Boom, J. Am. Chem. Soc., 2018, 140, 8162–8171, DOI:10.1021/jacs.8b02968.
- E. Botha, M. Landman, P. H. van Rooyen and E. Erasmus, Inorg. Chim. Acta, 2018, 482, 514–521, DOI:10.1016/j.ica.2018.04.013.
- X. Chen, H. Ren, W. Peng, H. Zhang, J. Lu and L. Zhuang, J. Phys. Chem. C, 2014, 118, 20791–20798, DOI:10.1021/jp5061792.
- C. M. Hanna, C. D. Sanborn, S. Ardo and J. Y. Yang, ACS Appl. Mater. Interfaces, 2018, 10, 13211–13217, DOI:10.1021/acsami.8b01219.
- R. P. Janek, W. R. Fawcett and A. Ulman, Langmuir, 1998, 14, 3011–3018, DOI:10.1021/la970980.
- J. Zhang, H. Feng, Q. Qin, G. Zhang, Y. Cui, Z. Chai and W. Zheng, J. Mater. Chem. A, 2016, 4, 6357–6367, 10.1039/c6ta00397d.
- E. B. Easton, H. M. Fruehwald, R. Randle, F. S. Saleh and I. I. Ebralidze, Carbon, 2020, 162, 502–509, DOI:10.1016/j.carbon.2020.02.086.
- O. R. Reid, F. S. Saleh and E. B. Easton, Electrochim. Acta, 2013, 114, 278–284, DOI:10.1016/j.electacta.2013.10.050.
- N. Yadav, N. Yadav, M. K. Singh and S. A. Hashmi, Energy Technol., 2019, 7, 1900132, DOI:10.1002/ente.201900132.
- D. M. D'Alessandro and F. R. Keene, Chem. Rev., 2006, 106, 2270–2298, DOI:10.1021/cr050010o.
- M. Fabretto, T. Vaithianathan, C. Hall, P. Murphy, P. C. Innis, J. Mazurkiewicz and G. G. Wallace, Electrochem. Commun., 2007, 9, 2032–2036, DOI:10.1016/j.elecom.2007.05.035.
- S. Mondal, T. Yoshida, U. Rana, M. K. Bera and M. Higuchi, Sol. Energy Mater. Sol. Cells, 2019, 200, DOI:10.1016/j.solmat.2019.110000.
- E. C. Constable and A. M. W. C. Thompson, J. Chem. Soc., Dalton Trans., 1992, 2947–2950, 10.1039/dt9920002947.
- E. C. Constable and A. M. W. C. Thompson, J. Chem. Soc., Dalton Trans., 1994, 1409–1418, 10.1039/DT9940001409.
- S. Shankar, M. Lahav and M. E. van der Boom, J. Am. Chem. Soc., 2015, 137, 4050–4053, DOI:10.1021/jacs.5b00429.
Footnote |
| † Electronic supplementary information (ESI) available: It contains results of selected electrochemical, XPS, Laviron kinetics measurements of ECMs, and spectroelectrochemical measurements of ECDs. See DOI: 10.1039/d0ma00735h |
| This journal is © The Royal Society of Chemistry 2021 |