 Open Access Article
Supercapacitive behaviour of a novel nanocomposite of 3,4,9,10-perylenetetracarboxylic acid incorporated captopril-Ag nanocluster decorated on graphene nanosheets†
Tapas
Goswami‡
 *a,
Navpreet
Kamboj‡
b,
Amarnath
Bheemaraju
c,
Aditya
Kataria
a and
Ramendra Sundar
Dey
 *b
*b
aDepartment of Chemistry, University of Petroleum & Energy Studies (UPES), Energy Acres Building, Dehradun-248007, Uttarakhand, India. E-mail: tgoswami@ddn.upes.ac.in
bInstitute of Nano Science and Technology (INST), Sector-81, Mohali-140306, Punjab, India. E-mail: rsdey@inst.ac.in
cDepartment of Applied Sciences, School of Engineering and Technology, BML Munjal University, Gurgaon, Sidhrawali, Haryana 122413, India
First published on 13th January 2021
Abstract
A nanocomposite of PTCA and silver nanocluster incorporated graphene nanosheets were synthesized using a single step facile methodology. The G/PTCA/Capt-AgNC nanocomposites were characterized using UV-Vis, photoluminescence (PL), FTIR, Raman, X-ray photoelectron spectroscopy, high-resolution transmission electron microscopy (HRTEM), Scanning electron microscopy (SEM) and X-ray diffraction. The image obtained using an electron microscope revealed a sheet-like nanomaterial decorated with ultra-small (∼2–4 nm) silver nanoclusters. It was found that the synthesized nanocomposite forms a remarkably stable suspension in solvents and exhibits an exceptional fluorescence quantum yield (QY ∼ 0.32) in comparison to the previously reported metal nanoclusters. To test the potential utility of the nanocomposite as a charge storage material, electrochemical capacitance measurements were carried out. A drastic increase in the specific capacitance (Cm) of G/PTCA/Capt-AgNC was observed in comparison to that of PTCA/Capt-AgNC. The as-prepared nanocomposite shows significant charge–discharge reversibility even at a high current density of 137 A g−1. The method for the synthesis of the nanocomposite reported here provides a facile and straightforward approach to decorate graphene sheets with metal nanoparticles and may be readily expanded to other classes of graphene hybrids for flexible electronic, sensor and charge storage applications.
1. Introduction
Materials that possess characteristics such as flexibility, deformability, lightweight, bendability, transparency, and low cost have drawn substantial attention in recent years due to their versatile applications. These are found to be enormously useful in the fabrication of modern-day consumer electronics such as digital displays, integrated sensors, thin-film transistors, solar cells, touch panels, and transparent electrodes for optoelectronic and energy storage systems including batteries and supercapacitors.1–8 Currently, supercapacitors have drawn much attention due to their advantages of high power density, fast charge–discharge, and long cycle life.9,10 Nanocomposites with organic materials have several advantages as an active electrode material in supercapacitors such as structural versatility, optical tunability, and higher theoretical capacitance. However, recently explored organic materials like conducting polymers,11 organosulphur compounds,12 organic radical compounds,13 and carbonyl compounds5,14 mainly suffer from poor electrical conductivity and dissolution in low molecular weight organic electrolytes.5Therefore, a strategy for the design and modification of suitable organic active materials with significantly enhanced charge transport properties is required. Recently carbonaceous materials such as carbon nanotubes (CNT), carbon nanofibers, graphitic carbon nitride, onion-like carbon,15–17 multi-walled CNTs, carbon nanoparticles consisting of multiple concentric graphitic shells, carbide-derived carbon, graphene and reduced graphene oxide (rGO) have been investigated for the fabrication of micro-supercapacitors (MSCs)10 and other flexible electronic devices.7 However, despite having good energy density and power output, their specific capacitance is generally found to be low.17 Various highly conducting polymers, such as polypyrrole,18 and polyaniline19 have been used to make nanocomposites with graphene or reduced graphene oxide (rGO) to increase the specific capacitance of the material, but they suffer from poor cycling stability because of the faradaic reaction mechanism involved. Indium-tin-oxide (ITO) is an optically transparent and electrically conductive inorganic material that is used for making transparent conductive thin films2 and current collector in supercapacitors. Metal oxides such as RuO2,20 MnO2,1 mesoporous Co3O4 nanoparticles (NPs), NiO nano/microspheres, Ni/NiO core/shell NPs,21 α and β-Ni(OH)2 NPs on Ni foams, hollow Co3O4 nanowires on nickel foam, and Ni(OH)2 nanotubes with porous walls have shown excellent performance in electrochemical supercapacitor applications.1 Though they are found to have many advantages, some metal oxides such as RuO2 are expensive and not environmentally benign. Metal oxides and conductive polymers have high specific capacitance but they lack stability.
A combination of both inorganic and carbonaceous materials could potentially result in a more efficient electrochemical supercapacitor and other electronic devices.7 For example, ligation of metallic nanoparticles to graphene nanosheets results in an efficient material that can be used in the preparation of transparent conductive films (TCFs).1 However, although transition metal oxide (such as MnO2, Fe2O3, Fe3O4, and V2O5) NPs mixed, embedded, or deposited onto carbonaceous materials are found to have considerable specific capacitance, they are generally found to be less conductive than their carbonaceous backbone and have a low rate capability.7 An important class of hybrid graphene–organic composite materials in electronics has drawn a lot of attention in recent days. It has been found that the organic semiconductors can be used for better processing of graphene-like materials and to modulate their properties for various applications. The demand of organic semiconductors has been constantly increasing in the development of organic electronics, because of their key features like low cost, biocompatibility, and low-temperature solution-based processibility. One such chemically stable organic semiconductor (OSC) is 3,4,9,10-perylenetetracarboxylic acid (PTCA), which contains a perylene ring and conjugated carboxylic groups. OSC molecules bound to carbon matrices with excellent conductivity such as reduced graphene oxide (rGO) have been explored.5 Furthermore, it has been found that graphene-like nanosheets could restack and precipitate from the dispersion medium. This limits its use as a transparent thin film with an agglomerated rGO nanosheet. In order to prepare a stable dispersion and reduce the stacking of graphene-like nanosheets, various strategies have been followed such as grafting of polymers, incorporating organic semiconductors like PTCA, decorating metal nanoparticles onto the surface, and using phenyl groups to attract graphene nanosheets (GNS). PTCA also protects the electronic structure of the carbon materials under harsh conditions. Another promising strategy, which has been explored in recent days is the fabrication of transparent conducting thin films by decorating metal nanoparticles (Pt, Au, Pd, and Ag)2,22–25 on a graphene-like nanosheet. It has also been reported that metal nanoparticles act as a nanospacer and their binding with GNS inhibits the agglomeration and improves dispersibility. The stability of the metal nanoparticle is highly essential for it to be used as a nanospacer. Furthermore, ligands play an important role in the stability of the metal nanocluster. Captopril is one such suitable biocompatible ligand for the facile synthesis of a metal (Ag) nanocluster which has been explored by our group earlier.26,27 The metal nanoclusters owing to their ultrasmall size when incorporated into GNS along with the OSC molecule can not only act as a nanospacer, but also display several simultaneous coexisting properties, e.g., optical sensing, electrochemical sensing, catalysis, electrical conductivity, and specific capacitance. One of the unique properties of a noble metal nanocluster which could be cleverly utilized is its tunable emission properties with suitable modification of its ligand shell.28
Herein, for the first time, we have prepared a novel nanocomposite of PTCA, silver nanocluster, and graphene using a solution based facile synthetic methodology. In this study, the in situ loading of PTCA/capt-AgNC onto the surface of a graphene nanosheet is adopted as a new strategy to synthesize the nanocomposite to be used as the electrode material for a supercapacitor. The as-synthesized material was then used as the active electrode to test the electrochemical performance. There is a huge increase in the capacitance of the nanocomposite material (PTCA/Capt-AgNC) after incorporation with GNS. The fluorescence intensity and dispersibility of the nanocomposite (G/PTCA/Capt-AgNC) were observed to be significantly high. We believe that the present strategy paves the way for the fabrication of multifunctional materials having high potential in the development of flexible electronic devices, energy storage systems, and full-color organic light-emitting diodes (OLED).
2. Experimental methods
2.1 Instrumentation details
An X-ray diffraction (XRD) technique was used to determine the structural information of the as-prepared nanocomposites using a Bruker X-ray diffractometer with Cu-Kα (λ = 1.5406 Å) radiation. Raman and photoluminescence spectra were obtained using a WITec instrument, Germany, and a Parkin Elmer spectrophotometer, respectively. Scanning electron microscopy (SEM) images were obtained using a SEM Jeol JSMIT300 instrument. High-resolution transmission electron microscopy (HRTEM) studies were carried out using a JEOL 2100 TEM microscope with a 0.2 nm point resolution and 200 kV acceleration voltages. Elemental composition of G/PTCA/Capt-AgNC was measured using an energy dispersive X-ray (EDAX) spectrometry associated with HRTEM. Nitrogen adsorption–desorption analysis was performed at 77 K using an Autosorb iQ2 instrumental setup to examine the surface area by the Brunauer Emmett Teller (BET) method. The pore size distribution was computed using the nonlocal density functional theory (NLDFT) technique. The samples were degassed at 120 °C for more than 12 h under vacuum conditions. X-ray photoelectron spectroscopy was performed using a PHI 5000 VersaProbe III system equipped with a monochromatic Al Kα945 X-ray radiation source. Fourier transform infrared (FTIR) spectroscopy was carried out using a PerkinElmer FTIR spectrometer at room temperature. A regulated DC power supply (Sigma, 30 V/10 A) was used for the exfoliation of a graphite electrode. Electrochemical measurements like cyclic voltammetry (CV), galvanostatic charge–discharge (GCD), and electrochemical impedance spectroscopy (EIS) were performed using a CHI 760E electrochemical workstation. For electrochemical characterizations, glassy carbon (GC) was used as the working electrode, Ag/AgCl (3M KCl) as the reference electrode and platinum wire as the counter electrode.2.2 Synthesis of graphene via an electrophoretic exfoliation method
The synthesis of graphene was carried out via an electrophoretic exfoliation method as mentioned in our previous reports29,30 with a few modifications. In a typical method, graphite plates of (1 × 2) cm2 area and 0.5 mm thickness were used as both the working and counter electrodes, which were immersed in dilute orthophosphoric acid (1 M H3PO4) solution and placed parallel to each other. A distance of 2 cm was maintained throughout the experiment between the electrodes. When a positive voltage of 8 V was applied from a direct current (DC) power source for 30 minutes to a graphite electrode, the graphite flake at the +ve terminal began to expand and then quickly dissociated and dispersed into the solution. The resulting exfoliated material was subjected to ultrasonication for one hour to form a homogenously dispersed solution and to break the large graphene sheets. The exfoliated material was then collected by centrifugation at 7000 rpm and washed with Mili-Q water and ethanol repeatedly to remove the residuals. Washing was continued until the pH reached neutral. The sample was then dried at 70 °C in a hot air oven for 12 hours and exfoliated graphene (G) was obtained. The obtained sample was further directly used for the characterization and nanocomposite formation.2.3 Synthesis of G/PTCA/Capt-AgNC nanocomposite
In a typical synthetic method (as demonstrated in Scheme 1), 70 mg (∼0.4 mM) of AgNO3 was dispersed in 20 mL of methanol poured into a 100 mL round bottom flask followed by the addition of 125 mg (∼0.23 mM) of tetraoctylammonium bromide (TOABr) into the flask. The suspension was stirred and after 20 minutes, 130 mg (∼1 mM) of captopril was added. The mixture was kept under continuous stirring at 1000 rpm for another 40 minutes. Then, 20 mg of PTCDA/PVP microstructure (synthesized by following the reported method31) was poured into the mixture and stirring was continued. After 20 minutes, the as prepared exfoliated graphene (100 mg) was added under continuous stirring. Finally, 10 mL of ice cold aqueous solution of 2 M NaBH4 (500 mg) was slowly added with vigorous stirring. After the complete addition of sodium borohydride, the mixture was kept at 80 °C under constant stirring for 6 h. The color of the suspension gradually changed to blackish bottle green. The suspension was allowed to cool to room temperature (RT) and then acetone (20 mL) was added to precipitate the product. The product was harvested by centrifugation at 14![[thin space (1/6-em)]](https://www.rsc.org/images/entities/char_2009.gif) 500 rpm for 10 min, the supernatant was discarded and the solid product was collected. The product was then vacuum dried and stored in a desiccator.
500 rpm for 10 min, the supernatant was discarded and the solid product was collected. The product was then vacuum dried and stored in a desiccator.
The electrochemical behavior of the as-prepared nanocomposite (G/PTCA/Capt-AgNC) was compared with that of the nanocomposite in the absence of GNS (i.e. PTCA/Capt-AgNC). The PTCA/capt-Ag nanocomposite was prepared by following the same procedure as described elsewhere.32 In order to compare the electrochemical capacitance behavior of the organic semiconductor-based nanocomposite with that of the other inorganic semiconductor-based materials, PTCDA/Nb2O5 and TiO2/Nb2O5/Capt-AgNCs were prepared. The nanocomposite TiO2/Nb2O5/Capt-AgNC used here was synthesized by following the method reported elsewhere.27 The detailed synthetic methods of these materials are described in the supporting information. The as prepared Nb2O5 nanostructures and PTCDA/Nb2O5 nanocomposites were characterized using SEM (Fig. S1, ESI†), XRD (Fig. S2, ESI†) and FTIR spectroscopy (Fig. S3, ESI†). Fig. S4 (ESI†) represents the HRTEM micrograph of the TiO2/Nb2O5/Capt-AgNC nanocomposite.
2.4 Formulas to calculate the specific capacitance of the electrode materials
The specific capacitance can be calculated from cyclic voltammetry via the following eqn (1) | (1) |
The specific capacitance (Csp) was also calculated from galvanostatic charge–discharge curves using eqn (2) as follows:
 | (2) |
2.5 Supercapacitor electrode fabrication
A three electrode system was designed (as described earlier) for measuring the electrochemical performance of the as-fabricated materials in which a cleaned glassy carbon (GC) electrode was used as the conductive current collector, Ag/AgCl (3 M KCl) as the reference electrode and platinum wire as the counter electrode. Before use, the GC electrode was polished with fine alumina powder and repeatedly washed with DI water followed by sonication in water. A homogeneously dispersed solution was prepared by mixing the active materials (PTCA/Capt-AgNC and G/PTCA/Capt-AgNC) in a 1![[thin space (1/6-em)]](https://www.rsc.org/images/entities/char_2009.gif) :
:![[thin space (1/6-em)]](https://www.rsc.org/images/entities/char_2009.gif) 1 isopropanol–water mixture followed by sonication for 15 minutes. The solution was then drop casted on a pre-cleaned GC electrode and dried overnight at room temperature in a vacuum. The loading of all the active materials on the GC electrode was 0.5 mg cm−2. Then, the electrode was subjected to all electrochemical measurements performed in a three-electrode system. All the electrochemical measurements were performed between a potential window of 1 V in 1 M H2SO4 aqueous electrolyte.
1 isopropanol–water mixture followed by sonication for 15 minutes. The solution was then drop casted on a pre-cleaned GC electrode and dried overnight at room temperature in a vacuum. The loading of all the active materials on the GC electrode was 0.5 mg cm−2. Then, the electrode was subjected to all electrochemical measurements performed in a three-electrode system. All the electrochemical measurements were performed between a potential window of 1 V in 1 M H2SO4 aqueous electrolyte.
3. Results and discussion
The material G/PTCA/Capt-AgNC reported here was chosen to provide a solution to some of the major limitations of any graphene-like materials in practical applicability as a supercapacitor. The major disadvantages of GNS are the loss of electronic conductivity due to structural damages under harsh acidic conditions and difficulty in being made into a thin film because of its poor colloidal dispersibility.33 These drawbacks could be countered by the binding of GNS with PTCA/Capt-AgNC. PTCA is a bifunctional molecule, which contains aromatic perylene rings and four carboxyl groups. The aromatic perylene group could strongly interact with GNS. This allows the nanocluster to be anchored with GNS and reduces the aggregation of the nanosheets. Moreover, the presence of the –COOH group makes the nanocomposite superiorly dispersible in solvents. Thus, the resulting material prepared here has potential applications in transparent thin-film sensors and supercapacitors. The as-prepared nanocomposite is characterized using various spectroscopic and electron microscopic techniques to confirm the nanocomposite formation.In order to have a deeper insight into the internal structures and nanocomposite formation, X-ray diffraction analysis was carried out. The diffractograms of the red-pigmented pristine PTCA and the prepared nanocomposites are shown in Fig. 1a and b. The high intensity peaks of PTCA and PTCA/Capt-AgNC show that both the materials are highly crystalline in nature. Fig. 1b shows the magnified XRD pattern of the G/PTCA/Capt-AgNC nanocomposite which includes the sharp peaks corresponding to graphene and PTCA, and the broad reflection peaks corresponding to Ag-NC. The peaks at 2θ values of 38.1°, 44.3°, 64.4°, and 77.4° correspond to the lattice planes (111), (200), (220) and (311) of cubic structured silver (JCPDS No. 65-2871).34 The peaks observed at 2θ values of 31.4° and 32.1° correspond to PTCA which indicates the incorporation of PTCA.35 A sharp peak at 25.9° and a broad peak at 43.6° could be assigned to the C (002) and C (100) of GNS33,36 which exactly match with the XRD pattern of exfoliated graphene only (see Fig. S5, ESI†). The presence of various lattice planes of all the components as observed in the diffractogram verifies the successful preparation of the nanocomposite.
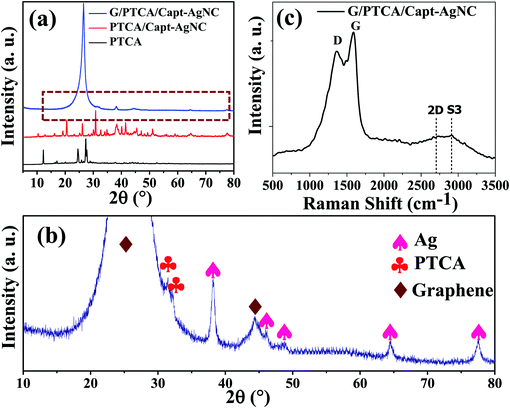 | ||
| Fig. 1 (a) X-ray diffraction pattern of PTCA, PTCA/Capt-AgNC and G/PTCA/Capt-AgNC, and (b) the magnified XRD pattern of G/PTCA/Capt-AgNC. (c) Raman spectrum of G/PTCA/Capt-AgNC. | ||
In the Raman spectrum (Fig. 1c), two typical characteristic peaks are observed at 1580 and 1350 cm−1. The peak around 1580 cm−1 (G band) is assigned to the E2g phonon of sp2 carbons. The D band (1350 cm−1) determines the extent of defects and disorder and is generally assigned to the breathing mode of k-point phonons of the A1g symmetry.37 The intensity ratio of the D and G bands was calculated (ID/IG) and found to be 0.95, which indicates lower defects in the as-prepared GNS.10 This could be attributed to the functionalization of PTCA with GNS. The other Raman modes observed here are 2D band (second-order D band) and S3 band. A prominent 2D band can be seen at ∼2690 cm−1. It is well known that the decoration of silver nanoparticles on GNS enhances the Raman signal via a surface-enhanced Raman spectroscopy (SERS) effect.25,38
The formation of the nanocomposite was further confirmed using UV-Vis and PL spectroscopic measurements. The absorption and emission spectra are shown in Fig. 2a. In general, the peak positioned at 249 nm is attributed to the π–π* transition of aromatic C![[double bond, length as m-dash]](https://www.rsc.org/images/entities/char_e001.gif) C of graphene which is shifted from its position (265 nm). This hypsochromic shift is due to the formation of a nanocomposite of graphene with PTCA/Capt-AgNC. However, the bathochromic shift observed in comparison to the graphene oxide which in general appears at ∼225 nm confirms the removal of oxygen containing surface functional groups and restoration of electron conjugation within the graphene nanosheet.39,40 One of the other starting materials used in the synthesis of the nanocomposite, PTCDA (3, 4, 9, 10-perylenete-tracarboxylic dianhydride) shows the maximum absorption peaks at around 570 nm and the observed electronic transition is called the Q-band.41 Here, there is an in-situ conversion of PTCDA to PTCA, which is then incorporated into the nanocomposite. This is evidenced by the appearance of a new peak with absorption maximum around 415 nm. This could be attributed to the π–π* electronic transition of the perylene moiety and the absorption peak of the captopril protected silver nanocluster.26 This suggests the formation of PTCA functionalized silver nanocluster/GNS nanocomposites. Strong greenish fluorescence was observed upon excitation at 350 nm in a neutral aqueous dispersion of the nanocomposite as shown in Fig. 2a. The fluorescence spectra exhibited two peaks one at 480 nm and another at 520 nm corresponding to the 0 → 0 and 0 → 1 electronic transitions of PTCA, respectively.42 The PL quantum yield was calculated using rhodamine 6G (Rh6G) as the standard by following eqn (3).
C of graphene which is shifted from its position (265 nm). This hypsochromic shift is due to the formation of a nanocomposite of graphene with PTCA/Capt-AgNC. However, the bathochromic shift observed in comparison to the graphene oxide which in general appears at ∼225 nm confirms the removal of oxygen containing surface functional groups and restoration of electron conjugation within the graphene nanosheet.39,40 One of the other starting materials used in the synthesis of the nanocomposite, PTCDA (3, 4, 9, 10-perylenete-tracarboxylic dianhydride) shows the maximum absorption peaks at around 570 nm and the observed electronic transition is called the Q-band.41 Here, there is an in-situ conversion of PTCDA to PTCA, which is then incorporated into the nanocomposite. This is evidenced by the appearance of a new peak with absorption maximum around 415 nm. This could be attributed to the π–π* electronic transition of the perylene moiety and the absorption peak of the captopril protected silver nanocluster.26 This suggests the formation of PTCA functionalized silver nanocluster/GNS nanocomposites. Strong greenish fluorescence was observed upon excitation at 350 nm in a neutral aqueous dispersion of the nanocomposite as shown in Fig. 2a. The fluorescence spectra exhibited two peaks one at 480 nm and another at 520 nm corresponding to the 0 → 0 and 0 → 1 electronic transitions of PTCA, respectively.42 The PL quantum yield was calculated using rhodamine 6G (Rh6G) as the standard by following eqn (3).
 | (3) |
![[double bond, length as m-dash]](https://www.rsc.org/images/entities/char_e001.gif) C groups of graphene, PTCA and captopril. Additionally, there are π–π* interactions between the aromatic unit of graphene and perylene. The high intensity of PL is also because of the coupling of silver nanocluster with GNS which improves the radiative recombination rate. A similar mechanism of high intensity of PL has been reported.43 It has been reported earlier that a high PL intensity could be achieved due to the synergistic effect of the constituents of a ternary composite.43 Rigidity of the surface ligands of noble metal nanocluster restricts the rotation of the surface functional groups and is found to play a pivotal role in reducing the non-radiative pathways of relaxation.28 The nanosheet of graphene provides the rigidity of the ligand shell of the nanocluster and prevents the non-radiative pathways. Thus, the reduction of nonradiative relaxation pathways enhances the fluorescence intensity.
C groups of graphene, PTCA and captopril. Additionally, there are π–π* interactions between the aromatic unit of graphene and perylene. The high intensity of PL is also because of the coupling of silver nanocluster with GNS which improves the radiative recombination rate. A similar mechanism of high intensity of PL has been reported.43 It has been reported earlier that a high PL intensity could be achieved due to the synergistic effect of the constituents of a ternary composite.43 Rigidity of the surface ligands of noble metal nanocluster restricts the rotation of the surface functional groups and is found to play a pivotal role in reducing the non-radiative pathways of relaxation.28 The nanosheet of graphene provides the rigidity of the ligand shell of the nanocluster and prevents the non-radiative pathways. Thus, the reduction of nonradiative relaxation pathways enhances the fluorescence intensity.
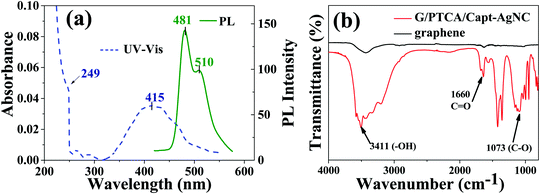 | ||
| Fig. 2 (a) UV-Visible and Photoluminescence spectrum of G/PTCA/Capt-AgNC, and (b) FT-IR spectra of G/PTCA/Capt-AgNC. | ||
The FTIR spectra of graphene and the corresponding nanocomposite are presented in Fig. 2b. The peaks at 1579 cm−1 and 1595 cm−1 are due to the C![[double bond, length as m-dash]](https://www.rsc.org/images/entities/char_e001.gif) C stretching of PTCA, and the peak at ∼1660 cm−1 is due to the C
C stretching of PTCA, and the peak at ∼1660 cm−1 is due to the C![[double bond, length as m-dash]](https://www.rsc.org/images/entities/char_e001.gif) O stretching vibration of the carboxylic group of PTCA.44 The broad peak at ∼3411 cm−1 is assigned to the adsorbed water or other functional groups on the surface of graphene during the exfoliation process. The peaks observed at 1178 and 1073 cm−1 correspond to the stretching frequency of the C–O epoxide group.45 The characteristic peaks of graphene can be found at 1620 cm−1, which correspond to the skeletal stretching of the C
O stretching vibration of the carboxylic group of PTCA.44 The broad peak at ∼3411 cm−1 is assigned to the adsorbed water or other functional groups on the surface of graphene during the exfoliation process. The peaks observed at 1178 and 1073 cm−1 correspond to the stretching frequency of the C–O epoxide group.45 The characteristic peaks of graphene can be found at 1620 cm−1, which correspond to the skeletal stretching of the C![[double bond, length as m-dash]](https://www.rsc.org/images/entities/char_e001.gif) C alkene group with low intensity. This confirms that GNS is decorated with PTCA/Capt-AgNC.
C alkene group with low intensity. This confirms that GNS is decorated with PTCA/Capt-AgNC.
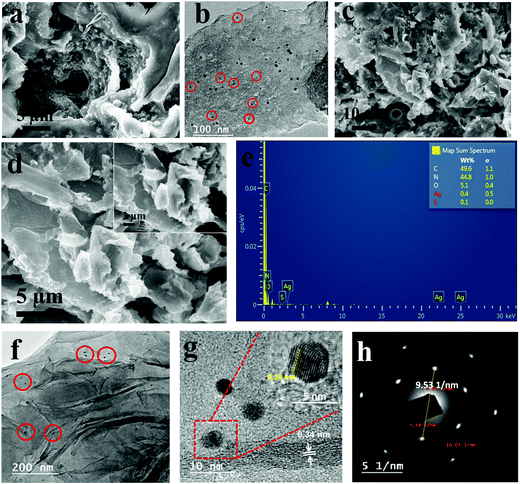
Surface morphology, elemental composition and topographical details of the as-prepared nanocomposites were analyzed using SEM, EDAX and HRTEM micrographs and the results are shown in Fig. 3a–h. The inspection of surface morphology of PTCA/Capt-AgNC in Fig. 3a shows an aggregated and poor π-stacked structural morphology with an irregular shape. Moreover, the TEM image of PTCA/Capt-AgNC shown in Fig. 3b reveals the formation of tiny nanoparticles of PTCA/Capt-AgNCs having a size of ∼2–4 nm (red circles mark the nanoparticles). By incorporating GNS with PTCA/Capt-AgNCs, a corrugated surface was observed in the SEM images (Fig. 3c and d). This indicates that graphene nanosheets are effectively wrapped around PTCA/Capt-AgNCs. The EDAX analysis (Fig. 3e) shows that the composite mainly consists of elements, i.e., C, N, O and Ag; the inset table shows the atomic weight percentage of C, N, O and Ag (49.6%, 44.8%, 5.1%, and 0.5%), respectively. The wrapping structure was further confirmed using TEM, as shown in Fig. 3f and g. The transparent and corrugated GNS were homogenously distributed, and PTCA/Capt-Ag nanoclusters with an ultra-small size of ∼2–4 nm (marked using red circles) were found to be present all over the surface of GNS. The high magnification TEM micrograph (Fig. 3g) indicates that the interlayer spacing of the graphene sheets was found to be ∼0.34 nm, which corresponds to the (002) plane of few layered graphene-like nanosheets.6,46 The lattice plane of silver with a spacing of 0.24 nm could be seen in the inset of Fig. 3g, which corresponds to the (111) fcc plane of the silver nanocluster. The selected area electron diffraction (SAED, Fig. 3h) pattern of G/PTCA/Capt-AgNC shows two diffraction rings with six diffraction spots in each ring, clearly indicating the crystalline structure of PTCA/Capt-AgNC in the presence of the Ag(111) facet and hexagonal graphene-like lattice.
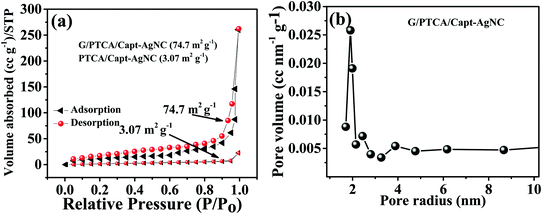
BET surface analysis is a very useful measurement technique for the determination of surface area and porosity of the as-prepared materials. The surface area to volume ratio of the nanomaterial plays a very significant role in determining the properties of the material such as porosity. When the particle size decreases, there is a gain in the surface area to volume ratio. The reactive surface area and pore size distribution of G/PTCA/Capt-AgNC were analyzed by adsorption/desorption under liquid nitrogen at 120 °C using BET measurements. The calculated effective surface area values of the PTCA/Capt-AgNC and G/PTCA/Capt-AgNC nanocomposites are 3.07 m2 g−1 and 74.7 m2 g−1, respectively (Fig. 4a) and active material pore size distribution was calculated from the nitrogen desorption curve to be 1.89 nm (Fig. 4b).
The surface composition and the chemical state of the nanocomposites were investigated by measuring the XPS spectra. The survey XPS spectra of the nanocomposites are shown in Fig. 5 and Fig. S6 (ESI†). The characteristic peaks of C (1s), Ag (3d), N (1s), O (1s) and S (2p) as shown in the survey XPS spectra (Fig. 5a) reveal the presence of all the elements in the nanocomposite. The surface elemental composition of the nanocomposites was also measured from the survey XPS spectra and is summarized in Table 1. Deconvolution of C1s and Ag 3d XPS spectra of G/PTCA/Capt-AgNC is demonstrated in Fig. 5b and c, respectively. As can be seen in Fig. 5b, the deconvoluted C1s XPS band contains four major contributing components with the most intense peak centered at the binding energy of 284.6 eV (sp2 C![[double bond, length as m-dash]](https://www.rsc.org/images/entities/char_e001.gif) C, C–C and C–H bonds). The other deconvoluted peaks with decreasing intensities centered at the binding energies of 285.5 eV (aliphatic C–C, C–O, C–N), 286.5 eV (C–O–C) and 289.1 eV (O
C, C–C and C–H bonds). The other deconvoluted peaks with decreasing intensities centered at the binding energies of 285.5 eV (aliphatic C–C, C–O, C–N), 286.5 eV (C–O–C) and 289.1 eV (O![[double bond, length as m-dash]](https://www.rsc.org/images/entities/char_e001.gif) C–O) are primarily attributed to the oxygenated carbons.2,47,48 The intense peak of sp2 C
C–O) are primarily attributed to the oxygenated carbons.2,47,48 The intense peak of sp2 C![[double bond, length as m-dash]](https://www.rsc.org/images/entities/char_e001.gif) C and lower intensity peaks of oxygen containing carbon bonds indicate the graphitic carbon and oxygenated carbon during the exfoliation process in the as prepared nanocomposite, respectively. Fig. S6b (ESI†) shows the deconvolution of the C1s peak of PTCA/Cap-AgNC and reveals the signature of aliphatic, aromatic C–C and oxygen containing carbons. The high resolution Ag 3d XPS spectrum of the nanocomposite (G/PTCA/Capt-AgNC) shows the presence of a doublet with binding energies of 368.58 eV (3d5/2) and 374.58 eV (3d3/2). The observed characteristics bands of the Ag (3d) core level confirm the incorporation of AgNC in the nanocomposite. However, as shown in Fig. S6c, the doublet bands of Ag (3d) of PTCA/Capt-AgNC were found to appear at lower binding energies of 367.96 eV and 373.96 eV when compared to those of G/PTCA/Capt-AgNC. These positive shifts in the binding energies of spin orbit doublet peaks of G/PTCA/Capt-AgNC could be due to the electron transfer from AgNC to GNS.49,50 Similar shifts in the binding energies of the doublet of Ag (3d) have also been observed previously and our results agree with those reported earlier. Moreover, the splitting due to spin orbit coupling of Ag (3d) is found to be 6 eV, and this also strongly supports the presence of Ag0 in the composite.51
C and lower intensity peaks of oxygen containing carbon bonds indicate the graphitic carbon and oxygenated carbon during the exfoliation process in the as prepared nanocomposite, respectively. Fig. S6b (ESI†) shows the deconvolution of the C1s peak of PTCA/Cap-AgNC and reveals the signature of aliphatic, aromatic C–C and oxygen containing carbons. The high resolution Ag 3d XPS spectrum of the nanocomposite (G/PTCA/Capt-AgNC) shows the presence of a doublet with binding energies of 368.58 eV (3d5/2) and 374.58 eV (3d3/2). The observed characteristics bands of the Ag (3d) core level confirm the incorporation of AgNC in the nanocomposite. However, as shown in Fig. S6c, the doublet bands of Ag (3d) of PTCA/Capt-AgNC were found to appear at lower binding energies of 367.96 eV and 373.96 eV when compared to those of G/PTCA/Capt-AgNC. These positive shifts in the binding energies of spin orbit doublet peaks of G/PTCA/Capt-AgNC could be due to the electron transfer from AgNC to GNS.49,50 Similar shifts in the binding energies of the doublet of Ag (3d) have also been observed previously and our results agree with those reported earlier. Moreover, the splitting due to spin orbit coupling of Ag (3d) is found to be 6 eV, and this also strongly supports the presence of Ag0 in the composite.51
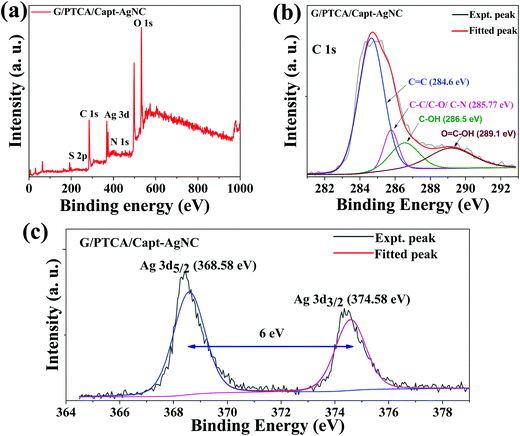 | ||
| Fig. 5 (a) Survey XPS spectra and deconvolution of the XPS peak of (b) C 1s and (c) Ag 3d of G/PTCA/Capt-AgNC. | ||
| Sample | Element Content (at%) | |||
|---|---|---|---|---|
| C | N | O | Ag | |
| PTCA/Capt-AgNC | 47.97 | 1.34 | 46.84 | 1.5 |
| G/PTCA/Capt-AgNC | 50.95 | 0.01 | 46.01 | 1.9 |
3.1 Electrochemical analysis
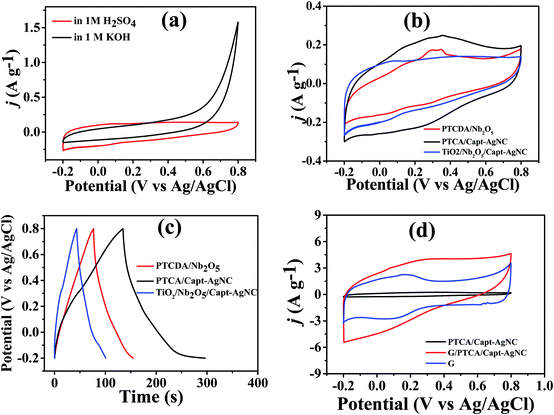
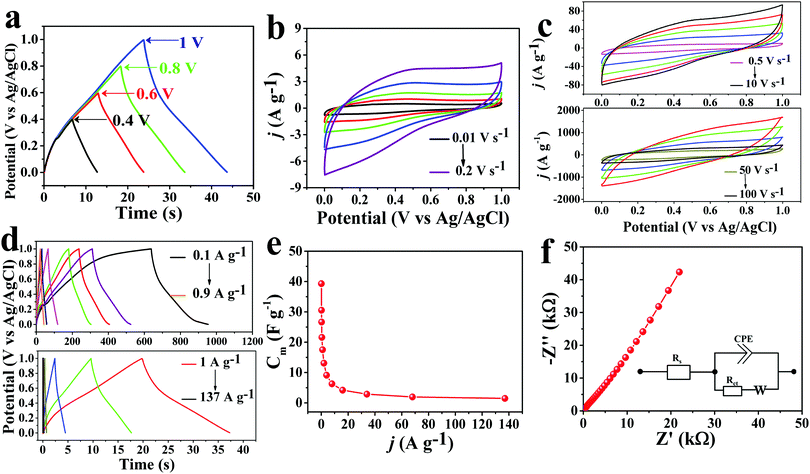
Electrochemical performances were measured to evaluate the potential applications of PTCA/Capt-AgNC and G/PTCA/Capt-AgNC as active electrode materials in both acidic and basic electrolyte medium using a three-electrode setup. The cyclic voltammetry (CV) response of PTCA/Capt-AgNC shows higher capacitance in acidic medium (1 M H2SO4) at a scan rate of 0.1 V s−1 acquiring a voltage window of 1 V as compared to the capacitance value in basic medium shown in Fig. 6a. The CV and Galvanostatic charge–discharge (GCD) response of PTCA/Capt-AgNC gave higher specific capacitance as compared to those of the as-prepared inorganic semiconductor based nanocomposites, such as Nb2O5/PTCDA and TiO2/Nb2O5/Capt-AgNCs in 1 M H2SO4 electrolyte (Fig. 6b and c). The calculated specific capacitance values for the composite materials PTCA/Nb2O5, PTCA/Capt-AgNC, and TiO2/Nb2O5/Capt-AgNC are 0.795 F g−1, 1.622 F g−1 and 0.550 F g−1, respectively (Fig. 6b and c). The increase in the specific capacitance value of PTCA/Capt-AgNC in comparison to other nanocomposites could be attributed to the presence of higher π-conjugated perylene moieties surrounding Ag nanoclusters.52 A high electron density per unit mass can be attained through the effective π-conjugation of condensed aromatic perylene cores which in turn provides a higher capacitance. Furthermore, the capacitive current enhances when PTCA/Capt-AgNC incorporated with GNS maintains the rectangular shaped CV (Fig. 6d). This is mainly due to effective wrapping of GNS around PTCA/Capt-AgNC forming a laminated structure (clearly visible in the SEM image shown in Fig. 3d and TEM images shown in Fig. 3f and g). The highly conductive GNS were distributed all over on the outer surface as well as between the adjacent PTCA/Capt-AgNC blocks to form a three-dimensional conductive network which is more favorable for electron transport than pristine PTCA/Capt-AgNC.53 The specific capacitance (Cm) value of the graphene electrode is 8.71 F g−1, and for G/PTCA/Capt-AgNC with respect to PTCA/Capt-AgNC the gravimetric capacitance increases from 0.822 F g−1 to 14.11 F g−1 at a scan rate of 0.2 V s−1 in aqueous electrolyte. This is due to the increase in the active surface area via incorporating exfoliated graphene sheets to the nanostructure of PTCA/Capt-AgNC, which favours the fast charge storage capacity of the electrode.Furthermore, the potential window of the G/PTCA/Capt-AgNC electrode was optimized in aqueous electrolyte to avoid the interference of the oxygen-evolution reaction as shown in Fig. 7a. A distinctive capacitive behaviour with a quasi-rectangular CV curve was maintained throughout a good range of scan rates from 0.01 V s−1 to 100 V s−1 for the G/PTCA/Capt-AgNC electrode as shown in Fig. 7b and c, indicating the power capability of the electrode material. It is noted that the nearly rectangular patterns were maintained up to a very high scan rate of 100 V s−1, which demonstrates the high rate capability and quick dynamics of fast power delivery of the electrode material.3 This is due to the condensed aromatic rings and effective π-conjugated configurations with highly delocalized sp2-hybridized electrons which possess ultrastability even at a high scan rate. The quasi-isosceles triangular GCD profile (Fig. 7d) at different current densities further validates the perfect supercapacitive behaviour of the nanocomposite materials. The highest specific capacitance (Cm) of the electrode material calculated from the GCD curve is 39.5 F g−1 at a current density of 0.1 A g−1; retaining a typical quasi-triangular shape with a specific capacitance value of 3.616 F g−1 even at an ultrahigh current density of 137 A g−1 it shows appreciable charge–discharge reversibility as represented in Fig. 7e.
Electron impedance spectroscopy (EIS) was studied further at the open circuit potential (OCP) to ensure that the as-prepared GNS incorporated PTCA/Capt-AgNC nanocomposite is suitably equipped to promote fast charge–discharge as well as efficient charge storage.6 As demonstrated in Fig. 7f at the lower frequency region, the imaginary part increases more sharply, indicating the diffusion-limited electron transfer characteristic of the ideal capacitive behaviour of the material. The higher frequency region shows the real axis intercept, which provides negligible equivalent series resistance (ESR, Rs). The Randles equivalent circuit is shown in the inset of Fig. 7f and the corresponding values are listed in Table S1 (see the ESI†), showing a much lower sheet resistance of 5.809 Ω.
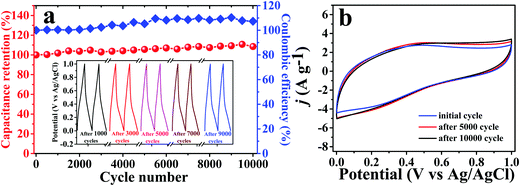
To explore the practical applications of the electrode material, we also checked the cycling stability of the nanocomposite material with continuous charge–discharge cycles at a current density of 0.9 A g−1 (Fig. 8a and b). Fig. 8a displays the cycling stability of the nanocomposite material which shows a 100% capacitance retention of its initial capacitance, showing excellent electrochemical performance and maintaining 107% coulombic efficiency. Inset of Fig. 8a shows the corresponding galvanostatic charge–discharge cycles after 1000, 3000, 5000, 7000 and 9000 cycles which clearly show the stable triangular GCD curve after each and every cycle. The cycling voltammetry curve (Fig. 8b) reveals that the capacitance values increase in the initial few cycles and then, stabilize in another 9000 cycles. It is found that the G/PTCA/Capt-AgNC nanocomposite electrode material is very suitable for use in making a highly durable energy storage device with excellent electrochemical performance.
4. Conclusions
In summary, a nanocomposite, PTCA/Capt-AgNC decorated reduced graphene oxide nanosheet, was prepared using a one-pot facile synthetic methodology. Higher dispersion stability and enhanced PL emission (QY ∼ 0.32) were observed in the aqueous medium. The incorporation of a nanocluster into the graphene nanosheet effectively prevented its self-aggregation. The electrochemical capacitance behaviour of the nanocomposite is strikingly enhanced in comparison to that of the PTCA/capt-AgNC nanocomposite. Excellent charge–discharge reversibility was observed in the G/PTCA/Capt-AgNC nanocomposite. The improved electrochemical behaviour is due to the higher surface area and prevention of the stacking of nanosheets. The results obtained indicated that the material reported here has high potential applications in the fabrication of thin-film flexible electronics and energy storage devices.Conflicts of interest
There are no conflicts to declare.Acknowledgements
T. G. thanks SEED research support and RISE funding from UPES. N. K. acknowledges INST, Mohali for providing PhD fellowship. R. S. D. thanks DST INSPIRE grant (DST/INSPIRE/04/2015/000337) for financial support. A. B. thanks DST-SERB for funding (file no. YSS/2015/001042), and partial funding from BML Munjal University's PDA.References
- X. Lu, M. Yu, G. Wang, Y. Tong and Y. Li, Energy Environ. Sci., 2014, 7, 2160–2181 RSC.
- H. Tien, Y. Huang, S. Yang, J. Wang and C. M. Ma, Carbon, 2010, 49, 1550–1560 CrossRef.
- N. Kamboj, T. Purkait, M. Das, S. Sarkar, K. S. Hazra and R. S. Dey, Energy Environ. Sci., 2019, 12, 2507–2517 RSC.
- S. Ali, J. Bae, C. H. Lee, K. H. Choi and Y. H. Doh, Sens. Actuators, B, 2015, 220, 634–640 CrossRef CAS.
- G. Zhou, Y. E. Miao, Z. Wei, L. L. Mo, F. Lai, Y. Wu, J. Ma and T. Liu, Adv. Funct. Mater., 2018, 28, 1–10 Search PubMed.
- T. Purkait, G. Singh, M. Singh, D. Kumar and R. S. Dey, Sci. Rep., 2017, 7, 1–14 CrossRef CAS.
- M. Zou, Y. Ma, X. Yuan, Y. Hu, J. Liu and Z. Jin, J. Semicond., 2018, 39, 011010 CrossRef.
- T. Huang, D. Lu, L. Ma, X. Xi, R. Liu and D. Wu, Chem. Eng. J., 2018, 349, 66–71 CrossRef CAS.
- T. Purkait, R. Ahammed, A. De Sarkar and R. Sundar Dey, Appl. Surf. Sci., 2020, 509, 145375 CrossRef CAS.
- N. Kamboj, T. Purkait, M. Das, S. Sarkar, K. S. Hazra and R. S. Dey, Energy Environ. Sci., 2019, 12, 2507–2517 RSC.
- Q. Zhao, Y. Lu and J. Chen, Adv. Energy Mater., 2017, 7, 1601792 CrossRef.
- T. Ma, Q. Zhao, J. Wang, Z. Pan and J. Chen, Angew. Chem., Int. Ed., 2016, 55, 6428–6432 CrossRef CAS.
- S. Bahceci and B. Esat, J. Power Sources, 2013, 242, 33–40 CrossRef CAS.
- Q. Zhao, Z. Zhu and J. Chen, Adv. Mater., 2017, 29, 1–25 Search PubMed.
- D. Ugarte, Nature, 1992, 359, 707–709 CrossRef CAS.
- C. Portet, G. Yushin and Y. Gogotsi, Carbon, 2007, 45, 2511–2518 CrossRef CAS.
- X.-Z. Liu, S. Sheng and Y. Shouheng, Nanoscale, 2014, 6, 2037–2045 RSC.
- Y. Liu, H. Wang, J. Zhou, L. Bian, E. Zhu, J. Hai, J. Tang and W. Tang, Electrochim. Acta, 2013, 112, 44–52 CrossRef CAS.
- A. Obaid, E.-S. El-Mossalamy, S. Al-thabaiti, I. El-Hallag, A.-E. Hermas and A. M. Asiri, Int. J. Electrochem. Sci., 2014, 9, 1003–1015 Search PubMed.
- C. C. Hu, K. H. Chang, M. C. Lin and Y. T. Wu, Nano Lett., 2006, 6, 2690–2695 CrossRef CAS.
- A. K. Singh, D. Sarkar, G. G. Khan and K. Mandal, J. Mater. Chem. A, 2013, 1, 12759–12767 RSC.
- C. Xu, X. Wang and J. Zhu, J. Phys. Chem. C, 2008, 112, 19841–19845 CrossRef CAS.
- K. T. Jeng, C. C. Chien, N. Y. Hsu, S. C. Yen, S. Du Chiou, S. H. Lin and W. M. Huang, J. Power Sources, 2006, 160, 97–104 CrossRef CAS.
- Z. Çıplak and N. Yıldız, Fullerenes, Nanotubes, Carbon Nanostruct., 2019, 27, 65–76 CrossRef.
- M. Sarno and M. Casa, J. Phys. Chem. Solids, 2018, 120, 241–249 CrossRef CAS.
- N. Cathcart and V. Kitaev, J. Phys. Chem. C, 2010, 114, 16010–16017 CrossRef CAS.
- A. B. Tapas Goswami and K. M. Reddy, ChemistrySelect, 2019, 4, 6790–6799 CrossRef.
- H. H. Deng, X. Q. Shi, F. F. Wang, H. P. Peng, A. L. Liu, X. H. Xia and W. Chen, Chem. Mater., 2017, 29, 1362–1369 CrossRef CAS.
- G. Mohmad, S. Sarkar, A. Biswas, K. Roy and R. S. Dey, Chem. – Eur. J, 2020, 26, 12664–12673 CrossRef CAS.
- A. Biswas, S. Sarkar, M. Das, N. Kamboj and R. S. Dey, Inorg. Chem., 2020, 59, 16385–16397 CrossRef CAS.
- M. Sun, Y. He, W. Yang and M. Yin, Soft Matter, 2014, 10, 3426–3431 RSC.
- T. Goswami, A. Bheemaraju, A. Kataria, A. Nag, K. Sravani, S. Mishra and A. K. Mishra, Mater. Chem. Phys., 2021, 259, 124086 CrossRef CAS.
- C. Zhang, J. Ren, J. Zhou, M. Cui, N. Li, B. Han and Q. Chen, Analyst, 2018, 143, 3075–3084 RSC.
- H. Zhang, C. Liang, J. Liu, Z. Tian, G. Wang and W. Cai, Langmuir, 2012, 28, 3938–3944 CrossRef CAS.
- A. Dere, Phys. B, 2018, 547, 127–133 CrossRef CAS.
- A. V. Kurdyumov, V. F. Britun, V. B. Zelyavskii, A. I. Danilenko, N. I. Borimchuk, V. V. Yarosh, V. Y. Kulikovskii and A. A. Mikhailik, Powder Metall. Met. Ceram., 2006, 45, 86–92 CrossRef CAS.
- J. Bin, Wu, M. L. Lin, X. Cong, H. N. Liu and P. H. Tan, Chem. Soc. Rev., 2018, 47, 1822–1873 RSC.
- A. Al Nafiey, P. Subramanian, A. Addad, B. Sieber, S. Szunerits and R. Boukherroub, ECS J. Solid State Sci. Technol., 2016, 5, M3060–M3066 CrossRef.
- Z. Çiplak, N. Yildiz and A. Cąlimli, Fullerenes, Nanotubes, Carbon Nanostruct., 2015, 23, 361–370 CrossRef.
- A. Kumar, A. M. Sadanandhan and S. L. Jain, New J. Chem., 2019, 43, 9116–9122 RSC.
- A. A. M. Farag and M. Fadel, Opt. Laser Technol., 2013, 45, 356–363 CrossRef CAS.
- P. S. Hariharan, J. Pitchaimani, V. Madhu and S. P. Anthony, Opt. Mater., 2017, 64, 53–57 CrossRef CAS.
- A. Shokry, M. M. A. Khalil, H. Ibrahim, M. Soliman and S. Ebrahim, Sci. Rep., 2019, 9, 1–12 CrossRef CAS.
- Z. Guo, L. Li, X. Liu, G. Wu, X. Lu and X. Liu, J. Electroanal. Chem., 2017, 803, 150–156 CrossRef CAS.
- T. F. Emiru and D. W. Ayele, Egypt. J. Basic Appl. Sci., 2017, 4, 74–79 Search PubMed.
- W. Du, X. Jiang and L. Zhu, J. Mater. Chem. A, 2013, 1, 10592–10606 RSC.
- T. Jiao, H. Guo, Q. Zhang, Q. Peng, Y. Tang, X. Yan and B. Li, Sci. Rep., 2015, 5, 1–12 Search PubMed.
- K. C. Hsu and D. H. Chen, Nanoscale Res. Lett., 2014, 9, 1–9 CrossRef.
- S. Dutta, C. Ray, S. Sarkar, M. Pradhan, Y. Negishi and T. Pal, ACS Appl. Mater. Interfaces, 2013, 5, 8724–8732 CrossRef CAS.
- A. Dolatkhah, P. Jani and L. D. Wilson, Langmuir, 2018, 34, 10560–10568 CrossRef CAS.
- J. Ma, J. Zhang, Z. Xiong, Y. Yong and X. S. Zhao, J. Mater. Chem., 2011, 21, 3350–3352 RSC.
- M. Ruby Raj, R. V. Mangalaraja, G. Lee, D. Contreras, K. Zaghib and M. V. Reddy, ACS Appl. Energy Mater., 2020, 3, 6511–6524 CrossRef CAS.
- D. Cui, D. Tian, S. Chen and L. Yuan, J. Mater. Chem. A, 2016, 4, 9177–9183 RSC.
Footnotes |
| † Electronic supplementary information (ESI) available. See DOI: 10.1039/d0ma00527d |
| ‡ Authors contributed equally. |
| This journal is © The Royal Society of Chemistry 2021 |


