
 Open Access Article
 This Open Access Article is licensed under a Creative Commons Attribution-Non Commercial 3.0 Unported Licence
Sorting droplets into many outlets†
Saurabh
Vyawahare
 *,
Michael
Brundage
,
Aleksandra
Kijac
,
Michael
Gutierrez
,
Martina
de Geus
,
Supriyo
Sinha‡
and
Andrew
Homyk
*,
Michael
Brundage
,
Aleksandra
Kijac
,
Michael
Gutierrez
,
Martina
de Geus
,
Supriyo
Sinha‡
and
Andrew
Homyk
Verily Life Sciences LLC, 249 E. Grand Avenue, South San Francisco, CA 94080, USA. E-mail: saurabhv@verily.com; Tel: +1 415 736 5695
First published on 7th October 2021
Abstract
Droplet microfluidics is a commercially successful technology, widely used in single cell sequencing and droplet PCR. Combining droplet making with droplet sorting has also been demonstrated, but so far found limited use, partly due to difficulties in scaling manufacture with injection molded plastics. We introduce a droplet sorting system with several new elements, including: 1) an electrode design combining metallic and ionic liquid parts, 2) a modular, multi-sorting fluidic design with features for keeping inter-droplet distances constant, 3) using timing parameters calculated from fluorescence or scatter signal triggers to precisely actuate dozens of sorting electrodes, 4) droplet collection techniques, including ability to collect a single droplet, and 5) a new emulsion breaking method to collect aqueous samples for downstream analysis. We use these technologies to build a fluorescence based cell sorter that can sort with high (>90%) purity. We also show that these microfluidic designs can be translated into injection molded thermoplastic, suitable for industrial production. Finally, we tally the advantages and limitations of these devices.
1 Introduction
Uniformly sized droplets, made with microfluidics, are extensively used in single cell analysis and droplet PCR, with several companies making and selling such systems. In these systems, emulsion droplets are used as isolated, highly parallelized, picoliter-scale reaction vessels.1 Microfluidic droplet making was first introduced in the early 2000s,2,3 droplet sorting in the mid 2000s,4 droplet digital PCR in early 2010s,5 and methods for droplet single cell sequencing in mid 2010s.6,7Microfluidic droplet sorting is possible by many methods, but perhaps most easily accomplished by dielectrophoresis.8 Aqueous drops have a higher dielectric constant compared to the surrounding carrier fluid, and an electric field gradient, applied at the right time, can pull a drop into a side channel. Thus, a drop identified via fluorescence or other means to contain a feature of interest – a cell or molecule – can be pulled out for further analysis.9–11
A process uniquely suited for inexpensive, large volume manufacturing of microfluidic chips and cartridges is injection molding. While droplet making had an easy transition from elastomeric PDMS (polydimethylsiloxane) laboratory demonstrations to commercialized injection molded plastic devices, droplet sorting still presents severe manufacturability challenges owing to the need for thick electrodes, also referred to as 3D electrodes. We describe in this paper a microfluidic design, along with associated systems and methods, to sort droplets into tens of sorting outlets with a new electrode geometry. Previously, devices made using PDMS elastomer with a few sorting junctions have been described.12 We show that our design goes beyond that to tens of junctions, sorts at higher droplet rates, and crucially, is translatable into injection molded COC (cyclic-olefin copolymer) plastic.
2 Design
Our system can be configured as a cell sorting device, consisting of a microfluidic chip; optical apparatus including lasers, filters, detectors; mechanical apparatus consisting of chip manifolds and holders for collection; electronic apparatus including sorting circuits and signal processing circuits.A labelled example of a microfluidic chip design with 4 sort junctions and a fabricated chip example with 17 sort junctions are shown in Fig. 1. We will describe the parts in the sections that follow. Details of the fabrication process are available in S2 (device fabrication).†
 | ||
| Fig. 1 Microfluidic chip design (A) 4 sort junction design with inputs, outputs, and other parts labelled as follows: 1) oil input, 2) aqueous input, 3) droplet making nozzle, 4) optical detection region, 5) sort electrodes and sort output channels (4x), 6) sort outlets (4x), 7) waste outlet, 8) side oil inlet, and 9) divider separating gold-coated and non-coated part of device. (B) A fabricated 4-sort chip with some regions labelled. Drops formed at the nozzle flow down into the optical detection region. Using detected signals, a desired droplet may be sorted downstream into any one of the four sorting junctions the device has. Two devices are on the chip, with the unlabelled device a mirror image of the labelled one. The chip is bonded to a low autofluorescence 75 mm × 25 mm glass slide half-coated with gold, as well as an insulating thin film of PDMS. (C) Stitched mosaic image of a 17-sort device made in PDMS. This device has a high density of features. The port holes have been punched out. (D) A zoomed out picture of the same device as in (C) with some of the tubing attached and a ruler for scale. The PDMS chip is attached to a glass slide coated with indium tin oxide (transparent, conducting ground) and a thin film of PDMS (insulating film). | ||
2.1 Droplet making
The microfluidic design starts with a flow focusing geometry, where an inert fluorinated oil stream and an aqueous stream meet at a nozzle to produce droplets.13 We use three inlets: two for oil, and one for aqueous media. For fluorinated oil, we used HFE-7500 (S1 materials†). Aqueous media was distilled water or a buffer solution. The flow rates are selected to keep flow in the dripping regime, producing uniform size droplets (typically 2–4 μl min−1 for aqueous, and 40–60 μl min−1 for main oil, using syringe pumps). Droplet production rates in our system range from a few hundred to 4 kHz. At higher rates we see droplet shearing and non-uniform droplet size. Droplet diameter varies from 40 to 70 micron, depending on the nozzle geometry and flow rates.14,152.2 Optical detection
The drops flow into a narrowing region where they can be probed by lasers. The overall optical schematic is shown in Fig. 2. The optical detection system consists of a set of lasers, cameras, and fluorescence/scattered light detectors that provide information on what cell type is flowing through, along with information on the droplet position and velocity. Our current configuration consists of four lasers (wavelengths of 405 nm, 488 nm, 532 nm, and 647 nm), two cameras imaging from above and below the chip, and many optical detectors (typically photomultiplier tubes or photodiodes). Each of these is placed behind a chain of optical filters. | ||
| Fig. 2 Optics (A) and (B) top and side view of optical probing region. 4 lasers, each shaped into an asymmetric 10 × 200 micron beam with a Powell lens, are focused in a row at the fluidic channel midplane. The size of the beam along both axes was chosen to produce near-uniform illumination across the channel cross-section. Drops with cells move through the 50 micron × 30 micron channel, and across the laser lines generating fluorescence and scatter signals. (C) The optical apparatus consists of 4 excitation lasers, seven emission detectors, and a forward scatter detector as depicted. The emission channels are time-multiplexed to resolve each of the 4 excitation lasers on the single detector, producing a total of 21 excitation–emission channels. The excitation and emission path are combined using a mirror with a small masked aperture to route the low-numerical aperture excitation beam lines to the sample, while letting the high-numerical aperture fluorescence path pass to the series of PMT (photomultiplier tube) detectors. (D) An example voltage versus time signal from a rainbow bead. This trace was obtained from the forward scatter detector and a single emission detector, showing the four time-separated signals from each excitation laser. The forward scatter signal is dominated by scatter from the droplet itself and is useful in measuring flow rate, droplet size, and droplet frequency. | ||
The channel height is 30 micron, and channel width is 100 micron, narrowing to 50 micron in the optical probing region. The height and width were chosen as a compromise between the fluidics and optics requirements; for optical detection we prefer droplet confinement within the focused laser power region, while for fluidics, channel dimensions smaller than drop diameter can cause droplet shearing and breakup.16
The laser beams are shaped into a rectangular cross sectional shape for uniform illumination, and arranged in a row perpendicular to the channel, separated by approximately 180 micron. The fluorescence signals can be demultiplexed by dividing the time interval into segments that represent the time a drop spends in the vicinity of a laser. The signals can be further corrected to compensate for spillover of dye fluorescence into multiple channels, a procedure known as compensation in flow cytometry. Compared to fluorescence, scatter signals from cells are challenging to measure in our system because they are overwhelmed by the droplet scatter signal (Fig. 2D). However, drop scatter signals are excellent for detecting drops and calculating timing from the laser spot to a sort junction. More details on optoelectronics is available in S3 (optoelectronics and software).†
Cells or beads fill a drop randomly, with the filling distribution approximating Poisson statistics. We use concentrations such that the average filling ratio is less than 1 in 10, reducing doublets that could confound measurements. Since a cell or bead can be located anywhere in the drop, and have a velocity relative to the drop, there is dispersion in the fluorescence signal. We improved the signal to noise quality by using confined channels (Fig. S6†). An alternate approach involves using a two color normalization procedure.10
2.3 Sorting region
After the detection region, the drops flow into a sorting region which consists of many sorting junctions. Each sorting junction contains a sorting electrode, a sort output, and an additional oil input that we refer to as side oil (Fig. 3). The side oil supplies extra oil to compensate for the loss of oil to the sorting channel (each designed to divert 30% of the main flow). Without this addition, drops would get closer to each other in the main channel, eventually colliding with each other, making it impossible to predict the timing parameters needed to sort into the downstream sort junctions. | ||
| Fig. 3 Sorting region (A) (not to scale) diagram of the cross sectional view of a PDMS chip, showing the different layers. (B) A cell being sorted into a sort channel. The ionic liquid electrode is faintly visible. The main channel is 100 micron wide and constricts to 50 micron just before a junction in order to better separate drops. (C) Design of serpentine side oil channels with high fluidic resistance. These side oil channels resupply the oil lost into each sorting junction from the main channel. Also shown are the electrodes. (D) Diagram of the modular sort units, each with a sort channel and an extra oil channel (side oil). N of these units can be combined to make a N-sort device. The last sort junction does not need an extra oil supply as droplet distances do not need to be constant after all sorting is done. | ||
We also include a constriction before each sort junction. This centers the drop, causes the drop to move faster, separates it from the following drop, and makes it easier to sort.
To design the sorting region, we assumed that the fluidic network can be modelled like an electric circuit17 downstream of the nozzle. In other words, we ignored any two phase related complications, and we assumed laminar flow conditions. An additional simplification was made by using high fluidic resistance channels for the side oil. They can then be modelled as an ideal “current” source. These side-oil channels compensate for the loss of oil, while minimizing any perturbation to flow conditions in the main channel. The design is shown in Fig. 3C where the serpentine channels are used to increase the fluidic resistance. Each side oil channel resupplies the oil lost in the preceding sort channel, thus keeping the volumetric flow rate in the main channel constant, which in turn keeps inter-droplet distances constant. Details of the electrical circuit analogy used for design are provided in S4.†
We found that despite not accounting for two phase flows to make precise sort channel fluidic resistances, the differences between experimental flow rates and predicted flow rates was less than 10%. Increasing the sort outlet resistances by as much as 50%, using outlet tubing, still allowed for sorting devices, albeit with different flow rates, suggesting considerable leeway in design parameters for working sorting devices.
2.4 Electrode
Previously, sorting has been done by creating an electrode and ground channel close to the fluidic channel, filling both with low-melt solder, silver paste or salt water.18,19 But the use of low-melt solder/silver paste is inconvenient because of the difficulties in handling the material, while salt water can evaporate leaving behind salt crystals. Instead, our design uses an ionic liquid (1-ethyl-3-methylimidazolium tetrafluoroborate), a type of liquid salt. Ionic liquids are a large class of liquids, and one can select a particular liquid to suit material chemistry and process conditions.20Ionic liquids do not evaporate, and these electrodes can be used for a long time (months in our experience). Liquid flow makes them easy to fill and remove, and gives them self-healing properties. It should be noted that the electrode design will work with low-melt solder, silver paste, gallium, or salt water without much change; however, we find the use of ionic liquid wires to be more convenient.
We made early designs using the two-electrode configurations (ground and active), both filled with ionic liquid. Later designs were further improved by removing the ground channel and using a metallic (gold) film as a common ground plane for all the ionic liquid electrodes. The ionic liquid electrodes were designed to be 30–50 micron away from the sort channel. The metallic ground plane is separated from the liquid electrode by a transparent, insulating film (PDMS or plastic), typically 20–50 micron in thickness.
We did electromagnetic simulations of the electrode force fields (in Comsol). Due to the ground film, the forces are directed in the plane of the chip—sideways towards the electrode (Fig. S7†). This allows us to lower the voltage to sort by over 100 V, compared to the two electrode configuration.
It is also possible to use ITO (indium tin oxide) or silver nanowires in place of gold if transmissivity, instead of reflectivity, is needed (Fig. 1D).
This new type of ionic liquid-metallic electrode enormously simplifies the connections required and makes for compact designs, especially if many sort junctions are needed. The ground film also neutralizes stray charges, and serves as a mirror, allowing observation of drops when illuminated using an infra-red LED (infra-red does not interfere with fluorescence measurements). In our designs, the gold film covers only the electrode region and not the optical detection region, as optical transparency is needed for laser probing. The simplest way to accomplish this was use a half-coated glass slide, with gold covering only the sorting region (Fig. 1).
3 Device operation
3.1 Sort timing
The timing for sorting involves detecting a signal from the drop as it passes through the detection region and predicting the time it takes to arrive at a sorting junction. This detection signal may be in the form of fluorescence or scatter from the drop or its contents. In our devices, the time interval between a drop traversing from the laser spot to a particular sorting junction ranges from a few milliseconds to hundreds of milliseconds, depending on the distance and flow rates.To be able to sort it is essential for the flow of droplets to be uniform with low dispersion in arrival time at a sorting junction. Using videos, we measured the time of arrival of drops at a sorting junction from a fixed starting line in a 9-sort device as shown in Fig. S8A.† The tight distribution of time of arrival (standard deviation < 0.5 ms) at each sort junction implies that droplet arrival time is predictable, constant over time, and the same for every drop due to the laminar nature of flow in microchannels. Once the table of timing information is known, a single trigger measurement made upstream gives us sufficient information to be able to sort that drop into any sort outlet reliably, provided the flow rates are constant and there are no clogs or other changes to channel dimensions.
To pull a chosen drop into a specific sort outlet, we apply a high voltage AC pulse (±500–800 V, 10–15 kHz, 1 ms long) to that sorting electrode, as a drop just enters the sorting junction.
To identify drop contents, we also perform temporal/spatial separation of fluorescence signals as the drops move across laser lines. This way, fluorescence measured in a channel can be attributed to a particular laser. As shown in Fig. S8B,† there is some jitter in the signal, with the signal peak located anywhere within a time window of approximately 100 μs, because the bead or cell may be located anywhere in the drop. But it is possible to cleanly separate out the signals using a time window and attribute them to the correct laser–fluorophore pair.
We found that a drop entering the sort channel can reduce oil flowing through that channel,21 thereby increasing the main channel volumetric rate and flow velocity briefly (up to a maximum of 30%, as this is the flow percentage diverted into the sort channel). In practice, for higher flow rates, large numbers of sort junctions, and sorting of only a small fraction of all drops, this effect did not impede our ability to sort accurately, despite not correcting for any changes in drop velocity.
We also find that the faster the flow, the more predictable the droplet timing, presumably because faster flow implies less time for diffusive dispersion of droplet velocity. However, for any given geometry, there is a speed limit beyond which a drop will shear into smaller droplets. For instance, in our 4-sort device at main oil flow rate of 30 μl min−1, the timing standard deviation is less than 1 ms at all junctions; at 60 μl min−1, the standard deviation is less than 0.5 ms at all junctions. And at main oil flow rates exceeding 250 μl min−1, we start to observe significant droplet shearing and breakup.
3.2 Scaling number of sort junctions
Sort junctions are geometrically the same near the main flow channel and can be stacked consecutively to produce a desired number of sort outlets (Fig. 3). However, each sort channel extending out from that junction needs to have its resistance designed so that the flow patterns are the same near the main flow channel for each junction. Fig. 4 shows the modular nature of the system, with sort outlets ranging from 4 to 17 (also see Videos S1–S4†). We believe that this is the highest number of sorting junctions in an individual emulsion sorting design demonstrated in literature so far. | ||
| Fig. 4 Modular sorting junctions: sorting junctions can be combined to produce a device with desired number of sort outlets. The main channel is 100 micron in width in all cases and constricts to 50 micron before a sorting unit. (A) 4-Sort design with two ionic liquid electrodes (ground and active) for each sort junction. (B) 9-Sort design, each junction having a single active electrode. A gold film serves as common ground for all electrodes. (C) Kymograph showing continuous sorting of two drops each into junction 3 and 15 in a 17-sort device. Drops are flowing at 225 per second. The horizontal dark bands are the sorting junctions. The slanted lines are individual droplets. Where the line abruptly stops, a drop has been sorted. Faster droplet velocity causes the lines to become non-continuous and dotted. The red line across the main channel was used to generate the kymograph. (D) A snapshot of the sorting region from a 17-sort device (also see Video S2†). | ||
Using a line pixel intensity scan, and combining all the lines over a stack of video frames into a single image, we can visualize drops moving in time and space. Due to the refractive index change at the drop-oil boundary, it is easy to identify a drop. If the line scan is chosen along the main flow channel, the drops show up as continuous lines or streaks, terminating if they get sorted. Faster flow or lower camera frame rate results in fuzzier, dotted lines. Fig. 4C demonstrates such a trace, called a kymograph, on a 17-sort junction device. Two drops are being sorted in junction 3, the next two in junction 15, followed by six drops not sorted. This sorting pattern is continuously running (Video S2†). These kymographs were made using FIJI software.22
Using videos, we can calculate the droplet velocities and trace the path of drops (Video S1†). This is shown in Fig. S10A,† where the paths of drops are overlaid on top of each other, with a color map of the velocities. If the sort outlets have fluid resistances as described in section 2.3, the flow pattern in the region where each sort junction joins up the main channel should be alike, as they are in Fig. S10A.†
As demonstrated in Fig. S10B and C† the side oil supply may be arranged to be on the same or opposite side to the sort channels. The opposite side configuration is more compact, and this was used for most of our designs.
The predictability in timing lets us expand the number of sort junctions. As the number of sorting junction rises, the complexity of our devices increases—with linear increases in tubing, ports, electrical connections, and collection apparatus. Higher side oil flow rates (each sort junction diverts part of the flow, needing resupply for compensation) and corresponding higher pressures can cause problems with chip delamination. Larger chips also make fabrication challenging as defects scale with area. To confirm sorting and calculate timing parameters we use a camera with a large field of view, and all the sorting junctions need to fit within its field of view. This determined the limit of 17 sort junctions for our setup. On the other hand, the droplet optical detection part of the device performs independently, with no dependence on the number of sorting junctions downstream, so there is no direct impact on optical detection with more sort outputs. Computation time is also unchanged since the extra timing parameters related to more sort junctions do not add significant overhead compared to calculations for each fluorescence channel. We have also not noticed any obvious changes in sort quality on increasing sort junctions.
3.3 Droplet flow in tubes
If predictable recovery of intact drops was required, we found it essential to use narrow bore tubing (inner diameter between 100 to 150 micron) at the device sorting outlets. In larger bore tubes, drops can get trapped at the side walls in slower moving fluid and won't be swept out. This leads to droplets colliding, and every collision comes with a probability of coalescence; eventually plugs form, moving at unpredictable speeds (Fig. S9A†). With narrow bore tubing, we were able to predictably recover even a single sorted drop, as demonstrated in Fig. S9D and E.† In narrow bore tubing, there is space only for one drop in the lateral direction. Drops are exposed to the fastest flowing oil at the center of the tube, and swept away with that oil flow.The volume of a 50 micron diameter drop is only about 65 picoliter, so precise collection of a small number of drops opens up the possibility of performing picoliter scale combinatorial biochemistry, where drops, each containing cells, beads or chemicals, may be flowed into wells and combined with other drops.23 The presence of inert oil prevents these drops from evaporating rapidly. In air, they would evaporate in a few seconds.
3.4 Emulsion breaking
For many downstream processes, the droplet emulsion needs to be broken, and the aqueous phase collected for subsequent steps. We developed a method using corona discharge to break the emulsion. Alternative ways to break the emulsion involve the use of an anti-static discharge gun.24 Standard chemical methods involving perfluoro-octanol (PFO) may also be used, but the chemical can interfere with downstream processes and be difficult to completely remove from the solution.In the sort collection tube, collected droplets float to the top of the oil. Emulsions collected, for example in a centrifuge tube, were broken by exposing the tube to a corona discharge machine (BD-20AC Laboratory Corona Treater, Electro Technic Inc, Chicago, IL) for a few seconds. Once the emulsion was broken, the aqueous phase could be pipetted out and used in further downstream processes.
The effects of using corona discharge for breaking of the emulsion on cells was measured using the GM12878 cell line. To separate the effects of putting the cells through a microfluidic device and/or sorting from the effects of corona discharge on cells, AF647 labeled GM12878 cells and unlabeled GM12878 cells were used to make an emulsion by shaking the cell–oil mixture. The emulsion was left on ice for 30–45 min. Subsequently corona discharge was used to break the emulsion and the aqueous phase was extracted along with the cells. We measured cell viability using Trypan blue on the Countess (Thermo Fisher, Waltham, MA) as well as using Nucleocounter (Chemometec, Denmark), following the manufacturer's instructions. There was not a significant difference in viability between the control GM12878 cell sample and the cells that were recovered from the emulsions using the corona discharge treatment (Table 1). The cell samples were also analyzed using flow cytometry on the Attune Acoustic Focusing Flow Cytometer (Life Technologies, Thermo Fisher Scientific), and no changes in scatter or fluorescence were observed between the corona discharge treated and untreated cells (data not shown).
| Type | Viability |
|---|---|
| Untreated (trypan blue) | 91% |
| Treated (trypan blue) | 88% |
| Untreated (Nucleocounter) | 93.1% |
| Treated (Nucleocounter) | 93.7% |
4 Sorting beads and cells
To test system performance, we used 2-sort, 4-sort, and 9-sort devices to sort calibration beads and labelled cells (Video S4†). Sorted drops flow to the sorted outlet port, and then via microbore tubing (125 micron ID PEEK tubing) into a sort collection tube. Fig. S12† shows examples of fluorescent beads sorted, collected, and observed under a microscope.Use of narrow bore tubing from the syringe to the aqueous inlet was found to be essential to sweep cells or beads into the chip. In this regard, we also found it useful to use small magnetic stir bars to gently agitate the syringe contents, reducing sedimentation. Cells were also cooled in the syringe using a home-built syringe cooling sleeve contraption.
For small droplet numbers and quick testing, a filling chamber like a haemocytometer may be used to collect the flow from an outlet tubing to observe under a microscope (Fig. S12A†).
Purity measurements on sorted drops were made by either manual counting in a haemocytometer under a microscope or breaking the emulsion, pipetting the aqueous fraction, and running the aqueous portion on a flow cytometer.
Fig. 5A shows an experiment where red and green labelled cells were sorted in a 2-sort device. We used GM12878 cells and CD45 antibodies labelled with AF488 or PE-Cy5. The labelled cells were mixed in approximately 1![[thin space (1/6-em)]](https://www.rsc.org/images/entities/char_2009.gif) :1 ratio, with each type filling about 2% of the drops. Using fluorescence signals from the two channels, we drew gates, and sorted each type into a separate sort output. These sorted cell-laden droplets were collected, the emulsion broken using corona discharge, and aqueous phase reflown in a flow cytometer along with controls. From Fig. 5A we see that the final measured purity was about 89% for cells labelled with AF-488 and 95% for cells labelled with Pe-Cy5 in this experiment.
:1 ratio, with each type filling about 2% of the drops. Using fluorescence signals from the two channels, we drew gates, and sorted each type into a separate sort output. These sorted cell-laden droplets were collected, the emulsion broken using corona discharge, and aqueous phase reflown in a flow cytometer along with controls. From Fig. 5A we see that the final measured purity was about 89% for cells labelled with AF-488 and 95% for cells labelled with Pe-Cy5 in this experiment.
 | ||
| Fig. 5 Sorting beads and cells (A) AF488 and Pe-Cy5 labelled cells were mixed in approximate 1:1 ratio and then sorted in a 2-sort device. We collected drops from each sort outlet, broke the emulsion, collected the aqueous phase, and ran it on a different flow cytometer (Attune) to quantify purity. Roughly 89% and 95% purity was obtained respectively for each sort outlet. (B) Dim and bright green and red fluorescent beads were sorted on a 4-sort device, droplets collected, and their fluorescence intensity estimated from microscope images to create a frequency histogram. Each peak is from a different sort output. The ability to sort red/green is tabulated in the inset tables and shows high spectral discrimination. Intensities measured from images are broader than the intrinsic bead fluorescence, due to the difficulty in measuring fluorescence intensities from a microscope image. | ||
Fig. 5B shows an experiment using a 4-sort device, where drops filled with red and green beads of two different intensities (Bangslab Alexa 488 and Alexa 647 MESF 3 and 4), labeled dim and bright, respectively, in the figure, were sorted into each of the 4 outlets. Each bead type was present at a drop filling ratio of approximately 2%. The sorted drops with beads were collected from the outlet sort tubes into a haemocytometer, and the fluorescence evaluated by processing the images (Fig. S11†). We see the ability to separate out the dimer and brighter fluorescence in both the colors. The inset tables count the color missorts (green for red or vice versa) corresponding to each sort outlet. The sorting ability for different spectra (i.e. red/green) is better than sorting ability of different intensities of the same spectra. Overall, due to the sharp and bright fluorescence from beads, our optical detection has little difficulty in detecting the beads.
Another bead sort experiment with rainbow beads (Spherotech Ultra-rainbow, 5 fluorescence levels) was performed on a 9-sort device, with 5 of the outputs being used. The sort purity is shown in Table 2 (as measured using a separate flow cytometer). In this experiment, sorting was done based on maximum fluorescence intensity from the drop. Each rainbow bead level filled about about 2% to 3% of the drops.
| Type | Sort output 1 (%) | Sort output 2 (%) | Sort output 3 (%) | Sort output 4 (%) | Sort output 5 (%) |
|---|---|---|---|---|---|
| Level 5 | 91.4 | 0.9 | 0.2 | 0.0 | 0.0 |
| Level 4 | 2.2 | 91.3 | 0.3 | 0.0 | 0.0 |
| Level 3 | 2.4 | 2.9 | 95.0 | 1.1 | 0.1 |
| Level 2 | 2.1 | 2.7 | 2.2 | 96.0 | 1.7 |
| Level 1 | 1.9 | 2.2 | 2.3 | 2.9 | 98.1 |
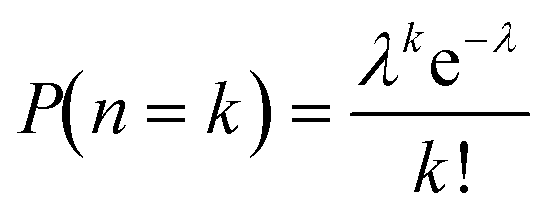
When the filling fraction is small, the distribution of beads in droplets is known to approximate a Poisson distribution.25 If n is the random variable representing the (discrete) number of beads in a drop, then the probability of n = k beads in a drop is given by:
 | (1) |
Since we sorted using the maximum sorting intensity, any drop containing two beads of different intensities will be sorted into the channel for the higher intensity bead, e.g. a drop containing level 5 and level 3 beads will be sorted into the sort channel for level 5 (5 having higher fluorescence), carrying the level 3 bead as a contaminant. For these level 5 sorted drops, the contamination from level 3 will be PLevel 3(n = 1) which is approximately the filling percentage for level 3. Hence, level 5 sort outlet will contain about 2–3% contamination each from level 4, level 3, level 2 and level 1 beads. On the other hand, the sort outlet for level 3 should not contain any doublet contamination from level 5 and level 4 beads, but will have contamination from level 2 and level 1. This is in line with the numbers seen in Table 2; the sort purity increases as the beads get dimmer because there is less contamination from beads of higher fluorescence. The remaining impurities are mostly a result of the limits of optical detection and flow cytometer carryover.
More generally, the sorting purity in our system depends on two things: 1) sorting accuracy of the electrodes, and 2) optical detection. The first, electrode sorting accuracy, for our operating conditions, once we have a clear detection, can be on par or exceed that of high speed flow sorters because in our sorter, the fluids are moving at an order of magnitude slower velocity (∼0.1 m s−1), and we have the ability to sort individual drops precisely.
However, when we are distinguishing entities with varying fluorescence intensities in the same channel, optical detection limits us due to the signal to noise ratio and doublets. Signal to noise is a function of background noise, quality of optics/electronics and the level of signal dispersion caused by varying bead location and velocity inside a drop. Doublets cause the mis-sorts as described previously, but can also cause obscuration, where one bead obscures another, preventing detection. These effects contribute to reduction of final sort purity. Operationally, for high purity it is also necessary to have correct timing parameters and watch for any changes in flows due to clogs.
Despite these limitations, we were able to achieve sorting at purity that exceeded 90% in most of our experiments, with the highest purity exceeding 99.5% when sorting entities with fluorescence in different channels. Besides sorting for purity, it is also possible to enrich a rare population, setting parameters such that borderline cases may still be sorted. In this case, we favor yield over purity.
5 Plastic devices
While PDMS is an extraordinary material for rapid prototyping and testing in a laboratory, it has shortcomings as a material for large scale industrial manufacture.26 Instead, injection molded plastic is the material/method of choice for inexpensive, large-volume manufacturing.We translated the design into injection molded COC plastic with a few minor changes.27–29Fig. 6A–C and S3† are images of plastic devices, and Fig. 6D shows the cross-sectional schematic diagram. Due to the resolution limitations of injection molding, features need to be more spread apart and sharp inner corners rounded. High precision machining is needed to make the masters molds. The dimensions of the channels are otherwise comparable to the PDMS devices. The fluidic lines go to the edge of the chip where port holes allow connections to tubing.
 | ||
| Fig. 6 The 4-sort design was translated into injection molded COC plastic. The plastic design is almost the same as in PDMS, except that the channels are more separated from each other and have rounded corners. (A) Gold coated COC chip. The gold film serves as the ground plane for the electrodes. (B) Front and back of the final device (75 × 25 mm). The gold film and the gold traces are visible. The thin membrane cover boundaries can also be observed. (C) A still from a video frame with the background subtracted out to show droplet sorting (Video S5†). Drops can be seen sorted into sort outputs 1, 2 and 3 (the roughness is due to limitations of precision machining needed to make injection molds). (D) Instead of a glass slide, we bond a thin COC membrane to make the cover as shown in the schematic image (not to scale). Gold is coated on both sides. The electrode channels are filled with ionic liquid which makes electrical contact with the gold traces. (E) Kymograph of sorting in a plastic COC device in a 1x2x3x4x pattern where x = no sort, and 1, 2, 3, and 4 are sort channels. Drops were flowing at approximately 700 per second. | ||
We built a device with 4 sort junctions. Instead of a glass slide cover, a thin film of COC served as the channel top cover. The thinner this layer, the lower the actuation voltage required for sorting. Our devices used films between 25 to 50 micron in thickness. Details of the fabrication process are available in S2.2 (device fabrication).† Compared to other thermoset plastics, COC is ideal for our application due to its optical transparency, low autofluorescence, and chemical inertness.
To make electrodes, we deposited a gold film on top of the membrane covering half the chip (the area containing the electrodes) to serve as the ground plane. On the other side of the chip, we created gold traces that lead from the ionic electrode port to the edge of the chip where we could connect to them electrically (Fig. 6D). The gold coats the inner walls of the ports allowing an electrical connection to the ionic liquid. A manifold with O-rings was used to interface with the chip and external tubing.
We were able to successfully sort using AC voltage pulses similar to those used in PDMS devices, with peak voltage between ±500–700 V (Video S5†). Fig. 6C and E demonstrate examples of droplet sorting. The same kind of droplet timing used with PDMS devices is directly applicable here. Fig. S12B† is a picture of droplets with beads that were sorted in a plastic device.
Plastic devices provide a scalable route to industrial manufacture. After the injection molding masters have been made, large numbers can be molded at low cost per device. With injection molding, standardization and reproducibility is more easily achieved. Hence, conversion to plastic is an important step in moving a technology from a niche demonstration to more widespread use.
6 Discussion
In the last decade, a whole suite of tools for manipulating droplets upstream and downstream of sorting has been developed.30 Microfluidic FACS (fluorescence activated cell sorting) systems31 that do use emulsion droplets,32 as well as those that do not use emulsion droplets33,34 have been attempted. While the first FACS system used a microfluidic device,35 most current FACS systems use sheath flow to position cells in a small detection cross section followed by aerosol generation at a nozzle. These aerosol drops are charged and sorted by deflection plates held at a voltage.Compared to emulsions, aerosol generating systems can run samples at much higher droplet rates (60k per second or more), obtain sharper fluorescence signals by locating cells in a narrower probe region (typically 5–10 micron), and have a mature support and service infrastructure, honed over the decades this technology has been in use. These FACS systems are also larger in size and cost, have less predictability in sorting (due to detection of cells before droplet formation), are limited to 2–6 sorting outlets (due to the high speed flow and limitations imposed by plate deflectors and multichannel optical detection), and pose safety risks of biohazard aerosolization.
Both systems face difficulties in dealing with clogs and shear stresses on cells. Microfluidic droplet systems have an advantage if isolation of cells or molecules is required. Compared to droplets in air, emulsion drops evaporate much slower due to the surrounding oil, despite being only tens of picoliters in volume, making them suitable for viable single cell applications. Their low volume also ensures high reactant concentrations that improves yields, and their separation isolates reaction products, avoiding dilution.
We chose a linear system with one main flow channel and sorting channels branching off in order to simplify the geometry and optical measurements, but binary systems where the main channel itself branches off into two channels, four channels, eight channels, and so on are also possible, though they would require 3D geometries to implement a similar oil resupply strategy. It is also possible to design on-chip drop collection traps,36 provided only a fixed number of drops trapped is acceptable in the experiment.
There are three bottlenecks that pose a limit on throughput in our current system: droplet generation, droplet detection, and droplet sorting—each of which happens in sequence on individual drops, and are tightly coupled. When signals are measured in all fluorescence channels, droplet optical detection is in fact the rate limiting bottleneck in our current setup, limiting us to 1 kHz throughput (it is possible to use faster electronics at greater cost). Other work has shown ways to overcome the individual bottlenecks: using alternate geometries to do droplet sorting at 30 kHz,37 using parallel circuits for droplet generation,38,39 and parallel droplet detection.40 While droplet generation can be relatively easily decoupled in our system, combining the other types of parallel detection or sorting schemes in conjunction with our system is challenging for two reasons—first, the coupling between detection and sorting, where the identity and location of every drop needs to be precisely known from detection to sorting, and second, replicating the 4 laser, 20+ channel detection at multiple locations on a chip.
Besides cell sorting, our system can be alternatively configured for high throughput screening (for antibodies, enzymes, molecules, or cells) instead, where one or more sorting junctions is used in conjunction with moving well plates to deposit individual drops into a well for further processing. This is possible due to the predictability of droplet flow through narrow bore tubing after sorting. In this case, costs can also be reduced with simpler detection systems, as finely resolved, high dimensional fluorescence data is typically not needed for most screening, and image processing in conjunction with a simpler single channel fluorescence detection is suitable. Further, COC plastic is replaceable with other thermoplastics, if high optical transparency or autofluorescence is not a concern.
7 Conclusions
We have designed, made, and tested a new droplet sorting microfluidic system. The two new parts introduced are an electrode combining ionic liquid with metallic films and resupply lines to keep inter-droplet spacing constant. We were able to stack sorting junctions and make individual designs with more than a dozen sorting junctions. Sorting with this device allows precise collection of aqueous droplets that may be only a few picoliters in volume. We also invented an emulsion breaking method involving corona discharge that is scalable and easy to use. Putting it all together, the system was used to sort cells and beads with high purity. These chip designs were translated into injection molded plastic devices that are inexpensive to manufacture and offer standardization and reproducibility advantages over “artisanal” elastomeric devices made at a research lab.Our droplet sorting technology is compatible with currently used droplet-based single cell sequencing and droplet digital PCR applications. Oil–water droplet systems, while lower in throughput than air–water systems, have an advantage when biochemical processes need to be isolated from each other, for example in antibody generation, enzymatic screening, cell lysis, cell–cell, or cell–bead interactions. Future directions of our work may involve porting this technology to such applications, parallelizing the designs, and combining with upstream and downstream droplet processing modules that add functionality to the system.
Conflicts of interest
The authors are employees of Verily Life Sciences LLC (a subsidiary of Alphabet Inc.), that has a commercial interest in this technology, and has filed for multiple patents based on this paper's contents.Acknowledgements
We wish to acknowledge Holger Becker and Christian Bose of microfluidic ChipShop for plastic device making help; Trey Shoop of Polyplastics Inc. for material selection advice. From Verily: Matias Heinrich, Robbin Sneeden, Adam Walker, Dan Barrows for help with machining/injection molding; Chris Baker, Robin Simmons and John Balibalos for cytometry assistance; Alisha Knudson, Michael Hopkins for cell culture; Ninfa Sandoval, Junjia Ding, Kye Lee, Jeff Clarkson, Son Ly, Chopin Hua for microfabrication help; Xiaomi Du, Biyu Li, Licheng Xian, and Pouya Kheradpour for downstream processing and analysis; Mathew Mammen and Srinivas Hanasoge for help with plastic devices; Charlie Kim and Jess Mega for advise.Notes and references
- M. T. Guo, A. Rotem, J. A. Heyman and D. A. Weitz, Lab Chip, 2012, 12, 2146–2155 RSC.
- P. Umbanhowar, V. Prasad and D. A. Weitz, Langmuir, 2000, 16, 347–351 CrossRef CAS.
- T. Thorsen, R. W. Roberts, F. H. Arnold and S. R. Quake, Phys. Rev. Lett., 2001, 86, 4163 CrossRef CAS PubMed.
- D. R. Link, E. Grasland-Mongrain, A. Duri, F. Sarrazin, Z. Cheng, G. Cristobal, M. Marquez and D. A. Weitz, Angew. Chem., Int. Ed., 2006, 45, 2556–2560 CrossRef CAS PubMed.
- B. J. Hindson, K. D. Ness, D. A. Masquelier, P. Belgrader, N. J. Heredia, A. J. Makarewicz, I. J. Bright, M. Y. Lucero, A. L. Hiddessen, T. C. Legler, T. K. Kitano, M. R. Hodel, J. F. Petersen, P. W. Wyatt, E. R. Steenblock, P. H. Shah, L. J. Bousse, C. B. Troup, J. C. Mellen, D. K. Wittmann, N. G. Erndt, T. H. Cauley, R. T. Koehler, A. P. So, S. Dube, K. A. Rose, L. Montesclaros, S. Wang, D. P. Stumbo, S. P. Hodges, S. Romine, F. P. Milanovich, H. E. White, J. F. Regan, G. A. Karlin-Neumann, C. M. Hindson, S. Saxonov and B. W. Colston, Anal. Chem., 2011, 83, 8604–8610 CrossRef CAS PubMed.
- E. Z. Macosko, A. Basu, R. Satija, J. Nemesh, K. Shekhar, M. Goldman, I. Tirosh, A. R. Bialas, N. Kamitaki, E. M. Martersteck, J. J. Trombetta, D. A. Weitz, J. R. Sanes, A. K. Shalek, A. Regev and S. A. McCarroll, Cell, 2015, 161, 1202–1214 CrossRef CAS PubMed.
- A. M. Klein, L. Mazutis, I. Akartuna, N. Tallapragada, A. Veres, V. Li, L. Peshkin, D. A. Weitz and M. W. Kirschner, Cell, 2015, 161, 1187–1201 CrossRef CAS.
- H.-D. Xi, H. Zheng, W. Guo, A. M. Gañán-Calvo, Y. Ai, C.-W. Tsao, J. Zhou, W. Li, Y. Huang, N.-T. Nguyen and S. H. Tan, Lab Chip, 2017, 17, 751–771 RSC.
- L. Mazutis, J. Gilbert, W. L. Ung, D. A. Weitz, A. D. Griffiths and J. A. Heyman, Nat. Protoc., 2013, 8, 870–891 CrossRef CAS PubMed.
- N. Shembekar, H. Hu, D. Eustace and C. A. Merten, Cell Rep., 2018, 22, 2206–2215 CrossRef CAS PubMed.
- J. J. Agresti, E. Antipov, A. R. Abate, K. Ahn, A. C. Rowat, J.-C. Baret, M. Marquez, A. M. Klibanov, A. D. Griffiths and D. A. Weitz, Proc. Natl. Acad. Sci. U. S. A., 2010, 107, 4004–4009 CrossRef CAS PubMed.
- D. Frenzel and C. A. Merten, Lab Chip, 2017, 17, 1024–1030 RSC.
- G. F. Christopher and S. L. Anna, J. Phys. D: Appl. Phys., 2007, 40, R319 CrossRef CAS.
- T. Ward, M. Faivre, M. Abkarian and H. A. Stone, Electrophoresis, 2005, 26, 3716–3724 CrossRef CAS PubMed.
- S. Lignel, A.-V. Salsac, A. Drelich, E. Leclerc and I. Pezron, Colloids Surf., A, 2017, 531, 164–172 CrossRef CAS.
- M. K. Mulligan and J. P. Rothstein, Phys. Fluids, 2011, 23, 022004 CrossRef.
- K. W. Oh, K. Lee, B. Ahn and E. P. Furlani, Lab Chip, 2012, 12, 515–545 RSC.
- A. Sciambi and A. R. Abate, Lab Chip, 2014, 14, 2605–2609 RSC.
- L. Rao, B. Cai, X.-L. Yu, S.-S. Guo, W. Liu and X.-Z. Zhao, AIP Adv., 2015, 5, 057134 CrossRef.
- M. Freemantle, An introduction to ionic liquids, Royal Society of chemistry, 2010 Search PubMed.
- C. N. Baroud, F. Gallaire and R. Dangla, Lab Chip, 2010, 10, 2032–2045 RSC.
- J. Schindelin, I. Arganda-Carreras, E. Frise, V. Kaynig, M. Longair, T. Pietzsch, S. Preibisch, C. Rueden, S. Saalfeld and B. Schmid, et al. , Nat. Methods, 2012, 9, 676–682 CrossRef CAS PubMed.
- Y. Bai, E. Weibull, H. N. Joensson and H. Andersson-Svahn, Sens. Actuators, B, 2014, 194, 249–254 CrossRef CAS.
- M. Karbaschi, P. Shahi and A. R. Abate, Biomicrofluidics, 2017, 11, 044107 CrossRef PubMed.
- D. J. Collins, A. Neild, A. DeMello, A.-Q. Liu and Y. Ai, Lab Chip, 2015, 15, 3439–3459 RSC.
- R. Mukhopadhyay, Anal. Chem., 2007, 79, 3248–3253 CrossRef CAS PubMed.
- P. S. Nunes, P. D. Ohlsson, O. Ordeig and J. P. Kutter, Microfluid. Nanofluid., 2010, 9, 145–161 CrossRef CAS.
- F. Bundgaard, G. Perozziello and O. Geschke, Proc. Inst. Mech. Eng., Part C, 2006, 220, 1625–1632 CrossRef.
- F. Bundgaard, PhD thesis, Technical University of Denmark, 2006 Search PubMed.
- A. Suea-Ngam, P. D. Howes, M. Srisa-Art and A. J. deMello, Chem. Commun., 2019, 55, 9895–9903 RSC.
- M. E. Piyasena and S. W. Graves, Lab Chip, 2014, 14, 1044–1059 RSC.
- M. Sesen and G. Whyte, Sci. Rep., 2020, 10, 8736 CrossRef CAS PubMed.
- R. H. Pritchard, A. A. Zhukov, J. N. Fullerton, A. J. Want, F. Hussain, M. F. la Cour, M. E. Bashtanov, R. D. Gold, A. Hailes, E. Banham-Hall and S. S. Rogers, Lab Chip, 2019, 19, 2456–2465 RSC.
- A. Y. Fu, H.-P. Chou, C. Spence, F. H. Arnold and S. R. Quake, Anal. Chem., 2002, 74, 2451–2457 CrossRef CAS PubMed.
- H. R. Hulett, W. A. Bonner, J. Barrett and L. A. Herzenberg, Science, 1969, 166, 747–749 CrossRef CAS PubMed.
- A. Huebner, D. Bratton, G. Whyte, M. Yang, A. J. Demello, C. Abell and F. Hollfelder, Lab Chip, 2009, 9, 692–698 RSC.
- A. Sciambi and A. R. Abate, Lab Chip, 2015, 15, 47–51 RSC.
- D. M. Headen, J. R. García and A. J. García, Microsyst. Nanoeng., 2018, 4, 1–9 CrossRef PubMed.
- N. Tottori and T. Nisisako, Sens. Actuators, B, 2018, 260, 918–926 CrossRef CAS.
- V. Yelleswarapu, J. R. Buser, M. Haber, J. Baron, E. Inapuri and D. Issadore, Proc. Natl. Acad. Sci. U. S. A., 2019, 116, 4489–4495 CrossRef CAS PubMed.
Footnotes |
| † Electronic supplementary information (ESI) available: Materials; device fabrication; optoelectronics and software; electrical circuit analogy; additional images and 5 movie files. See DOI: 10.1039/d1lc00493j |
| ‡ Present address: Twenty/Twenty Therapeutics, 259 East Grand Avenue South San Francisco, CA 94080, USA. |
| This journal is © The Royal Society of Chemistry 2021 |