
 Open Access Article
 This Open Access Article is licensed under a Creative Commons Attribution-Non Commercial 3.0 Unported Licence
Microfluidic mass transfer of CO2 at elevated pressures: implications for carbon storage in deep saline aquifers†
Tsai-Hsing Martin
Ho
,
Junyi
Yang
and
Peichun Amy
Tsai
 *
*
Department of Mechanical Engineering, University of Alberta, Edmonton, Alberta, T6G 1H9 Canada. E-mail: peichun.amy.tsai@ualberta.ca
First published on 31st August 2021
Abstract
Carbon capture and sequestration (CCS) in a deep saline aquifer is one of the most promising technologies to mitigate anthropologically emitted carbon dioxide. Accurately quantifying the mass transport of CO2 at pore-scales is crucial but challenging for successful CCS deployment. Here, we conduct high-pressure microfluidic experiments, mimicking reservoir conditions up to 9.5 MPa and 35 °C, to elucidate the microfluidic mass transfer process of CO2 at three different states (i.e., gas, liquid, and supercritical phase) into water. We measure the size change of CO2 micro-bubbles/droplets generated using a microfluidic T-junction to estimate the volumetric mass transfer coefficient (kLa), quantifying the rate change of CO2 concentration under the driving force of concentration gradient. The results show that bubbles/droplets under high-pressure conditions reach a steady state faster than low pressure. The measured volumetric mass transfer coefficient increases with the Reynolds number (based on the liquid slug) and is nearly independent of the injection pressure for both the gas and liquid phases. In addition, kLa significantly enlarges with increasing high pressure at the supercritical state. Compared with various chemical engineering applications using millimeter-sized capillaries (with typical kLa measured ranging from ≈0.005 to 0.8 s−1), the microfluidic results show a significant increase in the volumetric mass transfer of CO2 into water by two to three orders of magnitude, O (102–103), with decreasing hydrodynamic diameter (of ≈50 μm).
1 Introduction
The technology of CCS in saline aquifers is one of the most promising options to store a large volume of anthropologic CO2 captured from major emission sites due to the abundant storage capacity (estimated to be greater than 103 Gt).1,2 Understanding the dissolution and mass transfer of CO2 in the pore fluid (water or brine) is critical because these processes affect the storage capacity of the early trapping mechanisms (i.e., structural and residual trapping) as well as the long term solubility trapping and mineralization with the host rock.3,4 In addition, CO2 is a sustainable “green” solvent widely utilized in cleaning, drying, and extraction, particularly the supercritical state due to its low viscosity and surface tension with a high diffusivity.5Conventional methods of measuring CO2 dissolution rates and mass transfer include bubble column reactors6,7 and stirred vessels.8 A bubble column consists of a cylindrical vessel with a gas distributor at the bottom. The gas is sparged in the form of bubbles into a liquid phase or a liquid–solid slurry.9,10 Stirred vessels usually have similar configurations to bubble columns, but they are equipped with an additional stirrer and motor to enhance the mixing and increase the interfacial area.11 However, the drawbacks of these methods include considerable back mixing in the collecting tank, bubble coalescence, and requirement of relatively large operation space and fluid volume6,8 and, hence, motivate efficient alternative approaches.
Microfluidics has offered emerging and promising platforms for a variety of energy and environmental technologies.12–16 To name a few, microfluidics has been beneficially utilized for visualizing the multiphase flow patterns of viscous fingering during the gas–liquid and liquid–liquid displacement in a porous medium16–18 as well as measuring the mass transfer rates of CO2 (ref. 19–22) and ozone,23 gas diffusivity in different solvents,24 and CO2 solubility (under the temperature effect,25 under surfactant influence,26 and in different solvents22,24).
Very recently, high-pressure microfluidic platforms have been developed to investigate the behaviors of CO2 with a background fluid at high pressure and temperature to simulate the conditions of deep saline formations, which typically have the pressure (P) range of 6 MPa < P < 27 MPa and the temperature (T) range of 26 °C < T < 110 °C.27 For example, the investigations using high-pressure microfluidics have focused on the flow patterns of CO2 displacing fluid,28,29 the applications of CO2 in oil recovery processes,30,31 physical properties (e.g., density and viscosity) at the supercritical state,32 fast screening of the CO2 phase state in different solvents,33,34 and solubility of CO2 in brine.35
Nevertheless, microfluidic experimental studies regarding the CO2 transport rate in water or brine under P–T conditions close to or under reservoir conditions are relatively limited.36–39 Sell et al. applied a sodium fluorescein tracer to measure the diffusivity of CO2 in brine (up to 5 M) at a pressure ranging from 0.1 to 5 MPa using a PMMA microfluidic cell. They reported that the salinity had a significant impact on the CO2 diffusivity, while the system pressure seemed to have a minor effect on the measured diffusion coefficient.36 Yao et al.37 performed microfluidic T-junction experiments and found a gradual increase in the mass transfer coefficient, kL (from 1.8 × 10⁻⁴ to 5.3 × 10⁻⁴ m s−1), of CO2 bubbles in water with rising pressure (from P = 0.1 to P = 3 MPa). In 2017, Yao et al. investigated the influence of elevated pressure on CO2 absorption in water and a chemical solvent DEA (diethanolamine) by adjusting P ranging from 0.1 to 4 MPa. They reported a decrease in kLa with rising pressure in both physical and chemical absorption processes due to the shrinkage of the interfacial area at high pressure.38 Qin et al. experimentally estimated the mass transfer coefficient kL to be 1.5 × 10⁻⁴ < kL < 7.5 × 10⁻⁴ m s−1 for supercritical CO2 in water (at P = 8 MPa and T = 313 K), based on the three-dimensional morphology of a shrinking Taylor bubble in a rectangular channel.40 Additionally, the results showed that a higher water volume fraction results in a larger kL, and a faster-moving droplet generally has a higher kL.39
In this study, we experimentally investigated the influence of different thermodynamic states on the microfluidic CO2 mass transfer, which is not fully addressed in the literature, particularly the supercritical state. A CO2 bubble/droplet was generated in a T-junction microchannel under various conditions ranging from the standard state (P = 0.1 MPa and T = 24 °C) to reservoir conditions (P = 9.5 MPa and T = 35 °C). The mass transfer rate is characterized by the volumetric mass transfer coefficient, kLa, extracted from the length change of a CO2 slug when traveling in a microchannel. The influence of pressure on the mass transfer rate was examined. We further investigate other key parameters that may affect the mass transfer rate, such as the capillary number (Ca) and the Reynolds number (Re), and compare them with other existing experimental results, which used different hydrodynamic diameters.
2 Materials and methods
We experimentally generated CO2 bubbles/droplets in Milli-Q water using T-junction microfluidics41,42 and measured the size change of traveling CO2 to acquire the mass transfer data. Microchannels were fabricated using silicon wafers and bound with a cover glass after applying the deep reactive ion etching (DRIE) technique.43,44Fig. 1a is an experimental snapshot illustrating the generation of CO2 bubbles at the T-junction with an injection pressure of 1.45 MPa. The water (illustrated by the blue arrow) directly enters the main microchannel (whose width and depth are 100 μm and 30 μm, respectively) as the continuous phase, while CO2 is injected via the narrower side-channel (of a width of 50 μm) to form the dispersed phase. | ||
Fig. 1 (a) The snapshot of CO2 bubbles generated using a microfluidic T-junction while subsequently moving in the channel. The water inlet has the same width as the main microchannel (100 μm), and the CO2 channel is 50 μm in width. The depth of the microchannel is 30 μm. The (yellow) scale bar represents 300 μm. (b) The CO2 thermodynamic phase diagram near the critical point (yellow  ). Colored symbols show our various experimental conditions for the CO2 injection pressure, Pinj, facilitating different CO2 phases: liquid ( ). Colored symbols show our various experimental conditions for the CO2 injection pressure, Pinj, facilitating different CO2 phases: liquid ( ), gas ( ), gas ( ), and supercritical ( ), and supercritical ( ). Other symbols represent the experimental conditions from previous studies, including works under atmospheric conditions (*),19,20,23 by Sell et al. ( ). Other symbols represent the experimental conditions from previous studies, including works under atmospheric conditions (*),19,20,23 by Sell et al. ( ),36 Yao et al. (◊37,45 and ▷38), and Qin et al. ( ),36 Yao et al. (◊37,45 and ▷38), and Qin et al. ( ).39 The image of the phase diagram is adapted from the National Institute of Standards and Technology (NIST).46 ).39 The image of the phase diagram is adapted from the National Institute of Standards and Technology (NIST).46 | ||
2.1 Experimental procedures
The microfluidics was installed in a metal platform that allows operation from standard atmospheric conditions (P = 0.1 MPa and T = 24 °C) to reservoir conditions (P = 9.5 MPa and T = 35 °C), covering the gas, liquid, and supercritical states of CO2, as shown in Fig. 1b. A heating plate and two thermocouples (K-type) were attached to the platform to heat up and monitor the assembly's temperature, respectively. Milli-Q water was loaded in stainless steel syringes and pumped by a syringe pump (Chemyx Inc. Fusion 6000) after one hour of degassing in a vacuum chamber. CO2 was controlled by a high-pressure gas pump (ISCO 100DX), directly connected to the gas tank (Praxair, RES K CO2 99.998%). A backpressure regulator (TESCOM BP 25-4000PSI) was connected to the system's outlet to keep a suitable pressure gradient across the channel. The flow pattern was observed by using an inverted microscope (Zeiss Axio Observer 7 Materials) and recorded by a high-speed camera (Phantom V710L) at a rate of 5000 frames per second (fps).2.2 Image analysis
We processed the recorded images using ImageJ (NIH Image)47 to measure the size of a single bubble and track its position varying with time. The measured data were further analyzed by using a customized code written in Matlab (MathWorks®). The data variation was evaluated by calculating the standard deviation of at least five bubbles for each pressure condition. The results showed good consistency in both the bubble size and position. The variance is about 3% in bubble length and ≈4% in displacement.2.3 Determining the volumetric mass transfer coefficient
As revealed by the experimental observation, e.g., Fig. 1a, CO2 bubbles gradually dissolve in water, resulting in shrinkage in size, when they move along the microchannel. We hence analyze the change of the CO2 bubble length, Lb, with time (t) to extract the (liquid-side) volumetric mass transfer coefficient (kLa) as it moves at a speed, ub, downstream (adjacent to a liquid slug of water with a length of Ls) in a microchannel width (dc), schematically illustrated in Fig. 2a. | ||
| Fig. 2 The schematic of the theoretical, conceptual model: (a) a unit cell. The x-axis denotes the downstream location of a bubble after being released from the T-junction. Luc, the length of a unit cell, is the sum of Lb and Ls, where Lb and Ls represent the length of the CO2 bubble/drop and liquid plug, respectively. A bubble is surrounded by the thin liquid film of δf in thickness. It travels at a velocity of ub in a microfluidic channel of the width of dc. (b) Higbie's penetration theory:49 a fluid element from the bulk phase may come into contact with the phase boundary at a finite time. During this period, the mass transfer is assumed only via molecular diffusion at the interface. The s-axis represents the streamline direction, and the y-axis denotes the mass transport direction of CO2, which is normal to the streamline. | ||
To estimate kLa, we used the so-called unit cell model37,45,48 by analyzing the mass transfer between one single bubble and its adjacent liquid slug, illustrated by the red dotted-line compartment in Fig. 2a. Assuming that the liquid slug is initially free from CO2 and in time CO2 gradually dissolved while well-mixed in the adjacent liquid slug, based on the mass balance concept, the mass transfer of CO2 from the bulk phase (bubble) through the phase boundary to the liquid slug can be mathematically described by
 | (1) |
Eqn (1) correlates the CO2 concentration changes in a fluid element to the decrease in the bubble volume. As CO2 bubbles/droplets move, fluid elements (in the liquid slug) repeatedly move from the bulk fluid phase onto the phase boundary (coming into contact with CO2) and stay for a limited time, δt. The process is schematically illustrated in Fig. 2b, showing CO2 concentration variation in the liquid bulk and along the phase boundary. The initial concentration of CO2 in a liquid element equals that in the bulk fluid phase, denoted as c(x), varying with the downstream location (x) as the CO2 bubble/drop travels downstream. Due to the direct contact, the phase boundary (at y = 0) is always saturated with CO2, whose saturation concentration is denoted as c* (P,T) as a function of P and T. In short, these boundary conditions at the phase boundary and the liquid bulk can be expressed as c(y = 0) = c* and c∞ ≡ c(y ≈ ∞) = c(x), respectively.
The mass transfer rate from a CO2 bubble to the surrounding liquid is the integral of the mass flux through a fluid element over the surface area of the phase boundary around a bubble, Ab:
 | (2) |
The rate change of CO2 concentration in a liquid slug equals the mass transfer of CO2 through the phase boundary; we therefore combine eqn (1) and (2):
 | (3) |
By integrating (3) and using the chain rule of total time-derivative, the CO2 concentration change in a liquid slug can be modeled by:
 | (4) |
Eqn (4) describes the concentration difference with an exponential decay at a rate of kLa/jL. Substituting eqn (4) into eqn (3), the change of bubble size (or length) relates to the concentration change of liquid slugs (Δc = c* − c0) and kLa:
 | (5) |
By integrating eqn (5) and dividing by the initial bubble length (Lb0), the dimensionless size (or length) change of a moving (CO2) bubble with the position away from the origin (T-junction) is described by:
 | (6) |
3 Results and discussion
3.1 CO2 bubble/droplet size change at different phases
Our experiments were operated from gas (Pinj = 0.25, 1.45, 3.45, and 5.45 MPa) to liquid (Pinj = 6.45, 7.5, 8.5, and 9.5 MPa at room temperature) and supercritical (Pinj = 8.5 and 9.5 MPa at 35 (±0.5) °C) states of CO2 to reveal the dynamics of CO2 transfer in water and the influence of pressure. For each injection pressure, we conducted the experiments at least three times independently to check the reproducibility. In total, thirty-four sets of experimental data were summarized and presented in this work. The complete experimental data are shown in Fig. S1 in the ESI.† Revealed in Fig. 3a are representative snapshots (taken from five fixed, downstream locations along the channel), including the T-junction's origin point. The initial length of CO2 bubbles/droplets (Lb0) was controlled within 212 (±7) μm, with the length of liquid slugs being 194 (±11) μm and the mean CO2 bubble/droplet speed being 0.33 (±0.07) m s−1.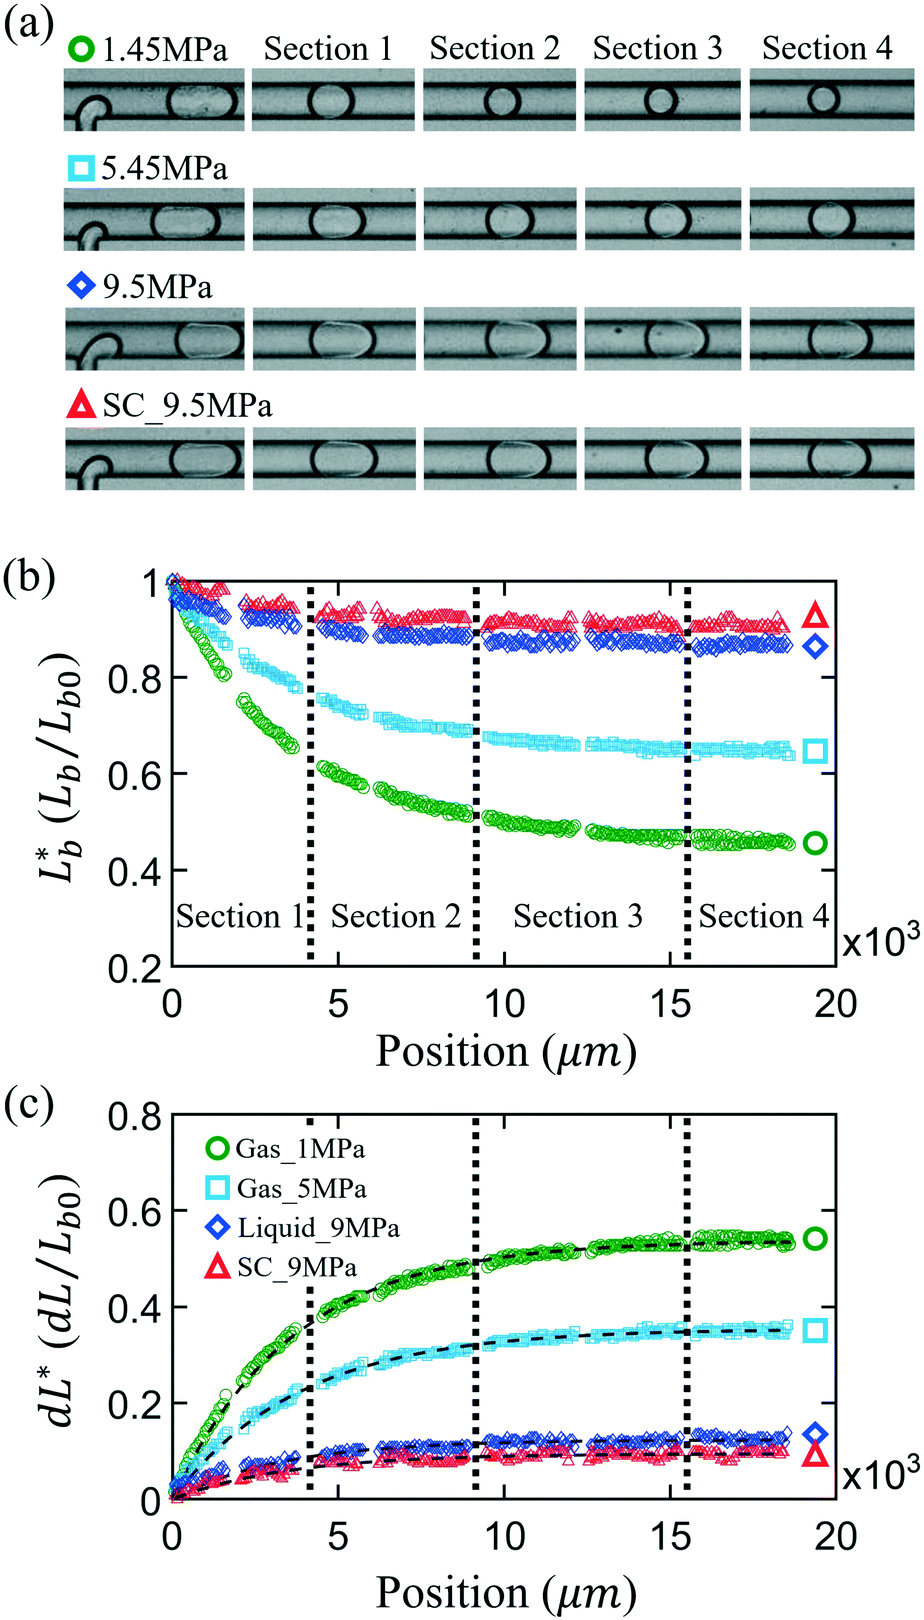 | ||
Fig. 3 (a) Experimental snapshots of CO2 bubbles or droplets in water in the microchannel for four different injection pressures, covering the CO2 phase state from gas ( and and  ) to liquid ( ) to liquid ( ) and supercritical state ( ) and supercritical state ( ). As a reference of scale, the width of the channel is 100 μm. CO2 bubbles/droplets shown in (a) correspond to different locations: at the initial position (x = 0), 4000 μm (section 1), 9000 μm (section 2), 15 ). As a reference of scale, the width of the channel is 100 μm. CO2 bubbles/droplets shown in (a) correspond to different locations: at the initial position (x = 0), 4000 μm (section 1), 9000 μm (section 2), 15![[thin space (1/6-em)]](https://www.rsc.org/images/entities/char_2009.gif) 000 μm (section 3), and 18600 μm (section 4) away from the T-junction. Dimensionless length and length change of the CO2 bubbles/droplets measured from the image sequences are shown in (b) and (c), respectively. In (c), the comparison of the measured CO2 length change with the results of nonlinear regression fitting of the simplified form of eqn (6): dL* = α(1 − exp(−βx)) is shown. The volumetric mass transfer coefficient, kLa, is obtained by multiplying the fitting coefficient, β = kLa/jL, by the inlet water flux, jL. 000 μm (section 3), and 18600 μm (section 4) away from the T-junction. Dimensionless length and length change of the CO2 bubbles/droplets measured from the image sequences are shown in (b) and (c), respectively. In (c), the comparison of the measured CO2 length change with the results of nonlinear regression fitting of the simplified form of eqn (6): dL* = α(1 − exp(−βx)) is shown. The volumetric mass transfer coefficient, kLa, is obtained by multiplying the fitting coefficient, β = kLa/jL, by the inlet water flux, jL. | ||
Fig. 3b and c show the dimensionless length,  , and dimensionless length change, dL/Lb0 = 1 − Lb/Lb0, of CO2vs. the traveling distance recorded from (a), respectively. It is noteworthy that all CO2 bubbles/droplets experienced a rapid shrinkage when they departed from the T-junction and later reached a final steady state. Under high-pressure conditions, the size change became subtle. As seen in Fig. 3b, CO2 bubbles shrank more than half of their initial length at low system pressure (e.g., 1.45 MPa depicted by
  ). As the pressure increased, the range of drastic size change became smaller, shown by the data of 5 MPa (depicted by
  ). In the liquid (
 ) and supercritical state (
 ), the shrinkage of a droplet decreased to about 10% of its initial length. Meanwhile, these high-pressure CO2 drops reached the final steady-state size faster than the low-pressure ones. It took 12 ms on average for liquid and supercritical CO2 droplets to reach a final steady state, whereas the CO2 bubbles at 1 MPa needed more than 30 ms to reach their stable size.
To examine the above distinct observations, we correlated the dimensionless maximum size change of CO2 ( ) with the CO2 density, ρ(P,T), bubble velocity, ub, and liquid volume fraction, vslug, measured from experiments to investigate their influences on the (quasi-)equilibrium size (see section 2 in the ESI†). The
  was determined using the mean value of dL* in the plateau region of Fig. 3c. The results showed that the CO2 density has a strong but negative correlation with its size change. The significant difference in size change at the different states is likely attributed to the increase in CO2 density with increasing P, as it transforms from the gas, to liquid, and to supercritical state. For instance, the CO2 density increases by ≈25×, rising from ρ = 28.19 to 693.95 Kg m−3, when P increases from P = 1.45 MPa to P = 9.5 MPa for the same T = 24 °C, as shown in Table S1 in the ESI.† Although the CO2 solubility in water, i.e., c* − c0, also increases with pressure, this solubility increase (by ≈3×, from 21.86 Kg m−3 at 1.5 MPa (ref. 50) to ≈67.3 at 9.63 MPa (ref. 51)) is smaller than the contribution from the increase in CO2 density.
The bubble velocity and the liquid volume had only a minor influence on the size change of gas CO2 (P ≤ 6.29 MPa). The influences of these two parameters (for the ranges explored) are negligible when the CO2 phase changed to liquid and supercritical CO2 (as shown in Fig. S2 in the ESI†).
3.2 Volumetric mass transfer coefficient, kLa, under elevated pressure
We extracted the volumetric mass transfer coefficient, kLa, by applying a nonlinear regression method with a reduced form of eqn (6): Y = α(1 − exp(βX)), to fit the experimental data of dependent variable Y as a function of parameter X, which is the downstream location x from the T-junction. Fig. 3c reveals the dimensionless size-change of CO2 dL*/Lb0 under different pressure conditions and the resultant fitting of the nonlinear regression (depicted by the black dashed lines). Overall, eqn (6) models well our experimental data. At the gas states (P ≤ 6.29 MPa), the R-squared values were between 0.97 and 0.99. The standard deviation of fitting coefficients was smaller than 1% for the prefactor α and within 3.2% for the mass transfer coefficient term β. For the results in the liquid and supercritical CO2 phases, the uncertainty of α increased to 5% and 10–15% for the error of β. The larger percentage errors in the latter cases are associated with the experimental resolution (corresponding to ≈4 μm per pixel) and due to the relatively smaller change in the CO2 size in the high-P regime. In addition, a close examination of CO2 bubble/droplet geometry shows a slightly asymmetric shape as we measure a difference of 1 μm between the front and rear spherical radii of CO2. Using eqn (6) and calculating the corresponding change in Ac, we estimate that this asymmetric CO2 shape would contribute ≈5% error in kLa.The data reveals that the majority of CO2 transports in the rapid shrinkage stage at the initial time, as seen in section 1 in Fig. 3, especially for high-pressure cases. We hence focused on this short period (about 9 ms) to highlight the influence of pressure on CO2 mass transfer in water. Fig. 4 shows the resultant volumetric mass transfer coefficient, kLa, in the rapid shrinkage stage and the data from previous experiments,19,20,23,37,39 which primarily focused on low pressures. As seen in the figure, kLa does not change significantly for low injection pressure when Pinj is smaller than 8 MPa, with an average kLa = 28.85 s−1. When Pinj raises to above 8 MPa, kLa increases to 45.4 s−1 on average for liquid CO2 and greatly enlarges to a mean value of 100 s−1 for supercritical CO2. Our data reveal that the average volumetric mass transfer coefficient, kLa, is increased from the gas, liquid, to supercritical state for a comparative CO2 traveling speed (of ub ≈ 0.33 m s−1) in a microfluidic channel. This significant gain in kLa for the supercritical state may be primarily attributed to the temperature increase, from 24 °C (room temperature) to 35 °C for a comparable ub range in our experiments. The rising temperature activates both water and CO2 molecules and thus enhances the mass transfer processes by increasing CO2 diffusivity. As a reference, the diffusion coefficient of CO2 in water increases from 1.88 × 10⁻⁹ to 2.18 × 10⁻⁹ (m2 s−1) as measured in the temperature at 25 °C and 35 °C, respectively.52
 | ||
Fig. 4 The volumetric mass transfer coefficients, kLa, during the rapid shrinkage stage (section 1) against elevated injection pressures, Pinj. Our data span a wide range of Pinj, covering three different states, gas ( ), liquid ( ), liquid ( ), and supercritical ( ), and supercritical ( ), of CO2. The shown points represent the average value of at least three independent experiments repeated for the same experimental conditions. Error bars denote the standard deviations. The black dashed line presents the mean value over all the presented data, <kLa> = 46.4 (s−1). Grey symbols are the maximum kLa available from previous microfluidic experimental results,19,20,23,37,39 which mostly focused on the low range of Pinj and used a microchannel of a size greater than 100 μm. ), of CO2. The shown points represent the average value of at least three independent experiments repeated for the same experimental conditions. Error bars denote the standard deviations. The black dashed line presents the mean value over all the presented data, <kLa> = 46.4 (s−1). Grey symbols are the maximum kLa available from previous microfluidic experimental results,19,20,23,37,39 which mostly focused on the low range of Pinj and used a microchannel of a size greater than 100 μm. | ||
Overall, CO2 droplets in the rapid shrinkage stage give an average value of kLa = 46.4 (1/s) (black dashed line in Fig. 4) in a microfluidic channel of a small hydrodynamic diameter (of dh = 46 μm). This value is greater than those from previous microfluidic data operated under lower pressure conditions (0.1–3 MPa) and at room temperature, with their kLa values ranging between 0.3 and 16 (1/s).19,20,23,37 The kLa measured in our experiments was improved by 3× to 150× compared to those from the previous data. Since the range of CO2 traveling speed, ub, is comparable between the experiments, the significant increase in kLa measured in our experiments compared to previous low-P data likely comes from the larger specific area (a) created by our micro-channel, as elaborated below.
The specific area, a, is conventionally defined as the ratio of the interfacial area to the volume of the two phases.53 For a similar total volume of the two phases, a can greatly enhance the mass transfer process by increasing the contact area of the multiphase. According to the calculation proposed by Vandu et al.,48 the specific area consists of two parts, namely two spherical caps and a cylindrical body of the drop or bubble (i.e., CO2), as follows:
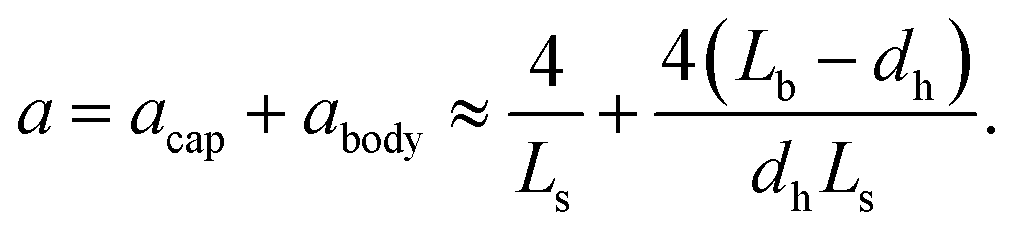 | (7) |
Most of the microfluidic experiments studying the mass transfer rates for the segmented gas–liquid flow applied hydraulic diameters larger than 200 μm, which could generate bubbles with the specific area (a), calculated based on eqn (7), ranging from 3400 to 104 m−1.19,20,23,37 As a comparison, our microchannel has a low hydraulic diameter of 46 μm, which significantly enlarges the specific area of CO2 bubbles/droplets up to 105 m−1 on average, approximately 10× to 30× greater than those of previous microfluidic experiments.19,20,23,37 In addition, the recent high-pressure microfluidic experiment (with Pinj = 8 MPa and T ≈ 313 K) done by Qin et al.39 found the mass transfer coefficient, kL, to be between 1.5 × 10⁻⁴ and 7.5 × 10⁻⁴ m s−1, consistent with the low-pressure regime data.19,20,23,37 With a large specific area of 33200 m−1, this high-pressure microfluidic data also yields a large kLa up to 24.9 (s−1) (depicted by  ),39 consistent with our microfluidic data in the comparable pressure range. In short, these comparisons reveal that a smaller microfluidic channel enhances the volumetric mass transfer coefficient significantly by increasing the specific interfacial area, thereby benefiting various chemical reactions using a smaller hd.
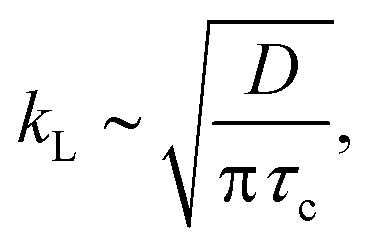
Furthermore, the mass transfer coefficient, kL, at room temperature in this work is estimated to be 3.4 (±0.71) × 10−4 m s−1 on average. This result is consistent with the kL reported in previous micro-scale experiments (1.8 × 10⁻⁴ ≤ kL ≤ 7.3 × 10⁻⁴ m s−1).19,20,23,37 For supercritical CO2, the kL is calculated to be as high as 9.96 × 10⁻⁴ m s−1 on average, which is about three times larger than the values estimated in the gas and liquid states. The higher kLa value of supercritical CO2 compared to the liquid/gas counterpart may be attributed to the greater temperature (35 °C) and shorter contact time of a fluid element on the CO2–water interface. The latter is suggested by Higbie's penetration theory,49 where the mass transfer coefficient is modeled to be proportional to the square root of diffusivity:
 | (8) |
3.3 CO2 mass transfer rate
We further investigate the influence of the Capillary number (Ca) and Reynolds number (Re) of the injected water on kLa (see Fig. 5). Here, Ca = μl·ub/σ, representing the ratio of the viscous drag of the carrier liquid (i.e., water) to the interfacial tension between CO2 and water, σ. Re = ρlubdh/μl is calculated by comparing the inertial force of a moving bubble to the liquid's viscous force, where ρl is the liquid density, ub is the CO2 traveling speed, and dh is the hydrodynamic diameter of the microfluidic channel. The values of these thermodynamic parameters used are given in Tables S2 and S3 in the ESI.† | ||
| Fig. 5 The correlation of the measured volumetric mass transfer coefficient, kLa, with (a) the capillary number, Ca = μl·ub/σ, and (b) the Reynolds number, Re = ρlubdh/μl of the continuous liquid phase. ub is the mean velocity of a moving bubble/droplet, and dh denotes the hydraulic diameter of the microchannel, which is 46 μm in this study. ρl, μl, and σ represent the density and dynamic viscosity of the water and the H2O–CO2 interfacial tension varying with pressure, respectively. Presented in the inset are the three empirical approximations of kLa previously proposed by Irandoust et al.53 [dashed line (with ym = 0.5)], Berčič and Pintar57 (solid line), and Vandu et al.48 (dotted line). (c) The comparison of experimental data from this study, (kLa)exp, and values estimated using the above empirical approximations, (kLa)est, previously proposed by Irandoust et al. (·),53 Berčič and Pintar (+),57 and Vandu et al. (×).48 Three different colors represent the experimental conditions in three phase states of CO2: green color denotes the gas state, and blue and red symbols represent the conditions using liquid and supercritical CO2, respectively. | ||
On the one hand, as shown in Fig. 5a, the volumetric mass transfer coefficient does not significantly correlate with the Capillary number, Ca, ranging from 1.9 × 10⁻³ to 1.4 × 10⁻² in this study. The change in Ca primarily stems from the decrease in the CO2–water surface tension (σ) as the CO2 phase changed from gas to the supercritical state. On the other hand, we correlated the kLa with the Reynolds number in Fig. 5b, to study the influence of CO2 velocity. As an approximation, the black dashed line represents the result of linear regression analysis from all the experimental data, showing that kLa grows linearly with a prefactor of 0.53 (±0.58) with Re.
The dependence of kLa on Re, observed from our data, indicates the significance of CO2 bubble velocity, ub, on enhancing the mass transfer. This observation generally agrees with approximations proposed previously, considering the bubble velocity (ub), a critical parameter that determines kLa.48,53,57 Illustrated in Fig. 5b inset are the empirical results of kLa found in millimeter-scale capillaries, and here we plot their data as a function of Re based on their experimental conditions. All of the empirical results show a rising kLa with increasing Re, i.e., the moving speed of bubbles. This dependent relation between kLa and Re may be associated with the fact that a faster ub enhances the mixing of fluid elements on the phase boundary and the fresh bulk fluid due to the more intensive liquid slug's internal recirculation.58,59 Also, from the perspective of Higbie's penetration theory,49 the more intensive internal recirculation implies the more frequent contact of fluid elements with the phase boundary and the shorter contact time for a fluid element on the phase boundary, thereby increasing kL [based on eqn (8)].
Besides the dimensionless parameters, both temperature and the viscosity of water affect CO2 diffusion in water. Under uniform temperature conditions, the diffusivity of CO2 is inversely proportional to water viscosity.60 The water viscosity μl varies from 9.14 × 10⁻⁴ to 7.22 × 10⁻⁴ (Ns m−2) as the injection pressure elevates from 0.15 MPa at room temperature up to 9.5 MPa at 35 °C. This decrease in water viscosity may lead to a 26% increase in CO2 diffusivity in water, which may partially explain the greater kLa measured for supercritical CO2. Studies also show that surface tension could play a role in mass transfer for a stationary micron-sized gas-bubble when the bubble radius ≲15 μm and the solvent is nearly saturated.61,62 Under these conditions, the Laplace pressure between the two phases can enhance gas molecules' transport into the surrounding solvent due to overpressure. In our experiments, we degas water for an hour to make sure it is initially free from any dissolving gases, including CO2. The large concentration difference between the CO2 bubble/droplet and adjacent water would primarily drive the mass transfer of CO2.62 In addition, the surface tension between CO2 and water and, hence, the Laplace pressure decreases at elevated pressure [by about three times compared to that at 1 atm (see Table S2 in the ESI†)]. Therefore, the influence of the Laplace pressure (estimated to be 1 kPa) or surface tension on the CO2 mass transfer at elevated pressure (of Pinj = 9.5 MPa) is likely negligible in our cases.
How do our microfluidic results compared with the kLa obtained using the segmented gas–liquid flow (so-called Taylor flow) in millimeter-sized capillaries,53 which are beneficially used in monolithic chemical catalyst reactors? Fig. 5c shows such a comparison between our experimental results and the kLa estimated by three empirical approximations with millimeter-scale capillaries. Our experimental results of (kLa)exp are plotted in the Y-axis, whereas the correspondingly estimated values, (kLa)est, in the X-axis, by substituting our experimental conditions into the previous empirical equations, described below.
First, the semi-theoretical model developed by Irandoust et al. (depicted by *) considers the bubble speed (ub) playing a crucial role in the mass transfer on both cap sides and the center cylinder of a Taylor bubble:53
| kLa = 4[δf(dh − δf)Uavym + D Sh(dhc − 2δf)]/(dh2Luc), | (9) |
Second, results calculated using Berčič and Pintar's model underestimate the kLa compared to our measurements (depicted by +):
| kLa = p1 × ubp2/Lsp3, | (10) |
Third, the empirical model proposed by Vandu et al. suggests that the mass transfer happens primarily via the cylindrical body to the liquid film. The contribution from the cap side can be neglected because of the small specific area a of the cap side compared to the cylindrical body;48 therefore
 | (11) |
In brief, our microfluidic measurements of kLa for the segmented gas–liquid are significantly greater than those obtained by millimeter-size capillaries. Consistently, kLa generally increases with increasing ub and, hence, Re. Compared with various empirical models developed for the millimeter-size capillaries, our microfluidic segmented Taylor flow measurements show the contributions of mass transfer from both the spherical caps and the thin liquid film.
4 Conclusions
We experimentally investigated the microfluidic CO2 mass transfer rate in water under high-pressure conditions, ranging from the normal state on the ground (0.25 MPa and 24 °C) to the deep formation's reservoir conditions (9.5 MPa and 35 °C) for CCS applications. With the microfluidic measurements of the segmented flow's size-change in a high-pressure microfluidic device, we extracted the liquid-side volumetric mass transfer coefficient kLa to quantify the dynamic mass transport of CO2 bubbles/droplets in gas, liquid, and supercritical states. The resultant kLa reveals a more intensive mass transfer for supercritical CO2. The measurement of kLa also shows an approximately linear dependency on the Reynolds number of the continuous phase with a factor of 0.53. Our microfluidic results with dh ≈ 50 μm show a significant increase of kLa, by O (1–102) compared to other low-pressure microfluidic measurements (with dh ≈ 200 μm) and by O (102–103) compared to those obtained using millimeter-size capillaries. Future work could extend the current parameter scope to investigate the important effect of temperature and microchannel size on microfluidic (two-phase) mass transfer, which is crucial for the technologies of microreactors and intensified extraction.In terms of CCS applications, our experimental results revealed intensive mass transfer (kLa) of CO2 in the supercritical state at the micro-pore scale (dh ≈ 50 μm), leading to fast saturation in water at the early stage and benefiting subsequent sequestration of CO2. In addition, the increase in the CO2's traveling velocity (ub) considerably enhances its mass transfer. These two primary outcomes can help assess the relevant time-scale and volume of supercritical CO2's mass transfer in water for the P–T conditions and fluid inject rates used. Furthermore, the microfluidic platform presented can be extended for beneficial applications of microfluidic visualizations of CO2-EOR under different reservoir conditions and intensive extractions using the green solvent supercritical CO2.
Author contributions
Tsaihsing Martin Ho: investigation, methodology, software, formal analysis, writing – original draft, visualization. Junyi Yang: software. Peichun Amy Tsai: conceptualization, methodology, validation, software, writing – revision, visualization, supervision, funding acquisition.Conflicts of interest
There are no conflicts to declare.Acknowledgements
We gratefully acknowledge the support from the Canada First Research Excellence Fund (CFREF), Future Energy System (FES T02-P05 CCUS projects) at the University of Alberta, and Canada Foundation for Innovation (CFI 34546). We also thank S. Bozic and S. Munro for their help with micro-fabrications at the nanoFAB in the University of Alberta. P. A. T. holds a Canada Research Chair (CRC) in Fluids and Interfaces and gratefully acknowledges funding from the Natural Sciences and Engineering Research Council of Canada (NSERC) and Alberta Innovates (AI), in particular the NSERC Canada Research Chairs Program (CRC 233147) and Discovery Grant (RGPIN-2020-05511).Notes and references
- C. M. White, B. R. Strazisar, E. J. Granite, J. S. Hoffman and H. W. Pennline, J. Air Waste Manage. Assoc., 2003, 53, 645–715 CrossRef CAS PubMed.
- S. Bachu and J. Adams, Energy Convers. Manage., 2003, 44, 3151–3175 CrossRef CAS.
- M. D. Aminu, S. A. Nabavi, C. A. Rochelle and V. Manovic, Appl. Energy, 2017, 208, 1389–1419 CrossRef CAS.
- J. A. Neufeld, M. A. Hesse, A. Riaz, M. A. Hallworth, H. A. Tchelepi and H. E. Huppert, Geophys. Res. Lett., 2010, 37, 22 CrossRef.
- E. J. Beckman, J. Supercrit. Fluids, 2004, 28, 121–191 CrossRef CAS.
- Y. Shah, B. G. Kelkar, S. Godbole and W.-D. Deckwer, AIChE J., 1982, 28, 353–379 CrossRef CAS.
- N. Kantarci, F. Borak and K. O. Ulgen, Process Biochem., 2005, 40, 2263–2283 CrossRef CAS.
- K. Van't Riet, Ind. Eng. Chem. Process Des. Dev., 1979, 18, 357–364 CrossRef.
- P. M. Wilkinson, H. Haringa and L. L. Van Dierendonck, Chem. Eng. Sci., 1994, 49, 1417–1427 CrossRef CAS.
- C. Fleischer, S. Becker and G. Eigenberger, Chem. Eng. Sci., 1996, 51, 1715–1724 CrossRef CAS.
- G. Vázquez, M. Cancela, R. Varela, E. Alvarez and J. Navaza, Chem. Eng. J., 1997, 67, 131–137 CrossRef.
- J. De Jong, R. G. Lammertink and M. Wessling, Lab Chip, 2006, 6, 1125–1139 RSC.
- E. Kjeang, N. Djilali and D. Sinton, J. Power Sources, 2009, 186, 353–369 CrossRef CAS.
- D. Sinton, Lab Chip, 2014, 14, 3127–3134 RSC.
- M. Abolhasani, A. Günther and E. Kumacheva, Angew. Chem., Int. Ed., 2014, 53, 7992–8002 CrossRef CAS PubMed.
- V. A. Lifton, Lab Chip, 2016, 16, 1777–1796 RSC.
- G. Bongrand and P. A. Tsai, Phys. Rev. E, 2018, 97, 061101 CrossRef CAS.
- M. Saadat, P. A. Tsai, T.-H. Ho, G. Øye and M. Dudek, ACS Omega, 2020, 5, 17521–17530 CrossRef CAS.
- J. Yue, G. Chen, Q. Yuan, L. Luo and Y. Gonthier, Chem. Eng. Sci., 2007, 62, 2096–2108 CrossRef CAS.
- J. Yue, L. Luo, Y. Gonthier, G. Chen and Q. Yuan, Chem. Eng. Sci., 2009, 64, 3697–3708 CrossRef CAS.
- R. Sun and T. Cubaud, Lab Chip, 2011, 11, 2924–2928 RSC.
- M. Abolhasani, M. Singh, E. Kumacheva and A. Günther, Lab Chip, 2012, 12, 1611–1618 RSC.
- J. Ren, S. He, C. Ye, G. Chen and C. Sun, Chem. Eng. J., 2012, 210, 374–384 CrossRef CAS.
- S. G. Lefortier, P. J. Hamersma, A. Bardow and M. T. Kreutzer, Lab Chip, 2012, 12, 3387–3391 RSC.
- E. Tumarkin, Z. Nie, J. I. Park, M. Abolhasani, J. Greener, B. Sherwood-Lollar, A. Günther and E. Kumacheva, Lab Chip, 2011, 11, 3545–3550 RSC.
- S. Shim, J. Wan, S. Hilgenfeldt, P. D. Panchal and H. A. Stone, Lab Chip, 2014, 14, 2428–2436 RSC.
- K. Michael, A. Golab, V. Shulakova, J. Ennis-King, G. Allinson, S. Sharma and T. Aiken, Int. J. Greenhouse Gas Control, 2010, 4, 659–667 CrossRef CAS.
- C. Zhang, M. Oostrom, J. W. Grate, T. W. Wietsma and M. G. Warner, Environ. Sci. Technol., 2011, 45, 7581–7588 CrossRef CAS PubMed.
- S. Morais, N. Liu, A. Diouf, D. Bernard, C. Lecoutre, Y. Garrabos and S. Marre, Lab Chip, 2016, 16, 3493–3502 RSC.
- P. Nguyen, D. Mohaddes, J. Riordon, H. Fadaei, P. Lele and D. Sinton, Anal. Chem., 2015, 87, 3160–3164 CrossRef CAS PubMed.
- A. Sharbatian, A. Abedini, Z. Qi and D. Sinton, Anal. Chem., 2018, 90, 2461–2467 CrossRef CAS PubMed.
- B. Pinho, S. Girardon, F. Bazer-Bachi, G. Bergeot, S. Marre and C. Aymonier, J. Supercrit. Fluids, 2015, 105, 186–192 CrossRef CAS.
- B. Pinho, S. Girardon, F. Bazer-Bachi, G. Bergeot, S. Marre and C. Aymonier, Lab Chip, 2014, 14, 3843–3849 RSC.
- B. Bao, J. Riordon, Y. Xu, H. Li and D. Sinton, Anal. Chem., 2016, 88, 6986–6989 CrossRef CAS PubMed.
- N. Liu, C. Aymonier, C. Lecoutre, Y. Garrabos and S. Marre, Chem. Phys. Lett., 2012, 551, 139–143 CrossRef CAS.
- A. Sell, H. Fadaei, M. Kim and D. Sinton, Environ. Sci. Technol., 2013, 47, 71–78 CrossRef CAS PubMed.
- C. Yao, Z. Dong, Y. Zhao and G. Chen, Chem. Eng. Sci., 2015, 123, 137–145 CrossRef CAS.
- C. Yao, K. Zhu, Y. Liu, H. Liu, F. Jiao and G. Chen, Chem. Eng. J., 2017, 319, 179–190 CrossRef CAS.
- N. Qin, J. Z. Wen, B. Chen and C. L. Ren, Appl. Phys. Lett., 2018, 113, 033703 CrossRef.
- N. Qin, J. Z. Wen and C. L. Ren, Phys. Rev. E, 2017, 95, 043110 CrossRef PubMed.
- T. Thorsen, R. W. Roberts, F. H. Arnold and S. R. Quake, Phys. Rev. Lett., 2001, 86, 4163 CrossRef CAS PubMed.
- P. Garstecki, M. J. Fuerstman, H. A. Stone and G. M. Whitesides, Lab Chip, 2006, 6, 437–446 RSC.
- S. Franssila, Introduction to microfabrication, John Wiley & Sons, 2010 Search PubMed.
- T.-H. M. Ho and P. A. Tsai, Lab Chip, 2020, 20, 3806–3814 RSC.
- C. Yao, Z. Dong, Y. Zhao and G. Chen, Chem. Eng. Sci., 2014, 112, 15–24 CrossRef CAS.
- NIST, Standard Reference Database Number 69, 2020, https://webbook.nist.gov/chemistry/.
- M. D. Abràmoff, P. J. Magalhães and S. J. Ram, Biophotonics Int., 2004, 11, 36–42 Search PubMed.
- C. Vandu, H. Liu and R. Krishna, Chem. Eng. Sci., 2005, 60, 6430–6437 CrossRef CAS.
- T. K. Sherwood, R. L. Pigford and C. R. Wilke, Mass transfer, McGraw-Hill, 1975 Search PubMed.
- A. Valtz, A. Chapoy, C. Coquelet, P. Paricaud and D. Richon, Fluid Phase Equilib., 2004, 226, 333–344 CrossRef CAS.
- T. Nakayama, H. Sagara, K. Arai and S. Saito, Fluid Phase Equilib., 1987, 38, 109–127 CrossRef CAS.
- A. Tamimi, E. B. Rinker and O. C. Sandall, J. Chem. Eng. Data, 1994, 39, 330–332 CrossRef CAS.
- S. Irandoust, S. Ertlé and B. Andersson, Can. J. Chem. Eng., 1992, 70, 115–119 CrossRef CAS.
- B. Jähne, G. Heinz and W. Dietrich, J. Geophys. Res.: Oceans, 1987, 92, 10767–10776 CrossRef.
- S. P. Cadogan, G. C. Maitland and J. M. Trusler, J. Chem. Eng. Data, 2014, 59, 519–525 CrossRef CAS.
- J. W. Mutoru, A. Leahy-Dios and A. Firoozabadi, AIChE J., 2011, 57, 1617–1627 CrossRef CAS.
- G. Berčič and A. Pintar, Chem. Eng. Sci., 1997, 52, 3709–3719 CrossRef.
- A. Günther, M. Jhunjhunwala, M. Thalmann, M. A. Schmidt and K. F. Jensen, Langmuir, 2005, 21, 1547–1555 CrossRef.
- S. Kuhn and K. F. Jensen, Ind. Eng. Chem. Res., 2012, 51, 8999–9006 CrossRef CAS.
- İ. Tosun, Fundamental Mass Transfer Concepts in Engineering Applications, CRC Press, 2019 Search PubMed.
- W. Kloek, T. Van Vliet and M. Meinders, J. Colloid Interface Sci., 2001, 237, 158–166 CrossRef CAS PubMed.
- P. B. Duncan and D. Needham, Langmuir, 2004, 20, 2567–2578 CrossRef CAS PubMed.
- R. Clift, J. R. Grace and M. E. Weber, Bubbles, drops, and particles, Courier Corporation, 2005 Search PubMed.
Footnote |
| † Electronic supplementary information (ESI) available: Supporting data and thermodynamic parameters. See DOI: 10.1039/d1lc00106j |
| This journal is © The Royal Society of Chemistry 2021 |