
 Open Access Article
 This Open Access Article is licensed under a Creative Commons Attribution-Non Commercial 3.0 Unported Licence
High-throughput organ-on-chip platform with integrated programmable fluid flow and real-time sensing for complex tissue models in drug development workflows†
H.
Azizgolshani‡
a,
J. R.
Coppeta‡
a,
E. M.
Vedula‡
a,
E. E.
Marr
a,
B. P.
Cain
a,
R. J.
Luu
a,
M. P.
Lech
b,
S. H.
Kann
ac,
T. J.
Mulhern
a,
V.
Tandon
 a,
K.
Tan
a,
N. J.
Haroutunian
a,
P.
Keegan
a,
M.
Rogers
a,
A. L.
Gard
a,
K. B.
Baldwin
a,
J. C.
de Souza
a,
B. C.
Hoefler
a,
S. S.
Bale
a,
L. B.
Kratchman
a,
A.
Zorn
a,
A.
Patterson
a,
E. S.
Kim
a,
T. A.
Petrie
a,
E. L.
Wiellette
a,
C.
Williams
a,
B. C.
Isenberg
a and
J. L.
Charest
*a
a,
K.
Tan
a,
N. J.
Haroutunian
a,
P.
Keegan
a,
M.
Rogers
a,
A. L.
Gard
a,
K. B.
Baldwin
a,
J. C.
de Souza
a,
B. C.
Hoefler
a,
S. S.
Bale
a,
L. B.
Kratchman
a,
A.
Zorn
a,
A.
Patterson
a,
E. S.
Kim
a,
T. A.
Petrie
a,
E. L.
Wiellette
a,
C.
Williams
a,
B. C.
Isenberg
a and
J. L.
Charest
*a
aDraper, 555 Technology Square, Cambridge, MA 02139, USA. E-mail: jcharest@draper.com
bPfizer, Inc., 1 Portland Street, Cambridge, MA 02139, USA
cDepartment of Mechanical Engineering, Boston University, 110 Cummington Mall, Boston, MA 02215, USA
First published on 8th April 2021
Abstract
Drug development suffers from a lack of predictive and human-relevant in vitro models. Organ-on-chip (OOC) technology provides advanced culture capabilities to generate physiologically appropriate, human-based tissue in vitro, therefore providing a route to a predictive in vitro model. However, OOC technologies are often created at the expense of throughput, industry-standard form factors, and compatibility with state-of-the-art data collection tools. Here we present an OOC platform with advanced culture capabilities supporting a variety of human tissue models including liver, vascular, gastrointestinal, and kidney. The platform has 96 devices per industry standard plate and compatibility with contemporary high-throughput data collection tools. Specifically, we demonstrate programmable flow control over two physiologically relevant flow regimes: perfusion flow that enhances hepatic tissue function and high-shear stress flow that aligns endothelial monolayers. In addition, we integrate electrical sensors, demonstrating quantification of barrier function of primary gut colon tissue in real-time. We utilize optical access to the tissues to directly quantify renal active transport and oxygen consumption via integrated oxygen sensors. Finally, we leverage the compatibility and throughput of the platform to screen all 96 devices using high content screening (HCS) and evaluate gene expression using RNA sequencing (RNA-seq). By combining these capabilities in one platform, physiologically-relevant tissues can be generated and measured, accelerating optimization of an in vitro model, and ultimately increasing predictive accuracy of in vitro drug screening.
Introduction
Novel drug discovery efforts suffer from increasing costs and low probability of clinical trial success, largely due to a lack of predictive preclinical in vitro models1–4 and reliance on animal testing which often fails to accurately capture human response.5,6 To address this need, there has been an emergence of complex in vitro models that contain relevant aspects of human physiology.7–11 These models, which are collectively termed organ-on-chip (OOC) technology, have the potential to greatly aid the development of new therapies.12–16 However, creating relevant components of human physiology is often achieved at the expense of throughput17,18 and the resulting technology is rarely directly compatible with industry standard workflow and infrastructure.19 A departure from this historical trade-off requires a new system architecture with advances in engineering and biology to create the next generation of organ-on-chip technology.While current in vitro models do not fully recapitulate all aspects of the in vivo microenvironment, there is a strong body of literature indicating the physiologically relevant cues that guide tissue function; it is believed inclusion of such cues in an in vitro model will improve its ability to predict drug effects on humans. For instance, fluid flow in vivo influences tissue function by providing perfusion at lower flow rates20–23 and by additionally generating a flow-induced shear stress (FSS)24–27 at higher flow rates, highlighting the importance of including the capability to generate a range of flow rates9 in OOC models. In addition, the spatial organization and chemical environment of cells influence tissue function; examples include heterotypic cell organization,28 extra-cellular matrix (ECM) composition,29 and spatial control of media composition and biochemical gradients to create distinct in vivo phenotypic zones.30,31 Additionally, maintaining near physiologic concentrations of autocrine and paracrine signals requires a low media-to-cell ratio within in vitro culture systems.32 OOCs that allow for integration of a diverse range of cell types, including those from various organs and with different qualification status, can increase the range of tissue model applications and cell sources. Incorporating these cues and features in an OOC enables selection of conditions to drive tissues toward physiologically accurate and, therefore, clinically predictive models.
The next generation of OOCs should improve upon standard in vitro models by integrating both new and established sensing modalities while maintaining compatibility with state-of-the-art data collection tools. Integrated sensors in OOCs can obtain real-time data over the course of an experiment17,18,33–35 without disturbing the microenvironment. While large data sets can be generated in vitro via high-throughput screening tools such as high-content screening (HCS) and RNA sequencing (RNA-seq), current OOC systems only interrogate one or a few tissue culture conditions32 in each experiment. We aimed to produce a next generation OOC system with on-line integrated sensing capabilities that maintains downstream compatibility with HCS and RNA-seq while enabling high-throughput interrogation of many tissue culture conditions simultaneously (or allows for a large number of replicates for a few culture conditions). Such a system will enable rapid parallel screening of many drug candidates and the generation of highly robust and complete data sets, including the ability to measure dynamic tissue behavior with previously inaccessible temporal resolution.
Here we present an advanced OOC platform technology that combines programmable flow control, integrated real-time sensors, and an ability to include heterotypic cell-type complexity within a high-throughput layout that readily interfaces with industry-standard infrastructure and state-of-the-art data collection tools. The platform comprises 96 individual OOC devices in one cell culture plate, up to 192 individual and actively-controlled micropumps contained within the plate lid, and 384 electrical contacts to make electrical measurements within each of the 96 devices.36 Each OOC device contains two microchannels separated by a semi-permeable scaffold capable of supporting a range of cell types in mono- or co-culture to generate various tissue-relevant models. Fluid flow in each individual channel is controlled by a separate micropump with low fluid circuit dead volume to minimize dilution of cell-secreted factors. The platform employs optically clear thermoplastic materials chosen to minimize drug sorption and enable histological analysis using standard microscopy techniques. The format is compatible with existing life science tools, including liquid and plate handling tools and assays, such as multiplex immunoassays, HCS and RNA-seq. In this manuscript, we demonstrate the versatility and broad capabilities of the platform by presenting a series of proof-of-concept experiments comprised of data from human kidney, vascular, liver, and intestine tissue models with relevant physiological readouts.
The models demonstrate distinct organ/tissue functionality, which is enabled by the novel features of the platform technology. Specifically, we demonstrate (a) two physiologically relevant flow regimes: perfusion flow that enhances hepatic tissue function and high-shear stress flow that aligns endothelial monolayers; (b) integrated electrical sensors that quantify barrier function of primary gut colon tissue in real-time; (c) optical access to the tissues that enables direct quantification of renal active transport and oxygen consumption; and (d) a format compatible with HCS and RNA-seq. These features, combined with the throughput capabilities, result in a platform that can both generate and interrogate microscale tissues and is expected to increase predictive accuracy of in vitro drug screening.
Results and discussion
Platform arrays microfluidics, active pumps, and sensors for simultaneous culture and analysis of 96 independent tissues
The organ-on-chip platform shown in Fig. 1 is comprised of three main components: (1) a thermoplastic microfluidic culture plate (MCP) in the standard well plate footprint with 96 individual devices, (2) a perfusion system incorporated into the lid of the MCP that contains up to 192 microfluidic pumps that individually address each device, and (3) a trans-epithelial electrical resistance (TEER) measurement system integrated with the perfusion system. The integrated perfusion and TEER systems are collectively termed as the micro-pump sensor array (MPSA). A rendered cutaway of the platform (Fig. 1a), shows the microfluidic channels of the MCP, and the microfluidic pumps and integrated TEER sensors of the MPSA. Pictures of the platform and its individual components is in ESI† Fig. S1, as well as a system block diagram that describes connection between the platform components.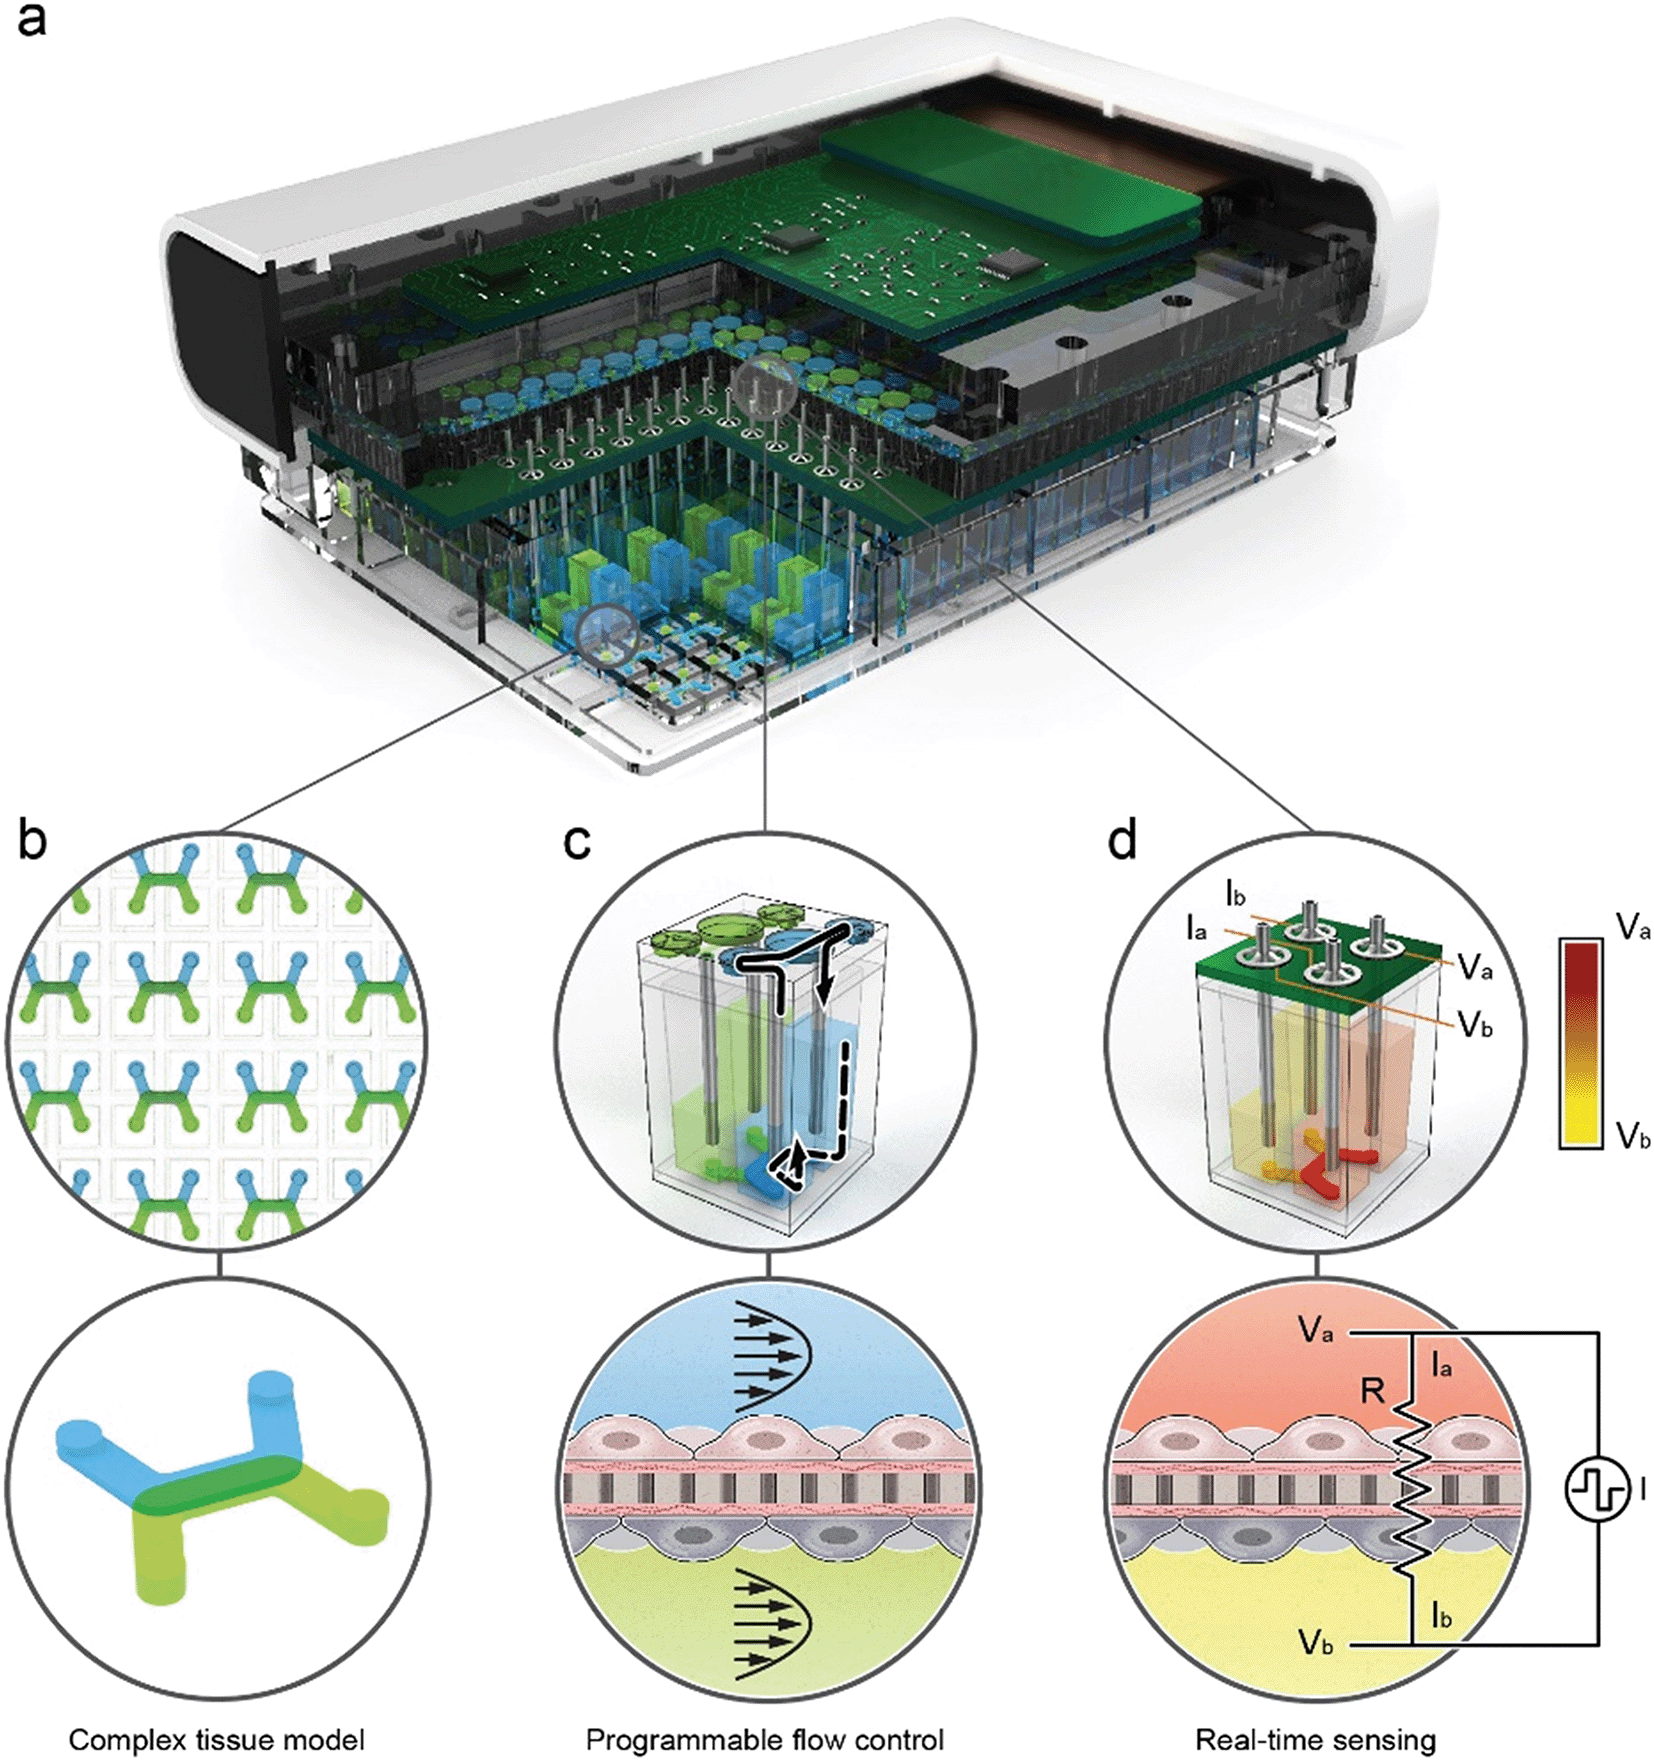 | ||
| Fig. 1 High-throughput organ-on-chip platform with integrated pumping and sensing. a, A cutaway rendering of the platform shows the microfluidic channels of the MCP, and the micropumps integrated with the TEER electrodes and electronics of the MPSA. b, The MCP contains 96 independent microfluidic-based tissue models, each with two channels separated by a permeable membrane. The inlets and outlets of the top (blue) and bottom (green) channels are connected to 4 adjacent wells of a 384 well plate that serves as the media reservoir for the each tissue model. The configuration of the channels allows for flexible co-culture of various cell types on either side of the membrane to develop complex tissue models. c, The micropumps are fluidically coupled to the wells of the MCP via vertical tubes that are submerged in the media reservoirs. Flow through each microchannel of the MCP is induced by an independent micropump. Micropumps transfer fluid between the interconnected wells, creating a pressure differential which in turn drives the fluid through the microchannel. d, For each device, the 4 associated micropump tubes serve as electrodes to enable a 4-point electrical measurement of the tissue resistance. One pair of submerged electrodes provides a biphasic current pulse across the tissue construct via a fluidic pathway, and a separate pair of electrodes sense electrical potential which can be used to calculate tissue resistance. | ||
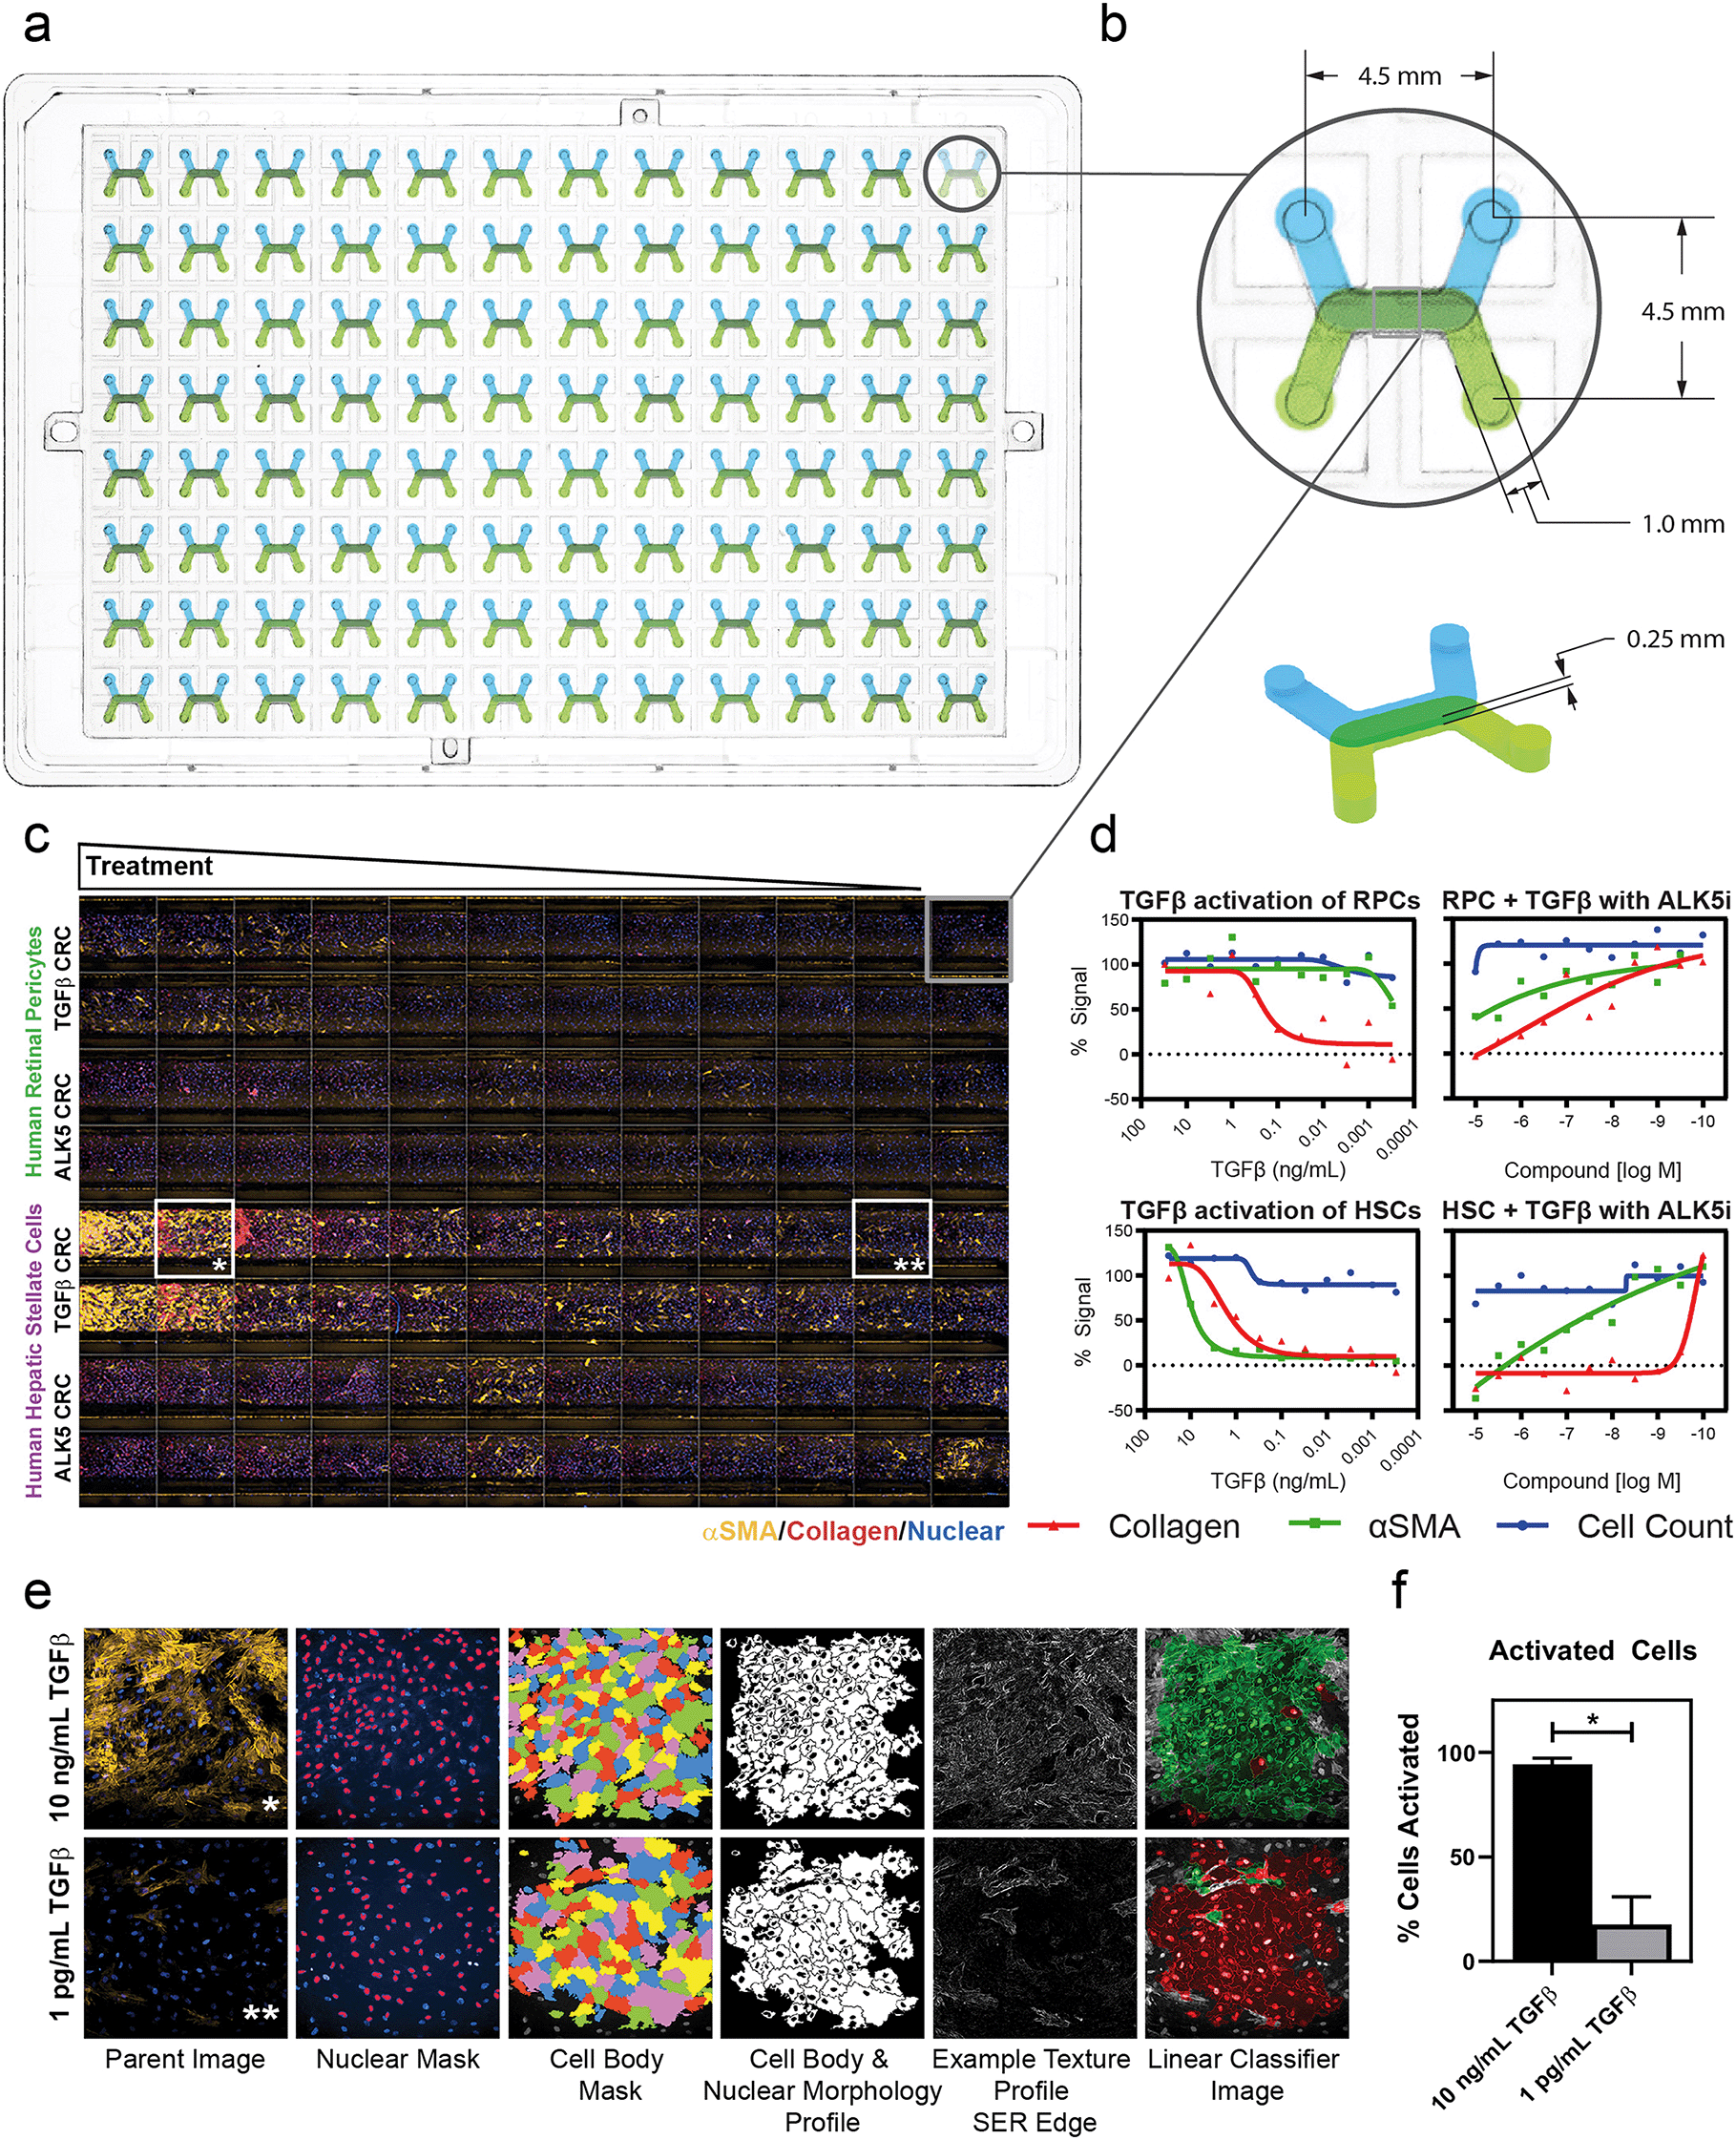 | ||
| Fig. 2 The platform is compatible with high-content screening imaging systems and compound testing. a, The MCP has a standard well plate foot print, which enables compatibility with HCS systems b, each of the 96 devices is configured with a 4.5 mm inlet–outlet pitch and 0.25 mm channel height to enable compatibility with confocal imaging techniques. c, Representative panel from the Opera Phenix showing 3-color maximum intensity projection from Z-stack acquisition at 10× objective magnification, at the center of the channel overlap area for all 96 devices. Stains shown are α-smooth muscle actin (αSMA) (yellow), collagen 1 (red), and Hoechst 33342 (blue). Experiment depicts concentration response curves (CRC) of human retinal pericytes (RPCs, top half, n = 48) and human hepatic stellate cells (HSCs, bottom half, n = 48) to TGFβ1 with decreasing dose (rows A–B and E–F), 30 ng mL−1 top, half-log dilutions. Rows C–D and G–H were treated with decreasing concentrations of an ALK5 inhibitor tool compound with a constant dose of 1 ng mL−1 TGFβ1. d, Activation and inhibition curves of both conditions (TGFβ activation, n = 24, and ALK5 inhibition, n = 24) for both cell types (RPCs and HSCs) with cell nuclear count, αSMA, and collagen readouts as percent signal of activated controls. e, 20× objective images of HSCs with 10 ng mL−1 (n = 1, marked * in C) and 1 pg mL−1 (n = 1, marked ** in C) treatments quantifying αSMA signal. Image processing sample images from left to right show the analysis sequence that was performed to generate high-content data using a linear classifying algorithm. f, High-content data for both devices imaged in e, showing the percentage of activated cells based on the linear classifier. Error bars represent standard deviations, *p = 0.01. | ||
To demonstrate ability of the MPSA system to provide uniform flow rates for each device, we have measured the pump stroke volumes within and between MPSAs over a period of one month under standard incubator conditions. The average stroke volumes of the 192 micropumps remained stable at 1.31 ± 0.02 μL (ESI† Fig. S11). Details of the variation in stroke volume between individual micropumps in a single MPSA can be found in ESI† Fig. S9 and S10.
In the following sections we will demonstrate the integrated, broad capabilities of this OOC platform by presenting phenotypic data from our liver, vascular, gut/gastrointestinal, and kidney tissue models in a high-throughput format.
Optical access and microfluidic culture plate geometry enable high-content screening
Drug discovery and screening efforts frequently leverage imaging-based high-content screening (HCS) methods, rendering the adoption of OOC technology into the broader life science industry contingent upon compatibility with high-content imaging sytsems.42,43 Here, we demonstrate that the dual microchannel architecture and footprint of our platform is compatible with the standard software and hardware of an HCS system by analyzing our perivascular tissue model response to a pro-fibrotic trigger, transforming growth factor β (TGFβ) (Fig. 2). The MCP was designed with a standard footprint and pitch of a traditional well plate (Fig. 2a). Each inlet and outlet of the 96 devices had a 4.5 mm spacing and were configured such that the cell-seeded membrane was parallel to the imaging slice of a confocal imaging system (Fig. 2b). The 0.25 mm channel height and bottom most material layer were chosen such that fluorescent imaging and laser reflectance Z-positioning could be used. Pericytes were imaged successfully, with good focus and fidelity of images achieved despite the optical path passing through the membrane. Each imaging run in the HCS system generated images from each of the 96 devices for a single field of view across 21 confocal microscopy z-planes using five laser wavelengths, yielding 10![[thin space (1/6-em)]](https://www.rsc.org/images/entities/char_2009.gif) 080 total images in approximately 55 minutes. A 5× objective magnification covered greater than 90% of the channel overlap area, a 10× objective magnification covered ∼33% of the channel overlap area, including the full width from channel wall to wall, and a 20× objective magnification covered ∼10% of the device without capturing the walls in the image. Imaging time was scalable based on number of imaging locations for the 10× objective and 20× objectives and was not substantially different for the MCP compared to a standard 96 well plate.
080 total images in approximately 55 minutes. A 5× objective magnification covered greater than 90% of the channel overlap area, a 10× objective magnification covered ∼33% of the channel overlap area, including the full width from channel wall to wall, and a 20× objective magnification covered ∼10% of the device without capturing the walls in the image. Imaging time was scalable based on number of imaging locations for the 10× objective and 20× objectives and was not substantially different for the MCP compared to a standard 96 well plate.
Standard high-content workflows measure cell numbers based on nuclear count and fluorescence intensity to measure target-of-interest expression. Fluorescent labels were used to perform high-content analysis of the morphology and texture of the cells for use in linear classification. A representative panel (Fig. 2c) at 10× objective magnification and with a 3-color maximum intensity projection showed visible differences in protein expression across human retinal pericytes (RPCs, top half) and human hepatic stellate cells (HSCs, bottom half) to TGFβ dose (decreasing dose rows A–B and E–F). Rows C–D and G–H were treated with decreasing concentrations of an ALK5 inhibitor tool compound with a constant dose of 1 ng mL−1 TGFβ. EC50 curves were generated to elicit the differential TGFβ activation of the two pericyte cell types and IC50 curves were generated to show compound inhibition of TGFβ activation. The resulting curves showed no cytotoxicity in any condition, as indicated by negligible loss of cells in TGFβ and ALK5i treatment conditions (Fig. 2d, blue curves). There was differential TGFβ response between RPC and HSC populations as indicated by the α-smooth muscle actin (αSMA) and collagen EC50 curves in Fig. 2d, first and third graphs. The IC50 curves indicated that ALK5 inhibition of the HSCs and RPCs was different in terms of αSMA staining, but the compound dosing had similar effects on collagen inhibition (Fig. 2d, second and fourth graphs). A linear classifying algorithm was used with parameters from control populations of activated and non-activated cells to analyze the images obtained and processed via the standard Perkin-Elmer software (Fig. 2e). The high content readout performed as expected, quantifying αSMA positive cell populations with sufficient precision to clearly discern between activated and non-activated cells in the high (10 ng mL−1) and low (1 pg mL−1) TGFβ doses, respectively (Fig. 2f).
Collectively, these data demonstrate that our platform is amenable to use on industry-accepted high-throughput, high-content screening/imaging systems, such as the PerkinElmer Opera Phenix, allowing for the adoption and use of the platform in both target-based and phenotypic screening regimes. High-throughput screening in some microfluidic culture platforms is possible,44,45 although only recently demonstrated with high-content screening analysis using a 10× objective magnification objective.46 While OOC can be used with customized or modified HCS strategies,47 our platform leverages the power of existing HCS systems in their intended high-throughput format to analyze whole cells and sub-cellular structures by fitting existing HCS hardware, imaging mechanisms, analysis pipelines, and screening strategies. In addition, it will be ready to be used with new additions to HCS which can quantify genetic and proteomic changes.48 The standard plate-based platform allows for the interaction of existing industry-based liquid handlers and robotics to fit all aspects of the analysis workflow, from seeding through imaging, streamlined and non-disruptive to currently established protocols.
Micro-pump sensor array (MPSA) system's user-controlled flow enhances tissue function
Fluid flow is known to drive tissue function through several mechanisms; examples include uni-directional flow for mechanobiological signalling in endothelial cells,49–51 and perfusion to maintain tissue homeostasis by controlling gradients of nutrients, oxygen, and waste.52,53 These mechanisms require an actively pumped system to control flow. Herein we demonstrate that the MPSA system is capable of providing uni-directional flow regimes ranging from low perfusion flow to high FSS flow and that these flow regimes directly affect tissue function.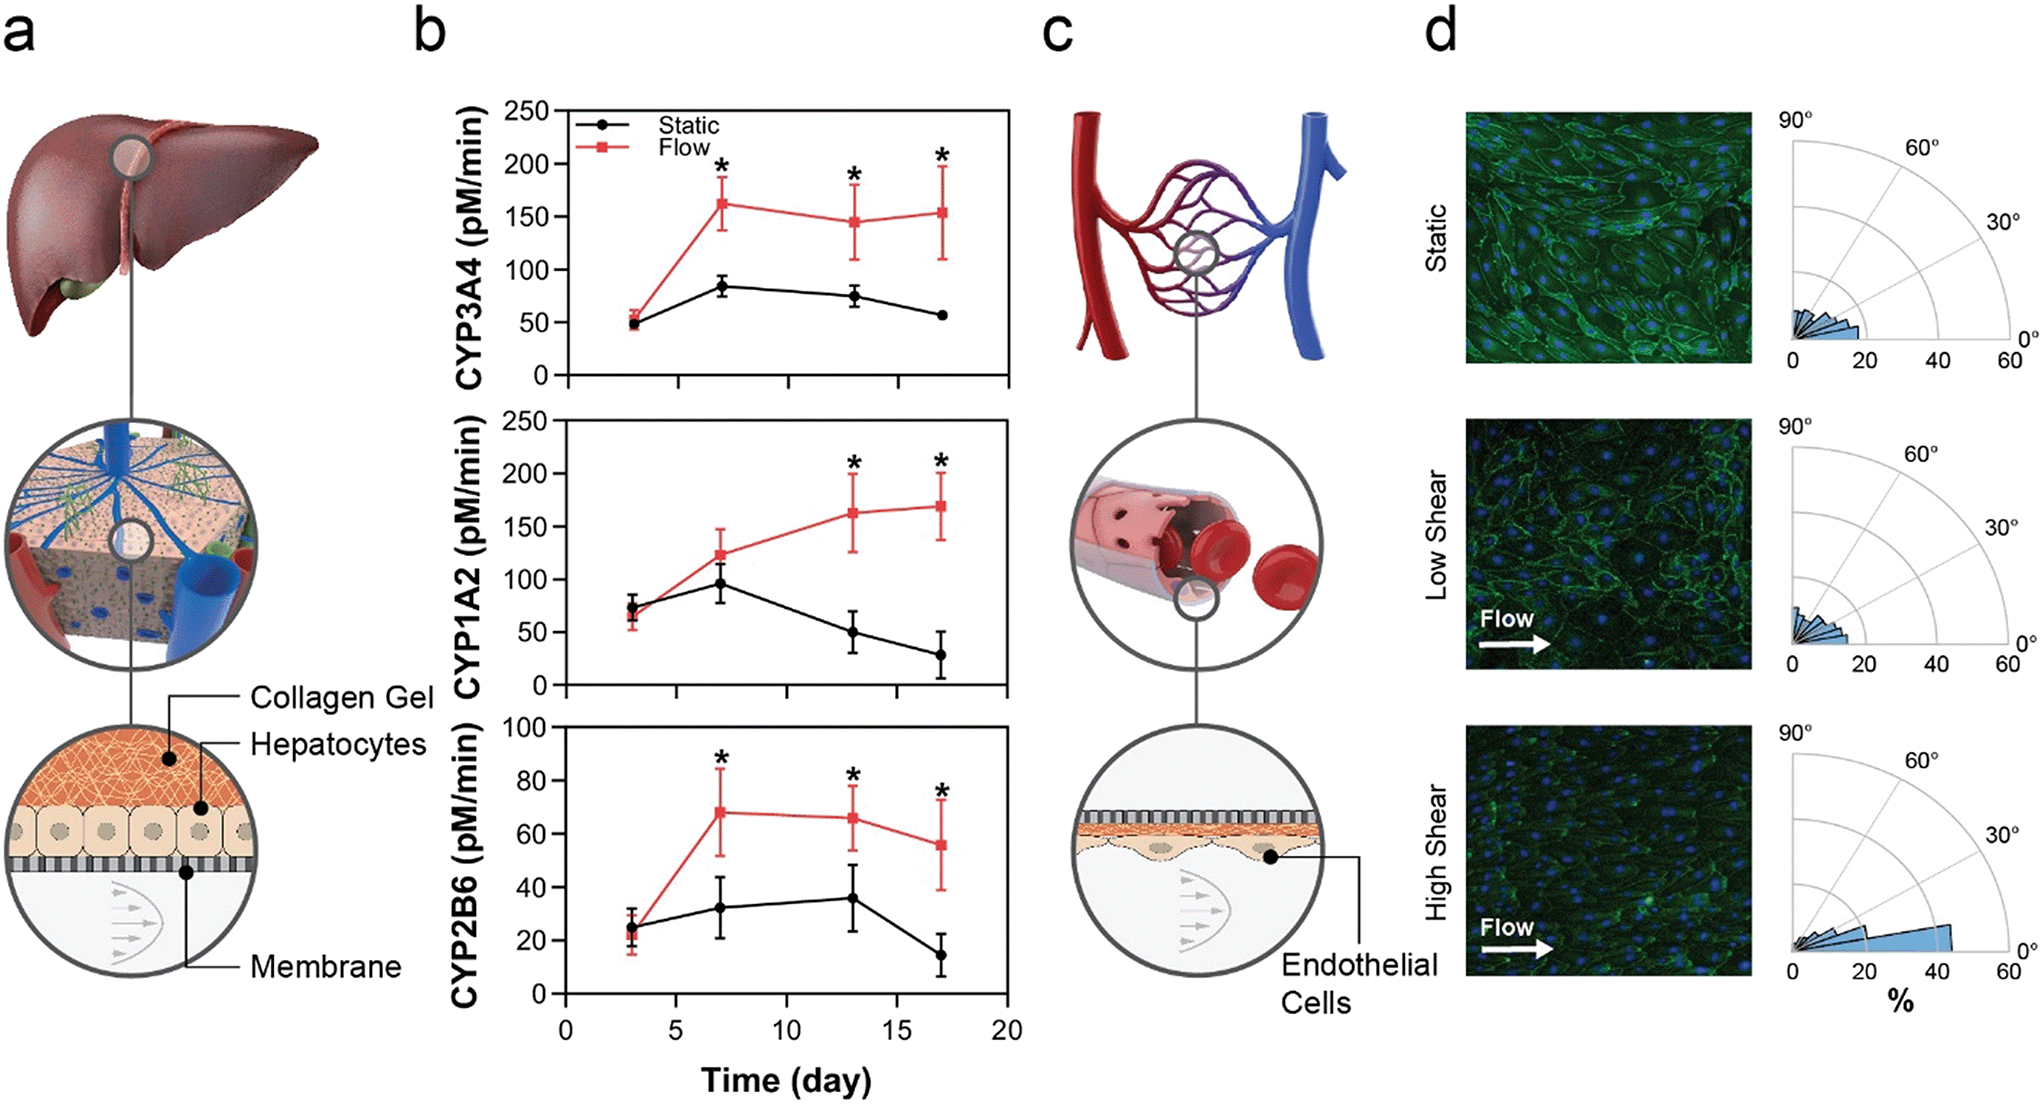 | ||
| Fig. 3 Physiologically relevant fluid flow regimes alter tissue function and structure the platform. a, Primary human hepatocytes were configured in the MCP in a sandwich culture while the MPSA was able to supply perfusion flow to the bottom microchannel. b, Longitudinal activity of CYP3A4, CYP1A2, and CYP2B6 in hepatocyte cultures under either static or recirculating steady media flow (50 μL h−1) conditions, administered beginning d3 in culture. *p < 0.05, flow vs. static, N = 16 replicates per data point. c, Primary human endothelial cells were cultured in the bottom microchannel of the MCP devices and exposed to FSS using the large stroke volume MPSA, with N = 3 for each condition. d, Representative images of endothelial monolayers stained for Hoechst (blue) and ZO-1 (green) for static (top), low (middle), and high fluid shear stress (bottom). Orientation of cell nuclei between 0–90° was calculated relative to the direction of flow, with 0° indicating parallel alignment. | ||
By extending the timeline of tissue function in vitro, this platform affords a wider test window and enables chronic disease investigation. While we have previously demonstrated that flow in our platform augments hepatocyte health and CYP activity,36 this study extends the effects of flow to hepatocytes qualified for transporter function but not qualified for ability to plate, which would render them difficult to use in OOC or other systems that require cell attachment. The filter-seeding technique enabled by the custom MCP allows the user to apply pressure across the membrane that resulted in adhesion of a PHH lot that was not selected for adhesion. This seeding method is in contrast to the standard MCP design, in which the user leverages hydrostatic pressure gradients to drive cells into the channel, resulting in cells settling onto the membrane by gravity. Given the significant number of human hepatocyte lots that are deemed difficult to use due to inability to plate, often the case for those sourced from diseased livers, this platform allows the potential use of a large contingent of previously untapped cell sources for drug discovery, toxicity and efficacy testing.
Endothelial cells sense flow via mechano-sensing mechanisms, such as the PECAM-1/VEGFR2/VE-cadherin complex.59,60 Acknowledging that responses are EC subtype-specific, low FSS, defined here as less than 1.5 dyn cm−2, typically induces inflammatory or other pathological responses in endothelial cells,61 whereas physiologic FSS, defined as 7–15 dyn cm−2 in many in vitro systems, leads to cell-body and nuclear elongation, improved barrier function, and reduced inflammatory marker expression.58,62,63 Higher-order cell functional changes can be inferred from endothelial cell elongation and orientation, which are standard metrics of EC function under FSS conditions.64 These changes require a uni-directional flow of high enough sheer rate to be physiological, requiring an actively pumped system. Here, the changes in those standard metrics, which were appropriate for low and high FSS, show the ability of the pump system to generate flows and consequent tissue responses spanning diseased through healthy tissues for a range of endothelial subtypes.
Integrated sensing non-invasively monitors tissues in real-time
Real-time measurements allow investigators to optimize tissue performance, serve as a quality control metric, and examine mechanistic kinetics to gain a deeper understanding of tissue response to a number of factors. The integration of sensors enabled the non-destructive collection of data in a high-throughput format while minimizing disruption of environmental conditions and offering sampling rates sufficiently high to study dynamic behaviours.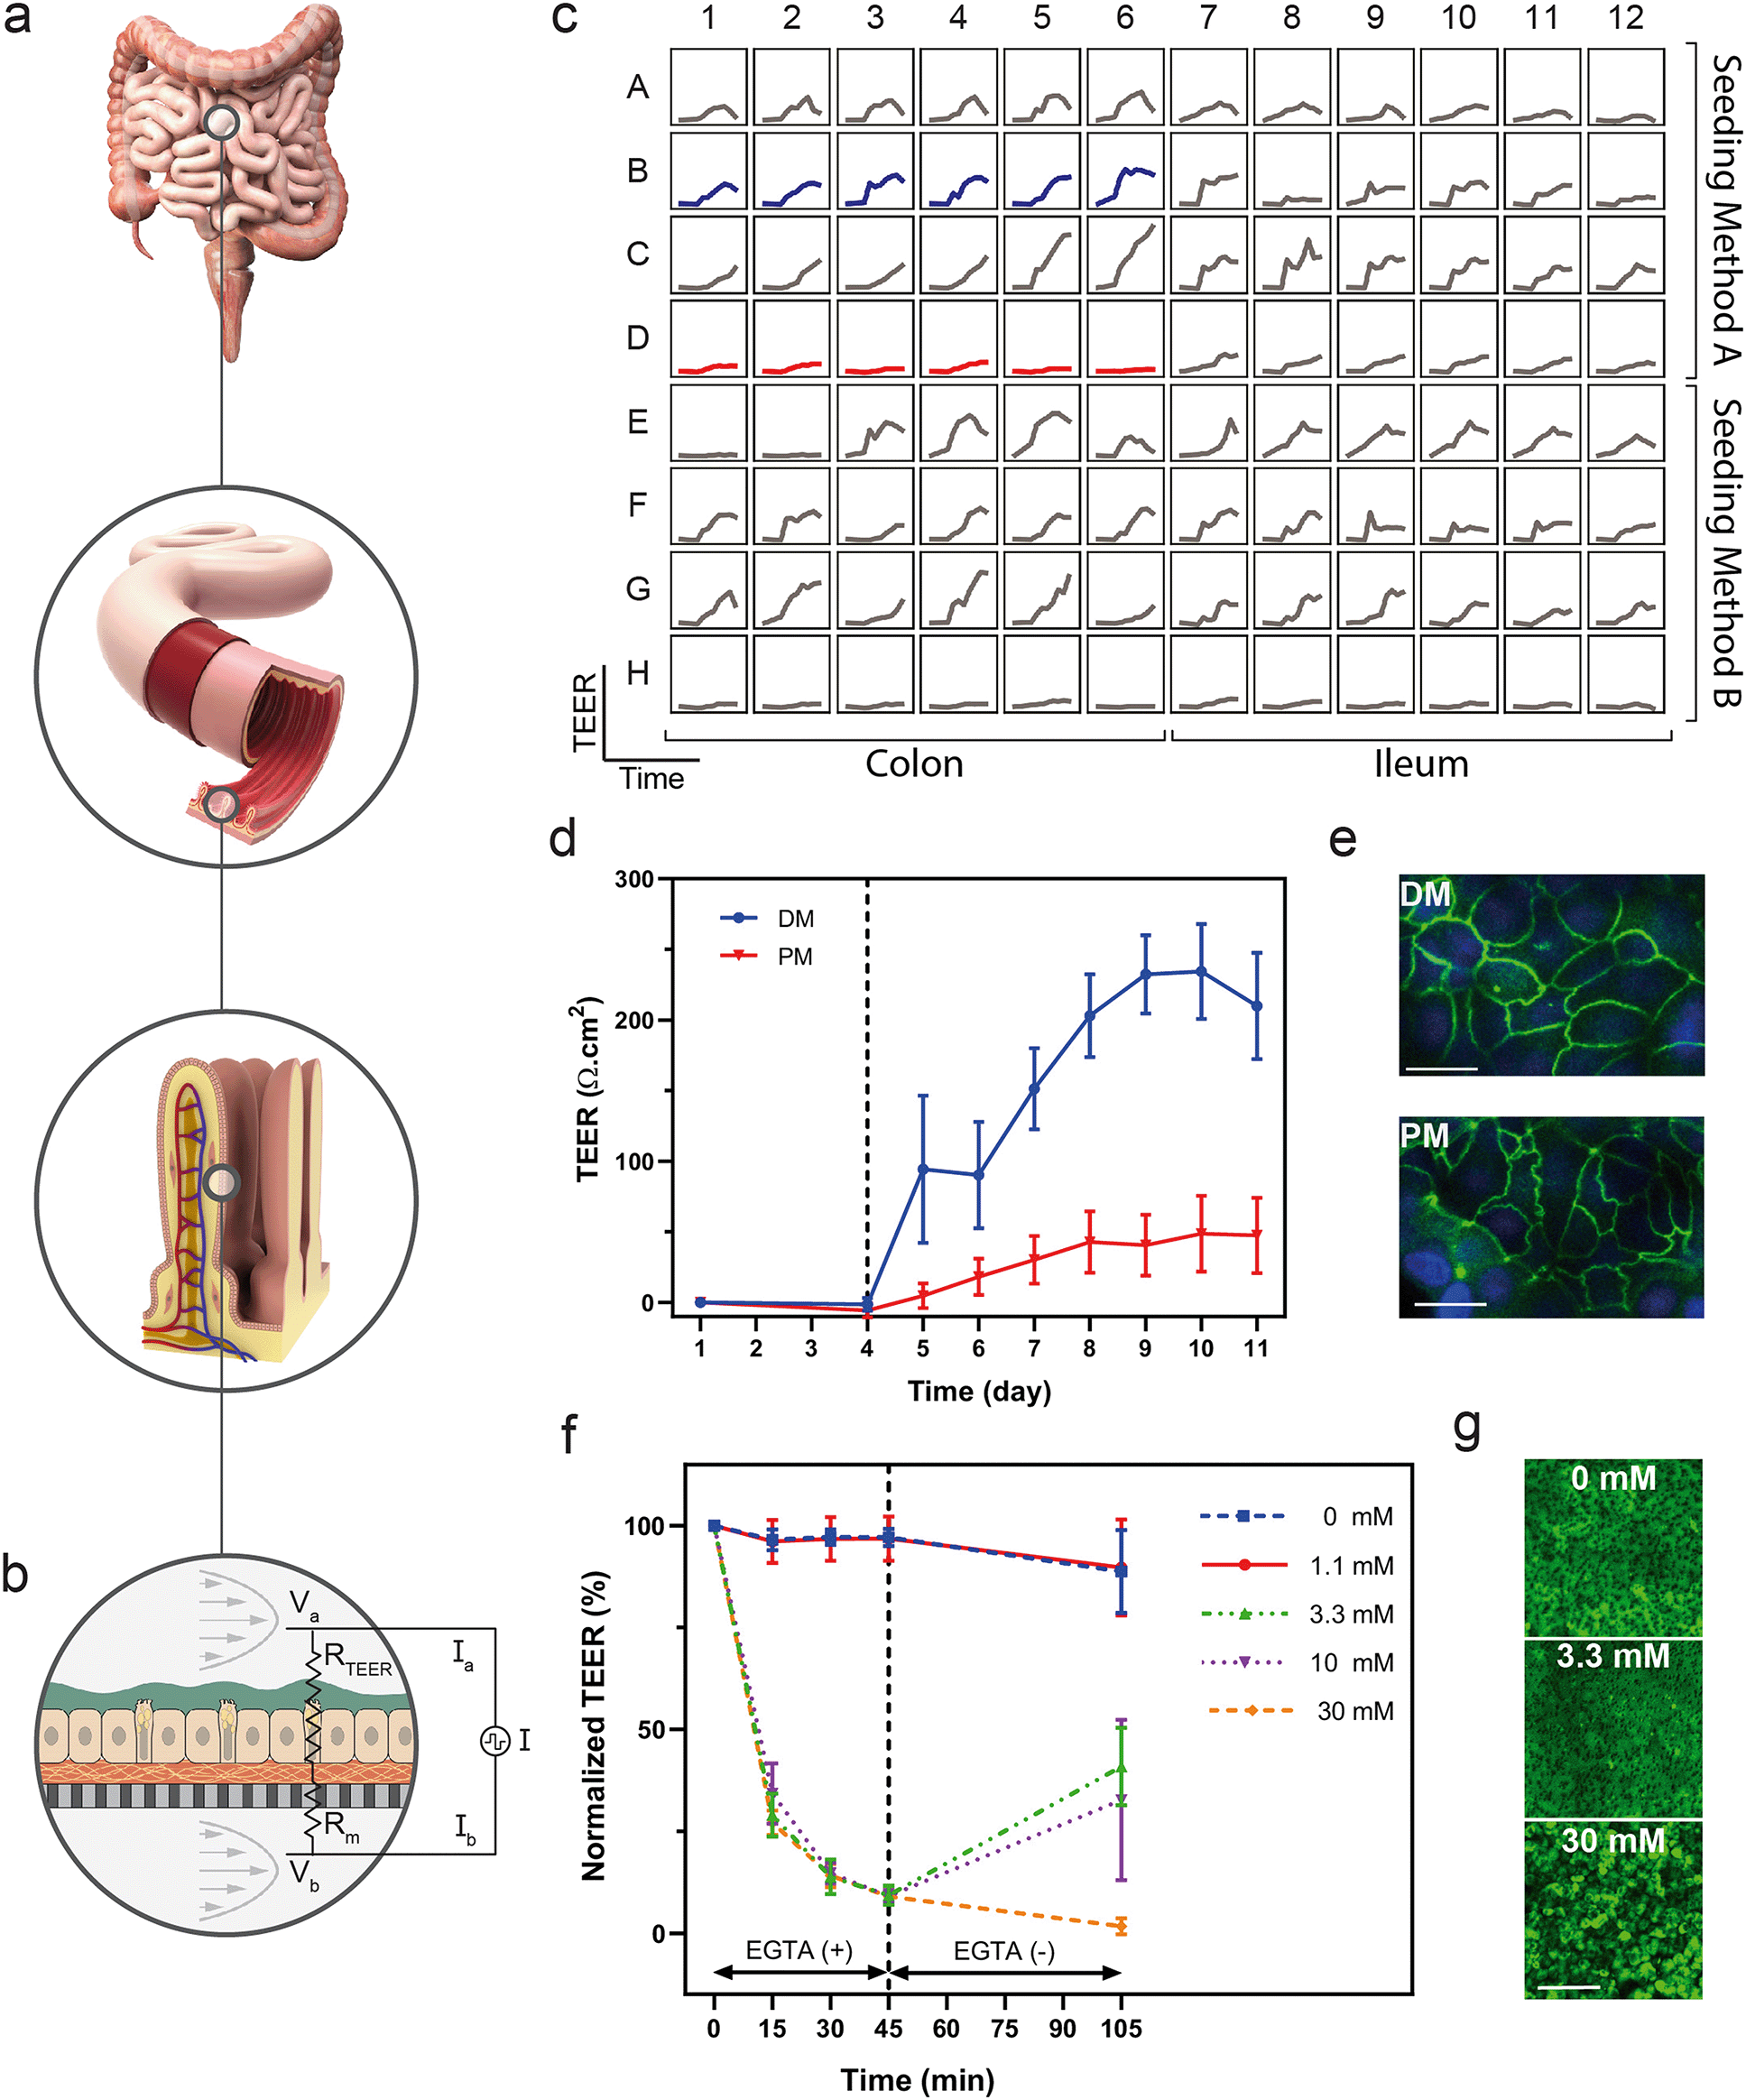 | ||
| Fig. 4 Arrayed electrical sensing measures epithelial barrier function. a, In vivo, the intestinal epithelium provides a tight barrier that protects from luminal contents as well as controlling uptake of water and nutrients. b, Intestinal epithelial cell monolayers were grown in the MCP to quantify long-term and near real-time barrier function using four-point electrical resistance measurements. c, The MCP contained an experimental optimization matrix, which was designed to investigate TEER trends over time for 16 conditions, including two tissue types (left half, right half), two seeding methods (top half, bottom half) and four media types (A–D, E–H). d, Optimization led to selection of two conditions from those in c, TEER shown for the selected conditions in primary colon monolayers over 11 days post-seeding, where differentiation was induced on day 4 (dotted line), n = 5, DM; n = 6, PM. Error bars represent standard deviation from the mean. e, Cytoskeletal organization characterized by anti-zona occludens (ZO-1) immunofluorescence, comparing cells grown in DM (top) against those grown in PM (bottom). Scale bar represents 20 μm. f, Normalized TEER with respect to t0 = EGTA administration for primary intestinal colon monolayers treated with various doses of EGTA over 45 minutes, followed by wash out (dotted line) and 60 minute recovery period. Error bars represent standard deviation from the mean, n = 4 per group. g, Calcein AM viability stain of cells in devices visualized 4 hours post treatment. Scale bar represents 200 μm. | ||
In addition to daily TEER measurements, we used the integrated TEER system to measure changes in barrier integrity over short time intervals in order to observe the kinetics of tissue response to an insult. We disrupted colon epithelial monolayers with doses of EGTA, a calcium chelator known to disorder intercellular junctions between epithelial cells.69,70 Quantification of TEER over time indicated a decrease in barrier function in response to EGTA exposure, as well as a dose-dependent recovery of barrier function upon reintroduction of calcium-containing medium (Fig. 4f). To correlate TEER with barrier function and the state of the cells, we stained cultures with calcein AM to visualize monolayers after the treatment and recovery period. The monolayers treated with 30 mM EGTA contained rounded cells that were disconnected and non-confluent, while those treated with the 3.3 mM EGTA partially recovered their TEER values and had morphology similar to those in the untreated devices (Fig. 4g).
Although integration of TEER in culture systems has been demonstrated previously,17,71–73 few have integrated TEER for a high-throughput cell culture array, highlighting both the need and the apparent difficulty in developing such a system. Previously, TEER has been measured daily in a Caco-2 cell line in a 40-replicate OOC with rocker plate-induced flow.74 Here, we have integrated the TEER system into a programmable, actively-pumped OOC, such that each of the 96 devices can be sampled in near real-time enabling in situ measurements that do not perturb the tissue. Colon tissue differentiated from primary human colon cells demonstrated the ability to characterize differentiation in a human-relevant model system using longitudinal TEER measurements. In addition, measuring TEER at a sampling rate on the order of minutes enabled evaluation of acute changes in barrier function and kinetics of the dosing and recovery responses. The integrated TEER sensors provided a non-destructive, near real-time measurement of barrier integrity that correlated to differentiation and barrier damage, while the overall platform enabled development of human-derived and donor-specific colon tissue models. Although used only for TEER here, the electrical probes of the TEER system could potentially be used to perform impedance spectroscopy quantifying electrical properties including capacitance and inductance, apply electrical stimulation, or integrate further biochemical detection by tethering functional chemistries to their surfaces.
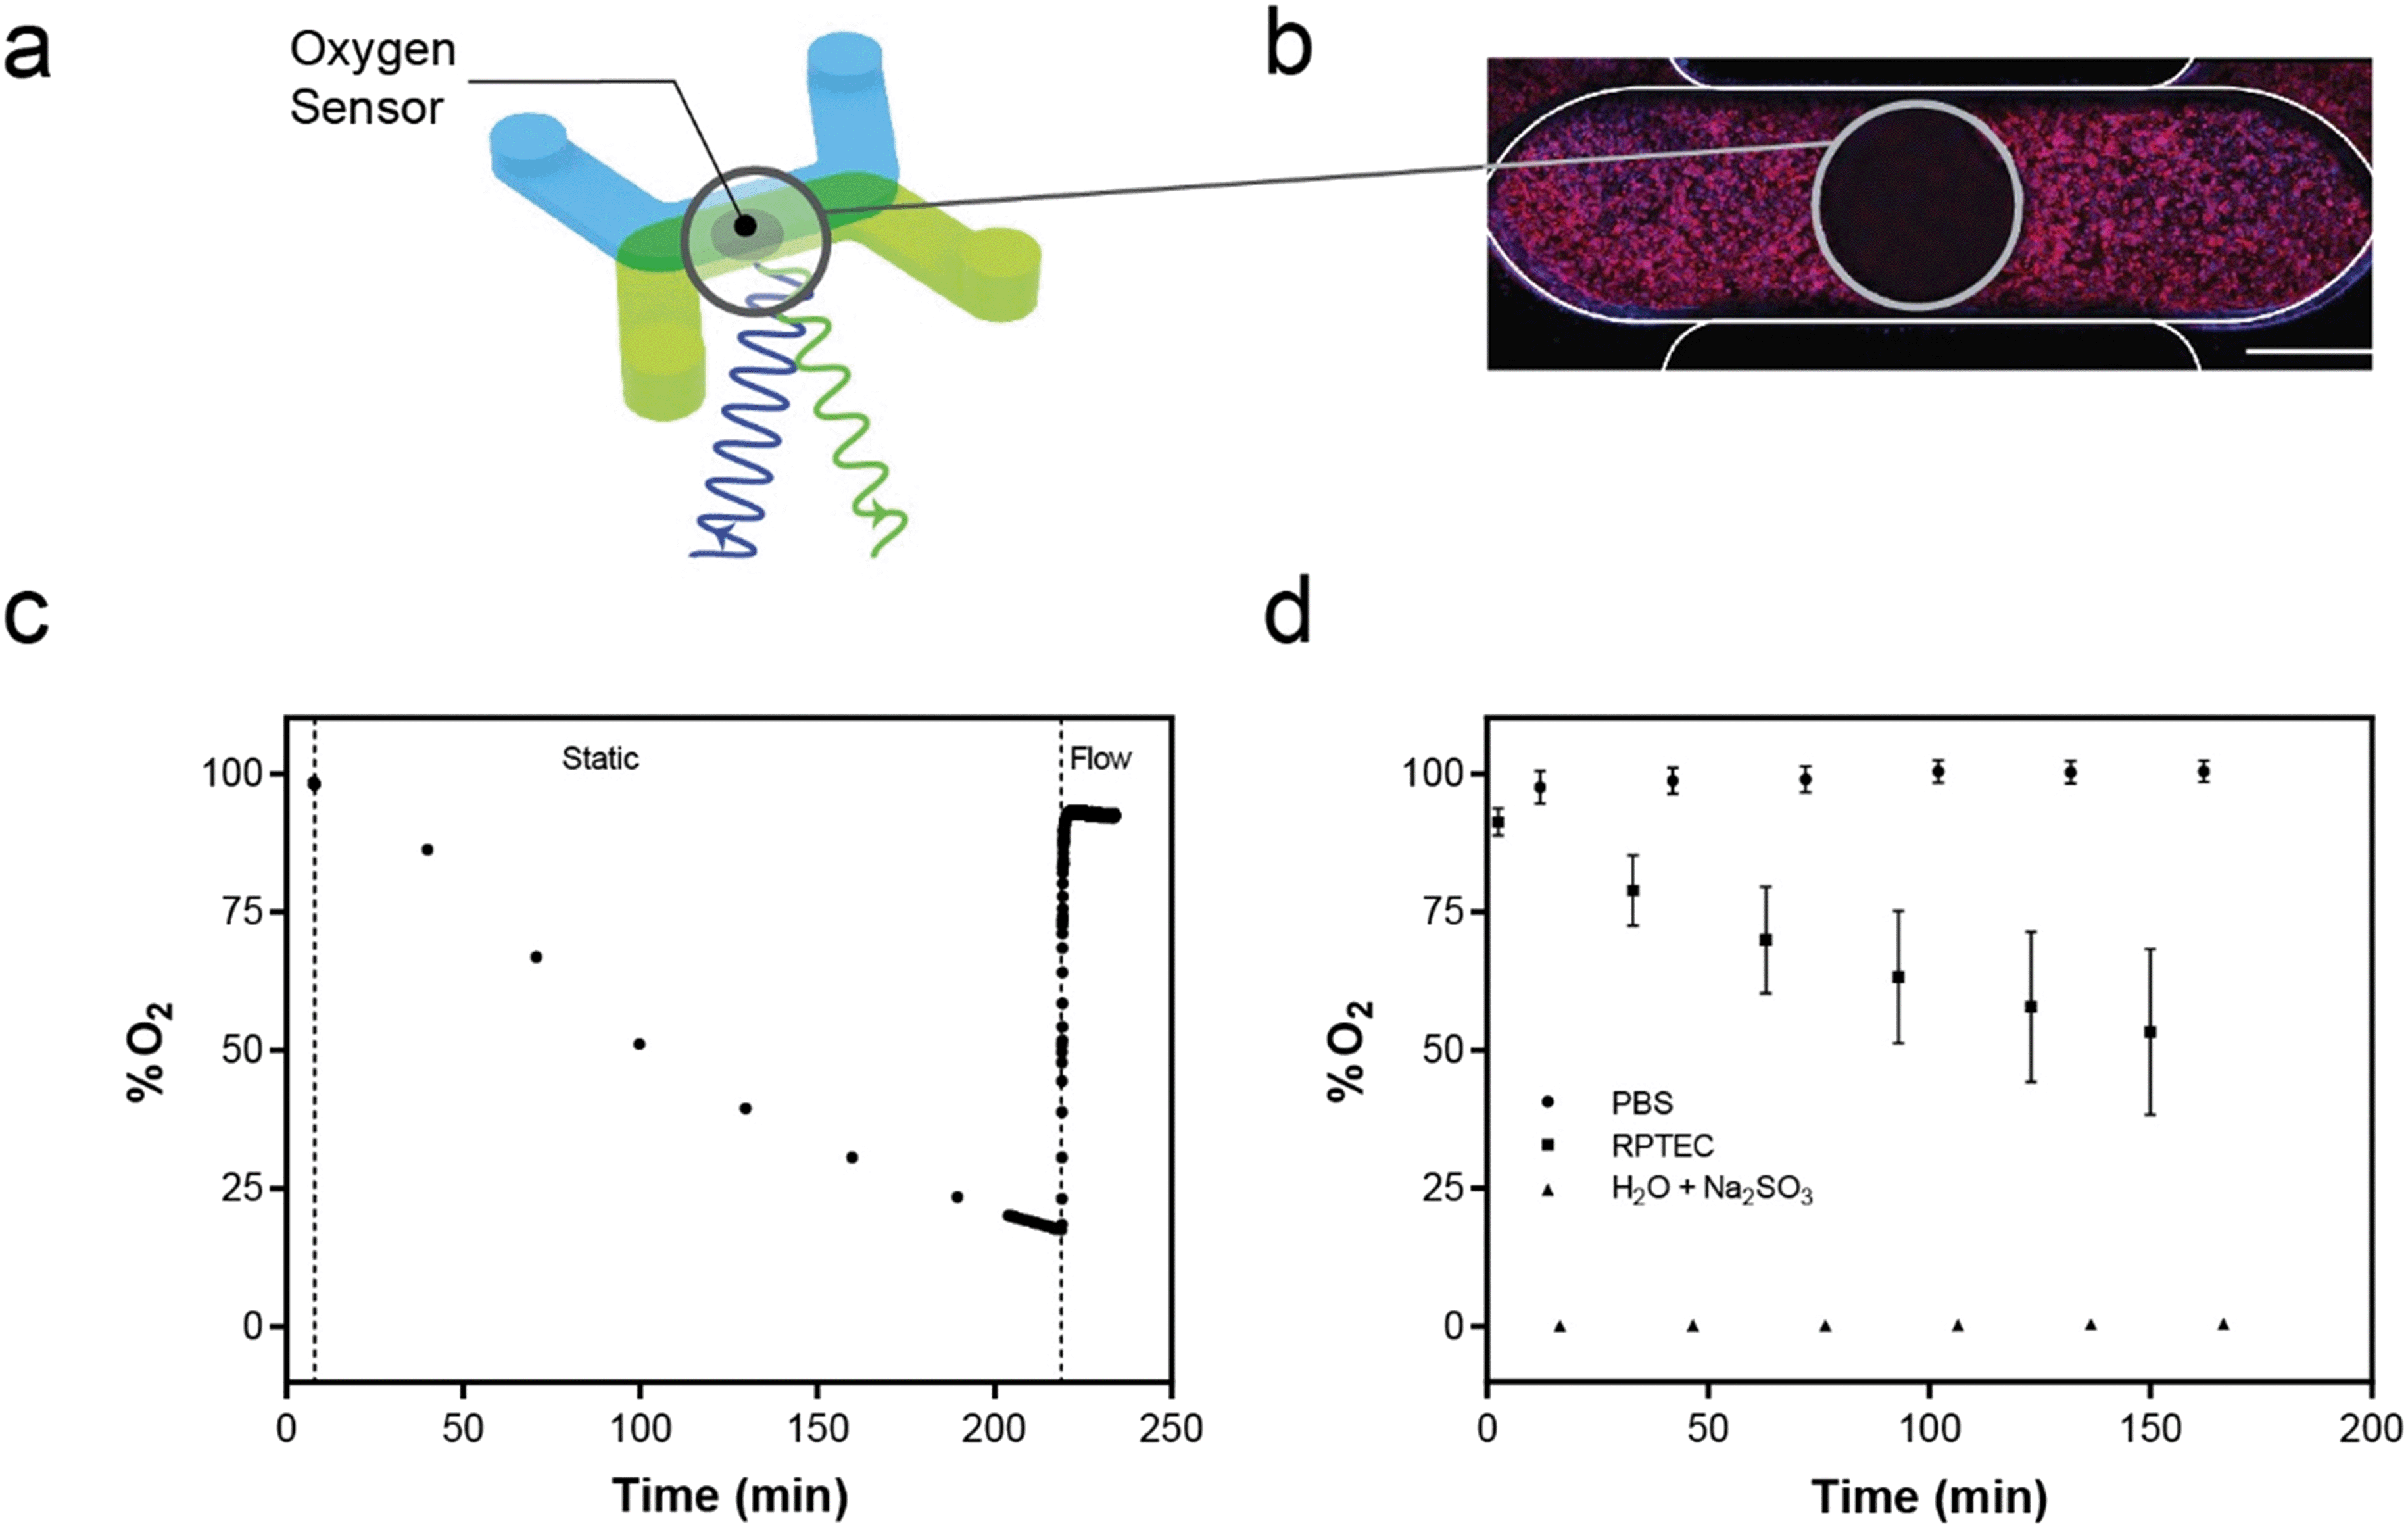 | ||
| Fig. 5 Oxygen sensors integrated into the platform detect oxygen concentration in near real-time. a, The O2 sensor spot, made from a photosensitive material, resides on the floor of the bottom microchannel of each of the devices in the MCP. The spot is interrogated with 620 nm wavelength and detected at 775 nm. b, hRPTEC stained with actin (red) and nuclei (blue) are visible on the membrane in the upper channel. The 0.75 mm diameter sensor spot obscures the signal from the cell staining and is seen as a dark circle. Scale bar = 0.5 mm. c, RPTECs cultured in a single device can consume over 75% of saturated oxygen levels over 220 minutes of static culture, which is triggered when the MSPA is shut off (first dotted line). Turning the MSPA back on (second dotted line) resulted in the relative O2 concentration returning to 93% oxygen saturation. d, The average oxygen saturation level read by the integrated oxygen sensors were plotted for devices with PBS only (circle plot, N = 60), hRPTEC monolayers (square plot, N = 27), or water and sodium sulfite (triangle plot, N = 4) under static conditions. PBS alone retained 100% saturation O2 concentration over 160 minutes. The presence of hRPTEC in the microchannel reduced relative O2 concentration 46% over the same period. Sodium sulfite solution maintained a 0% O2 concentration. Error bars represent standard deviations. | ||
While several groups have reported measuring oxygen in microfluidic tissue culture devices,21,75–79 such systems did not integrate the sensors into a high-throughput format. The commercial Agilent Seahorse XFe96 Analyzer measures oxygen consumption rate for traditional 96 wellplates80 but does not directly integrate with microfluidic OOC devices or allow for fluid flow. We have demonstrated we can measure the tissue oxygen environment in near real-time for each device in the MCP as well as maintain the oxygen saturation levels with fluid flow generated by the MFSP. While demonstrated here with hRPTECs, the ability to measure oxygen levels in the system and modulate delivery of oxygen via fluid flow enables environmental consistency despite cell-specific consumption rates. The integration of the oxygen sensing hardware with a standard microscope equipped with an incubation chamber enables control and maintenance of the culture environment during oxygen measurements, as well as the ability to conduct live cell imaging for multiplexed readouts from tissue samples. Our demonstration of optical access opens up opportunities to integrate additional optically-interrogable sensors to quantify other entities beyond oxygen. Optically-based sensors exist for pH, ions, glucose and other small entities whose transport to an optical sensing chemistry can be controlled via selectively permeable polymer membranes.81–84 The platform could be expanded to these entities instead of or in addition to the oxygen sensors, yielding a multi-faceted label free readout of the culture conditions.
Device design enables quantification of drug-modulated active epithelial transport
Active transport of water and solutes, a main function of the kidney proximal tubule (Fig. 6a), influences drug toxicity and excretion. Here, we used the platform's optical access and low dilution volume to measure active transport across a kidney reabsorptive barrier. Primary human proximal tubule epithelial cells (hRPTEC) on the bottom of the membrane in the lumen microchannel and human microvascular endothelial (hMVEC) cells on top of the membrane in the vascular microchannel formed a co-culture (Fig. 6b) of proximal tubule-like barrier tissue, as demonstrated previously in a single unit OOC.85 Under perfusion conditions, the barrier function reached an average of 19 Ω* cm2 by day 3 and remained relatively constant until day 9. Monolayers of hRPTEC expressed significant organic anion transporter 1 (OAT1) (Fig. 6c) comparable to levels in the control hRPTEC TERT1 cell line, which constitutively expresses OAT1 (Fig. 6d). We introduced the fluorescent OAT1 substrate 6-carboxyfluorescein (6-CF) into the vascular microchannels, then quantified the amount of 6-CF transported into the lumen microchannels using real-time imaging. Fig. 6e–g depicts the intensity of 6-CF in the lumen channel for the three conditions tested, as seen through a 20× microscope objective, with average intensity plotted in Fig. 6h. Devices with untreated cells on membranes had 30% lower intensity of 6-CF in the lumen microchannel when compared to devices with no cells on membranes, indicating the passive blocking of transport by the cells combined with some active transport. Probenecid treated cells on membranes had 6-CF levels 60% lower in the lumen microchannel than devices with no cells on membranes, in a manner consistent with active transport inhibition by probenecid,86,87 and reflecting both passive blocking of transport and a blockage of the active transport via OAT1.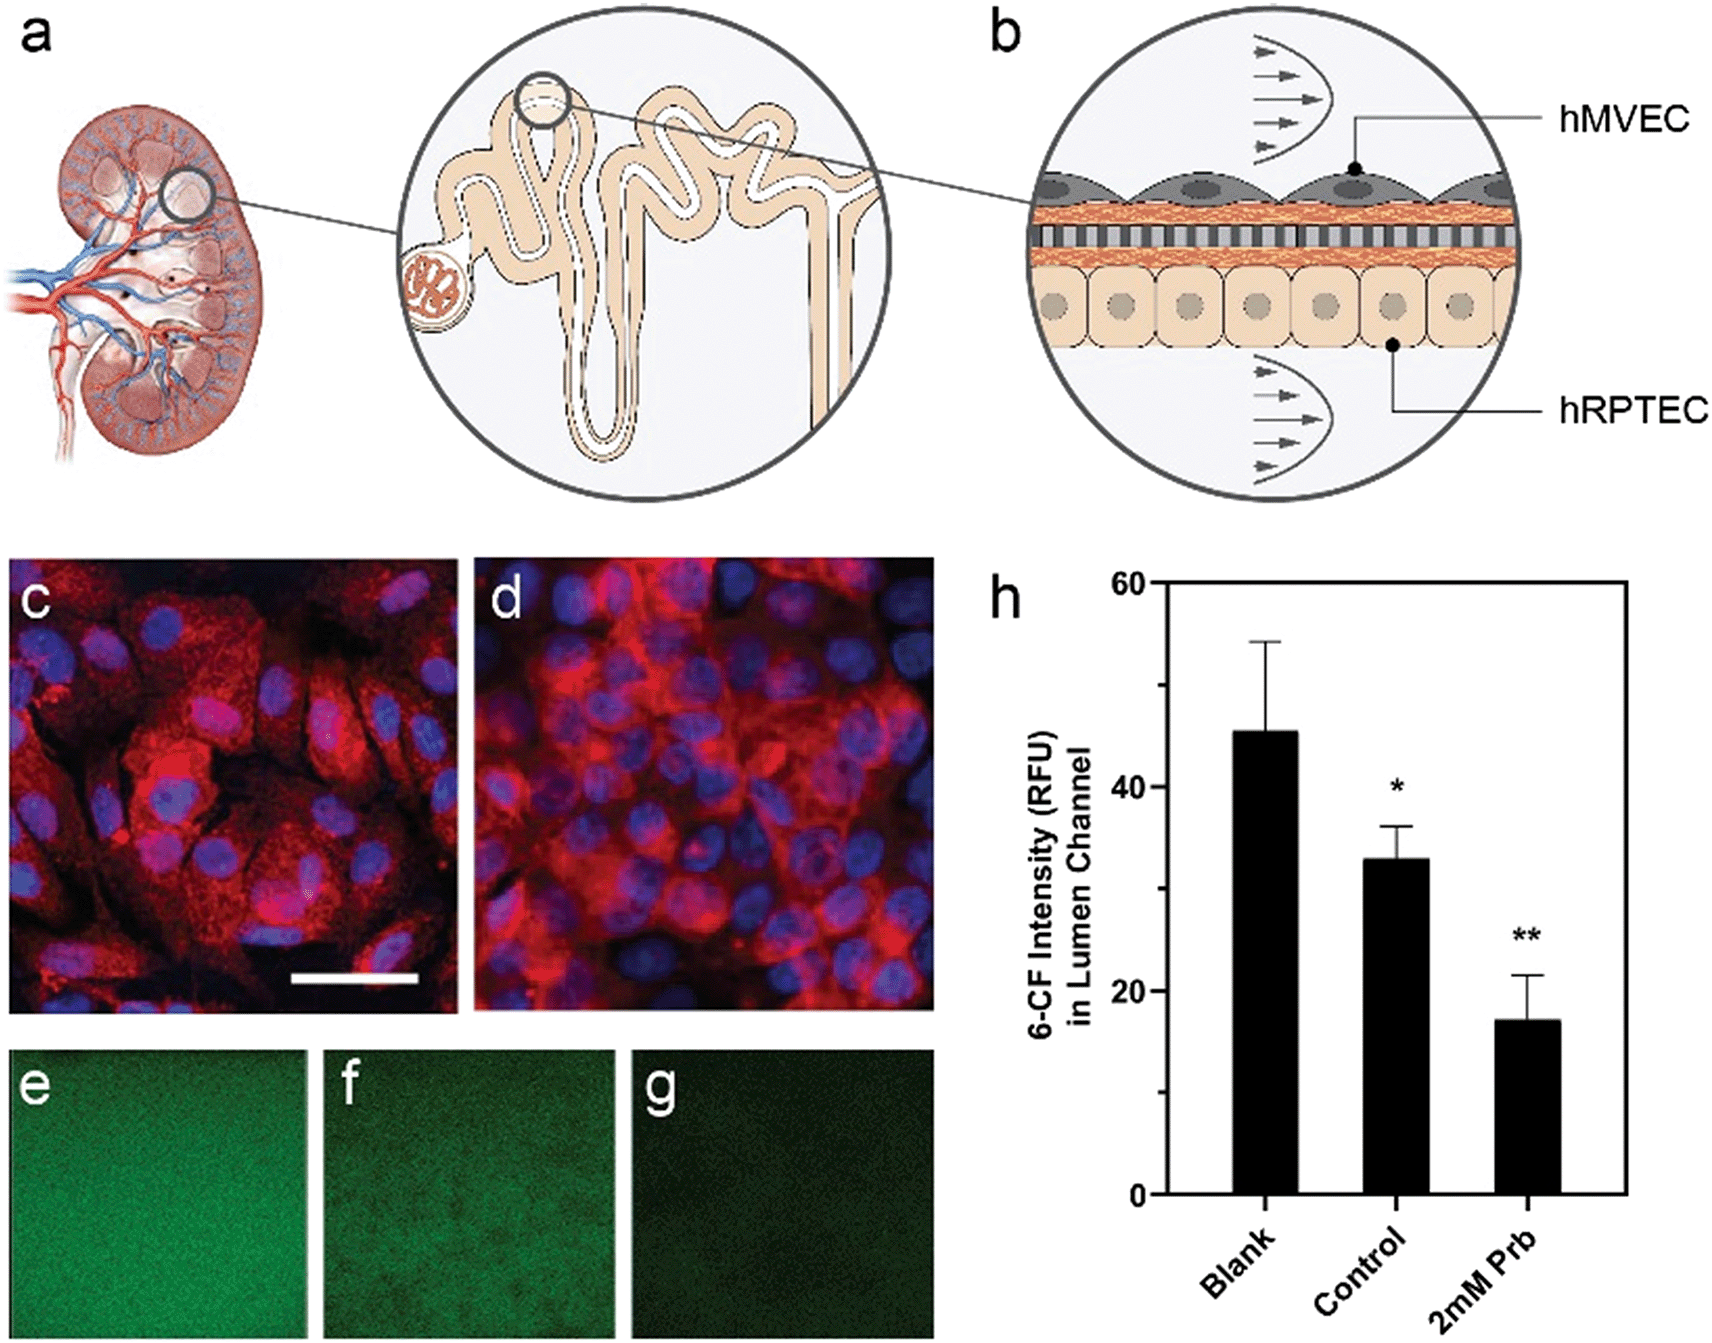 | ||
| Fig. 6 Active transport can be directly quantified for a transport assay of the renal organic anion transporter 1 (OAT1). a, The renal proximal tubule is responsible for the majority of active transport in the kidney. b, hMVEC and hRPTEC were cultured on opposite sides of the membrane to form a complete reabsorptive barrier model. c, hRPTEC and d, an hRPTEC/TERT1 cell line with stable expression of human OAT1 solute carrier (SLC) cultured in the platform stained for OAT1, red, and nuclei, blue, indicating presence of the OAT1 transporters. Scale bar represents 50 μm. e–g, The intensity of fluorescent substrate, 6-CF, of OAT1 was quantified in lumen microchannels in blank (e, no cells), control (f, cells without probenecid) or 2 mM Prb (g, cells treated with probenecid) conditions using confocal z-stack and time-lapse microscopy. h, The bar graph shows the average fluorescent intensity of 6-CF in the lumen channel of devices and shows the significant reduction of active transport due to probenecid administration. Data are from 3 device replicates. Error bars represent standard deviation, *p = 0.02 with respect to blank, **p < 0.009 with respect to control. | ||
Measuring active or passive transport across in vitro tissue cultures can be challenging as a result of the dilution effects from relatively high media volumes to cell numbers.88,89 The MCP microchannel design results in a 1 μL microchannel volume which is small enough such that small changes in transport can be detected as measurable changes in concentration. The ratio of media volume to a cell is about 100 pL per cell in the microchannel, which is within an order of magnitude of in vivo ratios (60 pL per cell)90 and significantly less dilute than a 96-well transwell, where 16000 pL per cell is expected from a typical seeding of 100000 cells per cm2 in an insert with 0.235 mL of cell culture media. Here, we take advantage of the low media volume to cell ratio to analyze transport via OAT1 in kidney proximal tubule cells. OAT1 is expressed in almost all epithelial barrier tissues in the body,91 but expression levels of OAT1 are the highest in the kidney, with localization in the basolateral membrane of proximal tubules.92 In the platform, the active transport of 6-CF, from the vascular channel to the luminal channel was optically tracked and analyzed in real-time, demonstrating the in vitro recapitulation of a physiologically relevant in vivo transport mechanism. The measurable yet incomplete reduction in 6-CF transport due to presence of cells on the membrane and further reduction due to the inhibitor indicated that 6-CF was impeded by a combination of passive paracellular and active transcellular/drug-modulated pathways. More dilute culture systems, like transwells, may necessitate use of cells with significantly reduced paracellular leak, which will limit cell selection93,94 and may not represent physiology of the tissue in vivo.95 The format of our platform enabled the use of the desired cell type, flow-conditions to culture a multi-cell barrier over 7 days, and a quality check assessment of tissue barrier quality via integrated TEER to enable a quantitative measure of the active transport of substrates. The result is a demonstration of a functional response of tissue to a drug in vitro using primary cells.
Microchannels allow cell extraction for transcriptome analysis via RNA-seq
RNA-seq provides researchers with broad and unbiased profiles of the transcriptional states of cell populations, and is routinely used in multiple stages of drug discovery.96 To demonstrate compatibility of our platform with RNA-seq, we seeded triplicates of retinal pericytes (RPCs) and retinal microvascular endothelial cells (RMVECs) into separate devices for six days of culture, removed them from the devices and sequenced total mRNA. Ability to distinguish between the two cell types based on mRNA expression of marker genes would indicate compatibility with the RNA-seq technique. At least 5 ng of RNA was collected from each device microchannel with at least RINe 7. The quantity and quality of the extracted RNA allowed each device to be analyzed separately as opposed to pooling samples. Principal component analysis was able to clearly separate samples based on their cell types, as seen in Fig. 7a. Variance among replicates increased with the longer starvation condition, shown in the wider spread of the 24 h data with respect to PC2. A linear model was fit to transcript counts to measure differential expression between experimental conditions, and statistical significance was determined using a Wald test. Global differences between the RPC and RMVEC populations were visualized using an MA plot (Fig. 7b). Estimation of transcript counts correlated well between experimental replicates. Higher variance was observed at lower absolute counts, which is common for RNA-seq data, shown as a comparison between two experimental replicates (Fig. 7c). Each experimental replicate was a separate seeding of a unique MCP. Slight fabrication differences between devices within each MCP contribute to the technical variance observed in the experiment. To determine the effect of this added technical variance on the ability to measure differential expression, total variance was compared between cell types and culture conditions for the relatively lowly-expressed transcript NM_018057.6 of the amino acid transporter SLC6A15 (Fig. 7d). The transporter SLC6A15 was chosen since its low expression levels would be influenced more than more highly expressed transcripts by the added technical variance of the MCP variation, making this a relatively stringent test. Total variance between seeding replicates is shown along the x-axis. Quantification bootstraps were used to estimate the technical component of the variance and are plotted along the y-axis for each replicate. Despite the added technical variance from the MCPs, differential expression could clearly be observed between the RPC and RMVEC cell types for this lowly-expressed transcript. The top differentially-expressed transcripts between the cell types are easily visualized using a heat map (Fig. 7e).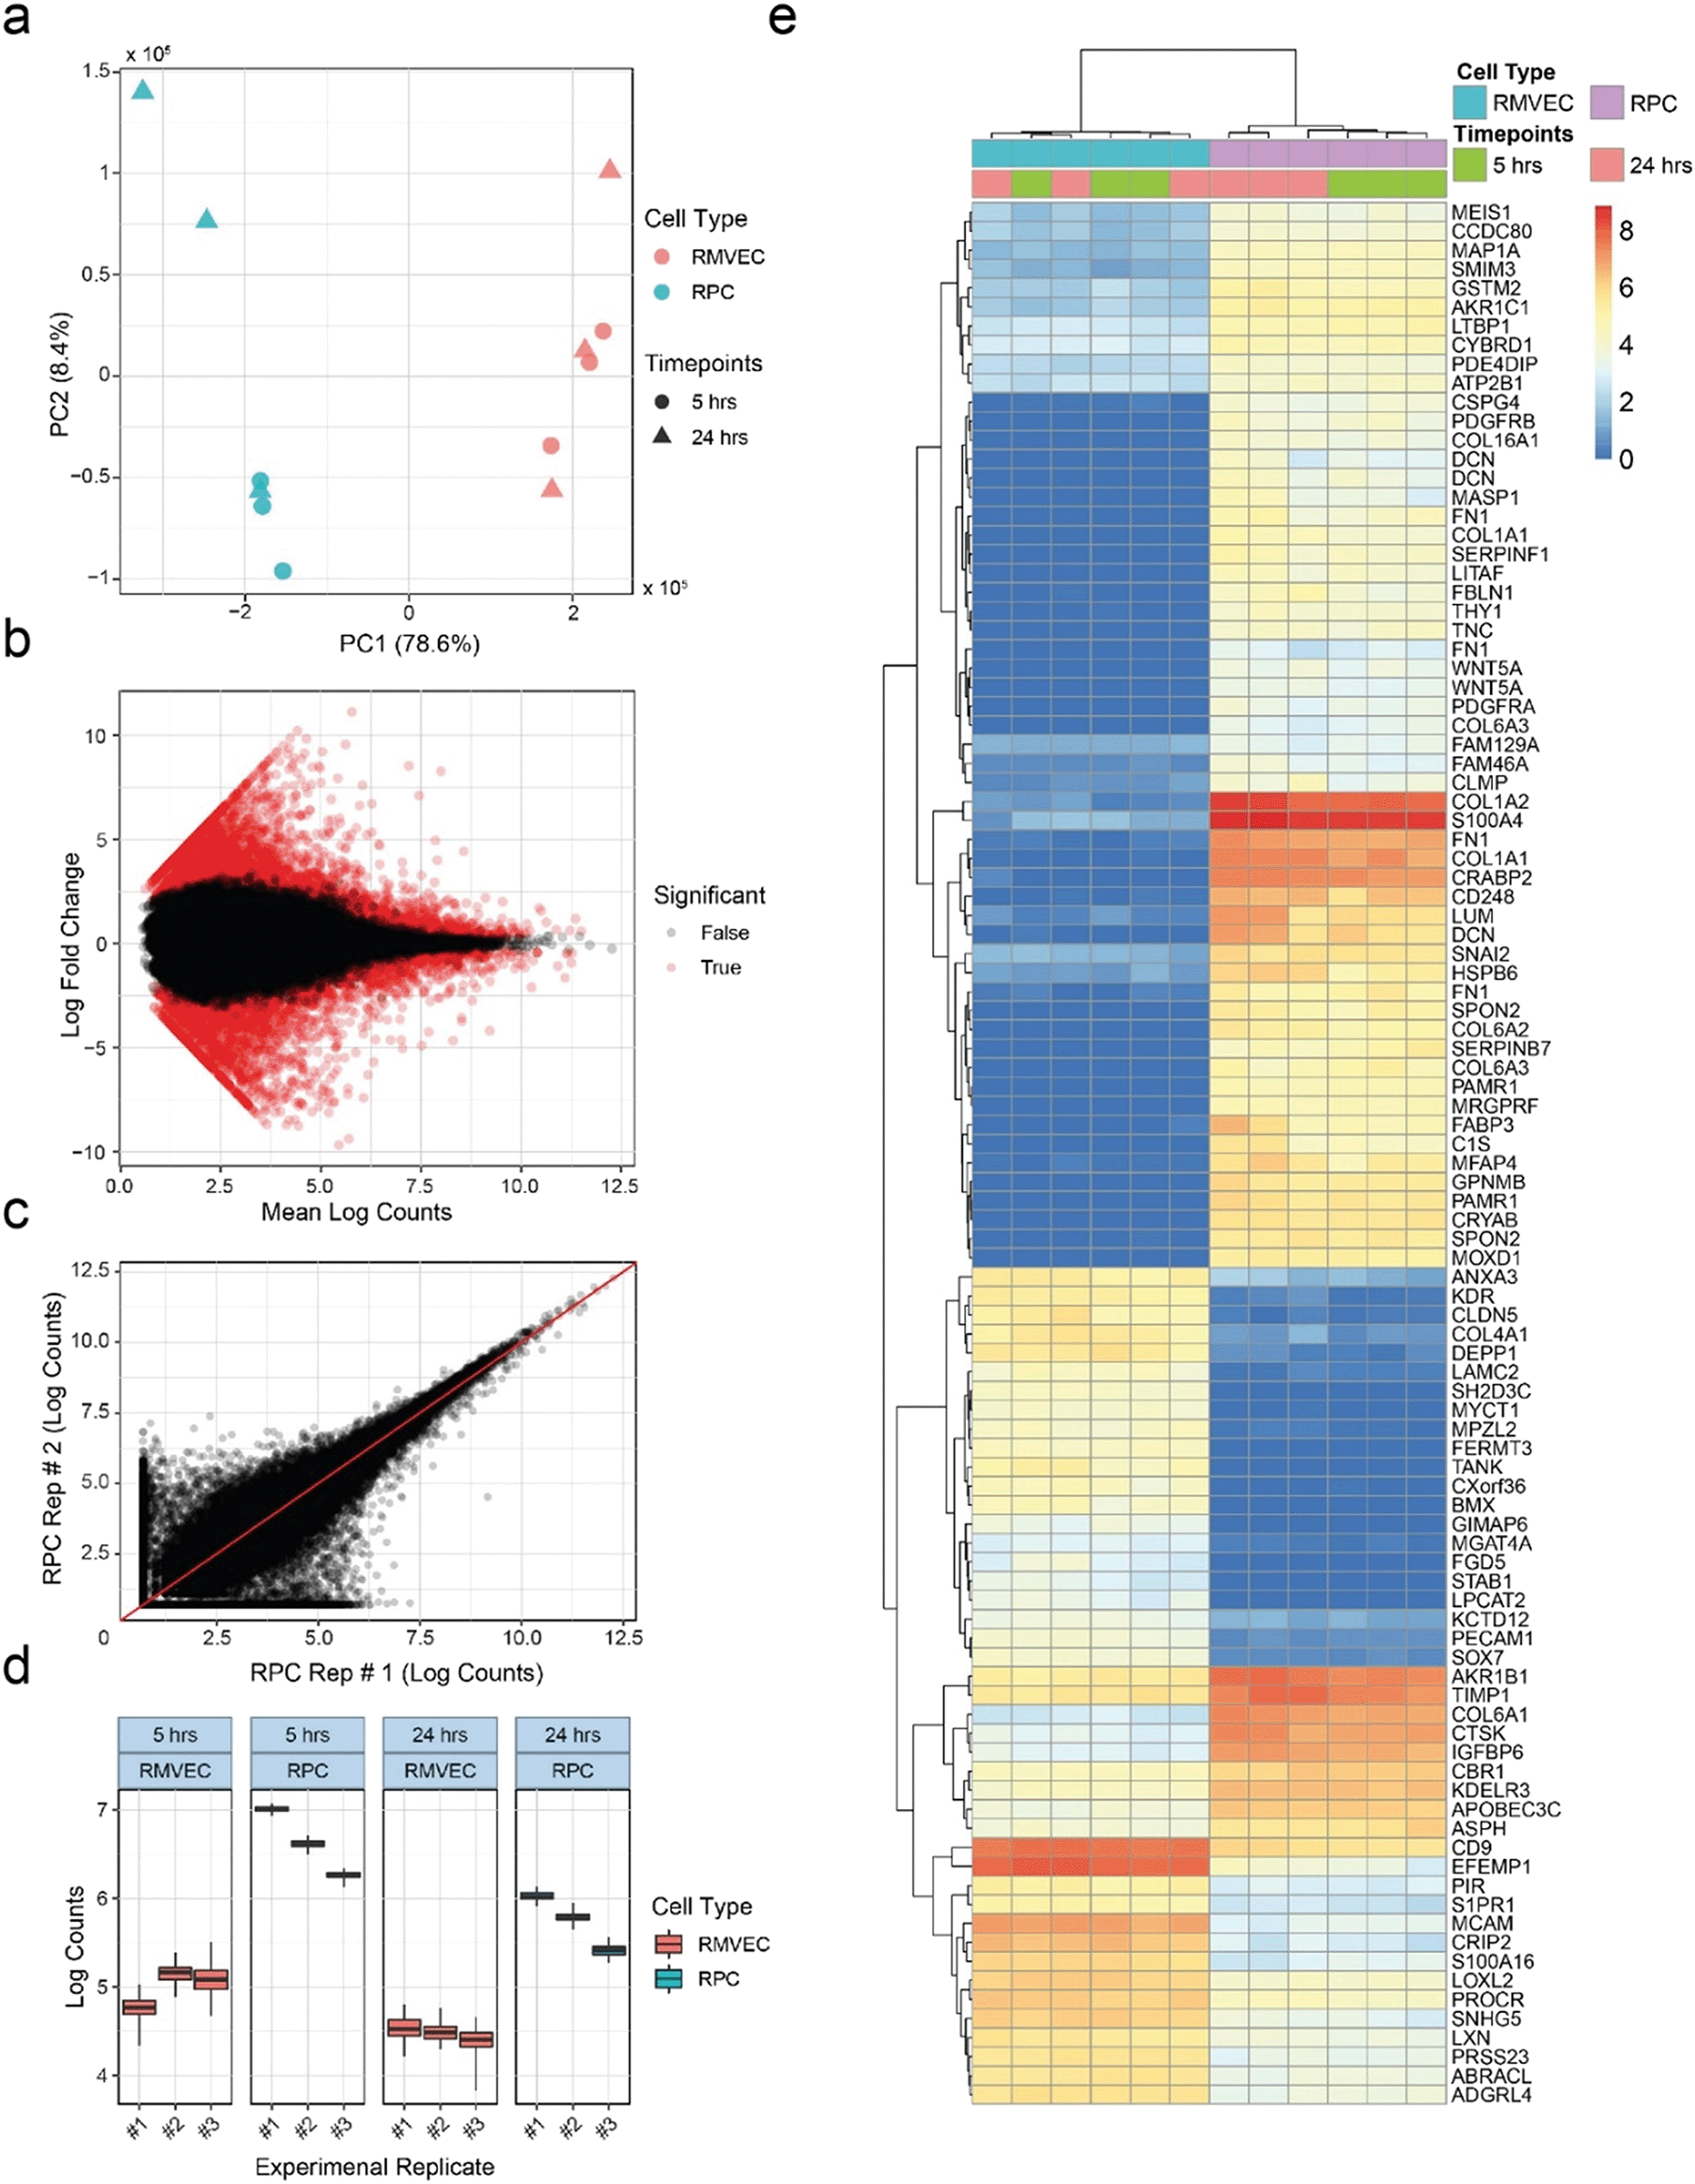 | ||
| Fig. 7 RNA-seq analysis can quantify parameters of cells extracted from the OOC platform. a, Principal component analysis of normalized and filtered transcript counts for retinal pericytes (RPC) and retinal microvascular endothelial cells (RMVEC) from single channels of devices serum starved for 5 hours or 24 hours before analysis. The first two principal components are plotted. Clear separation of cell types is observed along the first principal component axis. b, MA plot of differential transcript abundances between RPCs and RMVECs. Log ratio is estimated from linear model coefficients. Log counts is normalized and filtered. Significance is based on an FDR threshold of 0.1. c, Normalized and filtered transcript counts for two RPC biological replicates (RPC Rep #1 and RPC Rep # 2). Replicates correlate, with higher variance observed at lower mean expression, as is typical for RNA-seq experiments. d, Bootstrap analysis of technical variance for transcript NM_018057.6 of the amino acid transporter SLC6A15. The x-axis lists each biological replicate, which includes separate seedings of the 5 hour and 24 hour serum starve conditions. Three experimental replicates were used for differential expression analysis (3 seedings × 2 starve conditions). e, Heat-map and hierarchical clustering between samples of normalized and filtered transcripts per million (TPM) shows a wide range of transcripts analyzed. Cell types are differentiated by known marker genes consistently for all biological replicates. | ||
RNA-seq analysis serves as a strict test of tissue model utility, since it can return data with potential to serve even clinical and regulatory roles if minimums for RNA quantity and quality97 are achieved. Since OOC technologies often have total cell numbers less than traditional cell culture, they risk having insufficient RNA to perform a high quality analysis. The RNA-seq analysis here outputs data capturing a range of mRNAs. It demonstrates the ability to distinguish between known cell types with indications of sufficient quantity and quality of RNA output from the OOC platform. In addition, lowly-expressed transcripts with higher variance were still found to be differentially expressed between the two cell types. Based on this we expect any added variation from MPC devices would not limit use of RNA-seq in this platform. Finally, automated core sequencing facilities utilizing robotic liquid handlers to extract RNA, prepare libraries, and run sequencing pools in high throughput can interact with the OOC platform, ensuring the analytical pace matches that of other high-throughput analyses. The platform described here can integrate into such workflows, readily enabling studies that seek to test a large number of parameters, require a large number of replicates, or both.
Conclusions
We report a new OOC technology, the first to integrate low priming-volume pumps, user-programmable flow, sensing with real-time capability, and controlled heterotypic cell culture into a high-throughput format. This format is compatible with existing life science infrastructure for operation, such as automated liquid handling and plate shuttling, as well as for evaluation, such as high-content screening and RNA-seq. In addition, the design enables new seeding techniques that enhance the ability of cells to adhere and spread on the scaffold, allowing the use of cells that otherwise would not be possible to culture long term. Finally, the platform applies to a range of tissues, providing a means to influence as well as evaluate those tissues. Thus, the development of the innovative, integrated capabilities of the platform expands the potential uses of OOC and positions it to more broadly improve disease research and drug development.Experimental
Microfluidic culture plate preparation
The microfluidic culture plates (MCP), fabricated as described in ESI† section “Fabrication of the microfluidic culture plate”, were prepared similarly for all experiments. First, the plates were treated with oxygen plasma for 1–5 minutes to render surfaces more hydrophilic. They were then sterilized by rinsing devices in ethanol and/or exposing the MCPs to UV light for 30 minutes. Individual devices were rinsed with water followed by PBS prior to coating channel surfaces with extracellular matrix proteins (hepatocytes: 20 μg mL−1 human fibronectin and 20 μg mL−1 rat tail collagen; endothelial cells: 5 μg mL−1 human fibronectin; colon: 1:160 Matrigel; renal proximal tubule epithelial cells: 60 μg mL−1 human collagen IV). In all microfluidic culture plates not coated with Matrigel, devices were rinsed with PBS following ECM deposition. Lastly, all MCPs were primed with model-specific cell culture media while cell suspensions were prepared for seeding.
Cell seeding
Cell seeding protocols varied slightly depending on cell type and application. Briefly, cells were either introduced into the device microchannels via a gravity seeding method using the standard MCP design (vascular ECs, kidney cells) or by a filter-seeding method in the custom MCP design (hepatocytes, colon cells). See ESI† Fig. S2–S4 for MCP design and corresponding seeding methods. For gravity methods (ESI† Fig. S2b), 35 μL and 15 μL of cell suspension (retinal pericytes and hepatic stellates at 250000 cells per mL, vascular ECs at 500000–1000000 cells per mL, proximal tubule cells at 1500000 cells per mL) were added to the inlet and outlet wells of device microchannels, respectively. To culture cells below the scaffold, MCPs were flipped upside-down immediately after seeding for 1 hour. After cells adhered to the scaffold, additional media was added to the wells to bring the total volume to 75 μL. For filter-seeding methods (ESI† Fig. S2a), a tight-fit connection was made between the pipette tip and the custom MCP interface at both the inlet and outlet of the microchannel and 60 μL of cell suspension (hepatocytes at 500000 cells per mL, colon at 400000–1000000 cells per mL) was infused into the channel. The suspension media was convectively transported through the membrane into the adjacent channel while cells remained on the membrane. Cells were allowed to equilibrate briefly before the pipette tips were withdrawn from the ports. In all cases, MCPs were kept at 5% CO2 and 37 °C and media was changed every 1 or 2 days. Specific methods on PHH suspension preparation and gut spheroid dissociation can be found in the ESI.†
High content screening assay
At 16 hours post-seeding, hepatic stellate cells (HSCs) were starved using stellate cell media containing a growth factor bullet for human stellate cells, 0.2% FBS and 1× penicillin–streptomycin (ScienCell, Cat. No. 5301) for 3–4 h prior to tool compound testing; retinal pericytes (RPCs) received fresh Quiescent Media. ALK5 inhibitor SB-431542, (ALK5i, Tocris) and human recombinant transforming growth factor β (TGF-β, R&D Systems) were solubilized according to vendor specifications at 30 mM and 20 μg mL−1, respectively. Dose curves of each were prepared at 1000× final assay concentrations in 11 point half log dose curves with 30 μM for ALK5i and 30 ng mL−1 for TGF-β top final assay concentration. Dilutions were added to assay media for a 1× concentration and added to the respective inlet/outlet ports in a 75/15 μL addition scheme. After 72 hours, cells in the MCP were fixed and stained for high content screening of myofibroblast transition of both cell types across treatments. Plate definitions were established in Harmony (PerkinElmer) for high content imaging on an Opera Phenix High Content Screening System (PerkinElmer). All 96 devices on the MCP were imaged at 5×, 10× air, 20× air, and 20× water objectives to establish imaging processes for each hardware set up. Data presented in this paper are from 10× objective air (Fig. 2c) and 20× objective water (Fig. 2e) objectives. Briefly, imaging parameters were set for the center of each device with z-stacks to cover the full height on both sides of the membrane. Imaging for 5 channels (UV, Alexa 568, Alexa 647, Brightfield, Digital Phase Contrast) with individual exposure firing was completed. Image analysis was performed in Columbus (PerkinElmer) cloud-based high content imaging software. The analysis performed was standard intensity, morphology, and texture analysis. A custom linear classifier was also run within Columbus to utilize high content readouts of “activated” cells based on historic control populations. Intensity measurements were used to produce EC/IC50 curves. Morphology, texture, and the linear classifier were used to generate high content readouts of “% activated cells”.Perfusion flow experiment in the liver model
High shear flow experiment in the vascular model
Barrier function experiments in the gut model
Oxygen sensor integration and analysis
An optical luminescence based oxygen sensing system was integrated with the platform for on-chip oxygen monitoring. Sensor spots (0.75 mm in diameter and 50 μm thick) were cut with a biopsy punch from a sheet of photosensitive film (Pyroscience, Germany) and adhered to the center of each basal channel using silicone adhesive (Sylgard 184, Corning). A FireStingO2 optical oxygen meter (Pyroscience, Germany) with a fiber-optic cable was used to monitor oxygen in each device. During measurements, the platform was placed in an incubated confocal microscope and the fiber optic was secured parfocally onto the objective turret of the microscope using a custom fixture. The stage was programmed to align the fiber-optic with each sensor spot for O2 monitoring in all 96 devices. A 2-point calibration of the FireStingO2 system was performed using devices filled with PBS equilibrated in air termed “100% saturation” and a “0% saturation” oxygen solution (30 g L−1 sodium sulfite in water). Continuous oxygen measurements at a 1 Hz sampling rate were acquired in each device containing tissue under flow at 10 μL min−1. With flow stopped, single-point oxygen readings were acquired in each device every 30 minutes for 2.5 hours. During static to flow transition, oxygen was measured continuously at 1 Hz sampling rate in a single device as micropumps were turned on at 10 μL min−1.Direct quantification of active transport in the kidney model
A co-culture of hRPTECs and hMVECs were cultured for 7 days under 10 μL min−1 of fluid flow. The transport of 6-carboxyfluoroscein (6-CF), a fluorescent substrate of renal organic anion transporters, from the top/vascular channel to the bottom/lumen channel was characterized in 4 conditions: devices with no cells (no cell control), devices with cells (no drug control), devices with cells +1% DMSO (vehicle control), and devices with cells treated with 2 mM probenecid, a small molecule inhibitor of renal organic anion transport. Respective conditions were pretreated with media alone, vehicle or drug for 10 minutes prior to introducing 1 μM 6-CF to the top channel. 6-CF was introduced in media, vehicle or drug solutions to maintain consistent conditions in each replicate. A Zeiss LSM 700 confocal microscope was programmed to couple z-stack and time-lapse imaging to acquire focal planes at 20× objective magnification in the bottom and top channel over 45 minutes at each device. Images taken in the bottom channel were analyzed for intensity of 6-CF substrate from all conditions.RNA-seq analysis
RNA-seq analysis RPCs and RMVECs were cultured to confluency in static conditions (3–5 days), within the MCP, at which point they were starved by reduction of serum. Cells were detached from devices after 5 and 24 h post-starve using Accutase at 37 °C for 3–5 minutes. Devices were washed twice with 100 μL media to collect detached cells. Cells were centrifuged and lysed with RLT buffer containing 2-mercaptoethanol. RNA was isolated following the Qiagen RNeasy Micro protocol with on-column DNaseI digestion and elution of RNA into a final volume of 14 μL of water. RNA yield and integrity was evaluated using an Agilent Tapestation with high-sensitivity RNA Screentapes. Illumina libraries were prepared using the SMART-Seq v4 low-input protocol. Indexed libraries for each replicate were pooled and sequenced on a NextSeq 500 high-output flow cell with a single-ended 75 bp run configuration. Reads were processed by Kallisto100 pseudoalignment against the NCBI GRCh38 human reference transcriptome. Pseudoalignments were further processed using Sleuth.101 Differential expression of transcripts between cell types was determined by a Wald test with an FDR threshold of 0.1.Immunofluorescence staining and microscopy
Prior to immunofluorescence staining, devices were washed with PBS and cells were fixed using paraformaldehyde or methanol fixation for best results according to the target. For formaldehyde fixation, cell were fixed with 4% paraformaldehyde solution at room temperature for a period of 10–15 minutes. For methanol fixation, a solution of 95% methanol and 5% acetic acid at 4 °C was used. The devices were subsequently washed with PBS and formaldehyde fixed cells were permeabilized using 0.1% Triton-X solution at room temperature for 5–15 minutes. The cells were blocked with a suitable blocking buffer containing either 1% fetal bovine serum (FBS), 3% bovine serum albumin (BSA), or 3% normal goat serum (NGS) in PBS for a minimum of 1 hour at room temperature. Primary antibodies against targets of interest – α-smooth muscle actin (Millipore Sigma, clone 1A4, dilution 1:500), collagen I (Abcam, ab6308, 1:1000 dilution), ZO1 (BD biosciences, 610967, dilution 1:250), OAT1 (ThermoFisher, PA5-26244, dilution 1:50) – were diluted in the blocking buffer and incubated overnight at 4 °C, and then washed using PBS or blocking buffer. Cells were then incubated with suitable fluorescently conjugated secondary antibodies at room temperature for 1–3 hours and washed with PBS. Cell nuclei were co-stained using Hoechst 33342 (ThermoFisher, 1:250 dilution from 1 mg mL−1 solution). Further details for staining protocols for each specific model is provided in ESI.† Imaging was performed using a scanning confocal microscope (LSM700, Zeiss) equipped with 405 nm, 488 nm, 555 nm, and 637 nm lasers and 10× air, 20× air, and 40× water immersion objectives.
Competing interest
Work in this paper was partially supported by funding from Pfizer, Inc. who also participated in the research.Author contributions
Hesham Azizgolshani: designed, conceived platform technology, performed simulations, led and executed engineering experiments, analyzed data, wrote manuscript. Jonathan R. Coppeta: designed, conceived platform technology, performed simulations, led and executed engineering experiments, analyzed data, wrote manuscript. Else M. Vedula: designed, conceived platform technology, led and/or executed biological experiments, analyzed data, wrote manuscript. Elizabeth E. Marr: led and/or executed biological experiments, analyzed data, wrote manuscript. Brian P. Cain: designed platform technology, executed engineering experiments, analyzed data, wrote manuscript. Rebeccah J. Luu: led and/or executed biological experiments, analyzed data, wrote manuscript. Matthew Lech: led and/or executed biological experiments, analyzed data, wrote manuscript. Samuel H. Kann: led and/or executed biological experiments, analyzed data, wrote manuscript. Thomas J. Mulhern: led and/or executed biological experiments, analyzed data. Vishal Tandon: led and executed engineering experiments, analyzed data, wrote manuscript. Kelly Tan: led and/or executed biological experiments, analyzed data. Nerses J. Haroutunian: executed engineering experiments, analyzed data. Philip Keegan: supported platform development, executed biological experiments, analyzed data. Miles Rogers: led and/or executed biological experiments, analyzed data. Ashley L. Gard: led and/or executed biological experiments, analyzed data, wrote manuscript. Keith B. Baldwin: designed subset of platform technology. Jennifer de Souza: designed software/firmware for subset of platform technology. B. Christopher Hoefler: executed biological experiments, analyzed data, wrote manuscript. Shyam Bale: led and/or executed biological experiments. Louis Kratchman: designed, conceived platform technology. Alexander Zorn: designed subset of platform technology. Abigail Patterson: designed, conceived platform technology, led and executed engineering experiments. Ernest S. Kim: designed, conceived platform technology, wrote manuscript. Timothy A. Petrie: led and/or executed biological experiments, analyzed data. Elizabeth Wiellette: led and/or executed biological experiments, analyzed data, wrote manuscript. Corin Williams: led and/or executed biological experiments, analyzed data, wrote manuscript. Brett C. Isenberg: designed, conceived platform technology, performed simulations, led and executed engineering experiments, analyzed data, wrote manuscript. Joseph L. Charest: conceived platform technology, led engineering and biological experimental strategy, analyzed data, wrote manuscript.Conflicts of interest
There are no conflicts to declare.Acknowledgements
The authors would like to acknowledge significant contributors to the work. Anne M Ryan, Yvonne Will, Thomas A Wynn of Pfizer and Jeffrey T Borenstein of Draper for leadership and guidance. Lindsay Tomlinson, Michael Cain, Marion Kasaian, Celia Caballero-Franco, Eric Bauman, James R Gosset of Pfizer for technical input and participation in the research. Stephanie L Golmon and Veronica C Newlin for design and fabrication development. Jason E Bahou and Yazmin N Obi for device fabrication. Alexander J Almeida and Ryan McGannon for electrical hardware and software assistance. Ryan S Maloney for assistance with biological experimentation. Jeffrey S Burrell and Robert J de St. Phalle for graphic design and artwork. The work was supported by Pfizer, Inc., The Charles Stark Draper Laboratory, and NSF Grant Award Number 1804845 (PI Charest).References
- J. W. Scannell, A. Blanckley, H. Boldon and B. Warrington, Diagnosing the decline in pharmaceutical R&D efficiency, Nat. Rev. Drug Discovery, 2012, 11(3), 191–200 CrossRef CAS PubMed.
- D. Cook, D. Brown, R. Alexander, R. March, P. Morgan and G. Satterthwaite, et al., Lessons learned from the fate of AstraZeneca's drug pipeline: a five-dimensional framework, Nat. Rev. Drug Discovery, 2014, 13(6), 419–431 CrossRef CAS PubMed.
- J. A. DiMasi, L. Feldman, A. Seckler and A. Wilson, Trends in risks associated with new drug development: success rates for investigational drugs, Clin. Pharmacol. Ther., 2010, 87(3), 272–277 CrossRef CAS PubMed.
- C. H. Wong, K. W. Siah and A. W. Lo, Estimation of clinical trial success rates and related parameters, Biostatistics, 2019, 20(2), 273–286 CrossRef PubMed.
- H. Olson, G. Betton, D. Robinson, K. Thomas, A. Monro and G. Kolaja, et al., Concordance of the toxicity of pharmaceuticals in humans and in animals, Regul. Toxicol. Pharmacol., 2000, 32(1), 56–67 CrossRef CAS PubMed.
- M. Leist and T. Hartung, Inflammatory findings on species extrapolations: humans are definitely no 70-kg mice, Arch. Toxicol., 2013, 87(4), 563–567 CrossRef CAS PubMed.
- L. A. Low and D. A. Tagle, Tissue chips – innovative tools for drug development and disease modeling, Lab Chip, 2017, 17(18), 3026–3036 RSC.
- L. A. Low and D. A. Tagle, Tissue chips to aid drug development and modeling for rare diseases, Expert Opin. Orphan Drugs, 2016, 4(11), 1113–1121 CrossRef CAS PubMed.
- K. Ronaldson-Bouchard and G. Vunjak-Novakovic, Organs-on-a-Chip: A Fast Track for Engineered Human Tissues in Drug Development, Cell Stem Cell, 2018, 22(3), 310–324 CrossRef CAS PubMed.
- A. M. Holmes, S. Creton and K. Chapman, Working in partnership to advance the 3Rs in toxicity testing, Toxicology, 2010, 267(1), 14–19 CrossRef CAS PubMed.
- S. Xiao, J. R. Coppeta, H. B. Rogers, B. C. Isenberg, J. Zhu and S. A. Olalekan, et al., A microfluidic culture model of the human reproductive tract and 28-day menstrual cycle, Nat. Commun., 2017, 8, 14584 CrossRef CAS PubMed.
- P. Morgan, D. G. Brown, S. Lennard, M. J. Anderton, J. C. Barrett and U. Eriksson, et al., Impact of a five-dimensional framework on R&D productivity at AstraZeneca, Nat. Rev. Drug Discovery, 2018, 17(3), 167–181 CrossRef CAS PubMed.
- D. C. Swinney and J. Anthony, How were new medicines discovered?, Nat. Rev. Drug Discovery, 2011, 10(7), 507–519 CrossRef CAS PubMed.
- M. Wagoner, J. Kelsal, M. Hattersley, K. Hickling, J. Pederson and J. Harris, et al., Bromodomain and extraterminal (BET) domain inhibitors induce a loss of intestinal stem cells and villous atrophy, Toxicol. Lett., 2014, 229, S75–S76 CrossRef.
- R. Barrile, A. D. van der Meer, H. Park, J. P. Fraser, D. Simic and F. Teng, et al., Organ-on-Chip Recapitulates Thrombosis Induced by an anti-CD154 Monoclonal Antibody: Translational Potential of Advanced Microengineered Systems, Clin. Pharmacol. Ther., 2018, 104(6), 1240–1248 CrossRef CAS PubMed.
- D. Huh, B. D. Matthews, A. Mammoto, M. Montoya-Zavala, H. Y. Hsin and D. E. Ingber, Reconstituting Organ-Level Lung Functions on a Chip, Science, 2010, 328(5986), 1662–1668 CrossRef CAS PubMed.
- S. Jeong, S. Kim, J. Buonocore, J. Park, C. J. Welsh and J. Li, et al., A Three-Dimensional Arrayed Microfluidic Blood-Brain Barrier Model With Integrated Electrical Sensor Array, IEEE Trans. Biomed. Eng., 2018, 65(2), 431–439 Search PubMed.
- K. S. Bielawski, A. Leonard, S. Bhandari, C. E. Murry and N. J. Sniadecki, Real-Time Force and Frequency Analysis of Engineered Human Heart Tissue Derived from Induced Pluripotent Stem Cells Using Magnetic Sensing, Tissue Eng., Part C, 2016, 22(10), 932–940 CrossRef CAS PubMed.
- S. J. Trietsch, G. D. Israëls, J. Joore, T. Hankemeier and P. Vulto, Microfluidic titer plate for stratified 3D cell culture, Lab Chip, 2013, 13(18), 3548–3554 RSC.
- Y.-C. Toh, T. C. Lim, D. Tai, G. Xiao, D. Noort and H. Yu, A microfluidic 3D hepatocyte chip for drug toxicity testing, Lab Chip, 2009, 9(14), 2026–2035 RSC.
- K. Rennert, S. Steinborn, M. Gröger, B. Ungerböck, A.-M. Jank and J. Ehgartner, et al., A microfluidically perfused three dimensional human liver model, Biomaterials, 2015, 71, 119–131 CrossRef CAS PubMed.
- B. Ataç, I. Wagner, R. Horland, R. Lauster, U. Marx and A. G. Tonevitsky, et al., Skin and hair on-a-chip: in vitro skin models versus ex vivo tissue maintenance with dynamic perfusion, Lab Chip, 2013, 13(18), 3555–3561 RSC.
- M. Sato, N. Sasaki, M. Ato, S. Hirakawa, K. Sato and K. Sato, Microcirculation-on-a-Chip: A Microfluidic Platform for Assaying Blood- and Lymphatic-Vessel Permeability, PLoS One, 2015, 10(9), e0137301 CrossRef PubMed.
- A. Grassart, V. Malardé, S. Gobaa, A. Sartori-Rupp, J. Kerns and K. Karalis, et al., Bioengineered Human Organ-on-Chip Reveals Intestinal Microenvironment and Mechanical Forces Impacting Shigella Infection, Cell Host Microbe, 2019, 26(3), 435–444 CrossRef CAS PubMed e4.
- H. E. Abaci, Y.-I. Shen, S. Tan and S. Gerecht, Recapitulating physiological and pathological shear stress and oxygen to model vasculature in health and disease, Sci. Rep., 2014, 4(1), 1–9 Search PubMed.
- V. Raghavan, Y. Rbaibi, N. M. Pastor-Soler, M. D. Carattino and O. A. Weisz, Shear stress-dependent regulation of apical endocytosis in renal proximal tubule cells mediated by primary cilia, Proc. Natl. Acad. Sci. U. S. A., 2014, 111(23), 8506–8511 CrossRef CAS PubMed.
- Y. Duan, A. M. Weinstein, S. Weinbaum and T. Wang, Shear stress-induced changes of membrane transporter localization and expression in mouse proximal tubule cells, Proc. Natl. Acad. Sci. U. S. A., 2010, 107(50), 21860–21865 CrossRef CAS PubMed.
- S. N. Bhatia, U. J. Balis, M. L. Yarmush and M. Toner, Effect of cell-cell interactions in preservation of cellular phenotype: cocultivation of hepatocytes and nonparenchymal cells, FASEB J., 1999, 13(14), 1883–1900 CrossRef CAS PubMed.
- P. D. Yurchenco, Basement membranes: cell scaffoldings and signaling platforms, Cold Spring Harbor Perspect. Biol., 2011, 3(2), 1–27 Search PubMed.
- H. Horsley, D. Dharmasena, J. Malone-Lee and J. L. Rohn, A urine-dependent human urothelial organoid offers a potential alternative to rodent models of infection, Sci. Rep., 2018, 8, 1238 CrossRef PubMed.
- D. J. Felmlee, D. Grün and T. F. Baumert, Zooming in on liver zonation, Hepatology, 2018, 67(2), 784–787 CrossRef PubMed.
- J. P. Wikswo, F. E. Block, D. E. Cliffel, C. R. Goodwin, C. C. Marasco and D. A. Markov, et al., Engineering challenges for instrumenting and controlling integrated organ-on-chip systems, IEEE Trans. Biomed. Eng., 2013, 60(3), 682–690 Search PubMed.
- B. Srinivasan, A. R. Kolli, M. B. Esch, H. E. Abaci and M. L. Shuler, Hickman JJ. TEER measurement techniques for in vitro barrier model systems, J. Lab. Autom., 2015, 20(2), 107–126 CrossRef CAS PubMed.
- B. M. Maoz, A. Herland, O. Y. F. Henry, W. D. Leineweber, M. Yadid and J. Doyle, et al., Organs-on-Chips with combined multi-electrode array and transepithelial electrical resistance measurement capabilities, Lab Chip, 2017, 17(13), 2294–2302 RSC.
- Y. S. Zhang, J. Aleman, S. R. Shin, T. Kilic, D. Kim and S. A. M. Shaegh, et al., Multisensor-integrated organs-on-chips platform for automated and continual in situ monitoring of organoid behaviors, Proc. Natl. Acad. Sci. U. S. A., 2017, 114(12), E2293–E2302 CrossRef CAS PubMed.
- K. Tan, P. Keegan, M. Rogers, M. Lu, J. R. Gosset and J. Charest, et al., A high-throughput microfluidic microphysiological system (PREDICT-96) to recapitulate hepatocyte function in dynamic, re-circulating flow conditions, Lab Chip, 2019, 19(9), 1556–1566 RSC.
- A. Piruska, I. Nikcevic, S. H. Lee, C. Ahn, W. R. Heineman and P. A. Limbach, et al., The autofluorescence of plastic materials and chips measured under laser irradiation, Lab Chip, 2005, 5(12), 1348–1354 RSC.
- R. K. Jena and C. Y. Yue, Cyclic olefin copolymer based microfluidic devices for biochip applications: Ultraviolet surface grafting using 2-methacryloyloxyethyl phosphorylcholine, Biomicrofluidics, 2012, 6(1), 012822 CrossRef PubMed.
- S. S. Bale, A. Manoppo, R. Thompson, A. Markoski, J. Coppeta and B. Cain, et al., A thermoplastic microfluidic microphysiological system to recapitulate hepatic function and multicellular interactions, Biotechnol. Bioeng., 2019, 116(12), 3409–3420 CrossRef CAS PubMed.
- J. R. Coppeta, M. J. Mescher, B. C. Isenberg, A. J. Spencer, E. S. Kim and A. R. Lever, et al., A portable and reconfigurable multi-organ platform for drug development with onboard microfluidic flow control, Lab Chip, 2016, 17(1), 134–144 RSC.
- V. Tandon, W. S. Kang, T. A. Robbins, A. J. Spencer, E. S. Kim and M. J. McKenna, et al., Microfabricated reciprocating micropump for intracochlear drug delivery with integrated drug/fluid storage and electronically controlled dosing, Lab Chip, 2016, 16(5), 829–846 RSC.
- C.-W. Chi, A. R. Ahmed, Z. Dereli-Korkut and S. Wang, Microfluidic cell chips for high-throughput drug screening, Bioanalysis, 2016, 8(9), 921–937 CrossRef CAS PubMed.
- Y. I. Wang, C. Carmona, J. J. Hickman and M. L. Shuler, Multi-Organ Microphysiological Systems for Drug Development: Strategies, Advances and Challenges, Adv. Healthcare Mater., 2018, 7(2), 1701000 CrossRef PubMed , available from: https://www.ncbi.nlm.nih.gov/pmc/articles/PMC5805562/.
- L. Qiang, J. Guo, Y. Han, J. Jiang, X. Su and H. Liu, et al., A novel anti Candida albicans drug screening system based on high-throughput microfluidic chips, Sci. Rep., 2019, 9(1), 8087 CrossRef PubMed.
- G. Du, Q. Fang and J. M. J. den Toonder, Microfluidics for cell-based high throughput screening platforms—A review, Anal. Chim. Acta, 2016, 903, 36–50 CrossRef CAS PubMed.
- V. van Duinen, D. Zhu, C. Ramakers, A. J. van Zonneveld, P. Vulto and T. Hankemeier, Perfused 3D angiogenic sprouting in a high-throughput in vitro platform, Angiogenesis, 2019, 22(1), 157–165 CrossRef CAS PubMed.
- S. Peel, A. M. Corrigan, B. Ehrhardt, K.-J. Jang, P. Caetano-Pinto and M. Boeckeler, et al., Introducing an automated high content confocal imaging approach for Organs-on-Chips, Lab Chip, 2019, 410–421 RSC.
- M. Mattiazzi Usaj, E. B. Styles, A. J. Verster, H. Friesen, C. Boone and B. J. Andrews, High-Content Screening for Quantitative Cell Biology, Trends Cell Biol., 2016, 26(8), 598–611 CrossRef CAS PubMed.
- J. W. Song and L. L. Munn, Fluid forces control endothelial sprouting, Proc. Natl. Acad. Sci. U. S. A., 2011, 108(37), 15342–15347 CrossRef CAS PubMed.
- R. S. Reneman and A. P. G. Hoeks, Wall shear stress as measured in vivo: consequences for the design of the arterial system, Med. Biol. Eng. Comput., 2008, 46(5), 499–507 CrossRef PubMed.
- R. S. Reneman, T. Arts and A. P. G. Hoeks, Wall shear stress – an important determinant of endothelial cell function and structure – in the arterial system in vivo, J. Vasc. Res., 2006, 43(3), 251–269 CrossRef PubMed.
- M. D. Brennan, M. L. Rexius-Hall, L. J. Elgass and D. T. Eddington, Oxygen control with microfluidics, Lab Chip, 2014, 14(22), 4305–4318 RSC.
- P. E. Oomen, M. D. Skolimowski and E. Verpoorte, Implementing oxygen control in chip-based cell and tissue culture systems, Lab Chip, 2016, 16(18), 3394–3414 RSC.
- L. Prodanov, R. Jindal, S. S. Bale, M. Hegde, W. J. McCarty and I. Golberg, et al., Long Term Maintenance of a Microfluidic 3-D Human Liver Sinusoid, Biotechnol. Bioeng., 2016, 113(1), 241–246 CrossRef CAS PubMed.
- M. Hegde, R. Jindal, A. Bhushan, S. S. Bale, W. J. McCarty and I. Golberg, et al., Dynamic interplay of flow and collagen stabilizes primary hepatocytes culture in a microfluidic platform, Lab Chip, 2014, 14(12), 2033–2039 RSC.
- K. Tan, J. Coppeta, H. Azizgolshani, B. C. Isenberg, P. M. Keegan and B. P. Cain, et al., Correction: A high-throughput microfluidic microphysiological system (PREDICT-96) to recapitulate hepatocyte function in dynamic, re-circulating flow conditions, Lab Chip, 2020, 1556–1566 Search PubMed.
- N. Baeyens, S. Nicoli, B. G. Coon, T. D. Ross, K. Van den Dries and J. Han, et al., Vascular remodeling is governed by a VEGFR3-dependent fluid shear stress set point, eLife, 2020, 4, e04645 CrossRef PubMed , available from: https://www.ncbi.nlm.nih.gov/pmc/articles/PMC4337723/.
- L. Cucullo, M. Hossain, V. Puvenna, N. Marchi and D. Janigro, The role of shear stress in Blood-Brain Barrier endothelial physiology, BMC Neurosci., 2011, 12, 40 CrossRef CAS PubMed.
- D. Conway and M. A. Schwartz, Lessons from the endothelial junctional mechanosensory complex, F1000 Biol. Rep., 2012, 4, 1 Search PubMed , available from: https://www.ncbi.nlm.nih.gov/pmc/articles/PMC3251317/.
- B. G. Coon, N. Baeyens, J. Han, M. Budatha, T. D. Ross and J. S. Fang, et al., Intramembrane binding of VE-cadherin to VEGFR2 and VEGFR3 assembles the endothelial mechanosensory complex, J. Cell Biol., 2015, 208(7), 975–986 CrossRef CAS PubMed.
- A. Ishibazawa, T. Nagaoka, H. Yokota, S. Ono and A. Yoshida, Low shear stress up-regulation of proinflammatory gene expression in human retinal microvascular endothelial cells, Exp. Eye Res., 2013, 116, 308–311 CrossRef CAS PubMed.
- A. Ishibazawa, T. Nagaoka, T. Takahashi, K. Yamamoto, A. Kamiya and J. Ando, et al., Effects of shear stress on the gene expressions of endothelial nitric oxide synthase, endothelin-1, and thrombomodulin in human retinal microvascular endothelial cells, Invest. Ophthalmol. Visual Sci., 2011, 52(11), 8496–8504 CrossRef CAS PubMed.
- M. B. Simmers, A. W. Pryor and B. R. Blackman, Arterial shear stress regulates endothelial cell-directed migration, polarity, and morphology in confluent monolayers, Am. J. Physiol., 2007, 293(3), H1937–H1946 CAS.
- J. Shao, L. Wu, J. Wu, Y. Zheng, H. Zhao and Q. Jin, et al., Integrated microfluidic chip for endothelial cells culture and analysis exposed to a pulsatile and oscillatory shear stress, Lab Chip, 2009, 9(21), 3118–3125 RSC.
- O. Y. F. Henry, R. Villenave, M. Cronce, W. Leineweber, M. Benz and D. E. Ingber, Organs-on-Chips with integrated electrodes for Trans-Epithelial Electrical Resistance (TEER) measurements of human epithelial barrier function, Lab Chip, 2017, 17(13), 2264–2271 RSC.
- C. M. Costello, M. B. Phillipsen, L. M. Hartmanis, M. A. Kwasnica, V. Chen and D. Hackam, et al., Microscale Bioreactors for in situ characterization of GI epithelial cell physiology, Sci. Rep., 2017, 7(1), 12515 CrossRef PubMed.
- J. Costa and A. Ahluwalia, Advances and Current Challenges in Intestinal in vitro Model Engineering: A Digest, Front. Bioeng. Biotechnol., 2019, 7, 1–14 CrossRef PubMed , available from: https://www.frontiersin.org/articles/10.3389/fbioe.2019.00144/full#B30.
- S. Varadarajan, R. E. Stephenson and A. L. Miller, Multiscale dynamics of tight junction remodeling, J. Cell Sci., 2019, 132(22), jcs229286 CrossRef CAS PubMed , available from: https://jcs.biologists.org/content/132/22/jcs229286.
- G. Samak, D. Narayanan, J. H. Jaggar and R. Rao, CaV1.3 Channels and Intracellular Calcium Mediate Osmotic Stress-induced N-terminal c-Jun Kinase Activation and Disruption of Tight Junctions in Caco-2 Cell Monolayers, J. Biol. Chem., 2011, 286(34), 30232–30243 CrossRef CAS PubMed.
- G. Samak, T. Suzuki, A. Bhargava and R. K. Rao, c-Jun NH2-terminal kinase-2 mediates osmotic stress-induced tight junction disruption in the intestinal epithelium, Am. J. Physiol., 2010, 299(3), G572–G584 CAS.
- J. Yeste, M. Garcia-Ramirez, X. Illa, A. Guimera, C. Hernandez and R. Simo, et al., A compartmentalized microfluidic chip with crisscross microgrooves and electrophysiological electrodes for modeling the blood-retinal barrier, Lab Chip, 2017, 18(1), 95–105 RSC.
- H. Xu, Z. Li, Y. Yu, S. Sizdahkhani, W. S. Ho and F. Yin, et al., A dynamic in vivo-like organotypic blood-brain barrier model to probe metastatic brain tumors, Sci. Rep., 2016, 6(1), 36670 CrossRef CAS PubMed , available from: http://www.nature.com/articles/srep36670.
- K. Hiramoto, K. Ino, Y. Nashimoto, K. Ito and H. Shiku, Electric and Electrochemical Microfluidic Devices for Cell Analysis, Front. Chem., 2019, 7 Search PubMed , available from: https://www.frontiersin.org/article/10.3389/fchem.2019.00396/full.
- C. Beaurivage, E. Naumovska, Y. Chang, E. Elstak, A. Nicolas and H. Wouters, et al., Development of a Gut-on-a-Chip Model for High Throughput Disease Modeling and Drug Discovery, Int. J. Mol. Sci., 2019, 20(22), 5661 CrossRef CAS PubMed.
- S. Jalili-Firoozinezhad, F. S. Gazzaniga, E. L. Calamari, D. M. Camacho, C. W. Fadel and A. Bein, et al., A complex human gut microbiome cultured in an anaerobic intestine-on-a-chip, Nat. Biomed. Eng., 2019, 3(7), 520–531 CrossRef CAS PubMed.
- H. Zirath, M. Rothbauer, S. Spitz, B. Bachmann, C. Jordan and B. Müller, et al., Every Breath You Take: Non-invasive Real-Time Oxygen Biosensing in Two- and Three-Dimensional Microfluidic Cell Models, Front. Physiol., 2018, 9 Search PubMed , available from: https://www.frontiersin.org/article/10.3389/fphys.2018.00815/full.
- A. Moya, M. Ortega-Ribera, X. Guimerà, E. Sowade, M. Zea and X. Illa, et al., Online oxygen monitoring using integrated inkjet-printed sensors in a liver-on-a-chip system, Lab Chip, 2018, 18(14), 2023–2035 RSC.
- D. Bavli, S. Prill, E. Ezra, G. Levy, M. Cohen and M. Vinken, et al., Real-time monitoring of metabolic function in liver-on-chip microdevices tracks the dynamics of mitochondrial dysfunction, Proc. Natl. Acad. Sci. U. S. A., 2016, 113(16), E2231–E2240 CrossRef CAS PubMed.
- S. A. Mousavi Shaegh, F. De Ferrari, Y. S. Zhang, M. Nabavinia, N. Binth Mohammad and J. Ryan, et al., A microfluidic optical platform for real-time monitoring of pH and oxygen in microfluidic bioreactors and organ-on-chip devices, Biomicrofluidics, 2016, 10(4), 044111 CrossRef PubMed.
- M. Koopman, H. Michels, B. M. Dancy, R. Kamble, L. Mouchiroud and J. Auwerx, et al., A screening-based platform for the assessment of cellular respiration in Caenorhabditis elegans, Nat. Protoc., 2016, 11(10), 1798–1816 CrossRef CAS PubMed.
- K. J. Cash and H. A. Clark, Nanosensors and nanomaterials for monitoring glucose in diabetes, Trends Mol. Med., 2010, 16(12), 584–593 CrossRef CAS PubMed.
- W. Di and H. A. Clark, Optical nanosensors for in vivo physiological chloride detection for monitoring cystic fibrosis treatment, Anal. Methods, 2020, 12(11), 1441–1448 RSC.
- G. Rong, E. E. Tuttle, A. Neal Reilly and H. A. Clark, Recent Developments in Nanosensors for Imaging Applications in Biological Systems, Annu. Rev. Anal. Chem., 2019, 12(1), 109–128 CrossRef CAS PubMed.
- G. Rong, E. H. Kim, Y. Qiang, W. Di, Y. Zhong and X. Zhao, et al., Imaging Sodium Flux during Action Potentials in Neurons with Fluorescent Nanosensors and Transparent Microelectrodes, ACS Sens., 2018, 3(12), 2499–2505 CrossRef CAS PubMed.
- E. M. Vedula, J. L. Alonso, M. A. Arnaout and J. L. Charest, A microfluidic renal proximal tubule with active reabsorptive function, PLoS One, 2017, 12(10), e0184330 CrossRef PubMed , available from: https://www.ncbi.nlm.nih.gov/pmc/articles/PMC5636065/.
- M. A. Nagle, D. M. Truong, A. V. Dnyanmote, S.-Y. Ahn, S. A. Eraly and W. Wu, et al., Analysis of Three-dimensional Systems for Developing and Mature Kidneys Clarifies the Role of OAT1 and OAT3 in Antiviral Handling, J. Biol. Chem., 2011, 286(1), 243–251 CrossRef CAS PubMed.
- C. Zou, (RPTEC/TERT1) Modified to Express Drug Transporter –. ATCC, 2017 Search PubMed.
- J. P. Wikswo, E. L. Curtis, Z. E. Eagleton, B. C. Evans, A. Kole and L. H. Hofmeister, et al., Scaling and systems biology for integrating multiple organs-on-a-chip, Lab Chip, 2013, 13(18), 3496–3511 RSC.
- H. E. Abaci and M. L. Shuler, Human-on-a-chip design strategies and principles for physiologically based pharmacokinetics/pharmacodynamics modeling, Integr. Biol., 2015, 7(4), 383–391 CrossRef PubMed.
- J. Graf, A. Gautam and J. L. Boyer, Isolated rat hepatocyte couplets: a primary secretory unit for electrophysiologic studies of bile secretory function, Proc. Natl. Acad. Sci. U. S. A., 1984, 81(20), 6516–6520 CrossRef CAS PubMed.
- S. K. Nigam, K. T. Bush, G. Martovetsky, S. Y. Ahn, H. C. Liu and E. Richard, et al., The organic anion transporter (OAT) family: a systems biology perspective, Physiol. Rev., 2015, 95(1), 83–123 CrossRef PubMed.
- M. Roth, A. Obaidat and B. Hagenbuch, OATPs, OATs and OCTs: the organic anion and cation transporters of the SLCO and SLC22A gene superfamilies: OATPs, OATs and OCTs, Br. J. Pharmacol., 2012, 165(5), 1260–1287 CrossRef CAS.
- A. H. Heussner and D. R. Dietrich, Primary porcine proximal tubular cells as an alternative to human primary renal cells in vitro: an initial characterization, BMC Cell Biol., 2013, 14(1), 55 CrossRef.
- K.-W. Zhao, E. J. B. Murray and S. S. Murray, HK2 Proximal Tubule Epithelial Cells Synthesize and Secrete Plasma Proteins Predominantly Through the Apical Surface, J. Cell. Biochem., 2017, 118(4), 924–933 CrossRef CAS PubMed.
- P. Claude and D. A. Goodenough, Fracture faces of zonulae occludentes from “tight” and “leaky” epithelia, J. Cell Biol., 1973, 58(2), 390–400 CrossRef CAS PubMed.
- A. Doostparast Torshizi and K. Wang, Next-generation sequencing in drug development: target identification and genetically stratified clinical trials, Drug Discovery Today, 2018, 23(10), 1776–1783 CrossRef CAS PubMed.
- Illumina. TruSeq® RNA Sample Preparation v2 Guide [Internet]. Illumina, 2014, Available from: https://support.illumina.com/content/dam/illumina-support/documents/documentation/chemistry_documentation/samplepreps_truseq/truseqrna/truseq-rna-sample-prep-v2-guide-15026495-f.pdf.
- T. Sato, D. E. Stange, M. Ferrante, R. G. J. Vries, J. H. van Es and S. van den Brink, et al., Long-term Expansion of Epithelial Organoids From Human Colon, Adenoma, Adenocarcinoma, and Barrett's Epithelium, Gastroenterology, 2011, 141(5), 1762–1772 CrossRef CAS PubMed.
- H. Miyoshi and T. S. Stappenbeck, In vitro expansion and genetic modification of gastrointestinal stem cells in spheroid culture, Nat. Protoc., 2013, 8(12), 2471–2482 CrossRef CAS PubMed.
- N. L. Bray, H. Pimentel, P. Melsted and L. Pachter, Near-optimal probabilistic RNA-seq quantification, Nat. Biotechnol., 2016, 34(5), 525–527 CrossRef CAS PubMed.
- H. Pimentel, N. L. Bray, S. Puente, P. Melsted and L. Pachter, Differential analysis of RNA-seq incorporating quantification uncertainty, Nat. Methods, 2017, 14(7), 687–690 CrossRef CAS.
Footnotes |
| † Electronic supplementary information (ESI) available. See DOI: 10.1039/d1lc00067e |
| ‡ These authors contributed equally. |
| This journal is © The Royal Society of Chemistry 2021 |