 Open Access Article
Optimizing pressure-driven pulsatile flows in microfluidic devices†
Steffen M.
Recktenwald
 *a,
Christian
Wagner
 ab and
Thomas
John
 a
a
aDynamics of Fluids, Department of Experimental Physics, Saarland University, Saarbrücken, Germany. E-mail: steffen.recktenwald@uni-saarland.de
bPhysics and Materials Science Research Unit, University of Luxembourg, Luxembourg, Luxembourg
First published on 10th May 2021
Abstract
Unsteady and pulsatile flows receive increasing attention due to their potential to enhance various microscale processes. Further, they possess significant relevance for microfluidic studies under physiological flow conditions. However, generating a precise time-dependent flow field with commercial, pneumatically operated pressure controllers remains challenging and can lead to significant deviations from the desired waveform. In this study, we present a method to correct such deviations and thus optimize pulsatile flows in microfluidic experiments using two commercial pressure pumps. Therefore, we first analyze the linear response of the systems to a sinusoidal pressure input, which allows us to predict the time-dependent pressure output for arbitrary pulsatile input signals. Second, we explain how to derive an adapted input signal, which significantly reduces deviations between the desired and actual output pressure signals of various waveforms. We demonstrate that this adapted pressure input leads to an enhancement of the time-dependent flow of red blood cells in microchannels. The presented method does not rely on any hardware modifications and can be easily implemented in standard pressure-driven microfluidic setups to generate accurate pulsatile flows with arbitrary waveforms.
1 Introduction
Pulsatile flows are ubiquitous in nature and technology. In microfluidic devices, pulsatile or oscillatory driving of the flow enhances a broad range of operations and is also used for biomimicry in physiological studies.1,2 The inherent time-dependency of velocity, shear stress, and pressure in such flows plays a pivotal advantage in a variety of microfluidic applications, such as mixing,3–5 droplet generation,6–8 clog mitigation, and filtration of circulating tumor cells from whole blood,9 in bioassays,10 and for particle manipulation.11–13 Additionally, due to their potential to improve the growth and viability of mechanosensitive cells, pulsatile flows are used in bioreactors for regenerative tissue engineering and to enhance microfluidic cell culture efficacy.14,15 Moreover, pulsatile flows play a crucial role in biological processes, foremost in the cardiovascular system that transports blood through the body, driven by the pulsatile heartbeat. Here, mimicking hemodynamic conditions in pulsatile blood flow is essential to understand cardiovascular diseases, and recent studies have shown that unsteady driving can give rise to unique nonlinear hydrodynamic instabilities and turbulence in pulsating flows.16,17Therefore, precise control of the time-dependent flow field in microfluidic experiments is paramount. To drive a pulsatile flow in microfluidic channels, different generation mechanisms exist, including active, passive, external, and on-chip strategies.1,2 Sophisticated microfluidic setups with surface acoustic wave-driven flow chambers18 or complex cardiac-like flow generators19 have been used to examine the response of cells in pulsatile microscale flows. However, to generate pulsatile or oscillatory flows in microfluidic systems, most studies rely on commercially available pumps or pressure controllers. Most of such pneumatically operated pressure pumps can be programmed to generate arbitrary pressure waveforms. Nevertheless, they often produce significant deviations from the desired waveform, including overshoots at sudden pressure changes and long response times due to the internal pressure regulation of the controller. These effects can render the generation of hemodynamic and physiologically relevant flow conditions void and hence often limit the application of commercial pressure controllers in experimental investigations.
In this study, we present a software-based approach to overcome such limitations and to achieve an optimized pulsatile flow in pressure-driven microfluidic systems. Therefore, we use two commercially available pressure controllers. In the standard operation mode, these devices generate significant deviations between the desired and actual output pressure signals. While one system shows overshoots and undershoots, the other system produces long transients at sudden pressure jumps. Consequently, we introduce a procedure to derive an adapted pressure input, based on the linear response of the systems. Based on two individual parameters of the system, this adapted pressure input results in an optimized pressure output for both controllers and for various pulsatile waveforms, which significantly improves the time-dependent flow in microfluidic channels. Those setup-dependent parameters are derived for two distinct microfluidic devices from the system response to a sinusoidal driving at various frequencies. We show that the system characteristics mainly depend on the used pressure controller. Hence, for a given pump, the system parameters have to be determined once and can then be used to optimize the time-dependent flow in different microfluidic chips in the same setup. Finally, we employ the optimization technique to study red blood cells (RBCs) in pulsatile microscale flows, highly relevant for investigations of cell dynamics and shape transitions in unsteady flows.
2 Experimental
2.1 Microfluidic setup
We use two commercial pressure controllers, the Elveflow OB1-MK3 and the Fluigent Flow-EZ, to drive fluid through a microfluidic device. Both pressure devices have been used in various microfluidic studies11,12,20–23 and are referred to as OB1 pump and as Flow-EZ pump throughout this study. The pressure controller outlet is connected to a 1.5 mL tube containing the fluid sample. Prior to the sample, the time-dependent pressure signal is measured with a differential pressure sensor (NXP MPX5100DP, pressure range 0–1000 mbar) operating at 1 kHz. The sensor voltage signal is recorded over time (National Instruments USB-6009 multi-function DAQ) and converted to millibar. The fluid sample is then pumped through one of three different microfluidic channels. The first microfluidic chip consists of 30 parallel microchannels with a square cross-section of width W and height H of approximately 10 × 10 μm2 and a total length of L = 40 mm. The parallel channels are connected at the beginning and end where they share a common fluid inlet and outlet. Further, we use a dividing T-junction as a second channel. Here, the cross-section of the inlet channel has a width W = 120 μm, a height of H = 50 μm, and a length of Lin = 30 mm. The two outlets have a cross-section of 60 × 50 μm2, and a length of Lout = 15 mm. While the first two chips are used to characterize the system response, the third device is used for PIV analysis of the time-dependent flow field and contains a single straight channel with a square cross-section of 60 × 60 μm2 and a length of L ≈ 28 cm. The microfluidic devices are fabricated using polydimethylsiloxane (PDMS, Momentive Performance Materials) through standard soft lithography.24 Inlet and outlet channels are connected with micro medical-grade polyethylene tubing (0.86 mm inner diameter, Scientific Commodities Inc.) to the sample and waste containers, respectively. The microfluidic device is mounted on an inverted microscope (Nikon Eclipse TE2000-S), equipped with a high-speed camera (Fastec HiSpec 2G) and a LED illumination (Zett Optics ZLED CLS 9000 MV-R). A global trigger signal is used to synchronize the pressure device, the pressure sensor, and the high-speed camera. All experiments are performed at room temperature.2.2 Flow velocimetry
We employ particle image velocimetry (PIV) in the single-channel device using open-source PIV software.25 The origin of the coordinate system in the x-direction is defined at the channel entry at L = 0 and W/2 and H/2 in y- and z-direction, respectively. We use water as test fluid, seeded with 0.02 wt% of 0.5 μm sized polystyrene particles (Sigma Aldrich), to spatially resolve the velocity profile along the channel width W. A 60× oil-immersion objective (Nikon Plan Apo Fluor) with high numerical aperture NA = 1.4 is used to reduce the depth of field. Images are recorded in the middle plane z = 0 at H/2. Here, the measurement depth δzm over which particles are detected and contribute to the determination of the velocity field is δzm/H ≈ 0.05.26Furthermore, we perform particle tracking velocimetry (PTV) by detecting the movement of individual RBCs in the 30 parallel channels. A 4× air objective (Nikon Plan Fluor) with NA = 0.13 is used, which results in the detection of cells in multiple channels and the entire cross-section of the channels (δzm/H ≈ 25). A self-written MATLAB program is used to detect the positions of individual cells in each image, which are linked over the image sequence and result in individual trajectories. From these trajectories, we determine the individual velocities of the RBCs.
2.3 Red blood cell suspension preparation
Capillary blood is taken with informed consent from healthy voluntary donors and resuspended in phosphate-buffered saline solution (PBS, Gibco). After centrifugation at 1500g for 5 minutes, RBCs are extracted from the sediment and are washed with PBS. This procedure is repeated three times. The final hematocrit concentration of roughly 0.1% Ht is adjusted in a PBS solution, containing 1 mg mL−1 bovine serum albumin (BSA, Sigma Aldrich) to prevent cells from adhering to the inner channel surfaces. Blood withdrawal, preparation, and experiments were performed according to regulations and protocols that were approved by the ethic commission of the ‘Aerztekammer des Saarlandes’ (reference no 24/12).3 Results and discussion
3.1 Characterizing the microfluidic systems
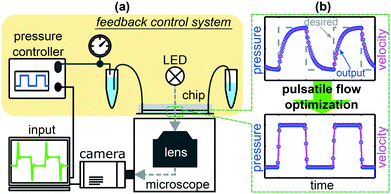
Applying a time-depending pressure variation to a commercial pressure controller can lead to significant differences between the set input signal and the actual output pressure, in particular at rapid changes. Here, we analyze the microfluidic setup that consists of the pressure controller with internal valves and pressure sensors, the tubing, and the connected microfluidic chip. This setup acts as a feedback control system. A schematic representation of the setup and the control system is shown in Fig. 1(a). A widely used general linear feedback control loop for instantaneous regulations is the proportional-integral-derivative (PID) controller. In general, an error value e(t) as the difference between the desired value r(t) and the measured adopted value y(t) is corrected based on proportional, integral, and derivative terms.27,28To characterize the frequency response of the systems, we apply sinusoidal pressure modulations
pset(t) = p0 + pA,set![[thin space (1/6-em)]](https://www.rsc.org/images/entities/char_2009.gif) sin(ωt), sin(ωt), | (1) |
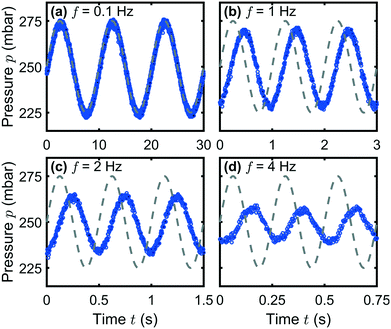
At low frequencies, the system adapts to the set pressure limits during each period without delay and attenuation, as shown for f = 0.1 Hz in Fig. 2(a). With increasing frequency, the output signal remains sinusoidal. However, the amplitude pA of the output pressure signal is attenuated (b–d), with respect to the set amplitude pA,set, and a phase shift φ arises. This deviation continues until only a constant pressure output is generated by the pump above f ≈ 8 Hz (Fig. S1, ESI†). At high frequencies, the pressure signal starts to deviate from the sinusoidal waveform and the system becomes slightly nonlinear, as shown in Fig. 2(d).
The dependence of the pressure amplitude ratio pA/pA,set as well as the phase shift φ at not too high frequencies can be described by linear response theory and allows us to characterize the systems, similar to previous microfluidic studies.35,36Fig. 3 shows the representative Bode plots as frequency response at p0 = 250 mbar for both investigated microfluidic systems (a) the microchannels and (b) the dividing T-junction. The left and right columns in (a) and (b) correspond to the Flow-EZ and the OB1 pump, respectively.
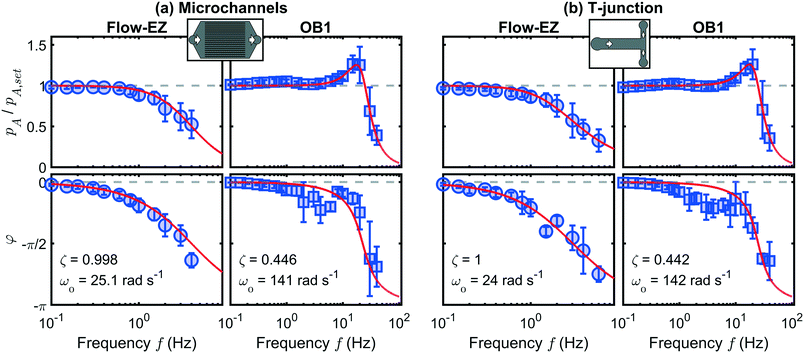 | ||
| Fig. 3 Pressure amplitude ratio pA/pA,set (top) and phase shift φ (bottom) at p0 = 250 mbar as a function of frequency f for (a) the microchannel system and (b) the dividing T-junction, as indicated by the schematic drawings in the top row. The left and right columns in (a) and (b) correspond to the Flow-EZ and the OB1 pump, respectively. Error bars correspond to averaging over different pressure amplitudes (5% ≤ pA,set ≤ 50% of p0). Red lines show the fit according to eqn (4) and (5) using the parameters in (a) and (b). | ||
At low frequencies in Fig. 3(a), both pumps reach the set amplitude of the pressure modulation, hence pA/pA,set = 1, as indicated by the horizontal dashed lines. For the Flow-EZ pump, pA/pA,set starts to decrease above f ≈ 0.6 Hz. In contrast, the pressure amplitude ratio for the OB1 pump first increases above f ≈ 4 Hz and reaches a maximum at f ≈ 20 Hz. Subsequently, the amplitude ratio decreases until only a constant pressure signal is generated above 40 Hz. We find these characteristic behaviors of the Flow-EZ and the OB1 pump shown in Fig. 3(a) for all investigated pressure off-sets p0, as shown in the ESI.† This shows the linear response of the systems up to high frequencies and amplitudes depending on the used pressure controller, as shown in Fig. 3. Additionally, we do not observe any significant influence of the two distinct microfluidic systems on the frequency response, shown in Fig. 3(a) and (b). Hence, the described approach can be used to initially determine the transmission characteristics of a standard microfluidic setup, consisting of a pressure controller, sample container, tubing, and an arbitrary microfluidic chip. These characteristics can subsequently be used to optimize the pulsatile flow in other microfluidic channels connected to the same pressure controller, sample container, and tubing.
For both microfluidic chips, the differences in the pressure regulation between both pumps arise due to different internal control parameters. When setting a time-dependent pressure signal pset(t), the devices use a PID algorithm to adapt the continuously measured pressure to the actual set value. This response of the systems p(t), which is the pump and the attached microfluidic chip can be modeled by a second-order differential equation, similar to a driven damped harmonic oscillator27,28
![[p with combining umlaut]](https://www.rsc.org/images/entities/i_char_0070_0308.gif) (t) + 2ζω0ṗ(t) + ω02p(t) = ω02pset(t), (t) + 2ζω0ṗ(t) + ω02p(t) = ω02pset(t), | (2) |
p(t) = p0 + a(ω)pA,set![[thin space (1/6-em)]](https://www.rsc.org/images/entities/char_2009.gif) sin(ωt + φ(ω)) sin(ωt + φ(ω)) | (3) |
 | (4) |
 | (5) |
We use this solution to fit the frequency response, shown as red lines in Fig. 3, and extract the system coefficients ζ and ω0 (see ESI†). In general, when ζ > 1 the system is overdamped and the pressure signal reaches the steady equilibrium state at a step response without oscillating. For damping ratios smaller than unity ζ < 1, the system is underdamped and oscillates with a gradually decreasing amplitude at sudden changes in the pressure signal. In the case of the underdamped system, we determine the resonance frequency  at which the amplitude is maximal for the OB1 pump as shown in Fig. 3.
The solution of eqn (3) enables us to predict the system response to arbitrary excitation waveforms. Furthermore, we calculate an adapted, optimized system input to achieve the desired output pressure waveform. Therefore, we expand an arbitrary set pressure waveform with period T into a finite complex Fourier series. A common problem with finite Fourier series expansion is the so-called Gibbs phenomenon, which leads to ringing at jump discontinuities, e.g., for a rectangular waveform. Here, we use a σ-approximation to reduce this ringing effect37 with the Lanczos σ-factor. This modification of the Fourier series for an arbitrary set pressure waveform leads to
 | (6) |
 | (7) |
3.2 Pressure output prediction and input optimization
The characterization of the system response to a sinusoidal driving enables us to predict the pressure regulation for arbitrary pressure modulations. Using the Fourier decomposition of the set pressure in eqn (6) and the analytic solution of the model eqn (3), we can predict the pressure output | (8) |
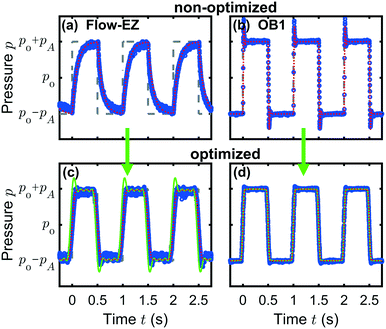
A representative result for the prediction of the pump response to a rectangular input pressure waveform is shown in Fig. 4(a) for the Flow-EZ pump and (b) for the OB1 pump. The input signals are plotted as gray dashed lines. The measured pressure signals are shown as blue symbols and the predicted responses are plotted as dotted red lines.
Fig. 4(a) and (b) demonstrate the pressure response due to internal PID regulations in the case of an abruptly changing input signal for the Flow-EZ and OB1 pump, respectively. The system in (a) is overdamped and the pump responds to the sudden increase or decrease in the set pressure by slowly approaching the pressure limits at p0 ± pA. In contrast, the system in (b) is underdamped and reacts faster to the abrupt change of the input signal, but generates overshoots and undershoots at the rising and falling edges of the set signal, respectively. This behavior is captured by the pressure predictions. In both cases, the predictions are in good agreement with the measured response. The response and predictions to other waveforms are shown in the ESI.†
Based on the linearity of the system, we can precalculate the required set pressure to achieve the desired output waveform. The amplitude modulation and phase shift by the system is a convolution and the corresponding deconvolution corrects those modulations and phase shifts.38 This finally leads to the adapted input signal
 | (9) |
Although the adapted pressure input results in a reduction of the overshoots and undershoots for the underdamped system, the approximation by a Fourier series can lead to a smoothing of discontinuities, i.e., the edges of the rectangular signal. This effect is shown for a broad range of lengths of the Fourier summation in the ESI.† Thus, the length of the Fourier summation has to be taken into account when applying the adapted pressure method to a signal with sudden pressure jumps.
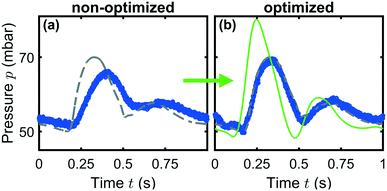
Finally, we apply this optimization method to a more sophisticated, temporal asymmetric, hemodynamic pressure modulation. Here, a blood pressure waveform in the femoral artery39 is set as an input signal to the Flow-EZ pump, as shown by the gray dashed line in Fig. 5(a). This waveform is characterized by a first systolic phase with a rapid increase in pressure up to a first peak, followed by a rapid decline. Subsequently, the pressure signal shows a second peak during the diastolic phase after the dicrotic notch. The non-optimized output generated by the pressure device is shown as blue symbols in Fig. 5(a). Here, the set systolic peak pressure is not reached during the cardiac cycle and the waveform is shifted in time. However, when applying the adapted, optimized input signal, as indicated by the green line in Fig. 5(b), we can generate a blood pressure waveform in close agreement with the hemodynamic data, which can be used to study cells in microchannels under physiologically relevant conditions using commercial pressure controllers without additional hardware modifications.
3.3 Pulsatile flow characterization
In this section, we apply the optimization technique to demonstrate the positive impact on the temporal velocity field of red blood cells in microfluidic channels.The temporal and spatial evolution of the flow field inside the microfluidic channels during a pulsatile pressure signal is examined through PIV and PT measurements. Generally, during experiments in microfluidic devices made of PDMS, the channel walls can be deformed considerably depending on the channel dimensions, the PDMS mixture, and the applied pressure drop.40–43 To evaluate the deformation of the channel during velocity measurements, we determine the width of a channel with a square cross-section of roughly 10 × 10 μm2 at various positions along the flow direction, and in range of 0 ≤ p ≤ 1000 mbar.
When no pressure is applied, the exact width averaged over multiple channels and along the x-direction is W = 9.57 ± 0.08 μm, as shown by the blue line in Fig. S7(a) in the ESI.† Increasing the pressure drop results in a slight increase of the channel width of 3.5% up to W = 9.90 ± 0.11 μm, measured at the channel middle L = 20 mm in the x-direction at the highest investigated pressure drop of p = 1000 mbar. Further, the channel width widens up to W = 9.81 ± 0.14 μm at the beginning of the channel at L = 5 mm with respect to a position close to channel end with W = 9.68 ± 0.19 μm at L = 35 mm at a pressure drop of p = 500 mbar, as exemplified in Fig. S7(b) (ESI†). In this study, velocity measurements are performed in the middle of the channels in x-directions with a maximum pressure amplitude of Δp = 500 mbar. Hence, we have to consider a maximum channel deformation of roughly 2.2% during the experiments shown here.
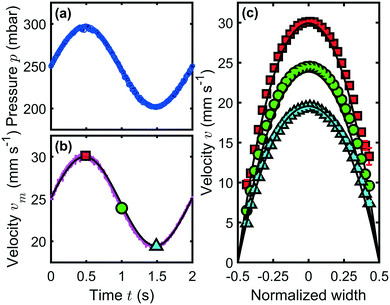
To characterize the velocity field during a time-dependent pressure modulation, we perform a PIV analysis of the flow inside a square 60 × 60 μm2 channel. Here, we employ a sinusoidal pressure oscillation with p0 = 250 mbar, pA = 50 mbar, and f = 0.5 Hz, as shown in Fig. 6(a). The temporal form of the maximum velocity vm in the channel center at W/2 and H/2 is shown as a magenta line in Fig. 6(b) and is in good agreement with an analytical prediction,44 indicated by the solid black line. We define the Reynolds number Re, which relates the inertial to viscous forces, as
 | (10) |
In pulsatile flows, the dimensionless Womersley number45 Wo relates transient inertia effects to viscous forces, according to
 | (11) |
For Wo ≪ 1, viscous effects dominate the flow and the pulsation frequency is small enough for the steady velocity profile to develop. However, when Wo ≫ 1, the transient inertia forces dominate the flow dynamics, which can result in strong deviations of the mean velocity from the Poiseuille flow profile. This effect can lead to flow reversal near the channel walls in pulsatile flows.44,46–49 In the experiment shown in Fig. 6, we find Wo ≈ 0.05, similar to the flow in arterioles at a heartbeat rate of f = 2 Hz. Hence, oscillatory inertia forces can be neglected and we observe parabolic flow profiles that are in good agreement with the analytical predictions, plotted as solid black lines in Fig. 6(c).
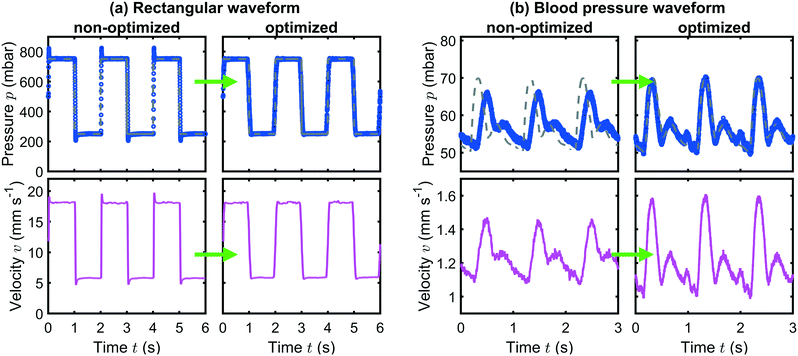
As demonstrated in Fig. 4 and 5, commercial pumps fail to produce the desired time-dependent pressure signal in the standard operation mode. Here, we focus on these two distinct waveforms and show how the optimized pressure input improves the time-dependent flow of RBCs inside microfluidic channels. First, we use the challenging rectangular waveform, which in principle provides a versatile instrument to study dynamical shape transitions and relaxation processes of cells and soft, deformable objects in abruptly changing flow fields if overshoots and undershoots or long transient in the pressure signal can be avoided. Second, we use a blood pressure waveform that can be used to study the flow behavior of RBCs, provided that the time-dependent hemodynamic flow conditions are precisely mimicked. The effect of optimized pressure input on the flow of RBCs is shown in Fig. 7(a) and (b) for the rectangular and the blood pressure waveforms, respectively. The left and right columns in (a) and (b) correspond to the non-optimized and the optimized pressure input, respectively.
In Fig. 7(a), a rectangular pressure modulation with p0 = 500 mbar, pA = 250 mbar, and f = 0.5 Hz is applied using the OB1 pump. For the non-optimized case in (a), the overshoots and undershoots of the signal are clearly visible when the pressure changes abruptly. These effects are reduced when the adapted pressure input is used, as shown in the right panel of Fig. 7(a). During these pressure pulsations, RBCs are tracked in the microchannels and their individual velocities are determined. Based on these individual velocities, the mean velocity at each point in time is calculated and plotted in the bottom row of Fig. 7. In the case of the non-optimized pressure input, the overshoots and undershoots in the pressure signal are also reflected in the average velocity, because of the small Re ≈ 0.2. However, applying an adapted pressure input results in a significant reduction of these effects. Due to the small channel dimensions, the pulsatile flow reaches a periodic steady-state immediately after the pulsating pressure signal is applied, in accordance with numerical predictions based on the set pressure waveform.46–48 Due to the finite length of the Fourier summation (kmax = 10) used to calculate the adapted pressure input in Fig. 7(b), the abrupt pressure jumps and hence the velocity is gradually smoothed, as shown in Fig. S8 (ESI†). Additionally, we observe a small time delay of Δt ≈ 8 ms between the pressure and average velocity signal in Fig. 7, independent of the applied pressure input. Since Re ≪ 1 and Wo ≪ 1, the observed time delay does not arise as a consequence of transient inertia forces, as predicted numerically at higher Wo,44,46,48,49 but might be caused by air in the sample container or by any compliance in the setup components.35
In addition to the abruptly changing pressure signal in Fig. 7(a), we further apply a waveform of biological interest in Fig. 7(b). As discussed in Fig. 5, the set systolic peak pressure and thus RBC velocity is not reached during the cycle and the waveform is shifted in time for the non-optimized case in Fig. 7(b). However, applying the optimized approach reduces the time delay and generates a time-dependent pressure and velocity modulation in good agreement with the desired signal.
As exemplified in Fig. 7 for two distinct waveforms, the presented approach can be used to optimize pressure-driven time-dependent flows with arbitrary waveforms. Particularly, the tracking of RBCs in such optimized pulsatile flows provides a versatile platform to study RBC dynamics and shape transitions as a function of the pressure waveform, amplitude, and frequency of the flow modulation. Therefore, the optimized pressure input introduced here can be used in future studies, in an effort to understand how the time scale of the flow couples with the characteristic time scale of single RBCs in capillaries.
4 Conclusions
As microscale pulsatile flows become more important for various microfluidic operations and physiological studies, accurate control of the time-dependent flow conditions is paramount. Therefore, we introduce a software-based optimization approach, which improves the pulsatile pressure output, and thus the microfluidic flow, in a state-of-the-art, pressure-driven microfluidic setup without hardware modifications.We experimentally probe the amplitude and phase response of two distinct microfluidic systems as a function of frequency to a sinusoidal input for two commercially available pressure controllers and model their distinctive pressure regulation based on a second-order differential equation. This allows us to predict the pressure output of various pulsatile waveforms, including rectangular, triangular, sawtooth, and arterial blood pressure modulations, which deviate significantly from the desired input waveforms. Further, we show how to generate an adapted pressure input based on a modified Fourier series approximation that results in more accurate pulsatile waveforms. Performing particle tracking velocimetry of red blood cells in microchannels reveals a reduction of unwanted velocity overshoots of a rectangular pressure signal and an enhancement of a hemodynamic waveform when applying the adapted pressure input. Our method can be easily implemented without hardware modifications in commonly used pressure-driven microfluidic setups and provides a relevant tool for studying biological systems in precisely controlled pulsatile microscale flows.
Author contributions
SMR conducted the experiments, acquired and analyzed data, and wrote the manuscript. SMR and TJ conceptualized the optimization method. SMR, TJ, and CW discussed and interpreted data. TJ and CW reviewed and edited the manuscript.Conflicts of interest
There are no conflicts to declare.Acknowledgements
This work was supported by the Deutsche Forschungsgemeinschaft DFG in the framework of the research unit FOR 2688 ‘Instabilities, Bifurcations and Migration in Pulsatile Flows’ WA 1336/13-1.References
- C. K. Byun, K. Abi-Samra, Y.-K. Cho and S. Takayama, Electrophoresis, 2014, 35, 245–257 CrossRef CAS.
- B. Dincau, E. Dressaire and A. Sauret, Small, 2020, 16, 1904032 CrossRef CAS PubMed.
- J.-H. Tsai and L. Lin, Sens. Actuators, A, 2002, 97–98, 665–671 CrossRef CAS.
- R. A. Truesdell, P. V. Vorobieff, L. A. Sklar and A. A. Mammoli, Phys. Rev. E, 2003, 67, 066304 CrossRef CAS.
- K. Ward and Z. H. Fan, J. Micromech. Microeng., 2015, 25, 094001 CrossRef PubMed.
- K. Chaudhury, S. Mandal and S. Chakraborty, Phys. Rev. E, 2016, 93, 023106 CrossRef PubMed.
- C. Zhou, P. Zhu, Y. Tian, X. Tang, R. Shi and L. Wang, Lab Chip, 2017, 17, 3310–3317 RSC.
- P. Zhu and L. Wang, Lab Chip, 2017, 17, 34–75 RSC.
- Y. Yoon, S. Kim, J. Lee, J. Choi, R.-K. Kim, S.-J. Lee, O. Sul and S.-B. Lee, Sci. Rep., 2016, 6, 26531 CrossRef CAS PubMed.
- C. Zhang, H. Wang and D. Xing, Biomed. Microdevices, 2011, 13, 885–897 CrossRef PubMed.
- S. M. McFaul, B. K. Lin and H. Ma, Lab Chip, 2012, 12, 2369 RSC.
- Y. Lee, D.-M. Kim, Z. Li, D.-E. Kim and S.-J. Kim, Lab Chip, 2018, 18, 915–922 RSC.
- J. Lee, S. E. Mena and M. A. Burns, Sci. Rep., 2019, 9, 1278 CrossRef CAS PubMed.
- Y. S. Morsi, W. W. Yang, A. Owida and C. S. Wong, J. Artif. Organs, 2007, 10, 109–114 CrossRef PubMed.
- D. Du, K. S. Furukawa and T. Ushida, Biotechnol. Bioeng., 2009, 102, 1670–1678 CrossRef CAS PubMed.
- D. Xu, S. Warnecke, B. Song, X. Ma and B. Hof, J. Fluid Mech., 2017, 831, 418–432 CrossRef CAS.
- D. Xu, A. Varshney, X. Ma, B. Song, M. Riedl, M. Avila and B. Hof, Proc. Natl. Acad. Sci. U. S. A., 2020, 117, 11233–11239 CrossRef CAS PubMed.
- L. Schmid, A. Wixforth, D. A. Weitz and T. Franke, Microfluid. Nanofluid., 2012, 12, 229–235 CrossRef.
- H. Chen, J. Cornwell, H. Zhang, T. Lim, R. Resurreccion, T. Port, G. Rosengarten and R. E. Nordon, Lab Chip, 2013, 13, 2999 RSC.
- Y. Chen, H. N. Chan, S. A. Michael, Y. Shen, Y. Chen, Q. Tian, L. Huang and H. Wu, Lab Chip, 2017, 17, 653–662 RSC.
- C. Iss, D. Midou, A. Moreau, D. Held, A. Charrier, S. Mendez, A. Viallat and E. Helfer, Soft Matter, 2019, 15, 2971–2980 RSC.
- A. Abay, S. M. Recktenwald, T. John, L. Kaestner and C. Wagner, Soft Matter, 2020, 16, 534–543 RSC.
- B. R. Mutlu, T. Dubash, C. Dietsche, A. Mishra, A. Ozbey, K. Keim, J. F. Edd, D. A. Haber, S. Maheswaran and M. Toner, Lab Chip, 2020, 20, 1612–1620 RSC.
- J. Friend and L. Yeo, Biomicrofluidics, 2010, 4, 026502 CrossRef.
- W. Thielicke and E. J. Stamhuis, J. Open Res. Softw., 2014, 2, 1–10 CrossRef.
- C. D. Meinhart, S. T. Wereley and M. H. B. Gray, Meas. Sci. Technol., 2000, 11, 809–814 CrossRef CAS.
- J. R. Leigh, Control Theory, Iet, 2004, vol. 64 Search PubMed.
- J. Bechhoefer, Rev. Mod. Phys., 2005, 77, 783–836 CrossRef.
- J. C. A. Cluitmans, V. Chokkalingam, A. M. Janssen, R. Brock, W. T. S. Huck and G. J. C. G. M. Bosman, BioMed Res. Int., 2014, 2014, 1–9 CrossRef PubMed.
- A. Guckenberger, A. Kihm, T. John, C. Wagner and S. Gekle, Soft Matter, 2018, 14, 2032–2043 RSC.
- A. Saadat, D. A. Huyke, D. I. Oyarzun, P. V. Escobar, I. H. Øvreeide, E. S. G. Shaqfeh and J. G. Santiago, Lab Chip, 2020, 20, 2927–2936 RSC.
- E. Kaliviotis, D. Pasias, J. Sherwood and S. Balabani, Med. Eng. Phys., 2017, 48, 23–30 CrossRef CAS PubMed.
- J. M. Sherwood, J. Dusting, E. Kaliviotis and S. Balabani, Biomicrofluidics, 2012, 6, 024119 CrossRef CAS PubMed.
- J. M. Sherwood, E. Kaliviotis, J. Dusting and S. Balabani, Biomech. Model. Mechanobiol., 2014, 13, 259–273 CrossRef PubMed.
- R. C. van der Burgt, P. D. Anderson, J. M. den Toonder and F. N. van de Vosse, Sens. Actuators, A, 2014, 220, 221–229 CrossRef CAS.
- Y.-J. Li, T. Cao and K.-R. Qin, Microfluid. Nanofluid., 2018, 22, 81 CrossRef.
- R. Hamming, Numerical methods for scientists and engineers, Courier Corporation, 2012 Search PubMed.
- T. John, D. Pietschmann, V. Becker and C. Wagner, Am. J. Phys., 2016, 84, 752–763 CrossRef.
- M. Willemet, P. Chowienczyk and J. Alastruey, Am. J. Physiol., 2015, 309, H663–H675 CAS.
- T. Gervais, J. El-Ali, A. Günther and K. F. Jensen, Lab Chip, 2006, 6, 500 RSC.
- B. S. Hardy, K. Uechi, J. Zhen and H. Pirouz Kavehpour, Lab Chip, 2009, 9, 935–938 RSC.
- A. Raj and A. K. Sen, Microfluid. Nanofluid., 2016, 20, 31 CrossRef.
- A. Raj, P. P. A. Suthanthiraraj and A. K. Sen, Microfluid. Nanofluid., 2018, 22, 128 CrossRef.
- R. Blythman, T. Persoons, N. Jeffers, K. Nolan and D. Murray, Int. J. Heat Fluid Flow, 2017, 66, 8–17 CrossRef.
- J. R. Womersley, J. Physiol., 1955, 127, 553–563 CrossRef CAS PubMed.
- X. Qi, D. Scott and D. Wilson, Chem. Eng. Sci., 2008, 63, 2682–2689 CrossRef CAS.
- K. Haddad, Ö. Ertunç, M. Mishra and A. Delgado, Phys. Rev. E, 2010, 81, 016303 CrossRef.
- K. S. Kim and M.-S. Chun, Korea Aust. Rheol. J., 2012, 24, 89–95 CrossRef.
- R. Blythman, T. Persoons, N. Jeffers and D. Murray, J. Phys.: Conf. Ser., 2016, 745, 032044 CrossRef.
Footnote |
| † Electronic supplementary information (ESI) available: One PDF containing additional experimental data and a MATLAB code, which contains the optimization procedure. See DOI: 10.1039/d0lc01297a |
| This journal is © The Royal Society of Chemistry 2021 |

