
 Open Access Article
 This Open Access Article is licensed under a Creative Commons Attribution-Non Commercial 3.0 Unported Licence
Nanocosm: a well plate photobioreactor for environmental and biotechnological studies†
Charlotte
Volpe
 *a,
Olav
Vadstein
a,
Geir
Andersen
b and
Tom
Andersen
c
*a,
Olav
Vadstein
a,
Geir
Andersen
b and
Tom
Andersen
c
aDepartment of Biotechnology and Food Science, Norwegian University of Science and Technology, N-7491, Trondheim, Norway. E-mail: charlotte.volpe@ntnu.no
bDead Bug Prototypes, N-4326, Sandnes, Norway
cDepartment of Biosciences, Section for Aquatic Biology and Toxicology (AQUA), University of Oslo, N-0316, Oslo, Norway
First published on 13th April 2021
Abstract
Phytoplankton are key primary producers at the bottom of the aquatic food chain. They are a highly diverse group of organisms essential for the functioning of our ecosystems and because of their characteristics, their biomass is considered for various commercial applications. A full appreciation of their abundance, diversity and potential is only feasible by using systems that enable simultaneous testing of strains and/or variables in a fast and easy way. A major bottleneck is the lack of a cost-effective method with the capacity for complex experimental set-ups that enable fast and reproducible screening and analysis. In this study, we present nanocosm, a versatile LED-based micro-scale photobioreactor (PBR) that allows simultaneous testing of multiple variables such as temperature and light within the same plate. Every well can be independently controlled for intensity, temporal variation and light type (RGB, white, UV). We show that our systems guarantee homogeneous conditions because of controlled temperature and evaporation and adjustments for light crosstalk. By ensuring controlled environmental conditions the nanocosm is suitable for running factorial experimental designs where each well can be used as an independent micro-PBR. To validate culture performances, we assess well-to-well reproducibility and our results show minimal well-to-well variability for all the conditions tested. Possible modes of operation and application are discussed together with future development of the system.
1. Introduction
Microalgae are a highly diverse group of primary producers and key actors in the aquatic food web.1 Lately, increased eutrophication has led to a rise in algae blooms, causing widespread anoxia, habitat loss and a decline in biodiversity.2 These episodes are considered a direct consequence of human-related activities and have a vast array of ecological and socio-economic consequences.2–5 A bottleneck for understanding microalgal ecology and the negative consequences of various anthropogenic stressors is the capacity for large and complex experiments. Moreover, microalgae have recently attracted attention for their various biotechnological uses with possible applications in the nano-, bio- and environmental technology sectors.6–9 Even if the commercial potential of microalgae is widely recognized, the industrial applications are still limited to a few strains producing high-value products due to high production costs. Again, efficient methods for screening strains of interest and identifying the ideal growth conditions represents a major bottleneck for commercialization of algae-derived products.A large number of experimental systems have been developed during the past 50–100 years to overcome these issues, but a general problem is running these systems in the high number of units needed for complex experimental designs and for accurate parameter estimation. To date, most of the experimental set-ups are based on illuminated shaking/bubbling flasks. This kind of experimental design requires a lot of space and limits how many variables can be tested in one experiment. Because of the interdependence between many of these variables, a one-at-a-time experimental approach can give erroneous conclusions. Moreover, several of the established experimental systems are costly and laborious to operate, which puts extra constraints on the number of cultivations systems that can be run in parallel. In contrast to the rapid development in high-throughput screening systems for heterotrophs,10,11 the advances in fast screening methods for phototrophs have been limited. It has been estimated that there could be anything between 300![[thin space (1/6-em)]](https://www.rsc.org/images/entities/char_2009.gif) 000 and over 1 million algae species at present. Of these, approximately 43918 have been described,12 but physiological and molecular studies are limited to a handful of species and model organisms.13 This results in a poor understanding of the overall variability in algal physiology and ecology and a limited knowledge regarding possible by-products that might be of interest for industry and other applications. This emphasizes the need for an easy system that enables fast screening to understand and exploit the diversity of this group of organisms.
000 and over 1 million algae species at present. Of these, approximately 43918 have been described,12 but physiological and molecular studies are limited to a handful of species and model organisms.13 This results in a poor understanding of the overall variability in algal physiology and ecology and a limited knowledge regarding possible by-products that might be of interest for industry and other applications. This emphasizes the need for an easy system that enables fast screening to understand and exploit the diversity of this group of organisms.
In the past years there has been some advances in this field and some miniature photo-incubator prototypes have been described.14–16 However, compared to the well-developed reactors available for screening microbial heterotrophs, they all suffer from some drawbacks. The main problems were related to light crosstalk, evaporation, low reproducibility, and inhomogeneous illumination. Previously described systems have reported liquid loss of up to 25% at day 5 of cultivation.14 This amount of evaporation will influence the overall experiment, especially if a certain amount of volume is needed for downstream experiments (i.e. harvesting of cells for pigment analysis) and if salinity is critical. Moreover, low reproducibility for physiological parameters has been reported as a consequence of the edge effect, leading the authors to exclude the outer wells.14 This will result in a sub-optimal use of the well plate systems and reduce the numbers of strains/mutants than can be screened in parallel within one plate. Light crosstalk can be a problem in well plate experimental set-ups. This issue is maximized when using transparent well plates, and no variation in light conditions can be used reliably within such plates. Most micro-PBR systems presented to date partially overcome the light crosstalk problem by using black well plates.15,16 This is not optimal for experiments performed with phototrophs because the black plate will partially absorb the light, leading to uncertainty regarding the actual light reaching the microalgae. Without proper corrections for light, such a small growth system will generate substantial variation in light. In micro-PBR systems, recently reported variation in light was approximately 10% after corrections15 and not homogeneously distributed throughout the plate.17
Here we present and validate the nanocosm: a newly developed well plate and light-emitting diode ( LED)-based PBR suitable for running factorial experimental designs. The system presents a substantial improvement with respect to all the drawbacks mentioned above. Incubators are available in white light, RGB or UV light, with each LED being individually regulated by a microcontroller. We describe the principles and the architecture of the system, investigate critical factors for reliable cultivation, show a range of possible modes of operation, discuss possibilities for measurements in small volumes, show some examples of real applications and discuss possible future developments of the system.
2. Experimental methods
2.1 Principles, architecture and design of the system
Light-emitting diodes (LEDs) are non-linear semiconductor devices that emit light when current flows through them. Because the current rises exponentially with applied voltage, LEDs are usually operated through an external constant-current circuit. Modern LED controllers are integrated circuits that can supply constant current through multiple LEDs (typically, 8, 16 or 32) and can also control their individual light output by the so-called pulse-width modulation (PWM). These circuits can be daisy-chained to provide a contiguous LED address space across multiple chips (6 × 16-channel chips can address 96 LEDs). In PWM-regulated LEDs, power is switched on and off in a fast duty cycle (typically >1 kHz) such that the relative length of the on phase determines the light output. In recent generations of programmable multicolor (RGB) LEDs (e.g. Adafruit NeoPixels, https://www.adafruit.com/category/168), both the constant-current circuit and the PWM controller are integrated on the same chip as the LEDs. These circuits are available in many shapes and geometries, but unfortunately none that fit directly to the dimensions of standard microplates.Custom-built 96-well LED light sources used in our labs have evolved through several generations as the state of LED-controller technology has improved. The first boards used six 16-channel TLC5940 chips (http://www.ti.com/lit/ds/symlink/tlc5940.pdf), controlled by an integrated ATMEGA microcontroller on the board (Fig. 1c). Whereas the TLC5940 requires substantial software “bit-banging” to control the PWM cycle, the next generation was based on LED controllers with integrated PWM circuitry (http://www.ti.com/lit/ds/symlink/tlc59116.pdf) interfaced by an I2C bus (Fig. 1a). The ESI† (Files S1–S3) includes schematics and printed circuit board (PCB) production Gerber files for this version (all designed by GA using the freeware version of DipTrace https://diptrace.com/download/download-diptrace/); thus, interested readers should be able to produce their own boards. Finally, with the appearance of integrated RGB LEDs like NeoPixels, it is now possible to build entire boards with 96 daisy-chained “intelligent” LEDs. All our boards have the same geometry with an onboard ATMEGA microcontroller (https://www.microchip.com/wwwproducts/en/ATmega328p) set up with the Arduino bootloader so that it can be programmed directly from the Arduino development system (https://www.arduino.cc/en/Main/Software) through an onboard FT232RL USB to a serial UART chip (https://www.ftdichip.com/Products/ICs/FT232R.htm) (Fig. 1). 96 independent micro-PBRs each with a volume of 0.3 cm3 (28.8 cm3 for 96 wells) can be run in parallel with the nanocosm board using minimal space: 14.7 cm d × 8.3 cm w × 1.5 cm h (height: 9 cm, if the cooling vent and Peltier element are added). The nanocosm described here is also smaller than previous micro-PBR systems for screening of microalgae,17,18 reducing even further the space needed. Common standard conditions include batch cultures with a volume ranging from 50 to 150 cm3 (4800–14400 cm3 for 96 separate batch cultures) grown in big rooms with temperature control. By using the nanocosm rather than common standard conditions, a down-scaling between 170 and 500 of the total volume is achieved.
 | ||
| Fig. 1 Pictures illustrating the nanocosm micro-photobioreactor (PBR) system. (a) Representation of the latest version of the nanocosm board with the ATMEGA microcontroller directly onto the board. The board registers as an Arduino Leonardo and can be programmed via a mini-USB plug. The board also exists in a UV version and an RGB version. (b) Nanocosm board equipped with a Peltier element and a small fan to dissipate heat produced by the board. (c) Example of a possible light output achieved with the nanocosm. LED lights programmed to generate a light gradient increasing from right to left from 10 μmol photons m−2 s−1to 500 μmol photons m−2 s−1. | ||
2.2 Control of light intensity and quality
LEDs have inherent variability in their light output at a given current load, which may vary between suppliers and production batches but is rarely negligible. Thus, individual LED boards need to be calibrated before they can be used in quantitative experiments. We have found spherical micro quantum sensors like Walz US-SQS/L (Walz GmbH, Effeltrich, Germany) to be particularly suitable for this purpose because they fit directly inside wells of 96-well plates. The calibration procedure typically consists of setting all LEDs at the same duty cycle (typically 50%) and measuring outputs of individual LEDs. The resulting calibration factors are then hardcoded into the Arduino program code controlling the board (an Arduino file illustrating this is present in the ESI† as File S4). Note that this means that one must keep track of separate Arduino program codes for each individual board.Microwell plates come in many different colors and materials. The most common is clear polystyrene, which is not suitable for any application where wells are exposed to different irradiances. Black plastic materials obviously have the lowest crosstalk between adjacent wells, but also the disadvantage that the wall material absorbs a large fraction of the LED output.19 The best compromise, in our experience, is to use white plates which have much lower light loss than black plates and less crosstalk than clear plates. The crosstalk in white plates is usually limited to the 4 nearest neighbors (or 3/2 for edge/corner wells). ESI† File S5 contains an example of an R script that can be used to construct crosstalk-adjusted light gradients in white microplates by solving a system of linear equations.
Most applications use white LEDs. They are spectrally quite different from sunlight as they are typically constructed from a blue LED supplemented with various fluorescent dyes such that a fraction of the blue light is emitted in longer wavelengths (the spectrum of the white-LED used for the nanocosm boards is available in Fig. 3; http://www.farnell.com/datasheets/77875.pdf). We have also used boards with monochromatic LEDs, especially LEDs emitting in the UVA region (e.g. 390 nm), in experiments involving the effects of UV radiation on DNA damage, reactive oxygen species production, etc.20,21 Recently, we have also used NeoPixel-based boards to investigate the effects of different light color combinations on the growth of microalgae.5 The specifications of wavelength (wl) broadband and luminous intensity for each color are red: wl 620–625 nm, luminous intensity (mcd): 390–420; green: wl 522–525 nm, luminous intensity (mcd): 660–720; and blue: wl 465–467 nm, luminous intensity (mcd): 180–200.
2.3 Strains and cultivation system
We obtained an axenic Phaeodactylum tricornutum culture originating from the clone Pt1 8.6 (CCMP2561) from the culture collection of the Provasoli-Guillard National Center for Marine Algae and Microbiota (NCMA), Bigelow Laboratory for Ocean Sciences. Stock cultures were maintained at 16 °C and illuminated with continuous LED light at scalar irradiance (EPAR) of ∼20 μmol photons m−2 s−1. Cultures were grown in F/2-enriched,22 filtered and autoclaved seawater. Cultivation at well plate scale was performed in White Nunc™ MicroWell™ 96-well optical-bottom plates. For routine use each well was filled with 300 μL of culture adjusted to a cell concentration of 20000 cells/mL. During the experiments the cultivation systems were maintained at 16 °C in a growth cabinet kept dark to avoid contamination from other light sources. For the described experiments the nanocosms were programmed to have a light output of either 125 (HL) or 20 μmol photons m−2 s−1 (LL).
To compare the nanocosm growth system to standard lab procedures, growth experiments with P. tricornutum were performed under batch PBR conditions. Cell culture flasks from Corning (surface area 175 cm2; vented cap) were filled with 150 mL of culture and used as a control. To validate the performance of the nanocosm in comparison to standard growth techniques, batch PBRs were illuminated with the LED board from the nanocosm and growth was recorded by flow cytometry. A control experiment was performed by comparing the light source of the nanocosm with standard lighting from a microalgae growth room. The cultures were grown under continuous LED-light irradiance (spectrum of the LED light used is shown in Fig. S1†) at scalar irradiance (EPAR) of either ∼20 (LL) or ∼200 μmol photons m−2 s−1 (HL), and growth was recorded by flow cytometry.
2.4 Across-plate temperature control and evaporation losses
One of the critical factors for reliable cultivation is to ensure temperature control across the growth system. Variations in temperature were tested by measuring the temperature in 8 selected wells (see Fig. 2) across the plate, using a Tinytag temperature logger (Gemini). A test comparing the evaporation rates between a standard plate lid and a Breathe-Easy® (Sigma-Aldrich) sealing membrane was performed. The evaporation rate at standard cultivation conditions was evaluated gravimetrically. To compare the effect of volume on evaporation, a 96 well plate covered with the sealing membrane was filled with either 300 μL or 200 μL of water per well (total volume: 28.8 mL and 19.2 mL) and was incubated for one week. Liquid loss was quantified by weighing every 24 ± 1 h using a laboratory balance. | ||
| Fig. 2 Temperature in the wells exposed to a light output of either 125 μmol photons m−2 s−1 (high light, HL) or 20 μmol photons m−2 s−1 (low light, LL). (a) Schematic representation of the wells chosen for temperature measurements. Wells F3, E6 and F9 were chosen because of the known effect that the microchip on the board had on the temperature of the wells before the nanocosm was implemented with the cooling system. Wells H1, H4, E12, B3 and C8 were chosen as representative of the temperature conditions across the plate, where the board had no significant influence on the temperature (includes also three edge wells). (b) Boxplot of the temperatures measured in the wells in either HL or LL conditions. | ||
2.5 DIC limitation and pH control
Despite the large surface-to-volume ratio in these wells, inorganic carbon limitation can still occur because of high productivity and the impossibility to bubble the wells with air. When photosynthetic organisms are growing in such closed systems the pH can rise (exceeding pH 9), leading to an increase in the carbonate fraction of dissolved inorganic carbon (DIC).23 Under such conditions, carbon limitation is likely because no alga can use carbonate for C-fixation. To test this, pH measurements were performed daily using pH strips from VWR (range: 7 < pH < 14) in a growing P. tricornutum culture supplemented with F/2 medium for 7 consecutive days.2.6 Data acquisition and analysis
Growth was measured daily either indirectly by measuring optical density (OD; wl: 750 nm) and in vivo chlorophyll a (Chl a) fluorescence (IVF; Ex: 460 nm, Em: 680 nm) or directly by cell counts. OD and IVF were measured using a Tecan Pro 2000 plate reader at 5 different points in each well and averaged. OD measurements were performed from the top of the plate, whereas IVF measurements were done from the bottom. Cell count was performed using a BD Accuri C6 flow cytometer (BD Bioscience), where samples were excited by a 20 mW 488 nm solid-state blue laser, and red chlorophyll fluorescence emission was measured as light >670 nm by the use of a long-pass filter (FL3). The relationship between OD and IVF to cell counts was established by linear regression as goodness-of-fit measure. Specific growth rate (μ, d−1) was calculated as ln(xt/xt−1) for all the three methods tested, where xt and xt−1 represent the biomass at two successive days. The latter method was also used to calculate specific growth rate (μ, d−1) for the batch PBR used as a control.To obtain information regarding the pigment signature of the culture we harvested the biomass and performed a pigment extraction. When the cultures had reached early stationary phase, 200 μL of culture from each well was transferred to a 96-well PCR plate and cells were harvested by centrifugation at 4000 rpm for 15 min and stored at −80 °C overnight. The plates containing the cell pellets were freeze-dried for 22 h to remove water and to improve extraction yield.24 Subsequently pigments were extracted in 96% ethanol for 2 h in the dark at 4 °C. The absorbance spectra of the extracts were measured from 400 to 750 nm (1 nm resolution) using the aforementioned plate reader. The obtained spectra were used to estimate the ratio between chlorophyll a (Chl a) and the other pigments by spectral deconvolution.25,26
A typical well plate experiment produces a large number of growth curves. In a batch culture design, these curves usually conform to logistic growth, where an initial phase of exponential growth levels off to an asymptote of stable biomass (carrying capacity). Hierarchical models with the between-well variation in fitted growth model parameters described by normal distributions are very suitable for analyzing this type of grouped time series data (e.g., Pinheiro and Bates27). The so-called shrinkage effect of such models will effectively share information between groups, such that slow-growing units which do not fully reach the asymptotic phase will have estimates that are better constrained than if each of the growth curves were fitted individually.
We use the R package nlme27 to fit logistic growth curves across all units in well plate experiments using non-linear hierarchical models. We use a so-called self-starting logistic model function (SSlogis), which does not require initial values for the model parameter estimates. The parameterization of SSlogis is a bit unorthodox in the sense that population state at time x(y(x)) is:
By matching terms in the analytical solution we find the following equivalences: K = Asym, μ = scal−1, and y0 = Asym/(1 + exp(xmid/scal)).
3. Results and discussion
3.1 Critical factors for reliable cultivation
Temperature control is essential for every experimental system and might be even more relevant in micro-scale experiments. The heat generated by the board system and the LEDs can create well-to-well variation in temperature. When the nanocosm system was challenged with either a high light output or flashing light conditions, we observed an increase in the variation in temperature throughout the plate. To limit variations in temperature, the top of the incubator was equipped with a Peltier element and a small fan to dissipate heat produced by the board connected with the LED lights (Fig. 1b). Homogeneity and stability in temperature after this modification was assessed under high light (HL; 125 μmol photons m−2 s−1) and low light (LL; 20 μmol photons m−2 s−1) conditions. Temperature was measured for 15 consecutive minutes in 8 chosen wells throughout the plate (Fig. 2a). In low light conditions the average temperature was 16.05 °C ± 0.31 (SD), whereas in high light conditions the average temperature was 16.77 °C ± 0.73 (SD) (Fig. 2b). Even though the temperature fluctuation in HL was significantly different from the LL conditions (p-value: 0.02859), the maximum temperature deviation compared to the average conditions was only 4% in HL. Such slight variations will not cause any effect on the overall physiology, as most microalgae have a broad range of temperature optima within which growth is not affected29,30 (also confirmed by HL vs. LL correlation analysis in Fig. 9). We therefore conclude that for most conditions, temperature can be considered stable and reproducible.
When using these incubators, it is possible to generate a linear temperature gradient across the plate. Details are described by Thrane and colleagues,31 but in short we used a stainless steel plate heated at one end by a high power resistor and cooled at the opposite end by a Peltier element. This generated a controlled temperature gradient and made it possible to have temperature as an experimental variable within one plate.
000 cells/mL were grown at 125 μmol photons m−2 s−1 (HL) at 16 °C in a 96 well plate. OD and IVF were measured every 24 ± 1 h using the Tecan plate reader. The 750 nm wavelength used for OD measurements was chosen to avoid interference by photosynthetic pigments and reflect biomass induced scattering and not absorption of light. Fig. 3 shows the growth curves obtained from the OD (Fig. 3a) and the IVF (Fig. 3b) measurements. The boxplots in Fig. 3a shows that for OD measurements the variation between the 24 biological replicates increased over time, reaching an interquartile range of 9–9.1% on days 5 and 6 of the experiment. When using IVF the variation between the biological replicates was lower, with an interquartile range of 4.2–6.7% on days 5 and 6 (Fig. 3b).
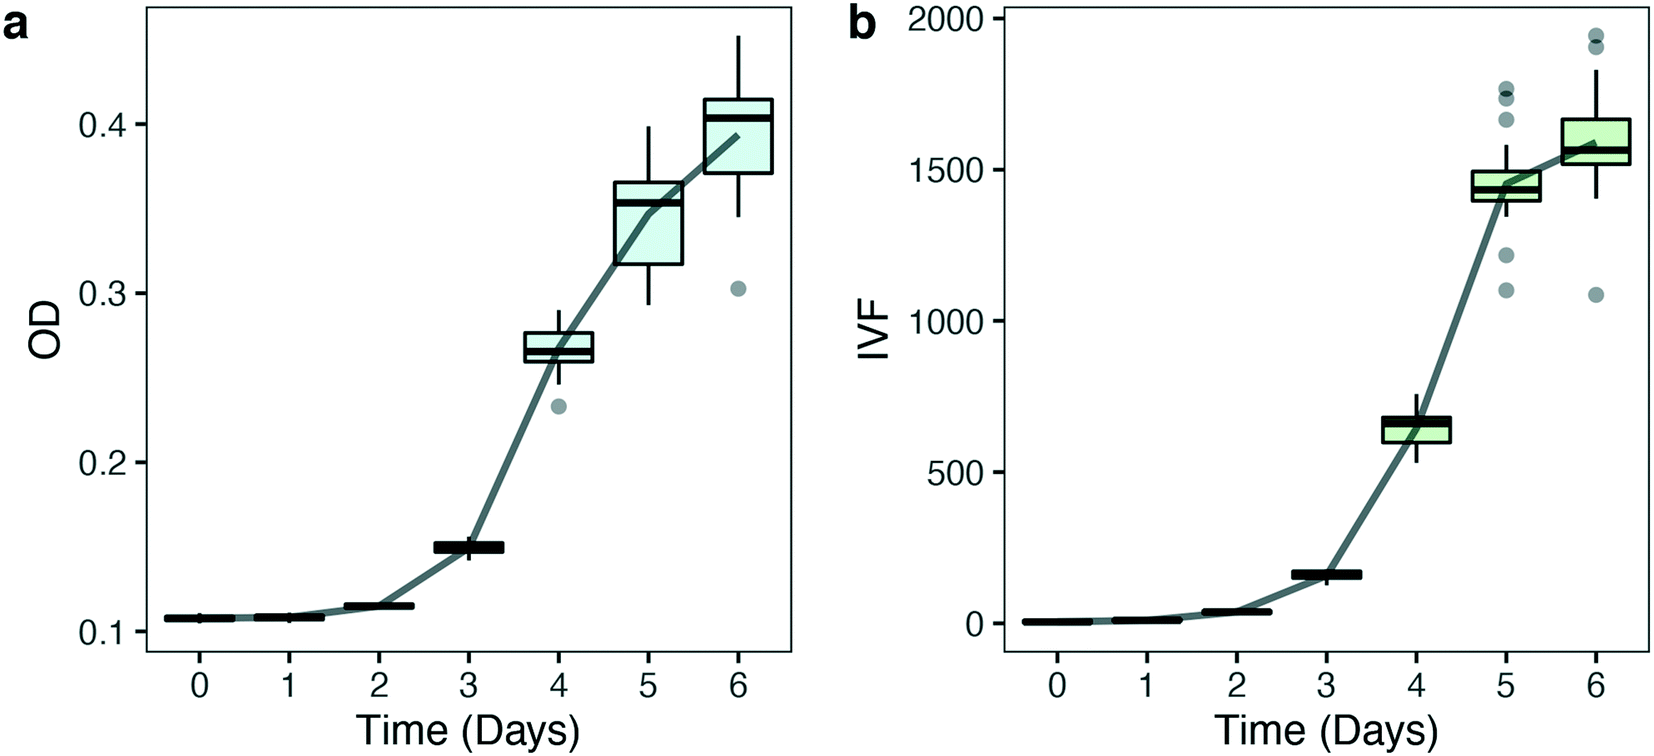 | ||
| Fig. 3 Biomass and growth quantification of 24 biological replicates of P. tricornutum exposed to constant light (125 μmol photons m−2 s−1) measured via either optical density (OD) (a) or in vivo Chl a fluorescence (IVF) (b). The solid line shows the average growth of the samples (n = 24). Boxplot shows statistics for each time point measured. Grey points represent outliers. | ||
Variation in OD measurements between biological replicates (Fig. 3a) might reflect physiological or phenotypical patterns in growth or variations caused by measuring bias. Part of the variability in Fig. 3a can be explained by the within-well variability found when OD measurements were performed. Fig. 4 shows the variability that results from performing multiple reads per well (5 different measurement points) when OD and IVF are measured in the same well (Fig. 4). When using OD, the within-well variation is high (Fig. 4a), reaching a maximum deviation of 33% on day 5 (Fig. S2a†). When performing multiple absorption reads per well the measurements of the middle point differ substantially from the other points measured and the differences increases over time (lower outlier, Fig. S2a†). This is probably a position-dependent measuring bias of the instrument due to the bottom transparency of the well plate or due to reflection from the white wells. As long as measurements are done in the same points this will not have a significant impact when considering changes over time but might be an issue if absolute values are necessary. In comparison, multiple reads per well when measuring IVF (Fig. S2b†) were more homogeneous (Fig. 4b), making the measurements with the latter less prone to errors and misinterpretation.
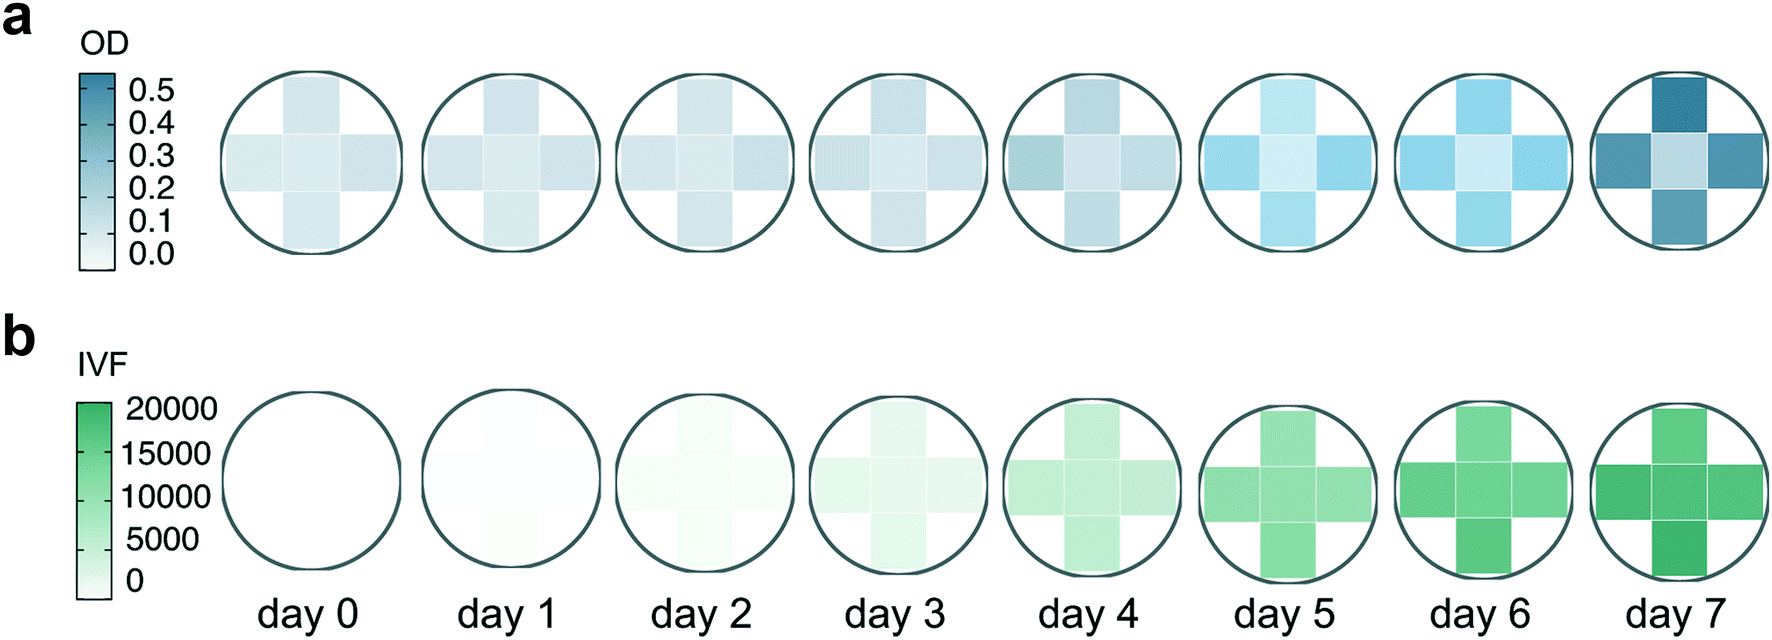 | ||
| Fig. 4 Representation of the within-well variability over a 7 day time period. Results presented here are measurements from one randomly chosen well (B6) used as an example. Both OD (a) and IVF (b) were measured by using the multiple reads per well option of the Tecan plate reader where 5 different measurements were performed for each well and are represented by the five quadrants in the circles. | ||
A wide range of laboratory methods are available to quantify biomass. However, it is important to have in mind that those are proxies of actual cell number and growth. The obtained results might not only reflect the actual biological response but can also be influenced by factors such as instrument sensitivity and measuring biases. Because of this, preliminary tests are needed to identify the method best suited for the experimental set-up. For this reason, growth was followed daily in eight biological replicates of P. tricornutum exposed to HL using cell count, IVF and OD. Fig. 5 shows the ln transformed growth curves obtained from the methods tested.
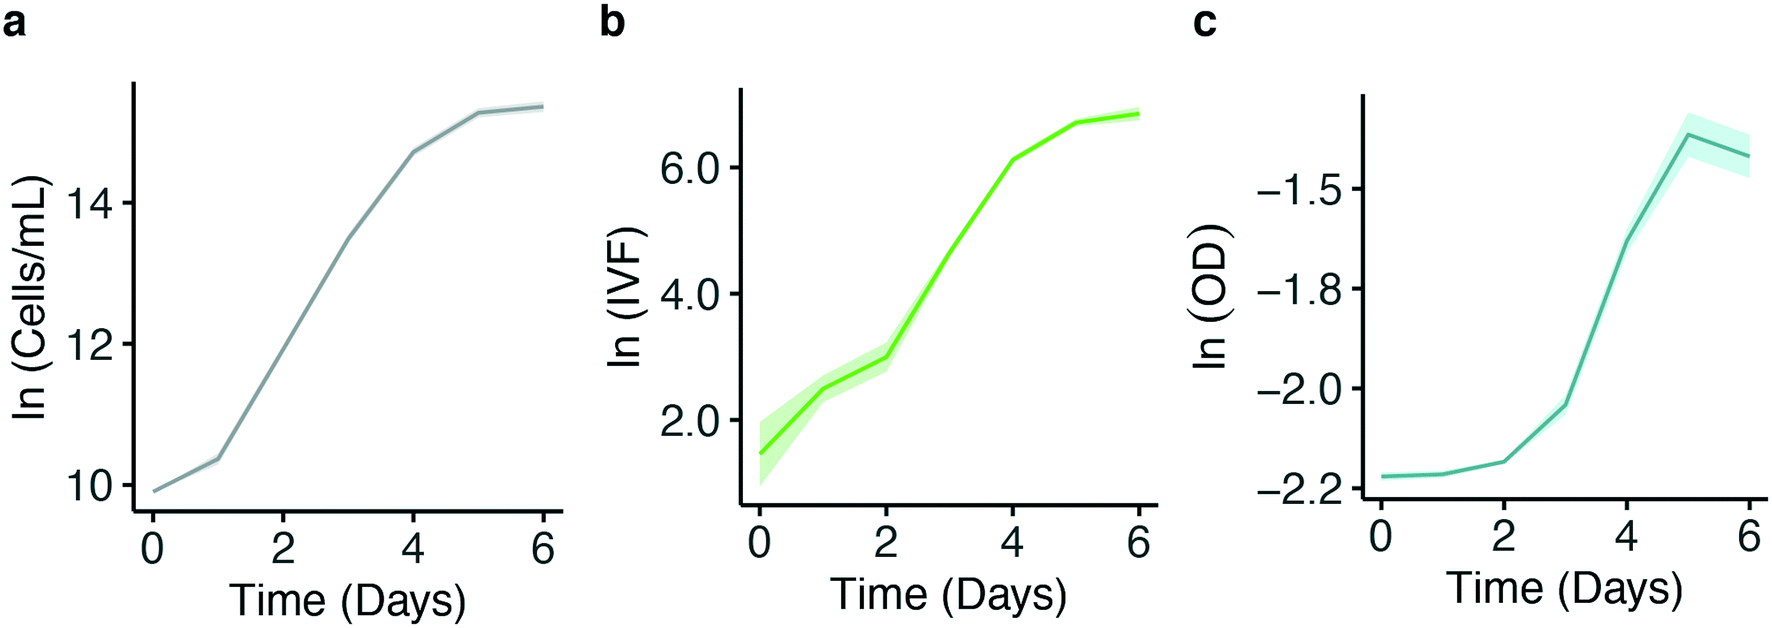 | ||
| Fig. 5 Comparison of ln transformed growth curves for P. tricornutum measured by cell concentration per mL (a), IVF (b) and OD (c). 8 biological replicates grown at constant high light (125 μmol photons m−2 s−1) at 16 °C were measured. The solid line shows the average ln transformed growth curves of the samples (n = 8); Standard deviation at every point is represented by the shaded area surrounding the line. | ||
The results show that calculating growth over time using OD measurements is less sensitive at low cell concentration (Fig. 5c) compared to both cell count (Fig. 5a) and IVF (Fig. 5b). This was confirmed by comparing the results from the growth curves in correlation analysis (Fig. 6). A highly significant correlation between cell counts and IVF was observed (Fig. 6a). However, when comparing OD with cell counts (Fig. 6b) and IVF (Fig. 6c) there was no linear relationship between measurements performed in the early growth phase. Therefore, OD measurements are not as sensitive as the other methods for values <0.13 (Fig. 6b and c). A correlation analysis was also performed between the cell count performed with the standard batch PBR (Fig. S3†) system and the results obtained with the nanocosm for the three density variables (OD, IVF and cell count) (Fig. S4†). The measurements performed with the IVF and the cell count from the nanocosm set-up showed high correlation with the control (r = 0.99, p < 2.2 × 10⁻¹⁶), whereas the OD showed no linear relationship with the control measurements (Fig. S4c†).
 | ||
| Fig. 6 Scatter plot and best-fitting regression line illustrating the relationships between cell count per mL and IVF (a), cell count per mL and OD (b) and IVF and OD (c). For (b) and (c), fitted lines are drawn only for the linear part of the relationship. Grey surrounding area: 95% confidence belt for the fitted line. | ||
Most experiments require the calculation of variables such as specific growth rate (μ, d−1) or doubling time. Specific growth rates were therefore calculated and compared from the cell count, IVF and OD measurements from the nanocosm set-up. Growth rates (μ, d−1) were also calculated from the batch culture condition and used as a control (Fig. S3†). μ calculated from the batch culture peaked between day two and three with a μmax of 1.52 d−1. As for the control, μ values based on cell counts and IVF were highest between the second and third day, with a μmax of 1.56 d−1 and 1.45 d−1, respectively, and were not statistically significantly different (Fig. 7). On the other hand, the specific growth rate calculated from the OD data underestimated μmax by a factor of 11 because of the low sensitivity of the instrument for the initial part of the growth curve and this resulted to be statistically different from the control (p-value: 0.02) (Fig. 5c, 6b and 7). Thus, for this work, OD is not optimal for calculation of specific growth rate during periods with low biomass (i.e. cell concentration <750000 cells/mL). This implies that OD measurements become accurate only with a higher cell concentration and it is therefore important to keep in mind that this is when the DIC limitation issue becomes severe. An overview of the specific growth rate (μ, d−1) estimates calculated from the growth curves obtained from the nanocosm set-up versus the control PBR conditions can be found in the ESI† (Table S1).
 | ||
| Fig. 7 Estimated daily growth rate (μ, d−1) based on calculations done using cell concentration, IVF and OD from the nanocosm set-up (circles) compared to the control (diamonds). Well plate: points are averages of 8 biological replicates ± SD. Control: represented by a batch PBR culture grown in a standard growth room. For the control, estimated daily growth rate is based on cell count performed with the flow cytometer. Points are averages of 3 biological replicates ± SD. | ||
The growth curves obtained from OD, IVF and cell count measurements (Fig. 5) were also fitted using the 4 logistic parameter model (SSfpl), and maximal growth rate (μmax, d−1) was calculated as μ = scal−1. This was done to evaluate if we could overcome the issue of the low sensitivity encountered when calculating specific growth rate for each time interval using OD (Fig. 7). As shown in Fig. 8 the μmax calculated using IVF showed a higher variation between replicates, but the median values for cell count and IVF were 1.92 d−1 and 1.89 d−1, respectively, and were not statistically different. The median value of μmax calculated from OD growth curves was 2.61 d−1 and a two-tailed t-test showed that the difference was statistically significant (p-value: 4.632 × 10⁻¹⁴). Calculating μmax from the OD data by using the SSfpl model showed a slight improvement compared to μmax values represented in Fig. 7 but still did not prove to be the ideal method for growth rate calculation (Fig. 8). Our results confirm and strengthen previous findings that have indicated IVF as a more robust method for measuring growth for algal cultures compared to OD.16,34–36
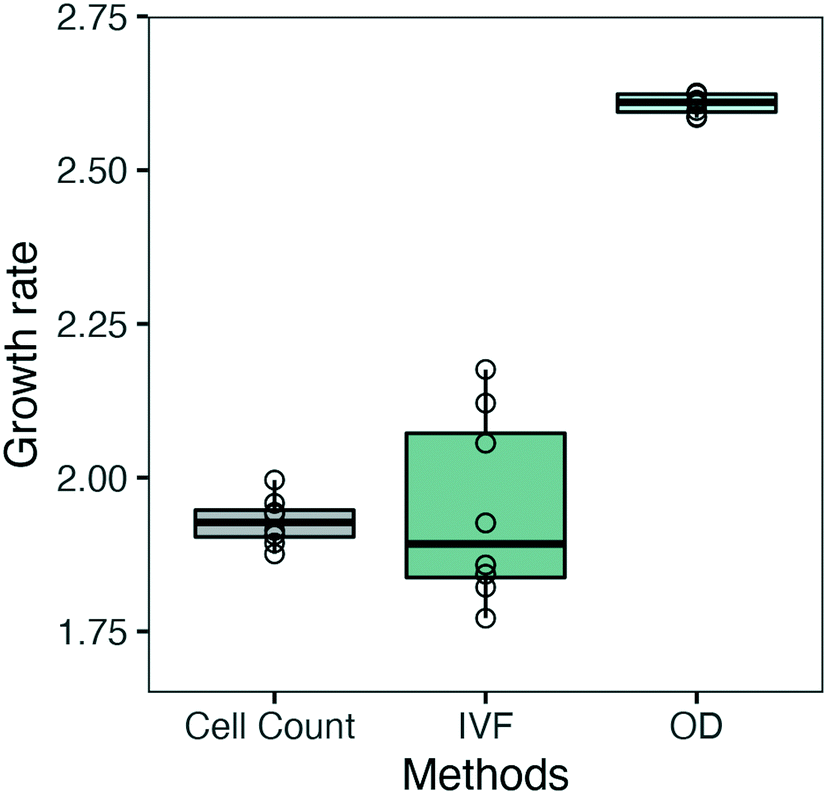 | ||
| Fig. 8 Boxplot illustrating the estimated maximum growth rate (μ, d−1) calculated from fitting the logistic growth curves with the SSfpl model. The black horizontal line represents the median value. 8 biological replicates were used for each method and are represented by empty circles. | ||
IVF measurements (Ex. 460 nm; Em. 680 nm) are based on the detection of Chl a content which can vary considerably per cell based on the light conditions. To assess if the IVF measurements were affected by different light intensities, two 96-well plates of P. tricornutum were grown at 16 °C with two different light intensities: low light (LL: 20 μmol photons m−2 s−1) and high light (HL: 125 μmol photons m−2 s−1). The results from the two light treatments were evaluated using linear regression. The relationship between the measured points was calculated by using either the first 5 days of the measurements or the entire growth period (8 days). As shown in Fig. 9, there is a high correlation between IVF measurements at LL and HL when considering both 5 and 8 measuring days. The scatter plot suggests that at higher x values a slight decrease in the linear relationship is occurring. This is also confirmed by residuals behaving better when only considering data points for 5 days. A drop in linear relationships at high ln(IVF(LL)) might indicate the presence of phenomena such as self-shading and/or decay in IVF due to reabsorption in a dense culture where most cells are reaching the stationary phase.
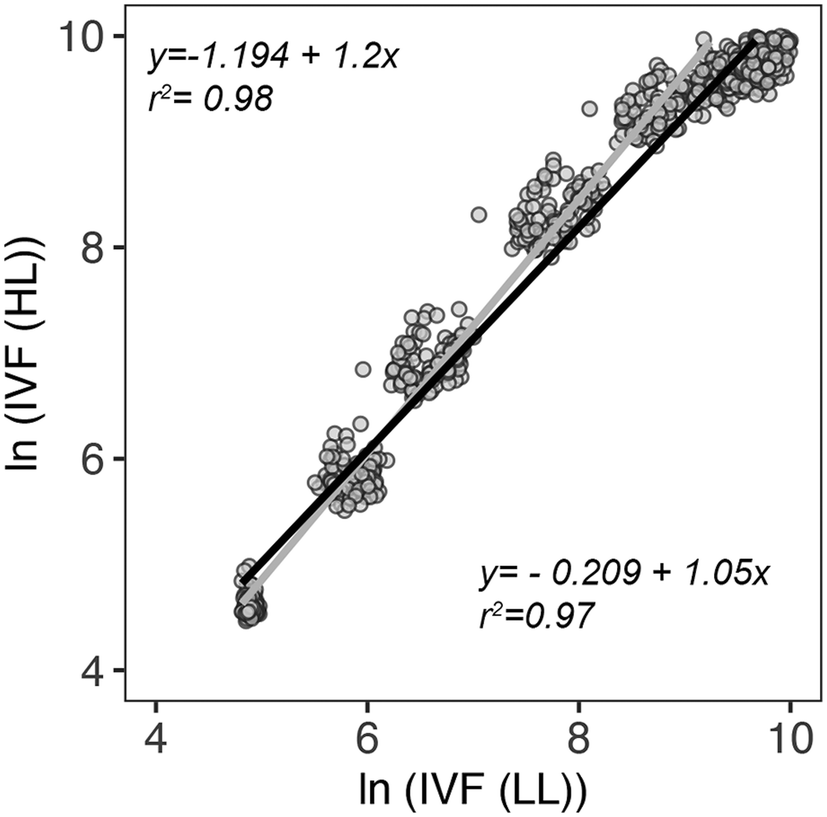 | ||
| Fig. 9 log–log scatter plot and best-fitting linear regression line illustrating the correlation between IVF measurements done at low light (LL: 20 μmol photons m−2 s−1) and high light (HL: 125 μmol photons m−2 s−1) conditions during an 8 day growth experiment. The grey fitted line (equation: y = −1.194 + 1.2x, r2 = 0.98) represents the relationship found for the first 5 days of measurements. The black fitted line (equation: y = −0.209 + 1.05x, r2 = 0.97) represents the relationship for the entire growth period (8 days). | ||
These results point to the possibility to use IVF as a method to determine the cell density and growth of cultures exposed to a range of different light intensities without significantly influencing the results. Taking into consideration all the factors described above, IVF was selected as data acquisition method because it is more reliable and accurate and less prone to measuring and instrument biases.
3.2 Well-to-well reproducibility in growth
Using a microplate as a platform for algal studies can lead to several benefits as discussed above. To establish well plates as a reliable experimental platform, an essential factor to consider is homogeneous growth conditions throughout the plate, i.e. well-to-well reproducibility. To check for variation between wells, 91 biological replicates of P. tricornutum were grown in a microplate system at 20 μmol photons m−2 s−1 (LL) for 7 days. Several authors have pointed out that the outer wells in a microplate system are prone to experimental error and their use should be avoided.14,37 To check for reproducibility throughout the plate the growth curves of P. tricornutum exposed to LL were fitted to a non-linear mixed-effect model27 using the SSfpl model, and relative growth rate (μ) and carrying capacity (K) were calculated (Fig. 10). Calculating μ by fitting the logistic growth curves of the 91 replicates showed minimal variation between the wells and a cv of 2.6% (Fig. 10a). The carrying capacity showed a slightly higher variation with a cv of 16% (Fig. 10b). The reason for this might be that variables such as K are dependent measurements performed in the stationary phase of growth curves. Because of high density these measurements are usually more prone to artefacts and in a well plate setting they will also be more affected by CO2 deprivation.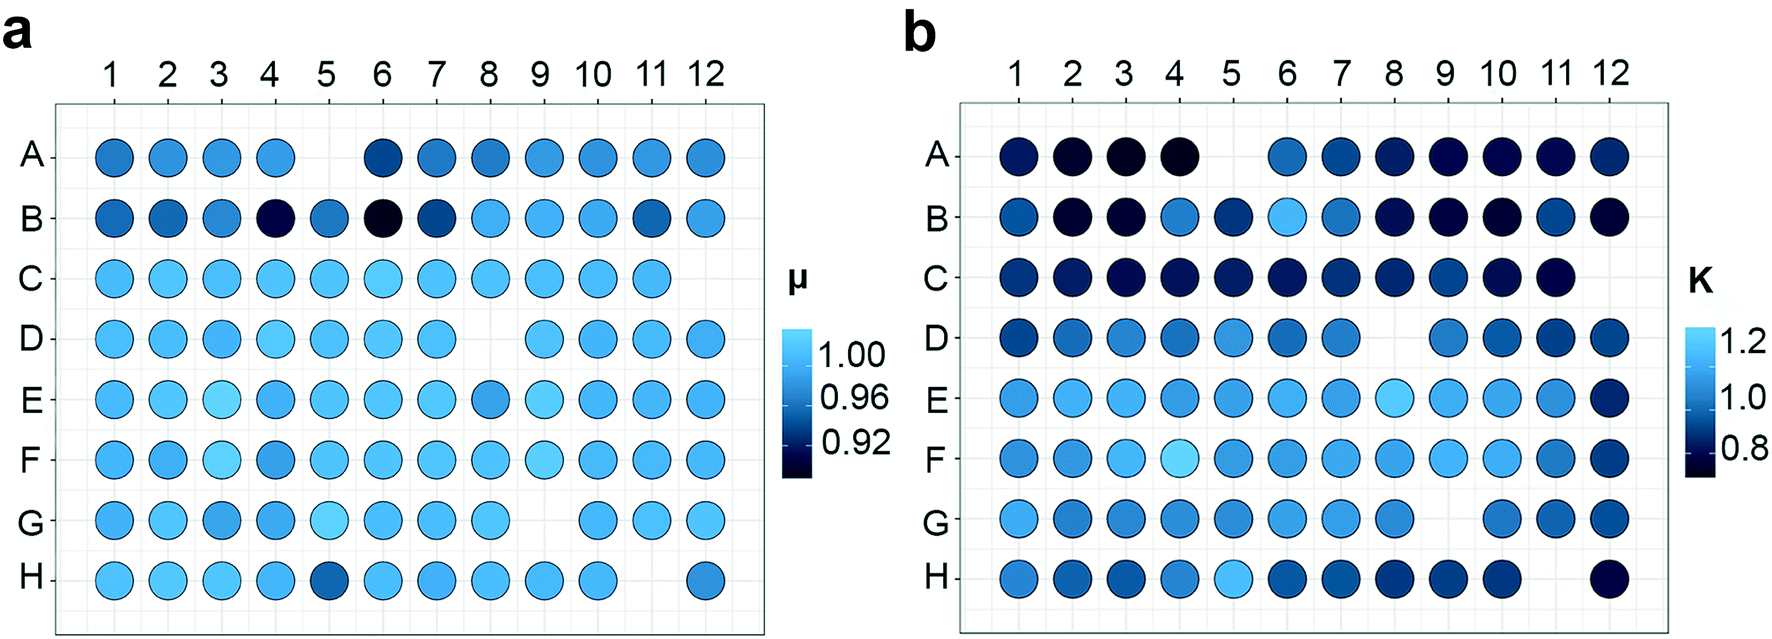 | ||
| Fig. 10 Heatmap of (a) relative growth rate (μ) and (b) carrying capacity (K) derived from the growth curves of P. tricornutum exposed to low light (LL). μ and K were calculated by fitting the logistic growth curves across all units in the 96 well plate using a non-linear hierarchical model. White areas represent the five blanks. | ||
To further validate the reproducibility of culture performances across the well plate, pigment concentration was estimated based on high-resolution in vitro absorption spectra by applying spectral deconvolution.26 Eight wells per light treatment were chosen randomly across the plate and the pigment concentrations were compared. Fig. 11 shows the ratio between the pigments normalized per chlorophyll a (Chl a) in low and high light conditions. Samples harvested from the same light treatment yielded similar pigment concentration for all the pigments analyzed (Fig. 11a–c), whereas comparisons of the two light treatments showed, as expected, higher accessory pigment concentration for the low light acclimated cells because of the larger light harvesting antenna complexes (Fig. 11).
 | ||
| Fig. 11 Boxplot illustrating pigment concentration of P. tricornutum grown at 16 °C exposed to either high light (HL: 125 μmol photons m−2 s−1) or low light (LL: 20 μmol photons m−2 s−1). Results are normalized per chlorophyll a (Chl a) concentration (w:w). (a) Chlorophyll c (Chl c); (b) fucoxanthin (Fx); (c) diadinoxanthin (Ddx). 8 biological replicates were harvested for each light treatment and are represented as empty circles. | ||
Reproducibility in analysis of pigment concentration was also assessed by measuring the coefficient of variation (cv) between the replicates for each pigment. The calculated cv values were 0.16, 0.51 and 0.02 in LL and 0.09, 0.61 and 0.01 in HL for Chl c, Ddx and Fx, respectively. The results show minimal variation in both light conditions, indicating a high reproducibility for pigment analysis.
3.3 Possible modes of operation and response variables
Micro-scale cultivation platforms are often considered limited by the small working volumes, and their use has often been restricted. In the past years there has been an effort in comparing different methods and assays between conventional set-up and a microwell platform because of the faster and cheaper ways of operation of the latter.25,37,38 Below we present possible modes of operation and response variables for planktonic studies that have been performed and validated in a microwell platform.Besides the classic batch cultivation, a semi-continuous growth system was used by Thrane and colleagues.33 Here a daily, constant dilution rate of 0.25 d−1 was used to ensure that all experimental units had the same steady-state growth rate. This approach makes it possible to include specific growth rate as an experimental variable, which expands experimental possibilities considerably. In classical cultivation systems it has been shown that this type of semi-continuous cultivation can replace the use of chemostats.39 By applying semi-continuous cultivation, it is also possible to achieve the advantages of the turbidostat. This is obtained by doing dilutions that make sure that the biomass is kept at or below a level where maximum specific growth rate is ensured. Another advantage of continuous operation is that biomass can be harvested and pooled over several consecutive days, securing a representative and larger sample. This will also open up for other types of analysis that require a higher amount of biomass.
In the past decades there has been a massive development in microplate-based equipment and instruments (including automated ones) fueled by the advantages of high-throughput screening – especially in the pharma and biotech industries. A wide range of common lab instruments and equipment are now suited for handling microplates. Plate readers are a powerful tool that enables fast and automated acquisition of a wide array of data by measuring fluorescence, absorbance and bioluminescence. Some instruments combine digital microscopy with the classical plate reader measurements. Thus, one can collect information about morphology, biomass and growth, Chl a/C ratios, pigment signature, absorbance and fluorescence spectra.33 Moreover, fluorescent probe-based assays can be used to measure enzyme activity,40 determine the lipid content,15,17,41 measure levels of oxidative stress42,43 and perform multiple toxicity tests.37,44 All these assays are validated and are easy to perform. Most of the commercially available flow cytometers and FACS are suited for microplate application and can be used to analyze environmental samples, isolate strains of interest,45 obtain information about growth and fitness and perform stain-based experiments.41 Fully automated robotic systems are now routinely used in the medical and pharmaceutical industries (i.e. drug discovery, antimicrobial substances) and have greatly improved the quantity and quality of screening data, significantly reduced the time used per analysis/sample and minimized human error. Nowadays, many types of operations are running continuously, screening millions of compounds in microplate formats with little or no human supervision.46 The past years have shown an increase in automation of the screening process also in the microalgal research field where robots are used for analyzing growth performance under optimal nutrient input18,47 and for lipid quantification.41 Such systems overcome therefore the bottleneck of massive sample analyses plus reduce time and minimize human error.
3.4 Examples of applications
When performing screening analysis and complex factorial experiments, the challenge is that the number of possible combinations of experimental variables increases exponentially with the number of parameters tested. This limits drastically what is feasible in terms of both labor and costs. By taking advantage of a microwell plate strategy, we can cope better with the dimensionality curse of factorial experiments. Below we describe applications of a microwell incubator with a focus on the versatility and the number of factors and experimental combinations than can be considered simultaneously. For these microwell experimental set-ups to be reliable, one important factor is ensuring controlled environmental conditions. Our system, by guaranteeing controlled temperature (Fig. 2) and light intensities, ensures homogeneous growth under all the conditions tested and with low well-to-well variability (Fig. 3b and 9–11). As a consequence, the individual wells can be considered as independent micro-PBRs making it possible for parallelized screening of different strains/mutants or for comparing variables of interest with the possibility of increasing the number of experimental combinations tested. It is easy to operate four systems at the same time, giving a total of 384 independent cultures.
Table 1 summarizes some of the applications of the nanocosm (and some other micro scale photo-incubators) that have been used to date. The examples span different research areas such as environmental studies, photobiology, pollution analysis and biotechnology. These photo-incubators have contributed to new knowledge by using minimal resources, time and space. By programming a light gradient on the plates and thus exposing the microalgae to controlled light intensities, photosynthesis versus light data (P vs. E) can be used for parameter estimation in models of specific growth rate as a function of irradiance.33,48 Thrane and colleagues looked at the effect on light33 and light/temperature31 gradients on the optimal N:P ratios in phytoplankton by running a factorial design crossing irradiance, temperature and nutrient supply. The study resulted in 96 unique experimental conditions (Table 1). Recently a multifactor analysis has been performed to investigate water pollution effects for increased abundance of the algae Gonyostomum semen in Nordic lakes in response to increased dissolved organic carbon (DOC) levels.5 Moreover, the growth performance of G. semen in response to different combinations of DOC concentration, light quantity and light quality has also been investigated. The incubator we have developed has also been used to explore the combined effects of DOC and UV radiation on the DNA integrity of the limnetic zooplankton Daphnia magna. Here, a 4 by 4 experimental design was set up by combining different concentrations of DOC with different amounts of UV-A radiation. Production of reactive oxygen species (ROS) and DNA damage were response variables that were quantified after 6 h of exposure49 (Table 1). Recently we have also used the nanocosm to look at growth responses, pigment signature and gene expression of 20 eco-types of the marine diatom S. marinoi exposed to a highly fluctuating light regime simulating the light perception of a cell in a PBR (Volpe et al., in prep). Serôdio and colleagues50 have developed an illumination system that enabled them to look at photosynthesis and light stress responses in different microalgae by using in vivo Chl a fluorescence imaging. In settings such as field trips on a research vessel where space is often a bottleneck, the nanocosm would be the ideal system to perform factorial experiments without being constrained by space. Micro-PBRs have recently also been used as a tool for high-throughput algal studies with the aim to identify strains of interest and optimal growth conditions for biotechnological applications of algal biomass. Chen and coworkers,15 by using a programmable temporal factor, combined light intensity and light duty cycle and calculated light-dependent growth rates and lipid production of Dunaliella tertiolecta. Radzun and colleagues18 performed an automated screening on optimal macro- and micro-nutrient concentration for 8 isolates of microalgal species.
| Application | Research outcome | Organism | Plate and board type | Light intensity and light quality | Methods used | Ref. |
|---|---|---|---|---|---|---|
| Ecology, aquatic stoichiometry | Stoichiometry, light-dependent P:N ratios |
Microalgae – C. reinhardtii | White 96 well plate | Light gradient | Pigment analysis, growth rate, P vs. E curves | 33* |
| White LED board | White LEDs | |||||
| Ecology, nutrient stoichiometry | Stoichiometry, light- and temperature-dependent P:N ratios |
Microalgae – C. reinhardtii | 96 well white LED board | Light gradient | Pigment analysis, growth rate | 31* |
| White LEDs | ||||||
| Ecology, lake pollution | Effect of DOC and light quantity and quality on growth | Microalgae – G. semen | Clear 96-well plates | RGB LED boards | Growth performance | 5* |
| White LED board | ||||||
| Ecology, UV radiation | Effects of DOC and UV light on DNA damage in zooplankton | Zooplankton – Daphnia magna | Black deep 96-well plates | UVA390 96-LED board | ROS detection | 49* |
| DNA damage comet assay | ||||||
| Biotechnology, population diversity, ecology | Diverse response to light of eco-types | Microalgae – Skeletonema marinoi | Transparent well plate | Constant, intermittent | Pigment analysis, growth rates, P vs. E curves | Volpe et al. (in prep)* |
| White LEDs | ||||||
| Photobiology | High-throughput study of photosynthetic light response | Microalgae – C. reinhardtii | 3D-printed black 64-well plates | RGB, white 64 well plate LED board | Chlorophyll fluorescence imaging | 50 |
| Biotechnology | High-throughput screening of optimal nutrient for algal growth | Microalgae – 8 strains | Transparent 96 well plate | White LED board | Growth curves | 18 |
| Nutrient screening | Statistical analysis | |||||
| Biotechnology | High-throughput screening of lipid conversion efficiency | Microalgae Dunaliella tertiolecta | Black 96 well plate clear bottom | Red 96-well LED setup | Growth rate, lipid quantification (Nile red) | 15 |
| Light gradient |
4. Concluding remarks and future development of the system
This work describes the design, reproducibility and possible applications of the nanocosm, a miniature LED-based PBR system designed to perform environmental and biotechnological studies with the possibility of testing different experimental variables simultaneously. The small scale of the system combined with the possibility to treat each well as an independent micro-PBR makes the nanocosm an ideal system to efficiently perform cheap screening and phenotyping studies that would otherwise be time-consuming and labor-intensive. By constructing crosstalk-adjusted light gradients we were able to generate controlled and homogeneous illumination throughout the plate, overcoming the main issue related to previously described microwell illumination systems. By adding a Peltier element and a cooling fan we were able to reduce drastically the temperature variations across the plate. However, this still resulted in slight temperature variations in HL compared to LL. Further cooling of the electronics of the plate might be achieved by liquid flow in a microchannel heat sink shown to work effectively as a cooling device for electronic chips.51 Some studies might require a more accurate control of the pH level within the wells. This could be achieved by adding a carbonate buffer or by using a gas-permeable membrane at the bottom of the plate. The possibility to install a mechanical shaking platform has also been discussed and should be considered for future improvements of the system. This will require fixing the shaking device to the LED board in order for it to be steady. This growth system is also suited to be fully robotized and automated and therefore optimizing the efficiency and minimizing human errors.Funding
This work was supported by a grant from the Research Council of Norway to O. V. through funding of the project Microbially Produced Raw Materials for Aquafeed (project no. 239001). Additional funding was provided through the PhD position awarded to C. V. by the NV faculty at the Norwegian University of Science and Technology.Author contributions
C. V., O. V. and T. A. conceived the research plans. G. A. designed and conceived the incubator. T. A. and C. V. performed the calibration of the system. C. V. designed the experiments with contribution from O. V. C. V. performed the experiments. C. V. analyzed the data with contribution from O. V. and T. A. C. V. wrote the article with contributions from co-authors. C. V. agrees to serve as the author responsible for contact and ensures communication.Conflicts of interest
The authors declare no competing interest.References
- C. B. Field, M. J. Behrenfeld, J. T. Randerson and P. Falkowski, Science, 1998, 281, 237–240 CrossRef CAS PubMed.
- D. M. Anderson, P. M. Glibert and J. M. Burkholder, Estuaries, 2002, 25, 704–726 CrossRef.
- D. M. Anderson, Ocean & Coastal Management, 2009, 52, 342–347 Search PubMed.
- P. M. Glibert and M. A. Burford, Oceanography, 2017, 30, 58–69 CrossRef.
- C. H. C. Hagman, B. Skjelbred, J. E. Thrane, T. Andersen and H. A. de Wit, Aquat. Microb. Ecol., 2019, 82, 241–251 CrossRef.
- P. Spolaore, C. Joannis-Cassan, E. Duran and A. Isambert, J. Biosci. Bioeng., 2006, 101, 87–96 CrossRef CAS PubMed.
- A. Bozarth, U.-G. Maier and S. Zauner, Appl. Microbiol. Biotechnol., 2009, 82, 195–201 CrossRef CAS PubMed.
- M. Brown, S. Jeffrey, J. Volkman and G. Dunstan, Aquaculture, 1997, 151, 315–331 CrossRef CAS.
- A. Skrede, L. T. Mydland, Ø. Ahlstrøm, K. I. Reitan, H. R. Gislerød and M. Øverland, Journal of Animal and Feed Sciences, 2011, 20, 131–142 CrossRef.
- J. I. Betts and F. Baganz, Microb. Cell Fact., 2006, 5, 21–21 CrossRef PubMed.
- W. A. Duetz, Trends Microbiol., 2007, 15, 469–475 CrossRef CAS PubMed.
- M. D. Guiry, J. Phycol., 2012, 48, 1057–1063 CrossRef PubMed.
- D. Faktorová, R. E. R. Nisbet, J. A. F. Robledo, E. Casacuberta, L. Sudek, A. E. Allen, M. Ares, C. Aresté, C. Balestreri and A. C. Barbrook, Nat. Methods, 2020, 17, 481–494 CrossRef PubMed.
- E. O. Ojo, H. Auta, F. Baganz and G. J. Lye, Biochem. Eng. J., 2015, 103, 93–102 CrossRef CAS.
- M. Chen, T. Mertiri, T. Holland and A. S. Basu, Lab Chip, 2012, 12, 3870–3874 RSC.
- J. Van Wagenen, S. L. Holdt, D. De Francisci, B. Valverde-Perez, B. G. Plosz and I. Angelidaki, Bioresour. Technol., 2014, 169, 566–572 CrossRef CAS PubMed.
- J. Heo, D.-H. Cho, R. Ramanan, H.-M. Oh and H.-S. Kim, Biochem. Eng. J., 2015, 103, 193–197 CrossRef CAS.
- K. A. Radzun, J. Wolf, G. Jakob, E. Zhang, E. Stephens, I. Ross and B. Hankamer, Biotechnol. Biofuels, 2015, 8, 65 CrossRef PubMed.
- B. Skjelbred, B. Edvardsen and T. Andersen, J. Appl. Phycol., 2012, 24, 1589–1599 CrossRef.
- R. Wolf, T. Andersen, D. O. Hessen and K. Hylland, Functional Ecology, 2017, 31, 848–855 CrossRef.
- R. Wolf, J.-E. Thrane, D. Hessen and T. Andersen, Water Res., 2018, 132, 331–339 CrossRef CAS PubMed.
- R. R. Guillard and J. H. Ryther, Can. J. Microbiol., 1962, 8, 229–239 CrossRef CAS PubMed.
- W. Stumm and J. J. Morgan, Aquatic chemistry: chemical equilibria and rates in natural waters, John Wiley & Sons, 2012 Search PubMed.
- S. E. Hagerthey, J. William Louda and P. Mongkronsri, J. Phycol., 2006, 42, 1125–1136 CrossRef CAS.
- H. Kupper, S. Seibert and A. Parameswaran, Anal. Chem., 2007, 79, 7611–7627 CrossRef PubMed.
- J. E. Thrane, M. Kyle, M. Striebel, S. Haande, M. Grung, T. Rohrlack and T. Andersen, PLoS One, 2015, 10, e0137645 CrossRef PubMed.
- J. C. Pinheiro and D. M. Bates, Mixed-effects models in S and S-Plus, 2000, pp. 3–56 Search PubMed.
- H. F. Zimmermann, G. T. John, H. Trauthwein, U. Dingerdissen and K. Huthmacher, Biotechnol. Prog., 2003, 19, 1061–1063 CrossRef CAS PubMed.
- M. Bojko, K. Brzostowska, P. Kuczyńska, D. Latowski, M. Olchawa-Pajor, W. Krzeszowiec, A. Waloszek and K. Strzalka, Acta Biochim. Pol., 2013, 60, 861–864 Search PubMed.
- K. W. L. William and I. Morris, J. Exp. Mar. Biol. Ecol., 1982, 58, 135–150 CrossRef.
- J. E. Thrane, D. O. Hessen and T. Andersen, Limnol. Oceanogr.: Methods, 2017, 62, 1346–1354 CrossRef CAS.
- A. F. Hofmann, K. Soetaert, J. J. Middelburg and F. J. R. Meysman, Aquat. Geochem., 2010, 16, 507–546 CrossRef CAS.
- J. E. Thrane, D. O. Hessen and T. Andersen, Ecol. Lett., 2016, 19, 880–888 CrossRef PubMed.
- S. Gross, O. Kourtchenko, T. Rajala, B. Andersson, L. Fernandez, A. Blomberg and A. Godhe, Limnol. Oceanogr.: Methods, 2018, 16, 57–67 CrossRef.
- A. M. Wood, R. Everroad and L. Wingard, Algal culturing techniques, 2005, vol. 18, pp. 269–288 Search PubMed.
- U. Karsten, I. Klimant and G. Holst, Appl. Environ. Microbiol., 1996, 62, 237–243 CrossRef CAS PubMed.
- D. St-Laurent, C. Blaise, P. Macquarrie, R. Scroggins and B. Trottier, Environ. Toxicol. Water Qual., 1992, 7, 35–48 CrossRef CAS.
- A. Pacheco, I. Hernández-Mireles, C. García-Martínez and M. M. Álvarez, Biotechnol. Prog., 2013, 29, 638–644 CrossRef CAS PubMed.
- U. Sommer, Limnol. Oceanogr., 1984, 29, 633–636 CrossRef.
- M. D. Machado and E. V. Soares, Water, Air, Soil Pollut., 2012, 224, 1358 CrossRef.
- H. Morschett, W. Wiechert and M. Oldiges, Microb. Cell Fact., 2016, 15, 34 CrossRef PubMed.
- L. Fu, M. Hamzeh, S. Dodard, Y. H. Zhao and G. I. Sunahara, Environ. Toxicol. Pharmacol., 2015, 39, 1074–1080 CrossRef CAS PubMed.
- M. Nymark, C. Volpe, M. C. Hafskjold, H. Kirst, M. Serif, O. Vadstein, A. M. Bones, A. Melis and P. Winge, Plant Physiol., 2019, 181, 1257–1276 CrossRef CAS PubMed.
- T. C. Haire, C. Bell, K. Cutshaw, B. Swiger, K. Winkelmann and A. G. Palmer, Frontiers in Plant Science, 2018, 9, 235 CrossRef PubMed.
- H. Pereira, L. Barreira, A. Mozes, C. Florindo, C. Polo, C. V. Duarte, L. Custódio and J. Varela, Biotechnol. Biofuels, 2011, 4, 61 CrossRef CAS PubMed.
- G. Wu and S. K. Doberstein, Drug Discovery Today, 2006, 11, 718–724 CrossRef CAS PubMed.
- G. Kosa, B. Zimmermann, A. Kohler, D. Ekeberg, N. K. Afseth, J. Mounier and V. Shapaval, Biotechnol. Biofuels, 2018, 11, 66 CrossRef PubMed.
- D. H. Peterson, M. J. Perry, K. E. Bencala and M. C. Talbot, Estuarine, Coastal Shelf Sci., 1987, 24, 813–832 CrossRef.
- R. Wolf, T. Andersen, D. O. Hessen, K. Hylland and M. Pfrender, Functional Ecology, 2017, 31, 848–855 CrossRef.
- J. Serôdio, W. Schmidt, J. C. Frommlet, G. Christa and M. R. Nitschke, PeerJ, 2018, 6, e5589 CrossRef PubMed.
- J. Zhang, T. Zhang, S. Prakash and Y. Jaluria, Numer. Heat Transfer, Part A, 2014, 65, 627–643 CrossRef CAS.
Footnote |
| † Electronic supplementary information (ESI) available. See DOI: 10.1039/d0lc01250e |
| This journal is © The Royal Society of Chemistry 2021 |