 Open Access Article
Super-resolution optofluidic scanning microscopy†
Biagio
Mandracchia
 ,
Jeonghwan
Son
and
Shu
Jia
 *
*
Wallace H. Coulter Department of Biomedical Engineering, Georgia Institute of Technology and Emory University, Atlanta, GA, USA. E-mail: shu.jia@gatech.edu
First published on 8th December 2020
Abstract
Optofluidics enables visualizing diverse anatomical and functional traits of single-cell specimens with new degrees of imaging capabilities. However, the current optofluidic microscopy systems suffer from either low resolution to reveal subcellular details or incompatibility with general microfluidic devices or operations. Here, we report optofluidic scanning microscopy (OSM) for super-resolution, live-cell imaging. The system exploits multi-focal excitation using the innate fluidic motion of the specimens, allowing for minimal instrumental complexity and full compatibility with various microfluidic configurations. The results present effective resolution doubling, optical sectioning and contrast enhancement. We anticipate the OSM system to offer a promising super-resolution optofluidic paradigm for miniaturization and different levels of integration at the chip scale.
Optofluidics synergistically merges optics and microfluidics, allowing for optical investigation of biological specimens with high-throughput and cost-effective functionalities integrated on-chip.1–3 For optical microscopy, the rapid advancement of optofluidic systems has transformed many conventional schemes, offering unprecedented sample manipulation, measurement automation, bio-compatibility, and imaging throughput.4–6 Amongst these techniques, fluorescence optofluidic methods have been exploited to investigate biological systems with high sensitivity and molecular specificity, spanning different levels of adaptation and integration.7–12 However, these methods can rarely resolve sub-micrometer cellular and subcellular details, posing a limitation for many single-cell studies in microfluidics.5,6 Recently, precise localization of punctate flowing objects in a microfluidic environment has been reported.13 However, this localization-based approach requires a low emitter density to recognize individual flowing objects, incapable of capturing complex cellular structures. As a result, current strategies still rely on conventional platforms to trap and acquire super-resolution cell images,14,15 and are unable to preserve throughput and less synergistic for many live-cell optofluidic applications.
Here, we introduce optofluidic scanning microscopy (OSM), an approach that allows for super-resolution imaging of biological specimens in the microfluidic regime. The principle of OSM is formulated on the basis of image scanning microscopy (ISM),16,17 a confocal form of structured illumination microscopy that offers effective optical sectioning, uncompromised signal-to-noise ratio (SNR) and enhanced resolution. However, the current implementations of ISM remain impractical for optofluidic platforms due to the complexity in the architectures for mechanical scanning and parallelization of data acquisition.17–22 In contrast, OSM implements a steady optical configuration while taking advantage of the inherent motion of the specimens. Hence, the system enables super-resolution optofluidic microscopy without the need for mechanical scanning that interrupts the fluidic continuity as in conventional ISM, making OSM fully compatible with widely-adopted microfluidic systems. Furthermore, the simple imaging scheme provides opportunity for miniaturization and different levels of integration at the chip scale.
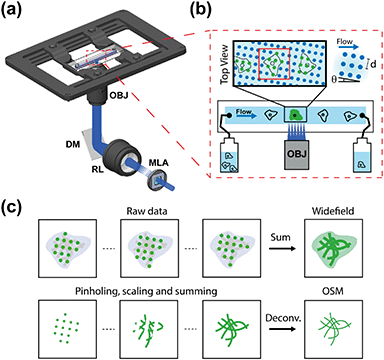
The OSM setup was constructed by insertion of a microlens array (MLA) in the illumination path of an epifluorescence microscope using a 100×, 1.45 NA objective lens (Fig. 1a and S1†). The multi-focal excitation pattern generated by the MLA is relayed to form a grid of diffraction-limited foci (d = 1.6 μm) inside the microfluidic channel. The square pattern of the foci was tilted by θ = 4° with respect to the flow direction, ensuring seamless scanning of the sample in both lateral dimensions (Fig. 1a and b). This illumination pattern corresponds to a flow distance of ∼20 μm to cover the entire field of the sample, while maintaining minimal crosstalk between the neighboring illumination spots. The sample was introduced at a steady speed controlled by a pressure pump and a flow sensor. In this work, we utilized a flow rate at 1.5× effective camera pixel size (65 nm) per frame (i.e. 97.5 ± 1.4 nm per frame or ∼19.5 μm s−1 at a 200 Hz camera frame rate) to obtain optimal sampling and an ∼1 Hz super-resolution image acquisition rate (Fig. S2†).
As the OSM system continuously records the flowing objects, the data processing comprises three main steps: (i) image stabilization, (ii) pinholing and pixel reassignment, and (iii) summing and deconvolution. In brief, as shown in Fig. 1c and S3,† we first tracked the motion of the individual samples between consecutive camera frames and stabilized the image sequence of a multi-focal excited object based on centroid and cross-correlation analysis. Next, we applied a pre-calibrated array of Gaussian pinholes (σ = 97.5 nm, i.e. 1.5 camera pixels, Fig. S4†) centered on each spot to reject out-of-focus light and computationally reassigned pixels by locally contracting the images of each illumination spot by a factor of two (i.e. scaled pixel size = 32.5 nm).18,19 Lastly, the processed images were summed to produce an intermediate image with a resolution improvement by a factor of  , which was then deconvolved to recover the full 2× resolution enhancement over the diffraction limit.
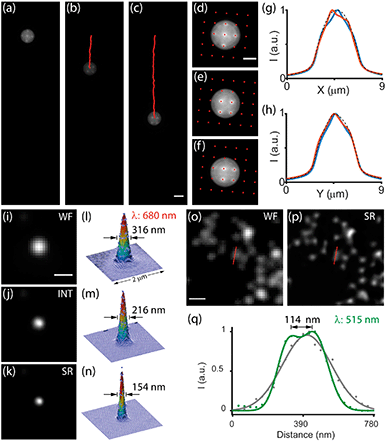
To characterize the performance of OSM, we first used 4 μm dark-red fluorescent beads and recorded their propagations in the microfluidic channel (Fig. 2a–f). As the microfluidic flow is characterized by a low Reynolds number, it contributes to our processing by reducing the sample drift within the microfluidic channel. This yields a high frame-by-frame correlation that results in viable image stabilization of the specimens (Fig. 2g and h). We then estimated the resolution improvement of the system by translating sub-diffraction-limit 100 nm fluorescent beads and measured the intensity profiles of the reconstructed images (Fig. 2i–q). The measurement exhibited a two-fold improvement in the full-width at half-maximum (FWHM) of the emitters using the OSM scheme compared with that using wide-field microscopy (Fig. 2i–n). Furthermore, emitters separated as close as 114 nm can be well resolved, showing a 2× resolution enhancement over the diffraction limit (Fig. 2o–q and S5†). It should be mentioned that we verified these measurements using two spectra, both in good agreement with the values reported in conventional ISM23 (Table S1†).
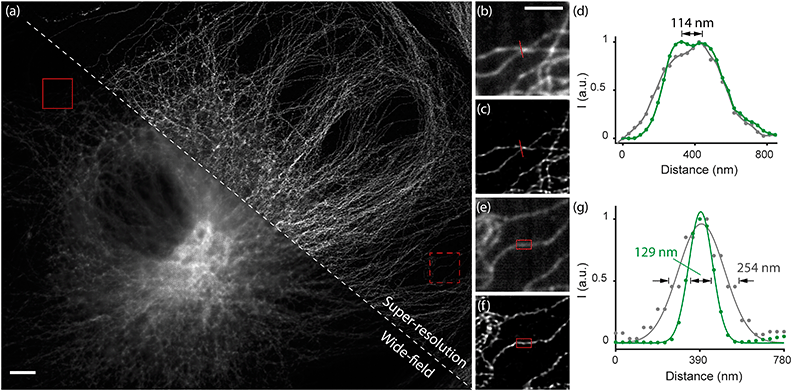
We next demonstrated imaging of biological samples using the OSM scheme. We first imaged immuno-stained microtubules in bovine pulmonary artery endothelial (BPAE) cells by scanning the sample (Fig. 3). We translated the cells at a constant speed to simulate the in-flow conditions and recorded the multi-focal excited images (see the ESI†). Remarkably, the reconstructed image not only exhibited a substantially improved resolution than the wide-field image, but also provided optical sectioning (thus higher SNR) that was not available in the conventional image (Fig. 3a). As observed, densely packed microtubule filaments separated by 114 nm were well resolved in the reconstructed image (Fig. 3b–d), representing a two-fold resolution improvement over the diffraction limit, consistent with the caliber measurements in Fig. 2. Furthermore, the cross-sectional profiles of the microtubule filaments showed consistent widths of 120–130 nm (in contrast to >250 nm for wide-field images) (Fig. 3e–g), which is in agreement with the convolution of the known ∼60 nm diameter of antibody-labeled microtubules24 and the imaging resolution of ∼114 nm.
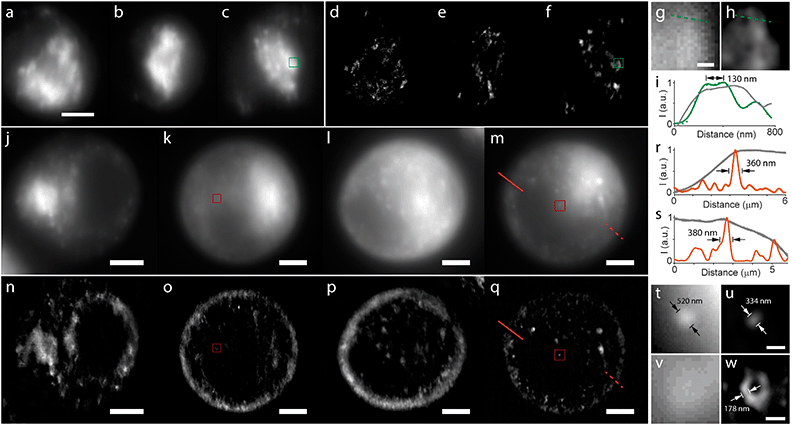
Finally, we performed live-cell imaging of fibroblast-like (COS-7) cells flowing through the microfluidic channel using OSM (Fig. 4). Using a 488 nm laser, we first imaged mitochondria stained with MitoTracker Green. OSM continuously recorded multi-focal excited cells circulating at a steady speed of 19.5 μm s−1 with a camera frame rate of 200 Hz. The confocal excitation (including digital pinholing) and computational deconvolution reject out-of-focus light, permitting effective image sectioning of densely packed organelles that are poorly detected by wide-field microscopy (Fig. 4a–f). Notably, the mitochondrial structures and networks as close as ∼130 nm can be well-resolved using OSM, implying a two-fold resolution improvement over the diffraction limit (Fig. 4g–i). Next, using a 647 nm laser, we imaged the plasma membrane stained with CellMask Deep Red. As seen, the flowing cells exhibit a native, sphere-like morphology that contributes to stronger background fluorescence, thus prohibiting visualization using wide-field microscopy (Fig. 4j–m). In contrast, the sectioning capability of OSM allows for the observation and quantification of the plasma membrane profiles outlining the cells (Fig. 4n–s). Remarkably, the improved contrast and resolution of OSM allowed us to observe the endocytosed vesicles or aggregates inside the cells and characterize those fine structures with a resolution enhanced by >100 nm over wide-field microscopy (Fig. 4t and u), consistent with the measurements using the caliber and other cellular structures (Fig. 4t–w and S6 and S7†).
In summary, we have developed OSM for super-resolution, live-cell optofluidic imaging with resolution doubling, effective optical sectioning and image contrast enhancement. Compared with existing implementations, the system exploits an inherent fluidic scanning scheme, demonstrating minimal instrumental complexity and thus making it fully compatible with microfluidic devices and readily adaptable to various on-chip configurations.25 Notably, the demonstrations were performed at an ∼1 Hz super-resolution image acquisition rate for a throughput of 1–10 samples per s, comparable to other novel diffraction-limited optofluidic systems.7,26–28 Such a super-resolution image acquisition rate (or the effective throughput) of OSM is determined by the flow distance and the flow speed at an effective camera sampling rate, which can be further enhanced through several strategies. First, optimizing the current sparse illumination grid using a denser MLA or a computer-generated illumination pattern is expected to improve the acquisition efficiency. Second, the throughput can be improved by increasing the flow speed and, accordingly, using a faster camera or by reducing the region of the sCMOS sensor in acquisition to enhance the frame rate. The latter is well feasible considering the geometry of the microfluidic channel. Finally, the improvement can also be obtained by faster scanning mechanisms such as analog optical image reconstruction.20 Furthermore, future implementations include the use of three-dimensional hydrodynamic focusing for the fine control of the cell position inside the channel,29 the integration with image-based cell sorting functionality,30–32 and the creation of spatially distributed scanning patterns to achieve 3D imaging capability. We anticipate the OSM system to offer a promising paradigm for a variety of super-resolution optofluidic imaging applications in biology, pharmacology and medical diagnostics.
Author contributions
B. M. and S. J. conceived and designed the project. B. M. built the experimental setup and performed the experiments. J. S. helped with the sample preparation. B. M. conducted the image analysis. S. J. supervised the project. B. M. and S. J. wrote the manuscript.Conflicts of interest
There are no conflicts to declare.Acknowledgements
This work was supported by the faculty start-up fund of the Georgia Institute of Technology.References
- D. Psaltis, S. R. Quake and C. Yang, Nature, 2006, 442, 381–386 CrossRef CAS.
- X. Fan and I. M. White, Nat. Photonics, 2011, 5, 591–597 CrossRef CAS PubMed.
- P. Minzioni, R. Osellame, C. Sada, S. Zhao, F. G. Omenetto, K. B. Gylfason, T. Haraldsson, Y. Zhang, A. Ozcan, A. Wax, F. Mugele, H. Schmidt, G. Testa, R. Bernini, J. Guck, C. Liberale, K. Berg-Sørensen, J. Chen, M. Pollnau, S. Xiong, A. Q. Liu, C. C. Shiue, S. K. Fan, D. Erickson and D. Sinton, J. Opt., 2017, 19, 93003 CrossRef.
- J. Wu, G. Zheng and L. M. Lee, Lab Chip, 2012, 12, 3566 RSC.
- P. Paiè, R. Martínez Vázquez, R. Osellame, F. Bragheri and A. Bassi, Cytometry, Part A, 2018, 93, 987–996 CrossRef.
- S. Chen, R. Hao, Y. Zhang and H. Yang, Photonics Res., 2019, 7, 532 CrossRef CAS.
- P. Paiè, F. Bragheri, A. Bassi and R. Osellame, Lab Chip, 2016, 16, 1556–1560 RSC.
- H. Jiang, T. Zhu, H. Zhang, J. Nie, Z. Guan, C. M. Ho, S. Liu and P. Fei, Lab Chip, 2017, 17, 2193–2197 RSC.
- H. Mikami, J. Harmon, H. Kobayashi, S. Hamad, Y. Wang, O. Iwata, K. Suzuki, T. Ito, Y. Aisaka, N. Kutsuna, K. Nagasawa, H. Watarai, Y. Ozeki and K. Goda, Optica, 2018, 5, 117 CrossRef CAS.
- V. K. Jagannadh, M. D. Mackenzie, P. Pal, A. K. Kar and S. S. Gorthi, Opt. Express, 2016, 24, 22144 CrossRef CAS PubMed.
- S. Stavrakis, G. Holzner, J. Choo and A. de Mello, Curr. Opin. Biotechnol., 2019, 55, 36–43 CrossRef CAS PubMed.
- H. Mikami, M. Kawaguchi, C. J. Huang, H. Matsumura, T. Sugimura, K. Huang, C. Lei, S. Ueno, T. Miura, T. Ito, K. Nagasawa, T. Maeno, H. Watarai, M. Yamagishi, S. Uemura, S. Ohnuki, Y. Ohya, H. Kurokawa, S. Matsusaka, C. W. Sun, Y. Ozeki and K. Goda, Nat. Commun., 2020, 11, 1–11 Search PubMed.
- L. E. Weiss, Y. Shalev Ezra, S. Goldberg, B. Ferdman, O. Adir, A. Schroeder, O. Alalouf and Y. Shechtman, Nat. Nanotechnol., 2020, 15, 500–506 CrossRef CAS PubMed.
- P. Almada, P. M. Pereira, S. Culley, G. Caillol, F. Boroni-Rueda, C. L. Dix, G. Charras, B. Baum, R. F. Laine, C. Leterrier and R. Henriques, Nat. Commun., 2019, 10, 1223 CrossRef PubMed.
- K. AbuZineh, L. I. Joudeh, B. Al Alwan, S. M. Hamdan, J. S. Merzaban and S. Habuchi, Sci. Adv., 2018, 4, eaat5304 CrossRef CAS PubMed.
- C. J. R. Sheppard, Optik, 1988, 80, 53–54 Search PubMed.
- C. B. Müller and J. Enderlein, Phys. Rev. Lett., 2010, 104, 1–4 Search PubMed.
- A. G. York, S. H. Parekh, D. D. Nogare, R. S. Fischer, K. Temprine, M. Mione, A. B. Chitnis, C. A. Combs and H. Shroff, Nat. Methods, 2012, 9, 749–754 CrossRef CAS PubMed.
- C. J. R. Sheppard, S. B. Mehta and R. Heintzmann, Opt. Lett., 2013, 38, 2889 CrossRef PubMed.
- A. G. York, P. Chandris, D. D. Nogare, J. Head, P. Wawrzusin, R. S. Fischer, A. Chitnis and H. Shroff, Nat. Methods, 2013, 10, 1122–1126 CrossRef CAS PubMed.
- T. Azuma and T. Kei, Opt. Express, 2015, 23, 15003 CrossRef CAS PubMed.
- M. Castello, G. Tortarolo, M. Buttafava, T. Deguchi, F. Villa, S. Koho, L. Pesce, M. Oneto, S. Pelicci, L. Lanzanó, P. Bianchini, C. J. R. Sheppard, A. Diaspro, A. Tosi and G. Vicidomini, Nat. Methods, 2019, 16, 175–178 CrossRef CAS PubMed.
- Y. Wu and H. Shroff, Nat. Methods, 2018, 15, 1011–1019 CrossRef CAS PubMed.
- K. Weber, P. C. Rathke and M. Osborn, Proc. Natl. Acad. Sci. U. S. A., 1978, 75, 1820–1824 CrossRef CAS PubMed.
- H. Yang and M. A. M. Gijs, Chem. Soc. Rev., 2018, 47, 1391–1458 RSC.
- F. Sala, M. Castriotta, P. Paiè, A. Farina, S. D. Annunzio, A. Zippo, R. Osellame, F. Bragheri and A. Bassi, Biomed. Opt. Express, 2020, 11, 4397–4407 CrossRef CAS.
- E. J. Gualda, H. Pereira, T. Vale, M. F. Estrada, C. Brito and N. Moreno, Biomed. Opt. Express, 2015, 6, 4447 CrossRef CAS.
- S. Pang, C. Han, L. M. Lee and C. Yang, Lab Chip, 2011, 11, 3698–3702 RSC.
- M. A. Daniele, D. A. Boyd, D. R. Mott and F. S. Ligler, Biosens. Bioelectron., 2015, 67, 25–34 CrossRef CAS PubMed.
- Y. Gu, A. C. Zhang, Y. Han, J. Li, C. Chen and Y. H. Lo, Cytometry, Part A, 2019, 95, 499–509 CrossRef.
- A. A. Nawaz, M. Urbanska, M. Herbig, M. Nötzel, M. Kräter, P. Rosendahl, C. Herold, N. Toepfner, M. Kubánková, R. Goswami, S. Abuhattum, F. Reichel, P. Müller, A. Taubenberger, S. Girardo, A. Jacobi and J. Guck, Nat. Methods, 2020, 17, 595–599 CrossRef CAS PubMed.
- A. Isozaki, H. Mikami, H. Tezuka, H. Matsumura, K. Huang, M. Akamine, K. Hiramatsu, T. Iino, T. Ito, H. Karakawa, Y. Kasai, Y. Li, Y. Nakagawa, S. Ohnuki, T. Ota, Y. Qian, S. Sakuma, T. Sekiya, Y. Shirasaki, N. Suzuki, E. Tayyabi, T. Wakamiya, M. Xu, M. Yamagishi, H. Yan, Q. Yu, S. Yan, D. Yuan, W. Zhang, Y. Zhao, F. Arai, R. E. Campbell, C. Danelon, D. Di Carlo, K. Hiraki, Y. Hoshino, Y. Hosokawa, M. Inaba, A. Nakagawa, Y. Ohya, M. Oikawa, S. Uemura, Y. Ozeki, T. Sugimura, N. Nitta and K. Goda, Lab Chip, 2020, 20, 2263–2273 RSC.
Footnote |
| † Electronic supplementary information (ESI) available. See DOI: 10.1039/d0lc00889c |
| This journal is © The Royal Society of Chemistry 2021 |


