
Integrated microfluidic platform with electrohydrodynamic focusing and a carbon-nanotube-based field-effect transistor immunosensor for continuous, selective, and label-free quantification of bacteria†
Chang-Ho
Han
a and
Jaesung
Jang
 *ab
*ab
aDepartment of Mechanical Engineering, Ulsan National Institute of Science and Technology (UNIST), Ulsan 44919, Republic of Korea. E-mail: jjang@unist.ac.kr; Fax: +82 52 217 2449; Tel: +82 52 217 2323
bDepartment of Biomedical Engineering, UNIST, Ulsan 44919, Republic of Korea
First published on 7th December 2020
Abstract
Electrokinetic technologies such as AC electro-osmosis (EO) and dielectrophoresis (DEP) have been used for effective manipulation of bacteria to enhance the sensitivity of an assay, and many previously reported electrokinetics-enhanced biosensors are based on stagnant fluids. An effective region for positive DEP for particle capture is usually too close to the electrode for the flowing particles to move toward the detection zone of a biosensor against the flow direction; this poses a technical challenge for electrokinetics-assisted biosensors implemented within pressure-driven flows, especially if the particles flow with high speed and if the detection zone is small. Here, we present a microfluidic single-walled carbon nanotube (SWCNT)-based field-effect transistor immunosensor with electrohydrodynamic (EHD) focusing and DEP concentration for continuous and label-free detection of flowing Staphylococcus aureus in a 0.01× phosphate buffered saline (PBS) solution. The EHD focusing involved AC EO and negative DEP to align the flowing particles along lines close to the bottom surface of a microfluidic channel for facilitating particle capture downstream at the detection zone. For feasibility, 380 nm-diameter fluorescent beads suspended in 0.001× PBS were tested, and 14.6 times more beads were observed to be concentrated in the detection area with EHD focusing. Moreover, label-free, continuous, and selective measurement of S. aureus in 0.01× PBS was demonstrated, showing good linearity between the relative changes in electrical conductance of the SWCNTs and logarithmic S. aureus concentrations, a capture/detection time of 35 min, and a limit of detection of 150 CFU mL−1, as well as high specificity through electrical manipulation and biological interaction.
1. Introduction
Rapid measurement of pathogenic bacteria is a critical process in medical diagnostics, the food industry, and environmental monitoring, among others. Extensively used techniques for such purposes include growth and colony counting, nucleic-acid-based assays, and immunoassays.1 Electrokinetic technologies such as AC electro-osmosis (EO) and dielectrophoresis (DEP) have been employed for effective manipulation of bacteria, such as separation, enrichment, and mixing, as preliminary steps before detection to enhance the sensitivity of the assay.2,3 AC EO represents a fluid motion induced by electrode polarization; therefore, microorganisms that are distant from the electrode can be moved closer to a detection area with flow motion, and this process is not dependent on the particle size and type.4 On the other hand, AC DEP involves the movement of a polarizable particle in a non-uniform electric field depending on the particle size and the electrical properties of particles and media, thereby enabling concentration of particular microorganisms in a detection area.1,5–7 The positive DEP (pDEP) is extensively used to capture bacterial particles, although it is effective only in regions close to an electrode. Recently, the simultaneous use of AC EO and DEP at a single electrical frequency was reported;8,9 however, the choice of frequency was even more limited than using either AC EO or DEP alone. AC electrothermal (ET) actuation was also applied to induce convective flows in sensors,10 while additional considerations, such as conformational changes, thermal stress of pathogens, and damage to devices via temperature rise owing to Joule heating, are unavoidable.2,7Many previously reported electrokinetics-enhanced biosensors are based on stagnant liquids,2 where analytes can be manipulated more easily than under flowing liquids. If a biosensor is implemented within a pressure-driven flow rather than a stagnant liquid for higher throughput, automation, multiplexed detection, and/or continuous monitoring,11 stronger electrical forces need to be exerted on the analytes, such as pDEP, to overcome the hydrodynamic forces and to bind the particles to a detection zone, which usually constitutes a very small area for field-effect transistor (FET)-based sensors.12 This can be a challenge because an effective region for the pDEP is usually too close to the electrode of the channel surface to drag all the particles flowing from the top surface to the bottom toward the detection zone of a biosensor against the flow direction, especially when the particles flow with high speed and the detection zone is small. Hence, in most studies on electrokinetics-enhanced biosensors for flowing targets, capture efficiencies were either low or not measured, labeling was used, the limits of detection were relatively high, the electrical impedance technique was used for detection by using relatively large electrode areas, and/or sensor selectivity against non-targets was not tested (Table 1), although electrokinetic particle manipulation has been extensively explored for the last few decades.
| Ref. | Target | Labeling | Buffer | Electrokinetics (stage 1) | Electrokinetics (stage 2) | Detection | Electrodes | Microchannel | Flow rate (averaged flow velocity) | Capture/detection time | Sensitivity | Selectivity test | Limit of detection | Measurement range | Remark |
|---|---|---|---|---|---|---|---|---|---|---|---|---|---|---|---|
| 22 | S. cerevisiae | 0.1 M mannitol (2 μS cm−1) | AC pDEP capturing (5 Vpp & 100 kHz) | AC electropermeabilization (20 Vpp) | Electrical impedance | Planar IDEs | 500 μL min−1 (μm s−1) | 15 min (capture & detection) | 100 CFU mL−1 | 100–105 CFU mL−1 | |||||
| 38 | B. subtilis | DI water (1–2 μS cm−1) | DC iDEP capturing (1 kV) | Electrical impedance | Insulators & sensing electrodes | 1000 μm/90 μm | 40 μL min−1 (7407 μm s−1) | 2 min (capture & detection) | ∼2 [degree per (spores per mL)] | 103 spores per mL | 103–104 spores per mL | ||||
| 39 | E. coli K-12 | 0.1 M mannitol (1 μS cm−1) | AC nDEP pushing (20 Vpp & 1 kHz) | AC pDEP capturing (5 Vpp & 100 kHz) | Electrical impedance | Top-bottom electrodes | (270![[thin space (1/6-em)]](https://www.rsc.org/images/entities/char_2009.gif) 000 μm s−1) 000 μm s−1) |
15 min (capture & detection) | |||||||
| 40 | E. coli O157:H7 | DI water | AC pDEP focusing (5 Vpp & 5.6 MHz) | AC pDEP capturing (5 Vpp & 100 kHz) | Electrical impedance (Ab) | Planar IDEs | 300 μm/25 μm | 180 min (capture & detection) | 40 [k-ohm per (log CFU mL−1)] | E. coli O104:H4 | 300 CFU mL−1 | 300–3 × 10⁵ CFU mL−1 | Blocking agent for non-specific binding was not used | ||
| 26 | S. choleraesuis/N. lactamica | Nanoprobe | 15 mM PBS-Tween20 (150 μS cm−1) | AC nDEP capturing (20 Vpp & 660 kHz) | SERS | Planar quadrupole electrodes | 800 μm/800 μm | 15 μL min−1 (391 μm s−1) | 10 min (capture & detection) | 70 CFU mL−1 | |||||
| 41 | S. epidermidis | 0.001× PBS | Resonant AC pDEP + ET collection (14 Vpp & 63 MHz) | Electrical impedance | IDEs | 1000 μm/300 μm | 5 μL min−1 (278 μm s−1) | 20 min (capture & detection) | 105 CFU mL−1 | ||||||
| 1 | E. coli | Drinking water (86 μS cm−1) | AC pDEP focusing (4 Vpp & 100 kHz) | AC pDEP collection (2.5 Vpp & 10 kHz) | Electrical impedance | Planar coplanar electrodes | 10000 μm/150 μm |
25 μL min−1 (1389 μm s−1) | 1 min/0.5 min | 0.01 [%/(CFU mL−1)] | 300 CFU mL−1 | 300–1500 CFU mL−1 | |||
| 42 | Prostate specific antigen | Ab-conjugated GNP | 0.1× serum in PBS (13000 μS cm−1) |
AC iDEP capturing (∼200 Vpp cm−1) | Voltammetry | Inlet–outlet reservoirs with nanoslit (30 nm) | Local nanochannel | ∼15 [(μA cm−2)/log (g mL−1)] | 1 pg mL−1 | 5–1000 pg mL−1 | |||||
| 43 | Avidin (inlet 1) | Biotin (inlet 2) | Diluted PBS (250 μS cm−1) | AC IET change (10 Vpp & 1–20 MHz) | Liquid interface monitoring | Inlet–outlet reservoirs | 100 μm/65 μm | 5 μL min−1 (12851 μm s−1) |
626 fM | 50 fM–2.5 μM | |||||
| 44 | Dengue virus | Ab-conjugated silica beads | Diluted DMEM (1000 μS cm−1) | AC nDEP guiding (15 Vpp & 1 MHz) | AC nDEP capturing (15 Vpp; 1 MHz) | Fluorescence intensity | Top-down (ceiling-bottom) electrodes | 1000 μm/10 μm | 0.3 μL min−1 (500 μm s−1) | 5 min (capture & detection) | 104 PFU mL−1 | 104–106 PFU mL−1 | |||
| 8 | E. coli | DI water | AC EO + DEP collection (10 Vpp & 120 kHz) | Resonant frequency shift | Planar spiral IDEs | 400 μL min−1 (4444 μm s−1) | 10 min (capture & detection) | 326 [fg Hz−1] | 105 cells per mL | 105 cells per mL | Capture efficiency: 0.125% | ||||
| 7 | E. coli | Secondary Ab | DI water (1 μS cm−1) | AC pDEP collection (5 Vpp & 500 Hz) | SPR | Planar IDEs | 3000 μm/50 μm | 10 μL min−1 (1111 μm s−1) | 20 min/10 min | 0.7 [nm per (log CFU mL−1)] | S. epidermidis | 300 CFU mL−1 | 300–106 CFU mL−1 | ||
| Present study | S. aureus | 0.01× PBS (200 μS cm−1) | AC EO + nDEP focusing (1.5 Vpp & 9 kHz) | AC pDEP collection (10 Vpp & 8 MHz) | FET conductance (SWCNT-Ab) | Coplanar electrodes | 200 μm/49 μm | 0.2 μL min−1 (340 μm s−1) | 10 min/25 min | 2.95 [%/(log CFU mL−1)] | B. subtilis, E. coli C3000, S. epidermidis | 150 CFU mL−1 | 200–106 CFU mL−1 | Capture efficiency: 23% |
One approach to address this challenge is to align all the particles along two-dimensional surfaces or one-dimensional lines during flow, which is commonly called “particle focusing.” Several particle focusing techniques have been developed in the literature. Inertial focusing is a passive technique that is generated by particle inertia under a flow field;13,14 however, complicated device structures are needed, and small particles are unlikely to be manipulated by this technique.15 Acoustic focusing involves surface acoustic waves, showing fast fluidic actuation and contact-free particle manipulation.16,17 DEP focusing incorporates an array of planar or vertical electrodes for applying the DEP forces; however, particle losses are unavoidable because many particles attach to the focusing electrodes in the case of the pDEP,1,18 and the DEP force is inherently insufficient in regions farther from the electrodes.19 These three focusing techniques are also strongly dependent on particle sizes; hence, small particles in the range of submicron sizes are difficult to focus.14,17 More importantly, none of these focusing technologies can align all the particles close to the detection area without losses to the channel surfaces, which is critical for development of a biosensor involving pDEP to capture flowing particles.
Herein, we present a microfluidic FET immunosensor equipped with electrohydrodynamic (EHD) focusing and DEP concentration for continuous and label-free electrical detection of Staphylococcus aureus in a 0.01× phosphate buffered saline (PBS) solution. Many flow-type DEP-mediated biosensors have involved impedance measurements with electron transfer through the media20,21 or pearl chain conductance of bacteria between the electrodes22 (Table 1). It has been suggested that FET-based sensors adopting silicon nanowires and CNTs are integrated with a microfluidic platform in order to enhance sensitivity and to achieve automated and multiplexed analytical systems;11 however, no studies in which particle focusing was implemented with FET-based biosensors under a pressure-driven flow have been reported.
EHD focusing uses a combination of AC EO and negative DEP (nDEP) rather than pDEP to align flowing particles along one-dimensional lines close to the bottom surface, and Ren et al.15 demonstrated EHD focusing for the first time using two electrical-bias-free electrodes at a fixed AC frequency (200 Hz) for 4 μm-diameter silica beads. The operation conditions in their study were very limited; both AC EO and nDEP were required to occur at the same frequency. In the present study, superimposed signals having two AC frequency components, lower (AC EO with weak pDEP) and higher (dominant nDEP), were implemented without electrical-bias-free electrodes to align incoming 380 nm-diameter polystyrene beads and label-free Staphylococcus aureus along one-dimensional lines close to the bottom surface to facilitate pDEP capture downstream. Polystyrene beads were used to demonstrate the enhanced electrokinetic characteristics of the present microfluidic device, as they are widely used in quantitative evaluation of DEP systems with their regular spherical shapes and homogeneities compared to actual biological particles.23
The bacteria aligned using EHD focusing were further concentrated downstream using pDEP forces and quantified with a carbon-nanotube-based FET immunosensor (Fig. 1a). This FET sensor consists of two embedded concentration electrodes, two detection (source and drain) electrodes connected to an array of antibody-functionalized and aligned single-walled carbon nanotubes (SWCNTs), and a dielectric layer (Si3N4) to separate these two pairs of electrodes vertically.6 The relative electrical conductance change (RCC) between the detection electrodes owing to the bacteria concentrated on the SWCNTs was continuously measured. A 0.01× PBS solution was used as the medium, with electrical properties similar to drinking or tap water. The selectivity of the sensor platform was tested against Bacillus subtilis, Escherichia coli C3000, and Staphylococcus epidermidis along with its sensitivity. The selectivity was also investigated by DEP-capturing S. aureus (target) and E. coli C3000 (non-target) on the S. aureus antibody-coated SWCNTs under flows without EHD focusing and then by flushing, which has not been clearly reported until now.
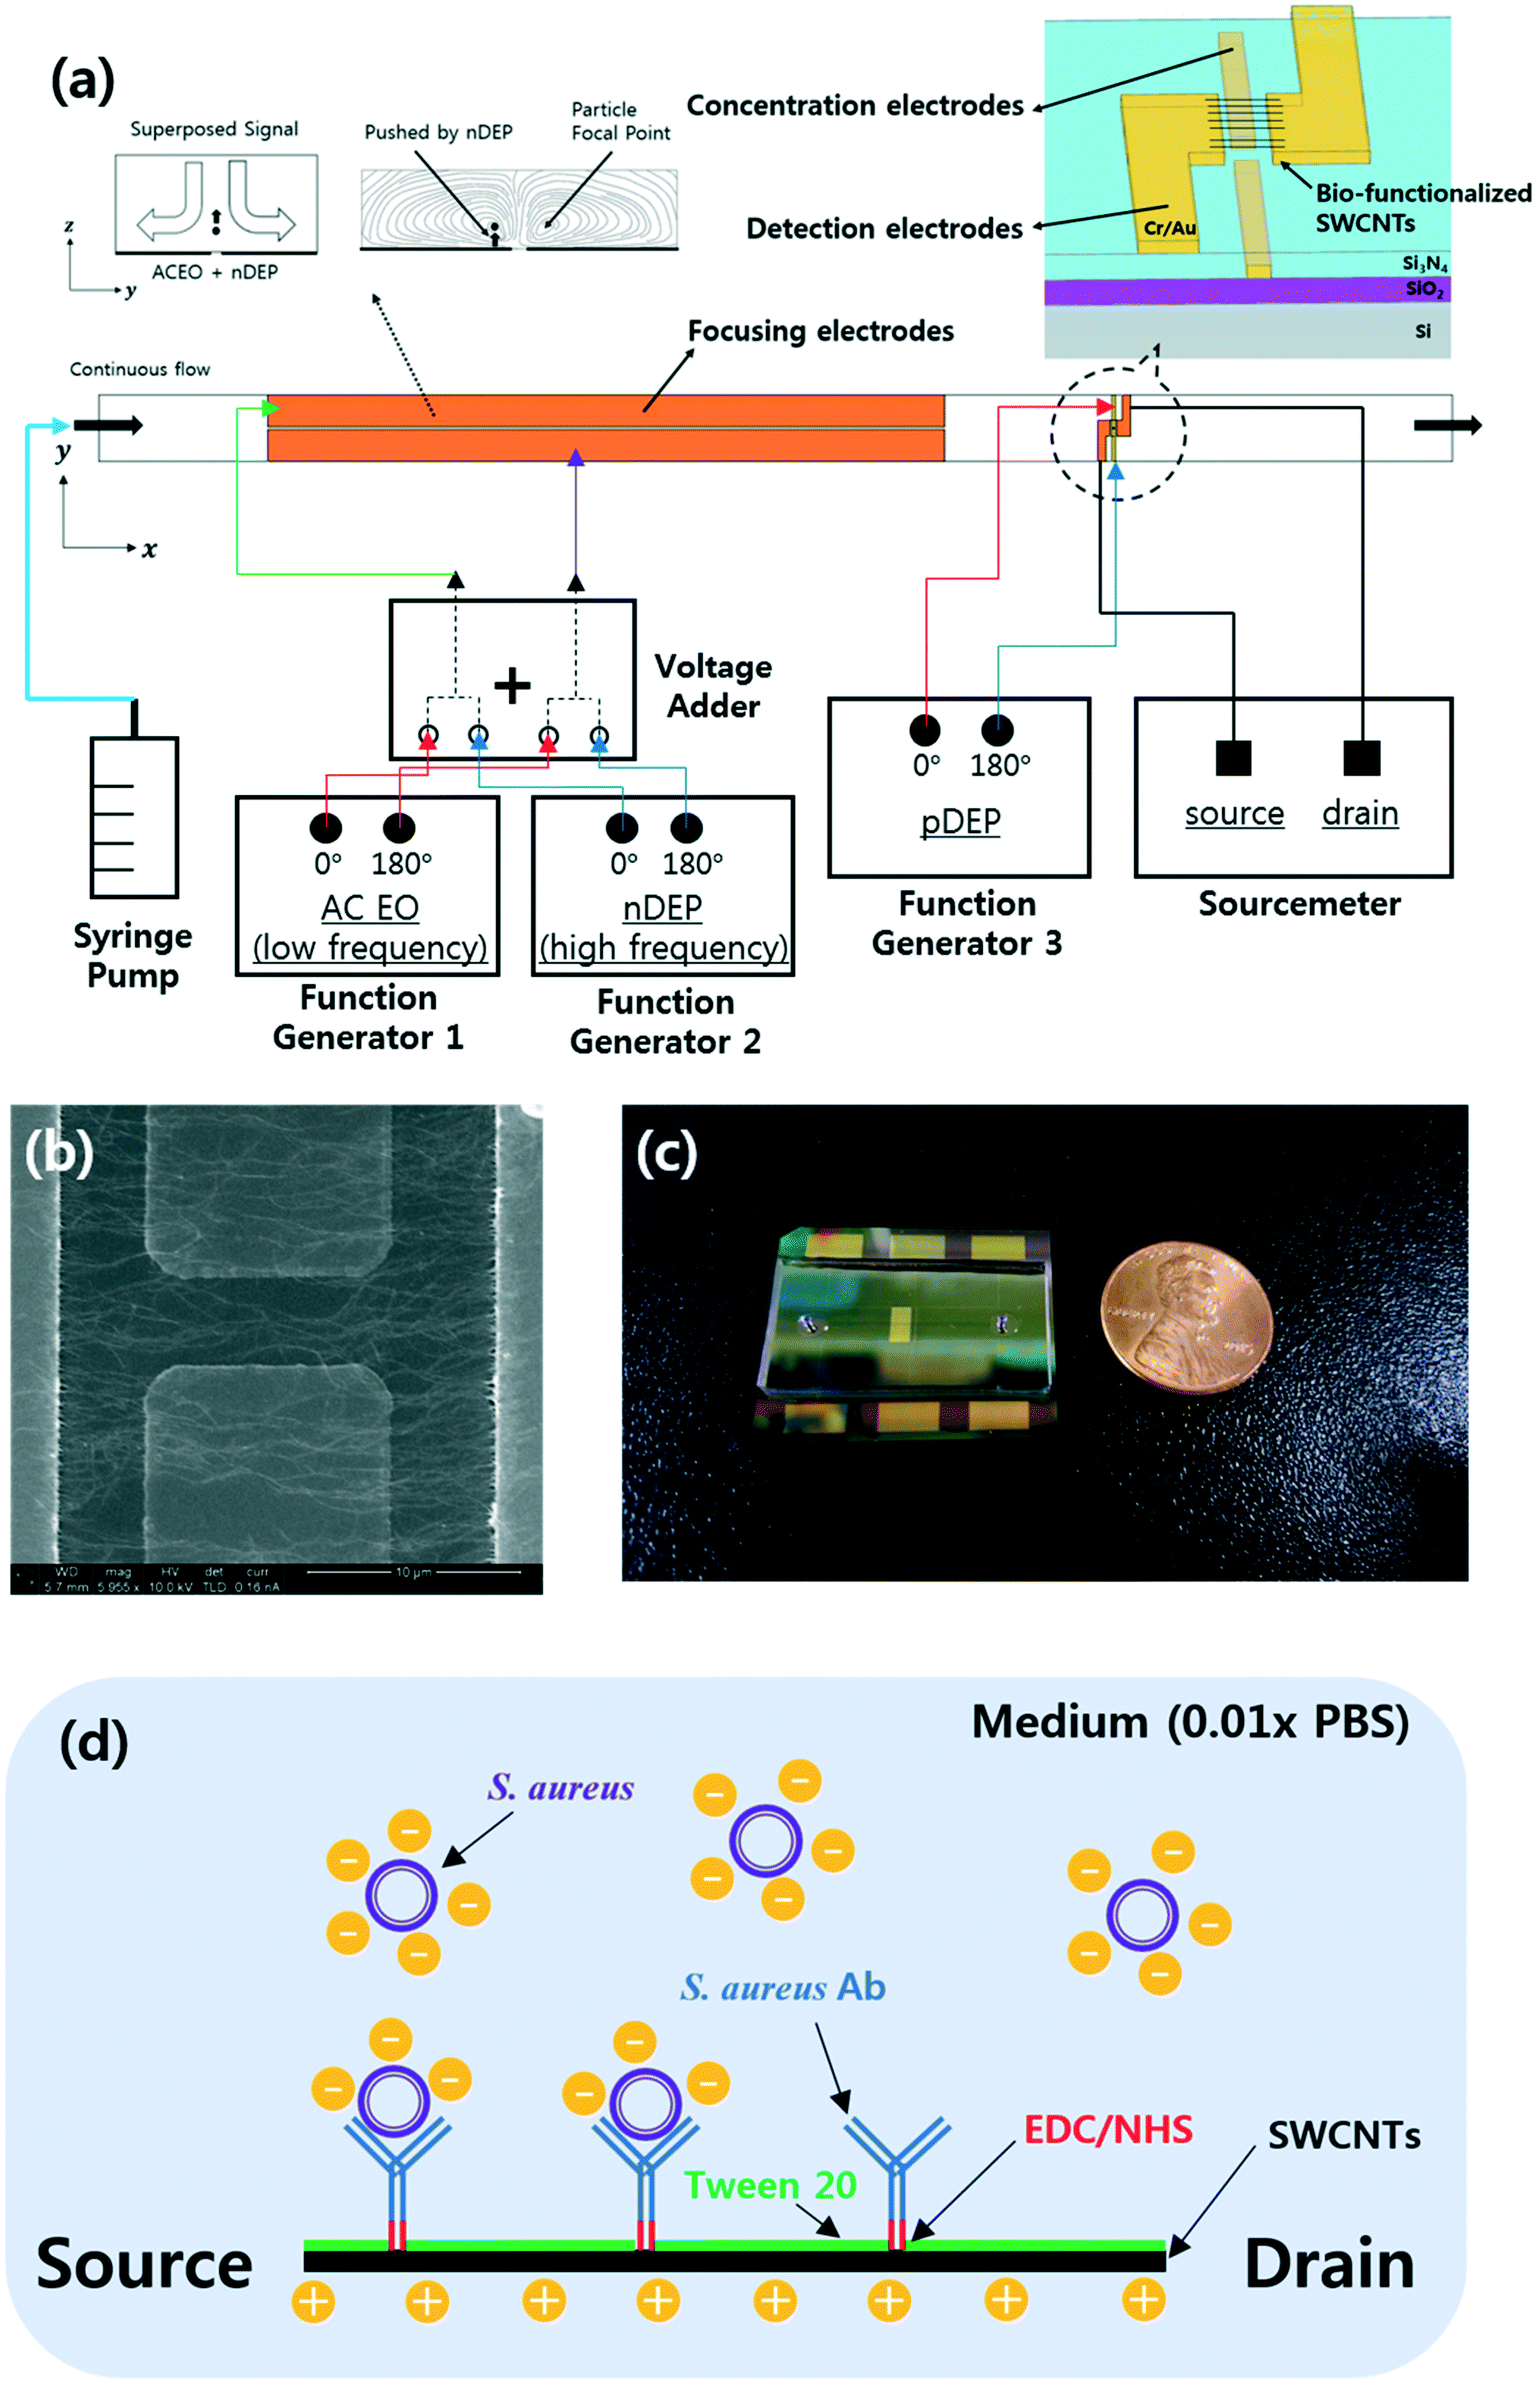 | ||
| Fig. 1 (a) Device configuration and experimental set-up with three pairs of electrodes: focusing, concentration, and detection electrodes. (b) Field-emission scanning electron microscopy image showing deposition of high-density aligned single-walled carbon nanotubes (SWCNTs) between the detection electrodes via alternating current dielectrophoresis (DEP). (c) Image of the fabricated device. (d) Functionalization scheme of the FET immunosensor and illustration of the FET by the capture of negatively charged S. aureus. The binding of the negatively charged bacteria onto the bio-functionalized SWCNTs induces holes in the p-type semiconductor, resulting in the increase of electrical currents. | ||
2. Materials and methods
2.1 Preparation of bead and bacteria solutions
Bacterial strains S. aureus (ATCC® 25923™), B. subtilis (ATCC® 21332™), E. coli C3000 (ATCC® 15597™), and S. epidermidis (ATCC® 12228™) were cultured on Luria–Bertani (LB) agar plates separately for 24 h at 37 °C. Each colony was then inoculated into 10 mL of LB broth (244620; Becton, Dickinson and Company, USA) and grown at 37 °C and 160 rpm in a shaking incubator for 4–6 h according to the late-log-phase growth condition (Fig. S1†), which was determined by measuring the optical density at 600 nm. The grown bacteria were diluted serially and centrifuged at 4000 rpm for 10 min to remove the residual LB broth. A 0.01× solution of PBS [100-fold diluted PBS (pH 7.4; Gibco™ 10010023; Thermo Scientific, USA) in deionized water (18.2 MΩ cm; from university-provided water pipelines)] was used as the medium to simulate drinking water; the electrical properties (conductivity, Debye length, etc.) of the 0.01× PBS and drinking water were similar. The label-free bacteria were re-suspended in the prepared media.For the particle capture experiments with beads and bacteria, 380 nm-diameter red (excitation/emission: 542/612 nm) fluorescent polystyrene beads (Fluoro-Max R400; Thermo Scientific, USA) were suspended in 0.001× PBS buffer to obtain a number density of 5 × 10⁵ particles per mL. The S. aureus and E. coli C3000 in 0.01× PBS solution were also labeled separately with SYTO™ 9 (S34854; Thermo Scientific, USA) (excitation/emission: 483/503 nm) (2.5 μM) at concentrations of 107 CFU mL−1.24 The electrical conductivity was measured using a conductivity meter (handylab pH/LF 12; SI Analytics GmbH, Germany), and these values were 200 μS cm−1 and 21 μS cm−1 for 0.01× PBS and 0.001× PBS, respectively, at room temperature.
2.2 Device microfabrication and surface modification
A 6 inch SiO2/Si wafer was pre-cleaned by ultrasonication in acetone and isopropyl alcohol for 5 min each. A pair of Cr/Au coplanar rectangular concentration electrodes (thickness: 10/100 nm) were deposited on the wafer. A 300 nm-thick dielectric Si3N4 layer was fabricated on the concentration electrodes using plasma enhanced chemical vapor deposition. The dielectric layer was then etched, and the residual photoresists were removed with oxygen plasma. The focusing and detection electrodes (Cr/Au thickness: 10/100 nm, respectively) were deposited using electron beam evaporation, and the wafer was diced into chips of 35 mm × 25 mm (Fig. 2). The embedded concentration electrodes (gap: 5 μm) and two source and drain electrodes (gap: 20 μm; width: 50 μm) were used for the pDEP capture and conductance measurements, respectively.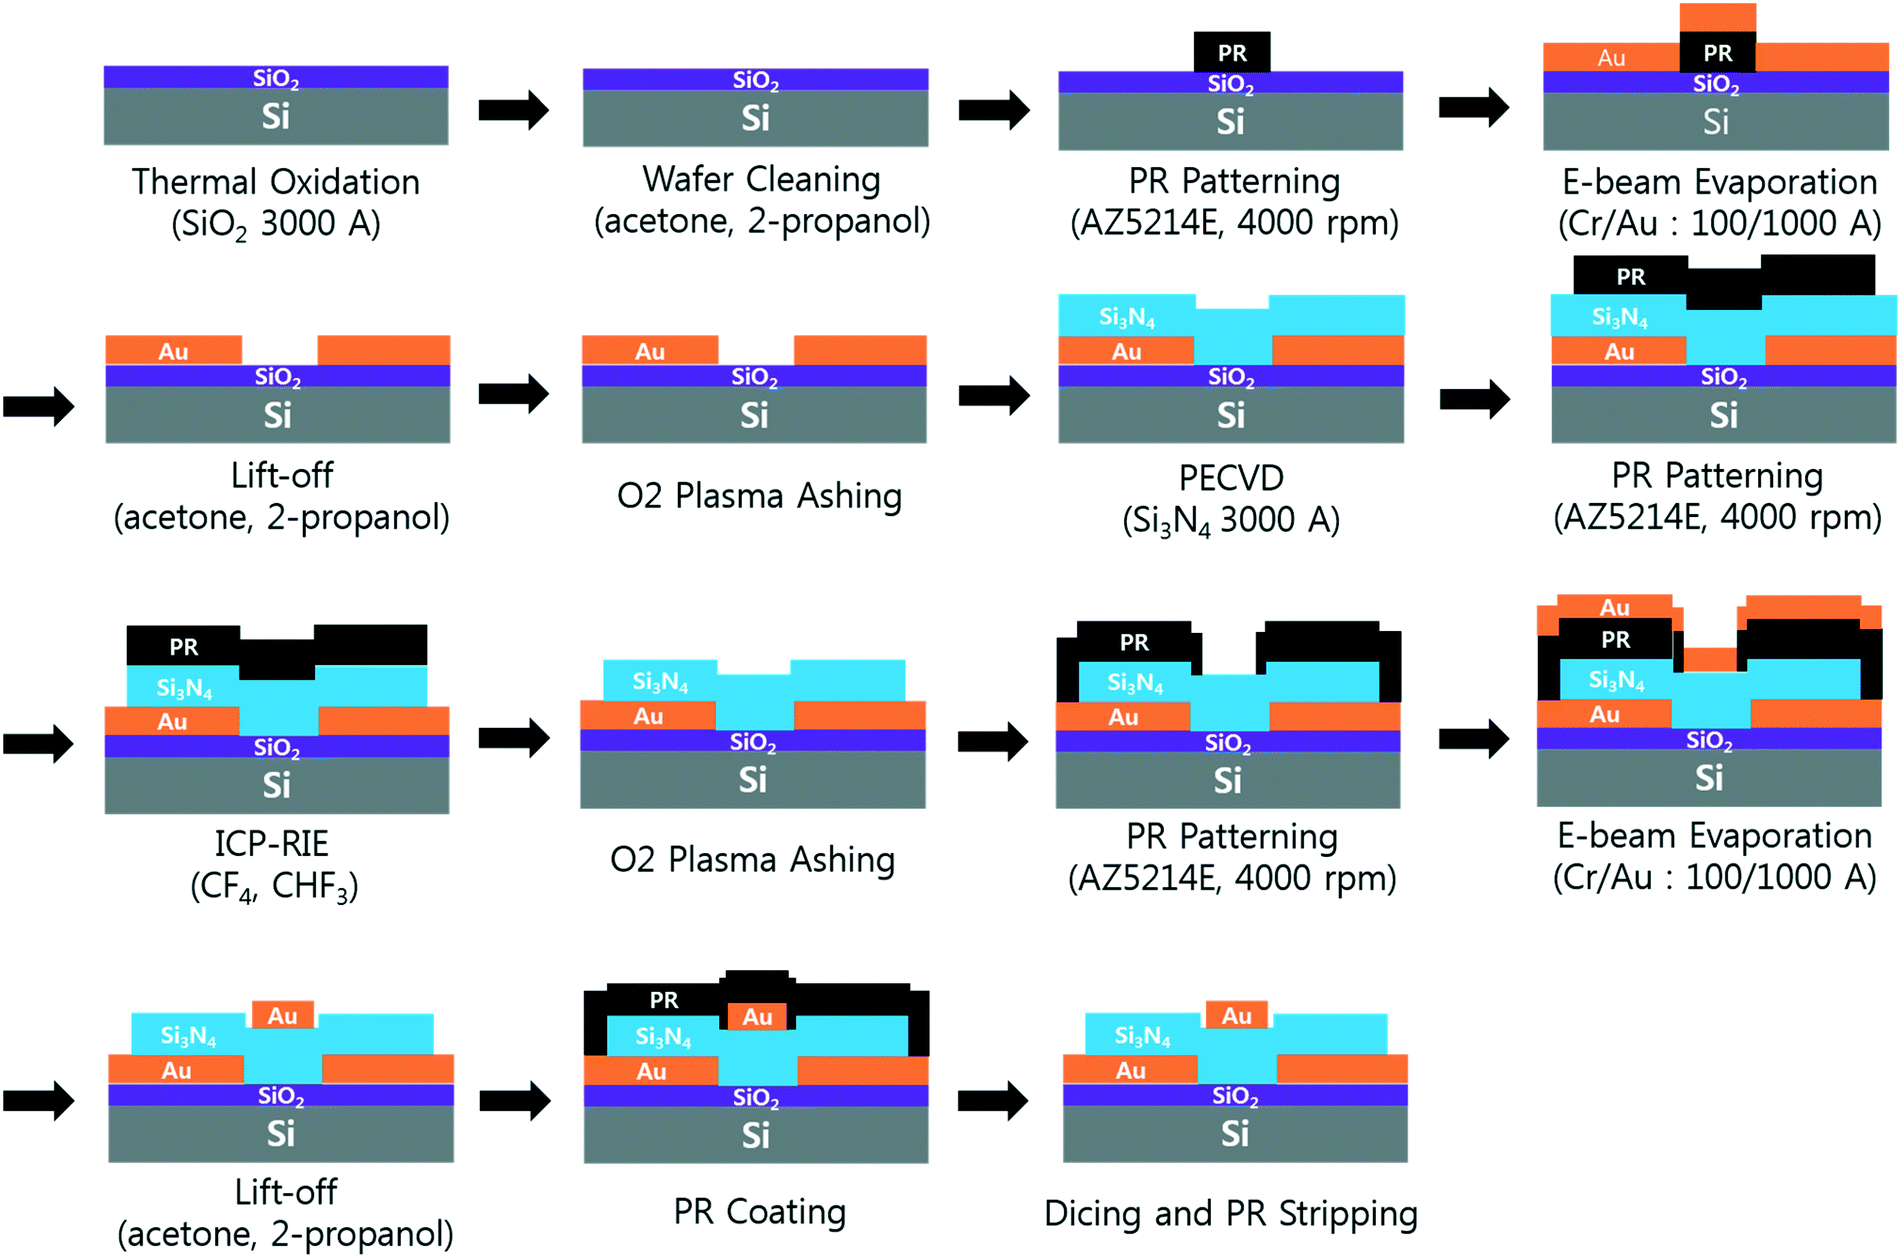 | ||
| Fig. 2 Microfabrication process of the microfluidic immunosensor chip. | ||
The SWCNT channels were prepared between the detection electrodes and functionalized as described in previous work.6 Briefly, SWCNT powder (98% semiconducting) was suspended in N,N-dimethylformamide (DMF; 3057–4405; Daejung Chemicals, Korea) through ultrasonication and centrifugation (concentration: 10 μg mL−1). Then, 5 μL of the prepared SWCNT suspension was applied between the two detection electrodes, and aligned SWCNT bridges were formed by applying DEP at 5 Vpp and 200 kHz for 30–60 s (Fig. 1b). Polyclonal anti-S. aureus (ab20920, Abcam, UK) in 1× PBS (concentration: 10 μg mL−1) was then immobilized on the SWCNTs by incubation at 37 °C for 2 h via EDC(1-ethyl-3-(3-dimethylaminopropyl)carbodiimide)-NHS (N-hydroxysuccinimide) chemistry. SuperBlock T20 blocking buffer (0.05% Tween-20; 37536, Thermo Scientific, USA) was incubated for 30 min at room temperature to prevent non-specific attachment to the SWCNTs25 (Fig. 1d). All the surface modifications were performed through a polydimethylsiloxane (PDMS) well around the SWCNTs, and the sensors were rinsed with 1× PBS and dried after each modification step. The current–voltage (I–V) curves were measured after each modification step (Fig. S2†). All the bio-functionalized sensors were stored at 4 °C before further use to maintain stability.26
2.3 Experimental set-up
PDMS microchannels (width/height: 200 μm/49 μm) with two 1 mm-diameter holes at the inlet and outlet reservoirs were manufactured as described in previous work27 and bonded onto the bio-functionalized sensor chips by aligning manually with a microscope (Fig. 1c). A syringe pump (Harvard Pump 11 Elite, 70-4505INT; Harvard Apparatus, USA) was used to infuse the prepared beads or bacterial solution into the prepared microfluidic device. External AC voltages were applied to the contact pads.For the bead capture experiments, a lab-made voltage adder was used to superimpose signals from two function generators (AFG3022C; Tektronix, USA).3 The superimposed signals were applied to the focusing electrodes to activate EO vortices (1.25 Vpp, 5.4 kHz) and nDEP pushing (10 Vpp, 3 MHz) to align the particles along the stagnant lines (Fig. 1a). Another function generator (WW5064; Tabor, Israel) was used for the pDEP capture (10 Vpp, 200 kHz) of beads on the SWCNT channels. Here, each function generator offered sinusoidal signals that were 180° out of phase via the two-channel sources. A cooled interline transfer camera (ORCA-R2; Hamamatsu, Japan) connected to an inverted fluorescence microscope (Eclipse Ti-U; Nikon, Japan) was used to obtain images at an exposure time of 100 ms. The number of beads captured in a specified area (20 × 50 μm2) between the two detection electrodes was counted with ImageJ by dividing the total area occupied by the particles by the area occupied by a single bead in the fluorescence images.3,28
For the bacterial quantification experiments, EHD focusing (1.5 Vpp, 9 kHz) and concentration (10 Vpp, 8 MHz) electrodes were biased for 10 min, and the RCC of the SWCNTs was measured throughout the experiments via the detection electrodes using a source meter (2635B; Keithley Instruments, USA) at a fixed source–drain voltage of 100 mV. The RCC was computed as (G–G0)/G0, where G is the electrical conductance measured in real time and G0 is the equilibrated electrical conductance measured under steady flow before the actuation of AC signals. The stabilized RCC (SRC) was also computed as (GS–G0)/G0, where GS is the stabilized electrical conductance measured after the 10 min-bacterial attachment.29
The optimization process for the voltages and frequencies of EHD focusing in these two experiments is available in the ESI† (Fig. S3). The frequencies for DEP concentration were determined according to the Clausius–Mossotti (CM) factors under a maximal voltage output of 10 Vpp (peak-to-peak). Each experiment in this study was performed at least thrice, and the mean values are shown with their standard deviations indicated as error bars.
3. Results and discussion
3.1 Enhanced DEP capture of nanometer-sized beads aided by EHD focusing
Fig. 1 shows a schematic of the designed microfluidic immunosensor consisting of three pairs of coplanar electrodes: focusing (10 μm gap), concentration (5 μm gap), and detection (20 μm gap) electrodes with the experimental set-up. The focusing electrodes were designed for EHD focusing of the particles based on the AC EO vortex with nDEP on the y–z plane during continuous transport in the streamwise (x) direction. This means that stagnant particle focal points were formed inside the AC EO vortices while being pushed by the nDEP; thus, the incoming particles were confined around the focal points. As these points were located close to the bottom surface as well as close to the center of the CNT channel in the streamwise direction, they were effectively captured using the concentration electrodes via pDEP. The real parts of the CM factors for the beads were found to determine their DEP behaviors, and were 0.63 (at 5.4 kHz), 0.61 (at 200 kHz), and −0.16 (at 3 MHz) (Fig. 3).30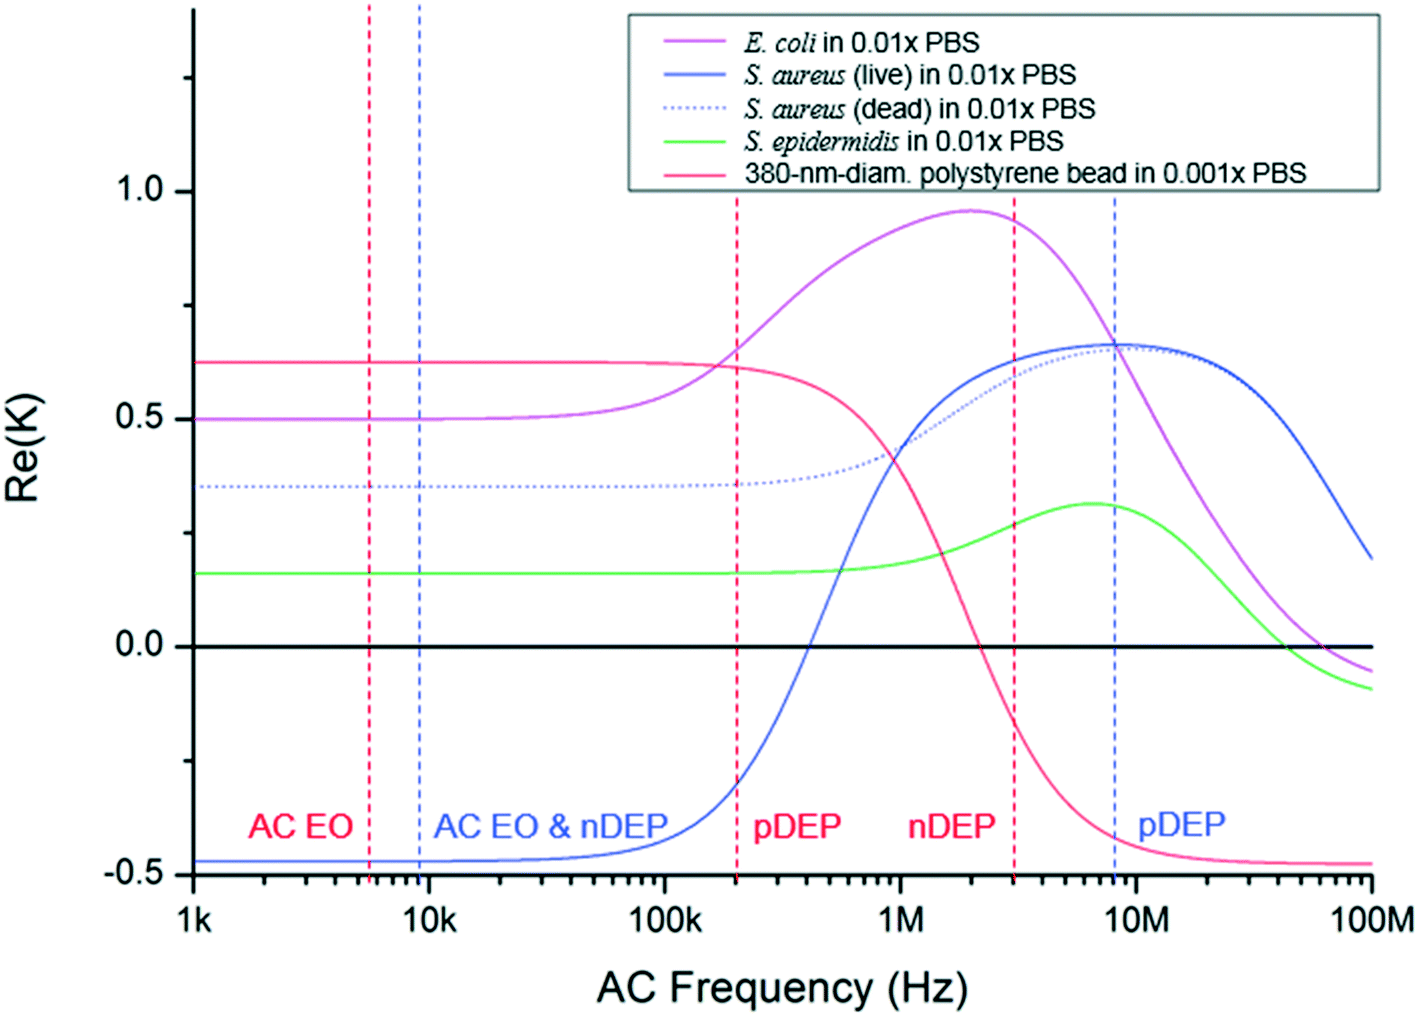 | ||
| Fig. 3 Clausius–Mossotti factors of selected bacteria and a bead. They are functions of electrical permittivity and conductivity of media and particles, where the wall, membrane, and cytoplasm were considered in the calculation in the case of bacteria.33–36 The dielectric property of B. subtilis is unknown. Red and blue vertical dashed lines indicate the AC frequencies for the bead and S. aureus experiments, respectively. | ||
It was observed that EHD focusing of the 380 nm-diameter beads was not easy to accomplish by the AC EO signal alone. Both AC EO vortices and weak pDEP attachment onto the focusing electrodes occurred at a frequency of 5.4 kHz. Hence, another nDEP signal (3 MHz) was superimposed on the AC EO signals, and the superimposed signals having both low (AC EO) and high (nDEP) frequency components were applied to the focusing electrodes. Successful particle focusing using the superimposed signals was then demonstrated experimentally (Fig. 4a and b) and numerically (Fig. 4c and d). The fluorescence images were obtained over the detection electrodes, and computer simulations were obtained with Comsol Multiphysics software (please see the ESI†). The beads were delivered to the DEP-effective region close to the concentration electrodes with minimal losses. The number of beads observed in the detection area was 14.6 times greater than those without EHD focusing, and no beads were captured without DEP concentration (Fig. 4e and f).
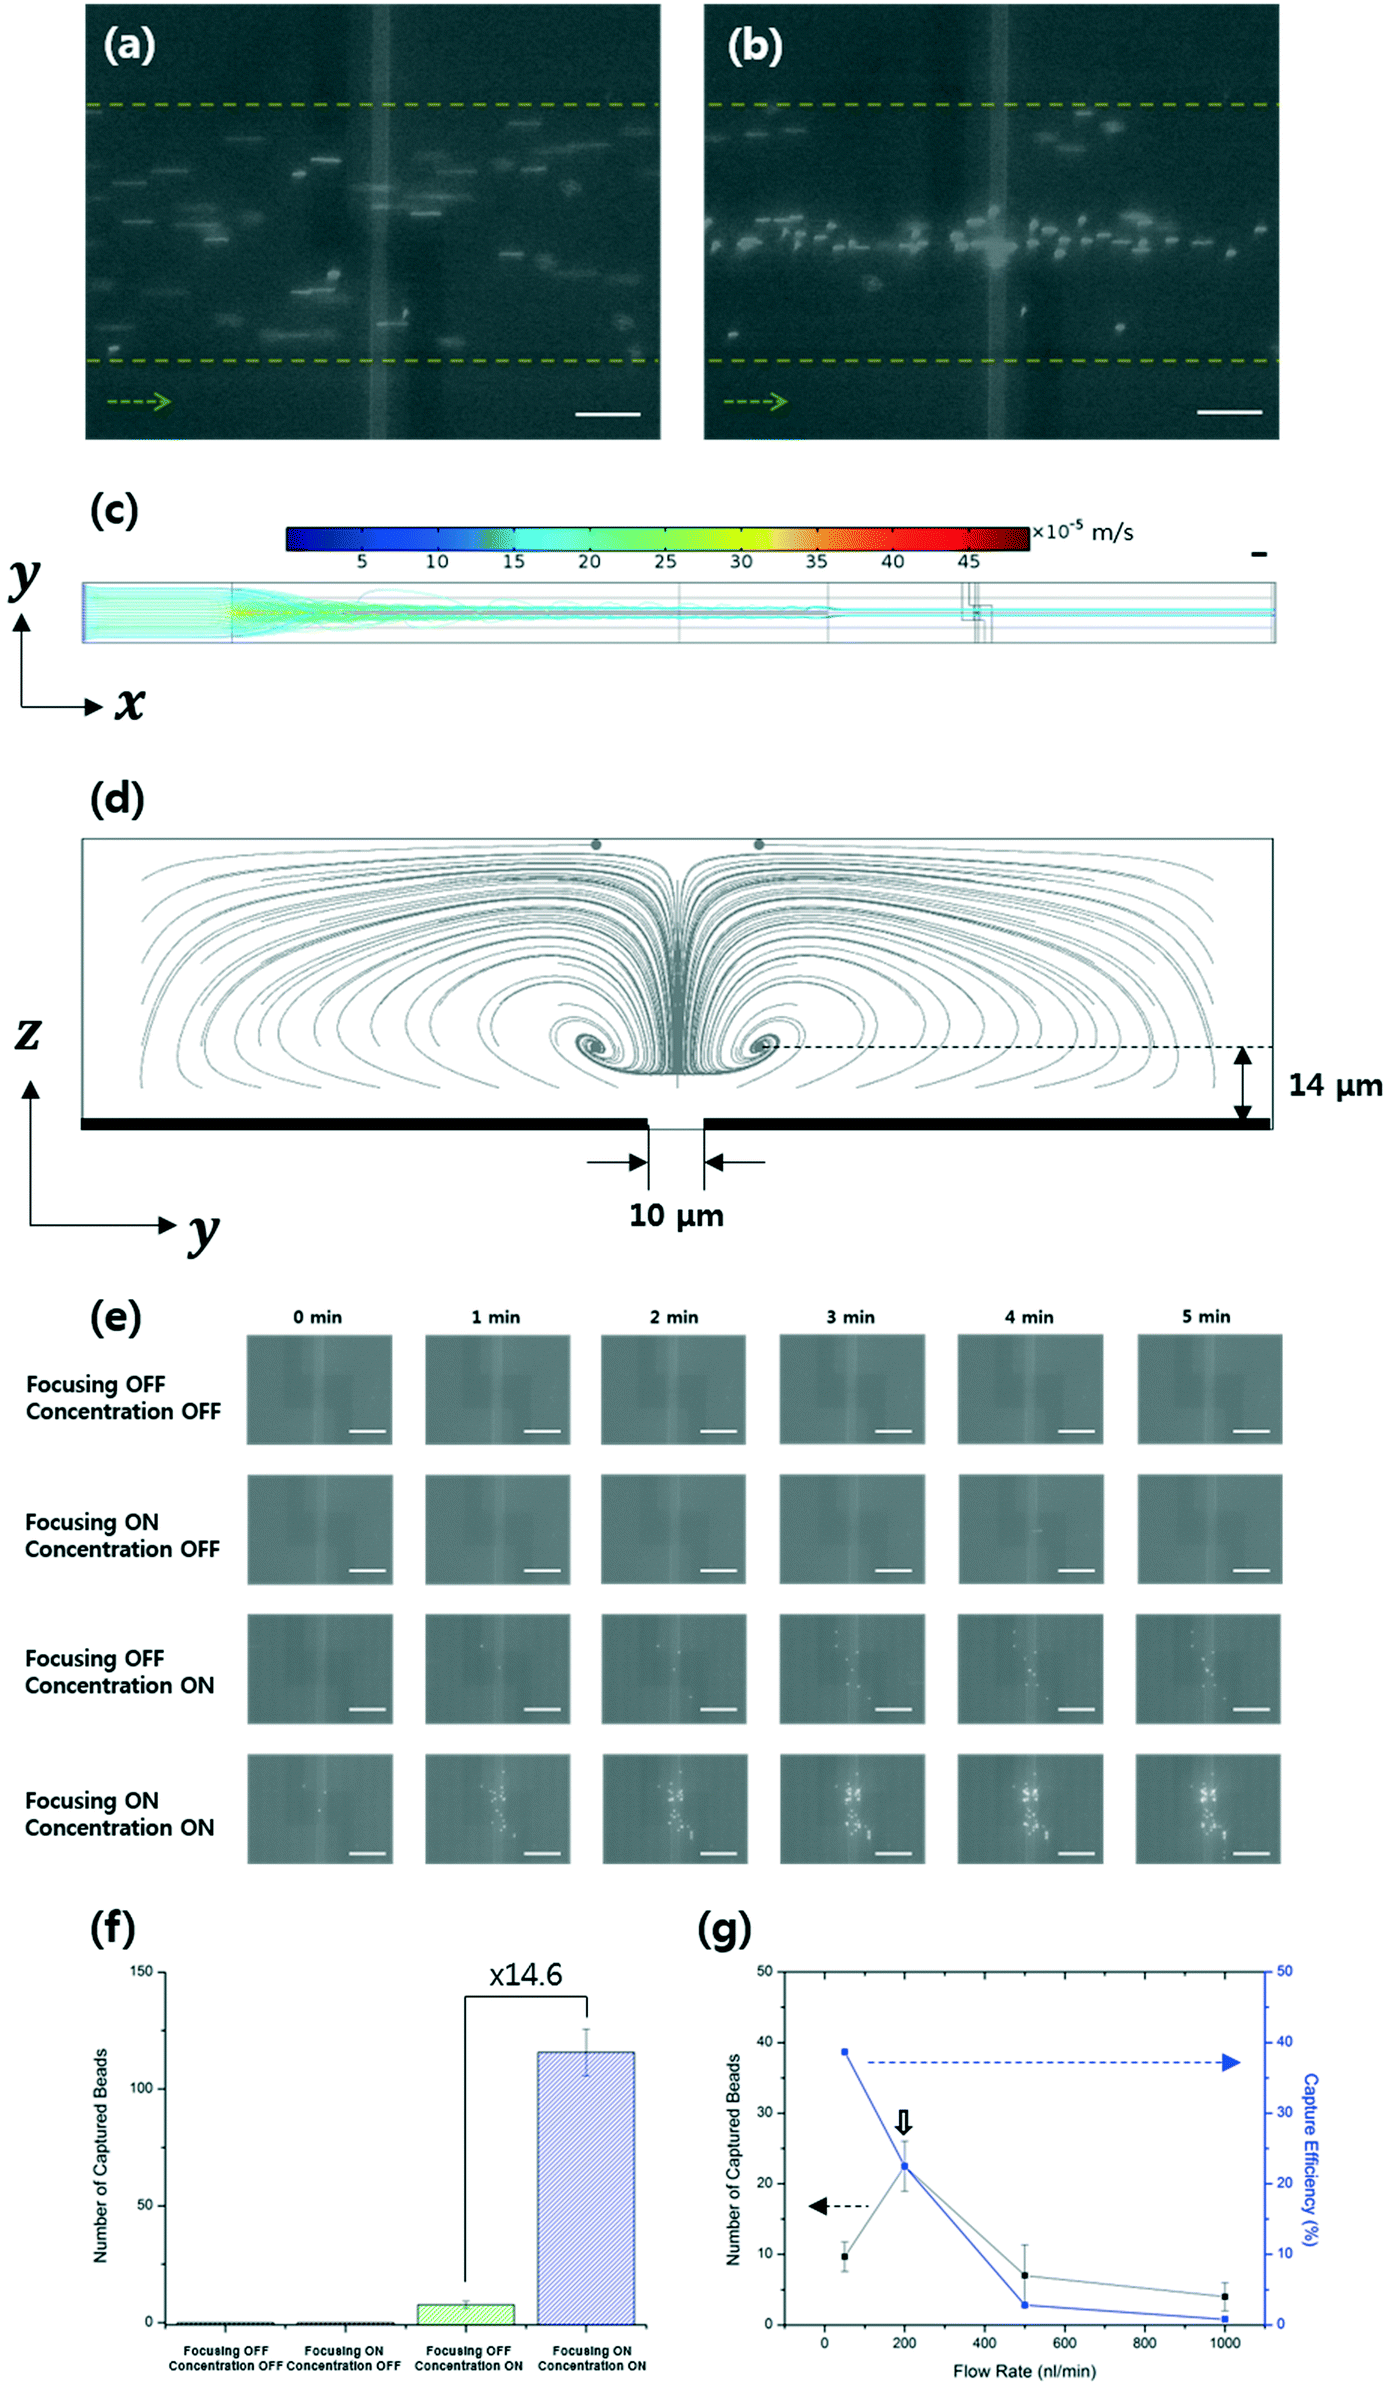 | ||
| Fig. 4 Fluorescence images of 380-nm-diameter polystyrene beads flowing over the detection electrodes (a) without and (b) with EHD focusing (1500 Hz, 1 Vpp) at a flow rate of 83.3 nL min−1 and a number concentration of 1 × 10⁷ particles per mL. The yellow dashed lines and green arrows indicate the side walls of the microchannels and the flow direction, respectively. Calculated trajectories of the 380 nm-diameter beads with EHD focusing; (c) top view where the color represents the speeds of the beads, and (d) cross-sectional view of the detection area where the black bold lines on the bottom show the focusing electrodes. (e) Beads captured between the detection electrodes after biasing the focusing and detection electrodes with different electrical signals, for a flow rate of 200 nL min−1. (f) Number of beads captured in an area (20 × 50 μm2) between the two detection electrodes after biasing with different electrical signals for 5 min. (g) Measured number of captured beads for 1 min and capture efficiencies with different flow rates at a fixed number concentration of 5 × 10⁵ particles per mL. The white and black scale bars in (a)–(c) and (e) represent 50 μm. | ||
Both the number of captured beads and the corresponding capture efficiencies were analyzed (Fig. 4g) with respect to the flow rate, and the efficiency is defined as the number of beads captured in the detection area divided by the number of incoming beads. The beads were mostly captured at a flow rate of 200 nL min−1 (at an incoming number rate of 100 particles per min) and a flow velocity of 340 μm s−1. Under these conditions, the capture efficiency was approximately 23%. This is in contrast with an efficiency of ∼0.1% for electrode-deposited cantilever sensors in a microfluidic device,8 and efficiencies for electrokinetic capture in a narrow detection area have been rarely reported.
3.2 Quantification of bacteria via EHD focusing, DEP concentration, and electrical measurement
The I–V curves measured after each functionalization step of the sensors showed ohmic contacts between the SWCNTs and detection electrodes (Fig. S2†). For the biosensing of S. aureus in the microfluidic device, S. aureus particles were focused by the AC EO and nDEP, both of which simultaneously occurred at the same low frequency (9 kHz) (Fig. 3), and the confined bacteria were delivered to the DEP-effective region above the concentration electrodes and captured by pDEP (8 MHz) on the SWCNTs.Fig. 5a shows real-time measurements of S. aureus with different bacterial concentrations (from 102 to 106 CFU mL−1) at the inlet. Before biasing the focusing and concentration electrodes, i.e. less than 0 min in Fig. 5a, the conductance variation was very small with a standard deviation (or noise) of 0.27% (Fig. S4†). The RCC owing to the captured bacteria was measured after turning off both the biases at 10 min for all bacterial concentrations, and the RCC was stabilized around 35 min. The SRC increased with increasing bacterial concentrations (Fig. 5b). That is, bacterial capture induced increases in the electrical conductance through the SWCNTs. In fact, as the surface of bacteria is negatively charged in the 0.01× PBS buffer, the binding of the negatively charged bacteria onto the bio-functionalized SWCNTs induces holes in the p-type semiconductor, resulting in the increase of electrical currents at the fixed source–drain voltages.31,32 The conductance signals measured during the first 10 min bias from 0 min, which was for focusing and bacterial capture, were caused by interference with the electric field of the concentration electrodes.
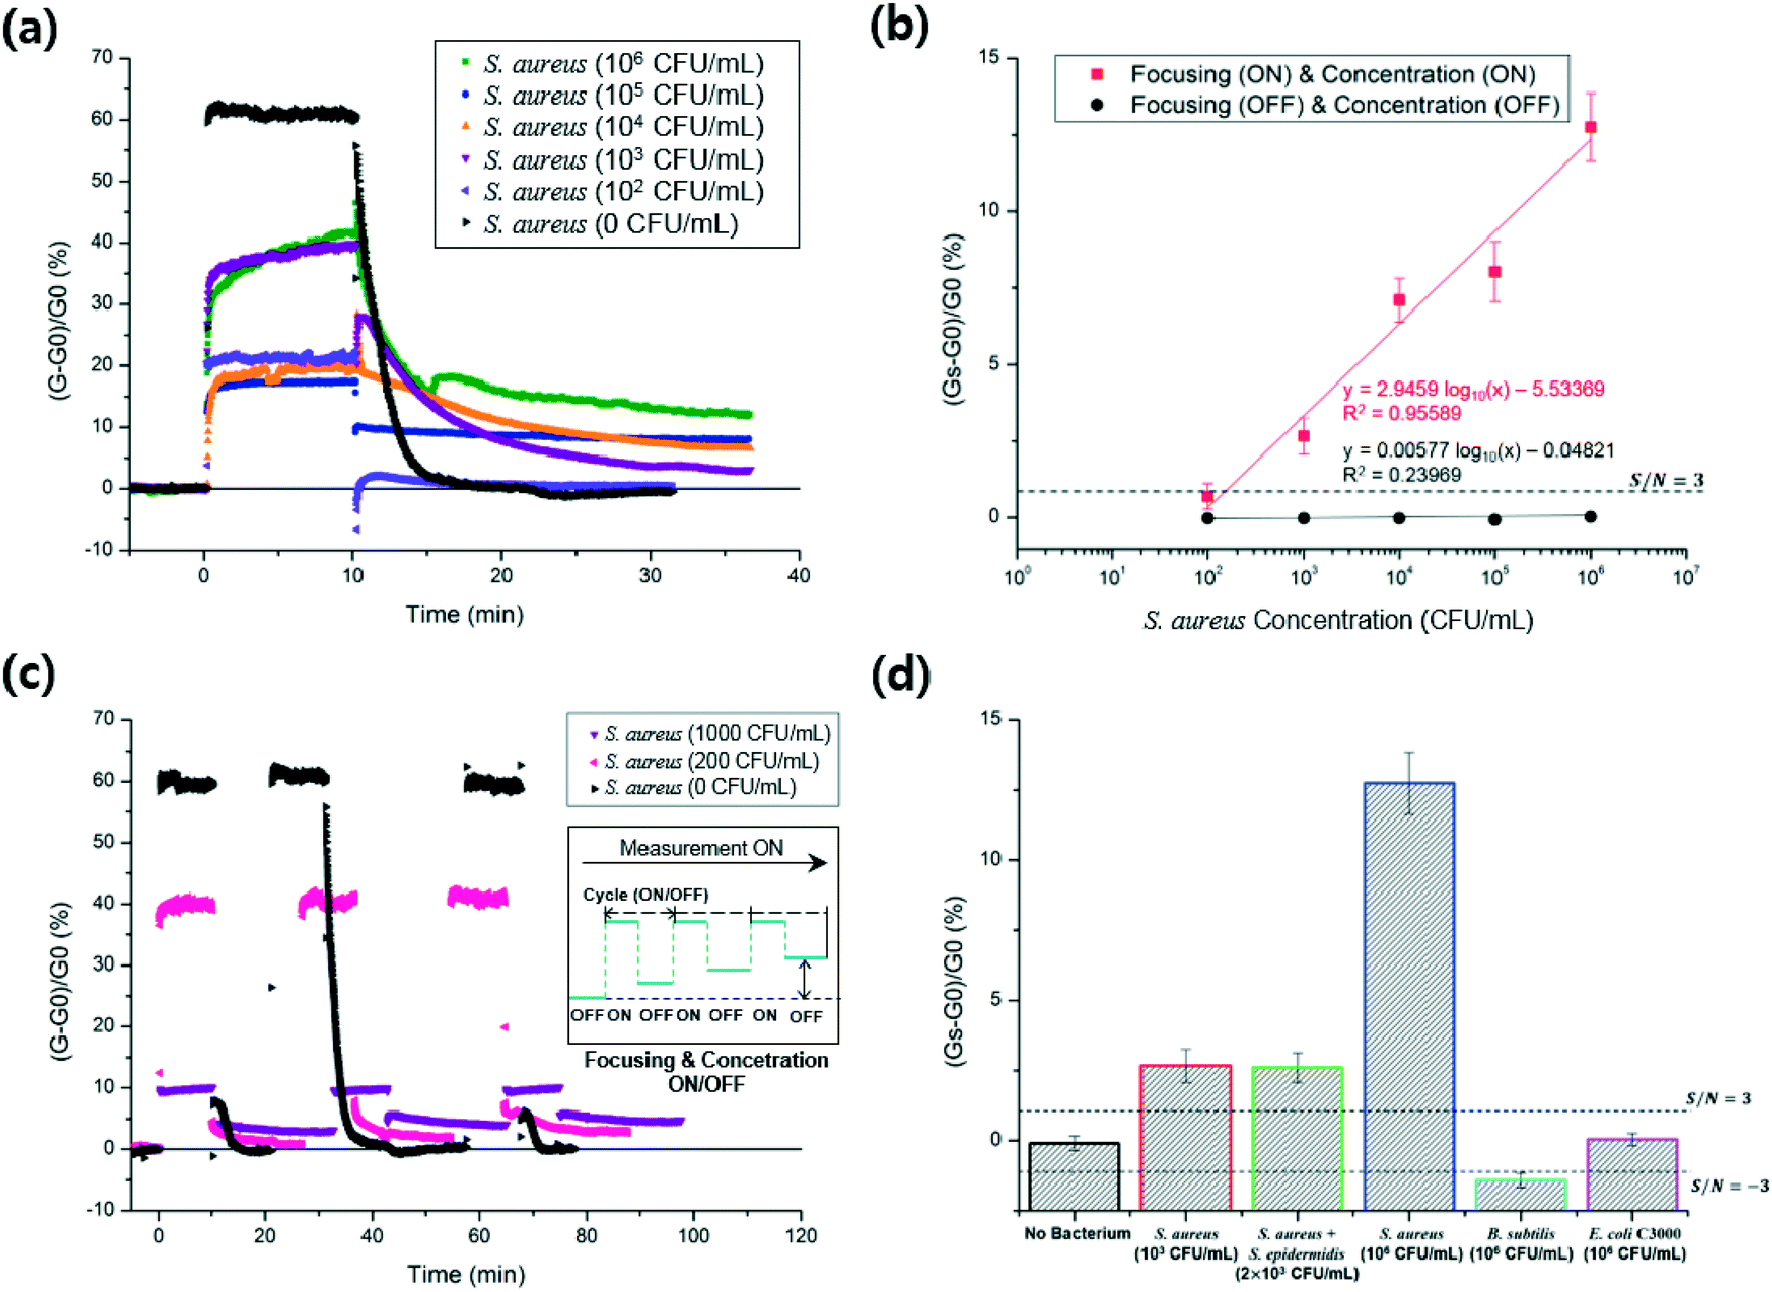 | ||
| Fig. 5 (a) Measurement of the relative electrical conductance change of SWCNTs with different S. aureus concentrations. (b) Stabilized relative electrical conductance change (SRC) as a function of S. aureus concentration. (c) Continuous monitoring of S. aureus at different bacterial concentrations (0, 200, and 1000 CFU mL−1) for three repeated cycles where each cycle consists of turning on both EHD focusing and DEP concentration for 10 min and then turning off while measuring the RCC throughout the cycle. (d) Selectivity tests against S. epidermidis, B. subtilis, and E. coli C3000. S/N refers to the signal-to-noise ratio. | ||
Fig. 5b shows the calibration plot of the microfluidic immunosensor with respect to the S. aureus concentration. The linear relationship (R2 = 95.6%) between the SRCs and the logarithmic S. aureus concentrations was maintained in a range of 200 to 106 CFU mL−1. This linearity did not continue when the bacterial concentration was around 107 CFU mL−1, possibly because of the attachment of too many bacteria beyond the capability of the bio-receptors on the SWCNTs. Interestingly, this characteristic was also reported in DEP-enhanced surface plasmon resonance sensors.7 The limit of detection (LOD) of the present immunosensor was calculated to be 150 CFU mL−1 based on the signal-to-noise (S/N) ratio of three (3-sigma). The SRCs were smaller than the 3-sigma when both the focusing and concentration were not turned on. Further, the measured relative standard deviation for 104 CFU mL−1 was 10.0% (Table S1†). The measurement of bacteria with a wide dynamic range (200 to 106 CFU mL−1) and improved LOD was rendered possible owing to the serial enrichment operation of EHD focusing and DEP concentration, and sensitive detection through the functionalized SWCNTs.
Fig. 5c shows continuous measurements of S. aureus at different bacterial concentrations (0, 200, and 1000 CFU mL−1) at the inlet during three repeated cycles; each cycle consists of turning on the EHD focusing and DEP concentration for 10 min and then turning off while measuring the RCC throughout the cycle. The measured values of SRC were −0.32%, 0.21%, and 0.07% at 0 CFU mL−1, 0.78%, 1.84%, and 2.82% at 200 CFU mL−1, and 3.05%, 4.05%, and 4.68% at 1000 CFU mL−1. The SRCs increased with the number of cycles at 200 and 1000 CFU mL−1. That is, S. aureus in the solution was continuously captured with the number of cycles until the bio-functionalized SWCNTs were spatially filled with the bacteria.
Fig. 5d shows the selectivity test against a mixture of S. aureus and S. epidermidis, E. coli C3000, and B. subtilis. A bacterial mixture (2 × 10³ CFU mL−1, 1:1 ratio) of S. aureus and S. epidermidis showed SRCs similar to that of pure S. aureus (103 CFU mL−1). Each of the B. subtilis (106 CFU mL−1) and E. coli C3000 (106 CFU mL−1) showed SRCs smaller than the 3-sigma. Most incoming E. coli and S. epidermidis were possibly attached to the focusing electrodes by pDEP with 9 kHz signals, whereas much less losses of S. aureus occurred by nDEP during focusing (Fig. 3).33–35
3.3 Additional sensor selectivity based on antigen–antibody affinity
Although the present EHD focusing can offer a great amount of selectivity to the sensors if the dielectrophoretic properties, such as the CM factors, of the bacteria to be quantified are known, this may not work if a mixture of two or more bacteria show similar dielectrophoretic behaviors. For example, although the optimal frequency for capture of S. aureus (target) is 8 MHz (Fig. 3), this frequency is also good for capturing E. coli C3000 (non-target), which is a risky factor to increase the non-specific binding of non-target bacteria on the bio-receptors. Therefore, we tested whether the present microfluidic immunosensor can prevent non-specific binding owing to pDEP in the case where the electrokinetic separation of bacteria does not work sufficiently because of similar dielectrophoretic characteristics. In this regard, we turned off the EHD focusing in the experiment.Both S. aureus and E. coli C3000 were captured on the SWCNTs coated with S. aureus antibodies when the concentration electrodes (10 Vpp, 8 MHz) alone were activated (Fig. 6), where an upright fluorescence microscope (Eclipse 80i; Nikon, Japan) with a CCD camera (CoolSNAP™ DYNO; Photometrics®, USA) was used to obtain images and videos with an exposure time of 200 ms. When the electrodes were deactivated, most of the captured S. aureus was still bound on the SWCNTs, whereas all the captured E. coli C3000 flowed away without non-specific binding (see ESI† Video). The pDEP can usually increase non-specific binding of particles on the surface, but this was prevented owing to the blocking buffer treatment (SuperBlock T20) and continuous channel flow. A few studies on avoiding electrokinetics-related non-specific binding have been reported; harsh electrothermal fluid motion was intentionally induced to remove non-specific binding in an assay,37 or blocking agent treatment and secondary antibody amplification were applied after the DEP capture of different bacteria.7 This FET immunosensor thus enabled an increase in sensitivity due to EHD focusing and pDEP concentration while maintaining a high level of selectivity against various non-target microorganisms, and high selectivity and low cross reactivity are highly required to address fundamental challenges in FET-based biosensors.11
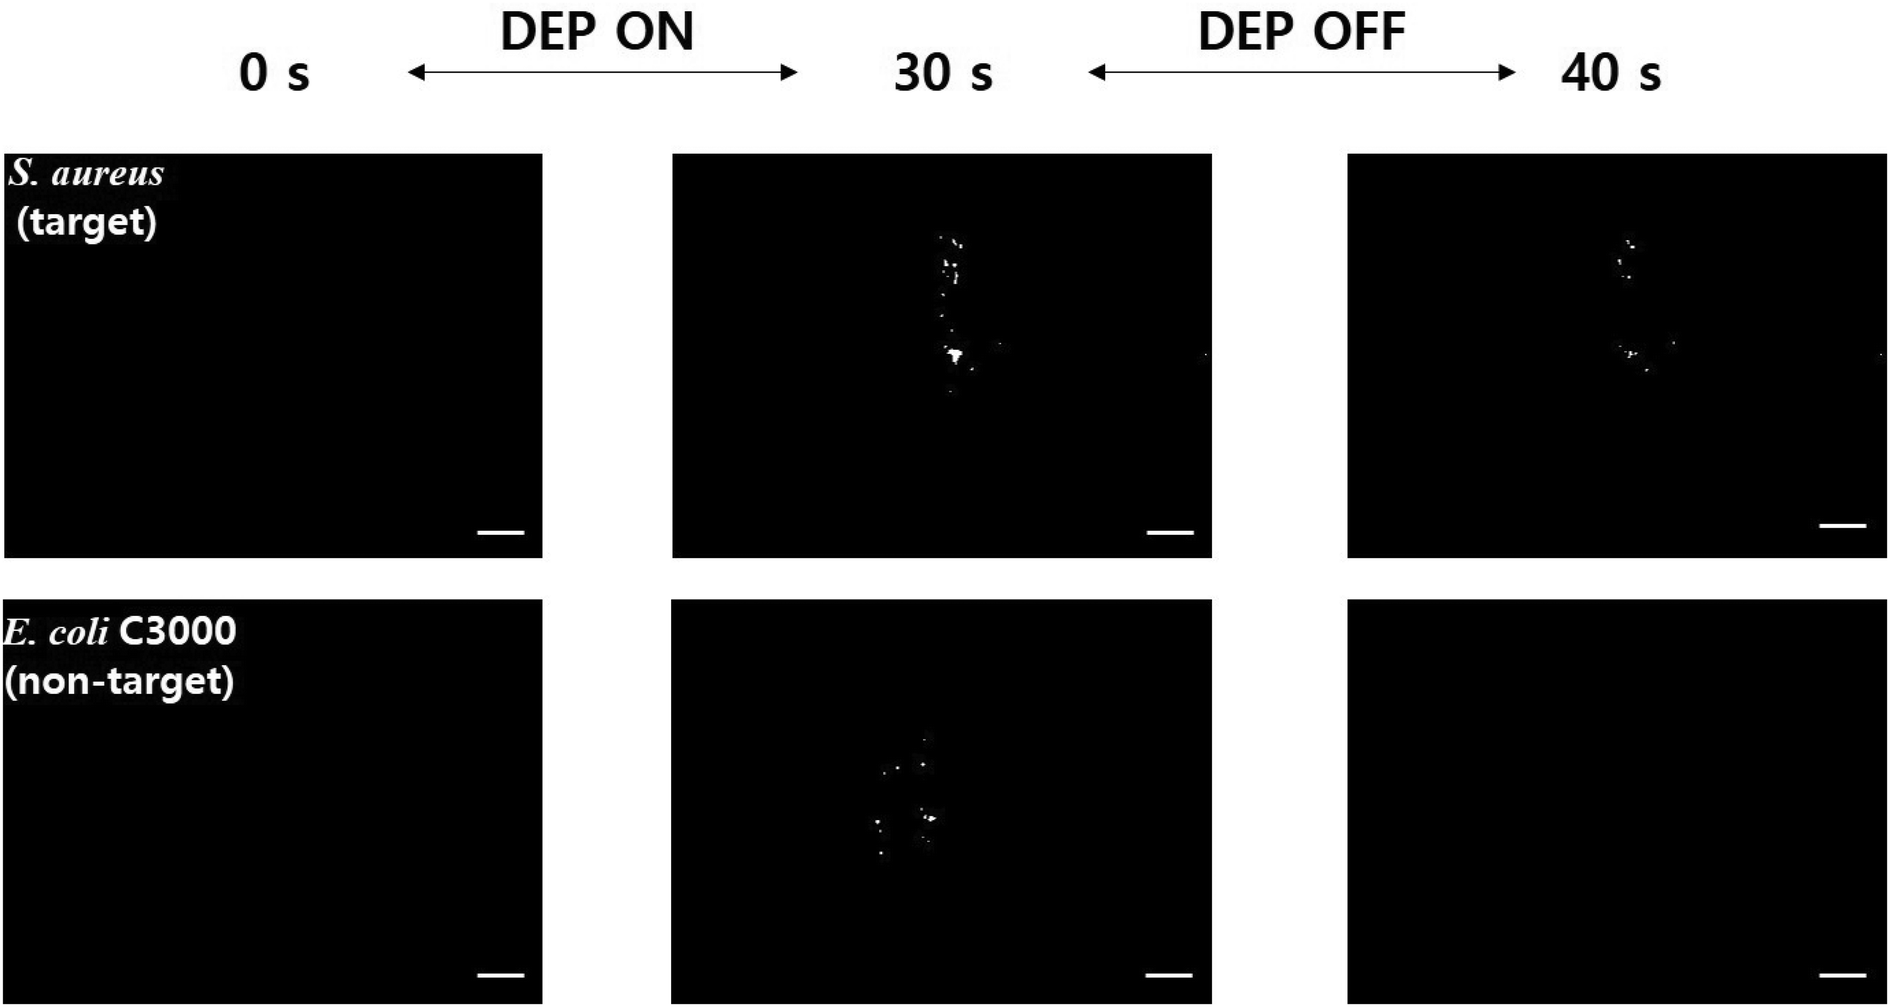 | ||
| Fig. 6 Fluorescence images of S. aureus (target) and E. coli C3000 (non-target) when the concentration electrodes (10 Vpp, 8 MHz) alone were activated and then deactivated. The concentration of each bacterial sample was 107 CFU mL−1, and the scale bars represent 50 μm. When the electrodes were deactivated, most of the captured target (S. aureus) was still bound on the SWCNTs, whereas all the captured non-target (E. coli C3000) flowed away without non-specific binding. | ||
This electrokinetics-enhanced microfluidic sensor can be used for detection of several other target analytes although there is a limitation on media conductivity and their DEP behavior needs to be known. Once it is revealed, the main parameters, AC frequency and media conductivity, can be adjusted for a particular target since both EO and nDEP should be generated for EHD focusing, and pDEP should be generated for concentration. For example, EO and nDEP occurred simultaneously at 9 kHz on the focusing electrodes for S. aureus detection in the present study; however, it may be difficult to avoid attachment to the electrodes during focusing in the case of S. epidermidis because pDEP can occur for this bacterium. In this case, an AC signal above 40 MHz can be superimposed with the 9 kHz (EO + pDEP) signal to generate stronger nDEP, resulting in EO and nDEP, which was also observed when collecting 380 nm-diameter beads in this study. Moreover, the temperature of a medium can increase significantly because of Joule heating in the case of high conductivity media. For example, the maximal temperature rise of the medium owing to Joule heating increased from 0.07 °C for 0.01× PBS (the present study) to 6.24 °C for 1× PBS (Fig. S6†).
4. Conclusion
We present an integrated microfluidic immunosensor platform with serial EHD focusing, DEP concentration, and FET-based electrical detection through bio-functionalized SWCNTs for continuous monitoring of flowing label-free S. aureus. The EHD focusing incorporated a combination of AC EO and nDEP to reduce transportation losses to the channel surfaces via signal superimposition. In the feasibility test, more 380 nm-diameter polystyrene beads (approximately 15 times) were concentrated in the detection area with EHD focusing than without focusing, thereby showing the potential for detecting large-sized viruses with the proposed microfluidic immunosensor platform. Quantification of label-free S. aureus in 0.01× PBS with similar electrical properties to tap water was also performed with this platform, showing high linearity (R2 = 0.956), an enhanced LOD of 150 CFU mL−1, a capture and detection time of 35 min, and a high level of specificity to S. aureus against S. epidermidis, E. coli C3000, and B. subtilis through electrical (EHD focusing and DEP concentration) manipulation and biological (antibody and blocking agent) interaction.Author contributions
C. H. conducted the experiments, characterized the performances, and analyzed the data. J. J. supervised the study, reviewed the manuscript, and discussed the results.Conflicts of interest
The authors declare no competing interests.Acknowledgements
This work was supported by the National Research Foundation of Korea (NRF) grant (2020R1A2C1011583) and by the ITRC (Information Technology Research Center) support program (IITP-2020-2017-0-01635) supervised by the IITP (Institute for Information & communications Technology Promotion), both of which were funded by the Korea government (Ministry of Science and ICT). This work was also supported by the Basic Science Research Program through the NRF funded by the Ministry of Education (2020R1A6A1A03040570). The authors would also like to acknowledge and thank the staff at the UNIST Central Research Facilities (UCRF) for their help in this study.References
- M. Kim, T. Jung, Y. Kim, C. Lee, K. Woo, J. H. Seol, J. H. Yang and S. Yang, Biosens. Bioelectron., 2015, 74, 1011–1015 CrossRef CAS.
- A. Salari and M. Thompson, Sens. Actuators, B, 2018, 255, 3601–3615 CrossRef CAS.
- C.-H. Han, S. Y. Woo, J. Bhardwaj, A. Sharma and J. Jang, Sci. Rep., 2018, 8, 14942 CrossRef.
- J. R. Gong, Small, 2010, 6, 967–973 CrossRef CAS.
- K. Freedman, L. M. Otto, A. P. Ivanov, A. Barik, S.-H. Oh and J. B. Edel, Nat. Commun., 2015, 7, 10217 CrossRef.
- A. Sharma, C.-H. Han and J. Jang, Biosens. Bioelectron., 2016, 82, 78–84 CrossRef CAS.
- D. D. Galvan, V. Parekh, E. Liu, E.-L. Liu and Q. Yu, Anal. Chem., 2018, 90, 14635–14642 CrossRef CAS.
- S. Leahy and Y. Lai, Sens. Actuators, B, 2017, 238, 292–297 CrossRef CAS.
- S. Leahy and Y. Lai, Sens. Actuators, B, 2017, 246, 1011–1016 CrossRef CAS.
- W. C. Lee, H. Le, J. Lim and Y. J. Park, Appl. Phys. Lett., 2016, 109, 223701 CrossRef.
- L. Syedmoradi, A. Ahmadi, M. L. Norton and K. Omidfar, Microchim. Acta, 2019, 186, 739 CrossRef CAS.
- M. Lee, K. Y. Baik, M. Noah, Y.-K. Kwon, J.-O. Lee and S. Hong, Lab Chip, 2009, 9, 2267–2280 RSC.
- J.-S. Park, S.-H. Song and H.-I. Jung, Lab Chip, 2009, 9, 939–948 RSC.
- J. Cruz, T. Graells, M. Wallden and K. Hjort, Lab Chip, 2019, 19, 1257 RSC.
- Y. Ren, J. Liu, W. Liu, Q. Lang, Y. Tao, Q. Hu, L. Hou and H. Jiang, Lab Chip, 2016, 16, 2803 RSC.
- Y. Ai, C. K. Sanders and B. L. Marrone, Anal. Chem., 2013, 85, 9126–9134 CrossRef CAS.
- X. Ding, P. Li, S.-C. Lin, Z. S. Stratton, N. Nama, F. Guo, D. Slotcavage, X. Mao, J. Shi, F. Costanzo and T. J. Huang, Lab Chip, 2013, 13, 3626 RSC.
- J. Liu, I. Jasim, A. Abdullah, Z. Shen, L. Zhao, M. El-Dweik, S. Zhang and M. Almasri, Sci. Rep., 2018, 8, 16109 CrossRef.
- N. Gadish and J. Voldman, Anal. Chem., 2006, 78, 7870–7876 CrossRef CAS.
- L. Yang and R. Bashir, Biotechnol. Adv., 2008, 26, 135–150 CrossRef CAS.
- C. Paez-Aviles, E. Juanola-Feliu, J. Punter-Villagrasa, B. del Moral Zqamora, A. Homs-Corbera, J. Colomer-Farrarons, P. L. Miribel-Catala and J. Samitier, Sensors, 2016, 16, 1514 CrossRef.
- J. Suehiro, M. Shutou, T. Hatano and M. Hara, Sens. Actuators, B, 2003, 96, 144–151 CrossRef CAS.
- Q. Chen and Y. J. Yuan, RSC Adv., 2019, 9, 4963 RSC.
- B. H. Lapizco-Encinas, B. A. Simmons, E. B. Cummings and Y. Fintschenko, Electrophoresis, 2004, 25, 1695–1704 CrossRef CAS.
- S. Mao, K. Yu, J. Chang, D. A. Steeber, L. E. Ocola and J. Chen, Sci. Rep., 2013, 3, 1696 CrossRef.
- H.-Y. Lin, C.-H. Huang, W.-H. Hsieh, L.-H. Liu, Y.-C. Lin, C.-C. Chu, S.-T. Wang, I.-O. Kuo, L.-K. Chau and C.-Y. Yang, Small, 2014, 10(22), 4700–4710 CrossRef CAS.
- C.-H. Han, H. W. Ha and J. Jang, Lab Chip, 2019, 19, 1772–1782 RSC.
- L. Yang, P. P. Banada, M. R. Chatni, K. S. Lim, A. K. Bhunia, M. Ladisch and R. Bashir, Lab Chip, 2006, 6, 806–890 Search PubMed.
- D. Wasik, A. Mulchandani and M. V. Yates, Anal. Chem., 2018, 90, 679–684 CrossRef CAS.
- S. Park, Y. Zhang, T.-H. Wang and S. Yang, Lab Chip, 2011, 11, 2893 RSC.
- W. Jiang, A. Saxena, B. Song, B. B. Ward, T. J. Beveridge and S. C. B. Myneni, Langmuir, 2004, 20, 11433–11442 CrossRef CAS.
- G. Wu, Z. Dai, X. Tang, Z. Lin, P. W. Lo, M. Meyyappan and K. W. C. Lai, Adv. Healthcare Mater., 2017, 1700736 CrossRef.
- K. Asami, T. Hanai and N. Koizumi, Biophys. J., 1980, 31, 215–228 CrossRef CAS.
- J. Johari, Y. Huebner, J. C. Hull, J. W. Dale and M. P. Hughes, Phys. Med. Biol., 2003, 48, N193–N198 CrossRef CAS.
- A. Sanchis, A. P. Brown, M. Sancho, G. Martinez, J. L. Sebastian, S. Munoz and J. M. Miranda, Bioelectromagnetics, 2007, 28, 393–401 CrossRef CAS.
- Q. Chen, Z. Cao and Y. J. Yuan, RSC Adv., 2020, 10, 2598 RSC.
- T. Liu, M. L. Y. Sin, J. D. Pyne, V. Gau, J. C. Liao and P. K. Wong, Nanomedicine, 2014, 10, 159–166 CrossRef CAS.
- P. Sabounchi, A. M. Morales, P. Ponce, L. P. Lee, B. A. Simmons and R. V. Davalos, Biomed. Microdevices, 2008, 10, 661–670 CrossRef CAS.
- R. Hamada, H. Takayama, Y. Shonishi, L. Mao, M. Nakano and J. Suehiro, Sens. Actuators, B, 2013, 181, 439–445 CrossRef CAS.
- S. G. Dastider, S. Barizuddin, M. Dweik and M. Almasri, RSC Adv., 2013, 3, 26297 RSC.
- N. Couniot, L. A. Francis and D. Flandre, Lab Chip, 2015, 15, 3183 RSC.
- B. J. Sanghavi, W. Varhue, A. Rohani, K.-T. Liao, L. A. L. Bazydlo, C.-F. Chou and N. S. Swami, Lab Chip, 2015, 15, 4563 RSC.
- N. Mavrogiannis, F. Crivellari and Z. R. Gagnon, Biosens. Bioelectron., 2016, 77, 790–798 CrossRef CAS.
- E. Iswardy, T.-C. Tsai, I.-F. Cheng, T.-C. Ho, G. C. Perng and H.-C. Chang, Biosens. Bioelectron., 2017, 95, 174–180 CrossRef CAS.
Footnote |
| † Electronic supplementary information (ESI) available. See DOI: 10.1039/d0lc00783h |
| This journal is © The Royal Society of Chemistry 2021 |