 Open Access Article
Laboratory-scale in situ X-ray absorption spectroscopy of a palladium catalyst on a compact inverse-Compton scattering X-ray beamline†
Juanjuan
Huang‡
 *a,
Fuli
Deng‡
b,
Benedikt
Günther
a,
Klaus
Achterhold
 a,
Yue
Liu
 bc,
Andreas
Jentys
 *b,
Johannes A.
Lercher
b,
Martin
Dierolf
 a and
Franz
Pfeiffer
ade
aChair of Biomedical Physics, Department of Physics, School of Natural Sciences and Munich Institute of Biomedical Engineering, Technical University of Munich, 85748 Garching, Germany. E-mail: Juanjuan.Huang@tum.de
bDepartment of Chemistry and Catalysis Research Center, Technical University of Munich, 84747 Garching, Germany. E-mail: Jentys@tum.de
cShanghai Key Laboratory of Green Chemistry and Chemical Processes, School of Chemistry and Molecular Engineering, East China Normal University, 200062 Shanghai, PR China
dDepartment of Diagnostic and Interventional Radiology, Klinikum Rechts der Isar, Technical University of Munich, 81675 Munich, Germany
eInstitute for Advanced Study, Technical University of Munich, 85748 Garching, Germany
First published on 11th October 2021
Abstract
X-ray absorption spectroscopy (XAS) is one of the most important techniques used for catalyst characterization, and is often conducted under in situ conditions. Such experiments are typically carried out at synchrotrons, despite the significant improvements in laboratory-based XAS systems in recent years. The limited spectral flux density of X-ray tubes restricts these setups to ex situ or in situ experiments conducted over a large time scale, especially for X-ray energies above 15 keV. In this paper, we present an in situ experiment performed on a palladium-based catalyst at the Munich Compact Light Source (MuCLS), a compact synchrotron facility based on inverse Compton X-ray scattering (ICS). Its brilliant, low-divergence, energy-tuneable X-ray beam makes such a compact facility well suited for XAS techniques, especially with in situ experiments. In this study, we investigated a hydrogen-pretreated Pd/C catalyst, which significantly improves the catalytic decarboxylation activity compared to a bare Pd(0)/C catalyst. We measured a series of X-ray absorption near-edge structures (XANES) at the Pd K-edge (24.4 keV), with a time resolution of <5 min per spectrum. The spectral quality achieved is comparable to spectra obtained from synchrotron measurements. The results infer that the formation of α-phase palladium hydride may be the reason for the enhanced performance of the hydrogen-pretreated Pd/C catalyst.
Introduction
Synchrotron-based X-ray spectroscopy techniques enable in-depth characterization of materials and chemical systems and are employed in a wide range of technological and research fields. X-ray absorption spectroscopy (XAS) is one of the most commonly used synchrotron techniques, as the measurements supply element-specific information. XAS is divided into two types: X-ray absorption near-edge structure (XANES) and extended X-ray absorption fine structure (EXAFS).1,2 Both types provide valuable and complementary information on the electronic and geometrical structure of materials.Since synchrotron radiation first came into use in the 1970s,3 XAS has undergone significant technical and theoretical evolution. Although the first XAS spectra were measured more than 100 years ago on in-house systems, most XAS measurements nowadays are conducted at synchrotrons, due to the high quality and brilliance of the X-rays. However, the limited ability to access such large facilities has inhibited XAS from developing into a routine characterization technique. Therefore, great efforts and improvements have been made in the development of laboratory-based XAS setups.
In contrast to synchrotron facilities, laboratory XAS systems allow for regular on-site characterization of specimens, which is advantageous, especially in an industrial environment. Moreover, a laboratory XAS system removes the need to acquire beamtimes at synchrotrons, which speeds up the pace of academic research. Most of these laboratory setups employ X-ray tubes, since they are commercially available, inexpensive, and compact. Modern laboratory setups are either scanning-type systems that use a Rowland focusing geometry4,5 or dispersive-type systems using, e.g., von Hamos geometry.6–9 Several commercial prototypes such as the ones developed by easyXAFS, LLC and Sigray, Inc. have even become available in recent years. Details of recent laboratory XAS developments can be found in the recent reviews by Zimmermann et al.10 and Malzer et al.11
A drawback of X-ray sources in XAS is the limited spectral flux density of the bremsstrahlung. This intrinsic limitation restricts such setups to mainly ex situ experiments or in situ experiments over a large time scale. For example, a recent in situ laboratory-based XANES experiment was reported by José G. Moya-Cancino et al.,12 who studied the slow dynamics (over several tens or hundreds of hours) of a solid Co/TiO2 Fischer–Tropsch synthesis catalyst.
However, modern XAS is often conducted in an in situ or in operando environment over a much shorter time scale, which is challenging to achieve with low-brilliance X-ray tubes, especially for X-rays above 15 keV. Hence, compact X-ray sources based on inverse-Compton scattering (ICS) might be a better alternative to X-ray tubes for in situ XAS in the high-energy range. The performance and cost of such ICS sources are between those of conventional X-ray tubes and synchrotrons. Several projects worldwide thus seek to develop such sources.13–17 The Munich Compact Light Source (MuCLS) is one of the already existing ICS facilities and has been in operation since 2015. The X-ray properties of the MuCLS (photon flux of >1010 photons per s in <5% bandwidth, energy tunability, low divergence, and relatively small source size) make it well-suited to XAS techniques. We previously reported a first proof-of-principle XAS of the element silver (Ag) at the MuCLS with synchrotron-comparable quality.18
In situ XAS is a powerful characterization method used to investigate the mechanism of catalytic processes. Palladium (Pd) is one of the most versatile catalytic metals and has been widely applied in different reactions such as hydrogenation,19–21 dehydrogenation22 and decarboxylation.23–25 In many of these reactions, the formation of palladium hydride (PdHx) plays a critical role in catalytic performance. XANES is a very effective method of verifying the existence of PdHx,26–29 as the spectral features are directly influenced by the addition of the hydrogen atom.
Here, we conducted an in situ XANES experiment to study the properties of a Pd/C catalyst in the decarboxylation reaction of phenylacetic acid to toluene. In this catalytic reaction, it is observed that H2 pretreatment of the Pd/C catalyst prior to the reaction can significantly enhance the catalytic performance comparing to bare Pd/C catalyst.46 The aim of this experiment is to identify the active Pd species of Pd/C while ramping up the temperature towards a reaction level. We measured a series of XANES spectra at Pd K-edge (24.4 keV) at a time resolution of less than 5 min per scan. A dynamic palladium hydride phase-transfer was observed during the temperature ramping process. The excellent spectral quality and good acquisition efficiency unravel the great potential of the setup at the ICS facility for in situ applications, especially at high X-ray energies. Instrumentation, data acquisition, and advantages of XAS at ICS sources are presented in detail.
Experimental
Experimental setup at the MuCLS
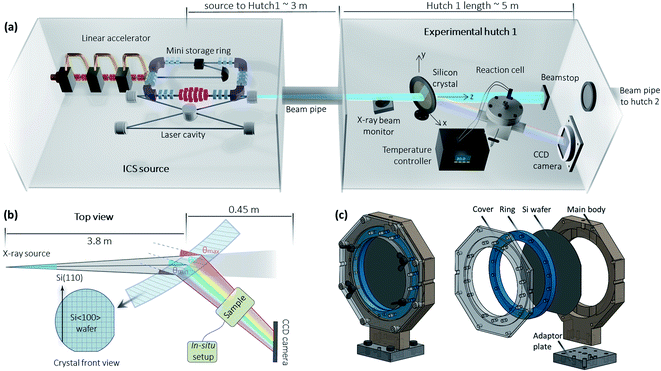
Fig. 1 shows the MuCLS facility, which is a multipurpose X-ray beamline that utilizes an ICS source. The ICS source was manufactured by Lyncean Technologies Inc., Fremont, USA, while the two endstations (Hutch 1 and Hutch 2) were designed at the Technical University of Munich (TUM). X-rays are generated by the process of inverse Compton scattering (ICS), in which infrared laser pulses collide with MeV electrons head-on. The X-ray energy can be tuned by changing electron energy and is freely adjustable from 15 keV to 35 keV. X-ray properties such as flux, source size, and source positions are monitored and stabilized using a specifically designed X-ray beam monitor (XBM) upstream, which cuts off a small portion of the beam for X-ray diagnostics.30 More information about the MuCLS facility can be found in the ref. 31 and 32.The MuCLS has several specific properties that make it advantageous for XAS techniques: a narrow spectrum with a bandwidth of 3–5%, tunable energy, relatively high flux, and a relatively small source size (∼50 μm, σ-value) and divergence (∼4 mrad, full angle). Routine XAS, unlike other photon-demanding spectroscopy techniques such as photon-in/photon-out spectroscopy,33 does not require the full power of a synchrotron. Hence, such a laboratory-scale facility, which fills the gap between conventional X-ray tubes and synchrotrons, is very well suited for XAS techniques. For the Pd K-edge (24.4 keV) XANES measurement, the source was tuned to its 25 keV energy configuration. The total flux of the entire X-ray beam entering Hutch 1 at the time of the experiment was ∼1.9 × 10¹⁰ photons per s with a bandwidth of ∼4%.
A specific dispersive setup based on a Laue geometry34,35 is adopted for the XAS, illustrated in Fig. 1b. The XAS setup consists of three parts. The first component is a silicon crystal. In this case, a slightly bent Si〈100〉 crystal wafer (200 μm thick, Ø = 100 mm) with a bending radius of ∼14 m was used. The crystal is positioned in a 3D printed home-built crystal holder (see Fig. 1c), which enables the horizontal crystal curvature to be adjusted by applying horizontal pressure to the two edges. The bending radius is estimated from the difference between the theoretical energy range of a flat crystal and the experimental energy range of the bent crystal.18 This slight bending curvature is utilized to adjust the X-ray beamsize, energy spread and energy resolution as needed for the experiment.
The XAS setup is currently implemented in Hutch 1, which is located at a distance of ∼3 m to the source and has a total length of ∼5 m. The CCD camera is positioned at a distance of 0.45 m behind the crystal, which leaves plenty of operating space for the sample and its in situ cell in-between. This distance can be increased further depending on the requirements of the experiment. The large experimental hutch and abundant operating space facilitate the implementation of an in situ environment with relatively big sample cells, which may be challenging for some of the X-ray tube-based XAS setups. The crystal is mounted on a stage, which can be aligned in the x, y, z-directions and rotated in the x−y plane. The second component is a 2D detector – a XIMEA xiRAY CCD camera (model MH110XC-KK-FA, XIMEA GmbH, Münster, Germany) with a Gd2O2S:Tb scintillator. It has a pixel size of 9 μm and a field-of-view (FOV) of 24 mm × 36 mm (horizontal × vertical). The third component is the sample. For the in situ experiments, the sample is placed in a home-built reaction cell (see Fig. 2), which is connected to a temperature controller.
The crystal is rotated by ∼34° relative to the X-ray beam axis, taking into account the Si(311) asymmetry angle and the Bragg angle. In dispersive XAS setups at synchrotrons,36 samples are generally positioned at the X-ray focus spot that is generated by bending the crystal. In many laboratory XAS setups,6,37 samples are placed very close to the X-ray exit window of the tube so as to create a small X-ray spot size on the sample. Our setup uses an unfocused geometry,38 in which the sample is placed in close proximity to the Laue crystal. As a result, the X-ray beam impinging on the sample is relatively large; for example, the flat field (I0) shown in Fig. 3 covers a maximum of about 900 pixels × 2100 pixels (horizontal × vertical), or about 0.8 cm × 1.9 cm (horizontal × vertical). Since different energies penetrate through different parts of the sample, an additional correction step is needed to account for sample inhomogeneities. Nevertheless, the setup is straightforward to implement, as the crystal can be easily aligned and removed. On this versatile beamline, this enables rapid switching between different setups for other non-spectroscopy applications such as X-ray imaging techniques.39–42 Since no other optics are used, the setup is relatively efficient. Additionally, the absorption of air is relatively low for the X-ray energy employed in the experiments. Consequently, neither vacuum nor helium systems is used in these XAS measurements.
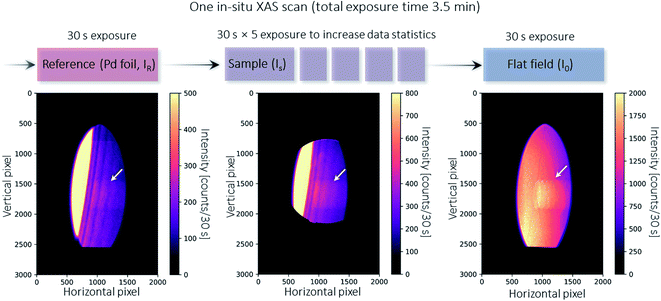 | ||
| Fig. 3 Illustration of a single XAS scan during in situ temperature ramping. At the beginning of each scan, a standard reference (Pd foil, denoted as IR) is taken for energy calibration and correction of temporal uncertainties between different scans (see Fig. 4). The sample is then moved in, and five exposures are acquired and averaged to increase the data statistics (denoted as IS). At the end of the scan, the sample is removed to enable a flat field image to be taken. The flat field image is used as I0 to calculate absorption for both the reference foil and the sample. The bottom part of the beam is intercepted by the X-ray beam monitor mentioned above.30 The diffracted X-rays pass through the 3D printed crystal holder. The artifact indicated by the arrow arises from a screw thread hole in the crystal holder but is corrected when calculating the absorption using I0 and IS. | ||
In situ reaction cell
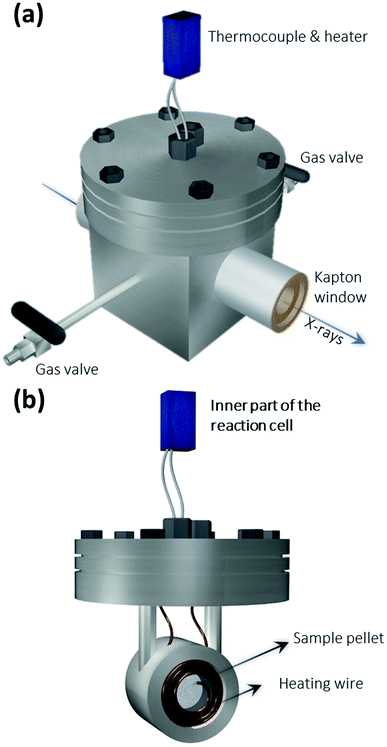
Fig. 2 shows the schematics of the home-built reaction cell used for the in situ XAS measurement, which was developed at the chemistry department of the Technical University of Munich. It has two Kapton windows, which allow X-rays to pass through. There are two gas tubes with valves, which allow gases to be added for the in situ experiments. The Pd/C powder was compressed into a pellet (Ø = 12 mm) and placed inside a small cylindrical holder surrounded by heating wires. The thermocouple and heater are connected to a programmable temperature controller. Thus, the sample cell enables in situ XAS measurement for the Pd/C catalyst under certain reaction temperatures and atmospheres.In situ XAS scans
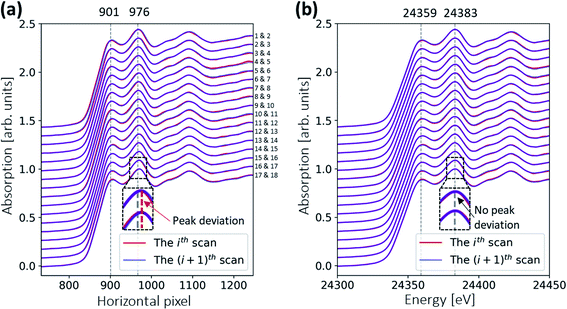
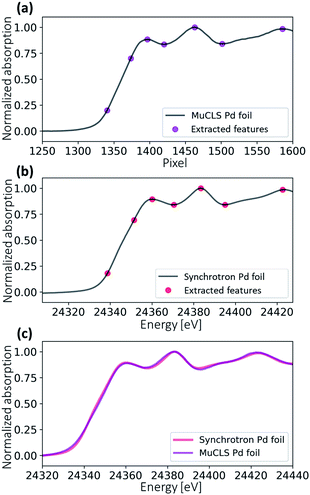
The in situ XAS measurement uses a custom XAS scan macro by the experiment control system SPEC (Certified Scientific Software), as illustrated in Fig. 3. Some drifts in the energy position (see Fig. 4a) are observed during XAS experiments at the MuCLS. This might be due to slight movements in the positions of the source or crystal. For this reason, it is necessary to measure a standard Pd foil at the beginning of each scan, not only to calibrate the energy but also to correct any temporal uncertainties. One XAS scan consists of one exposure of the Pd foil, five exposures of the sample (IS) to increase the statistics, and one exposure of a flat field (I0). Each exposure takes 30 s, resulting in a total exposure time of 3.5 min. Including motor movements and other overheads, the total acquisition time of the scan is 4.3 min. In case a better time resolution might be required to observe the dynamic changes during temperature ramping, five exposures of 30 s are chosen for the sample instead of one long exposure of 150 s.The Pd foil spectra of one particular scan and the following scan should be almost identical to ensure that the sample scan measured in between is valid. A comparison of the ith and the (i + 1)th spectra is shown in Fig. 4. For the uncalibrated spectra, a slight drift over 75 min is observed; for instance, the peak at 976 pixels is slightly shifted. Nevertheless, the two consecutive scans are almost identical, meaning that there is no energy drift for the sample spectra measured in between. The details of the energy calibration will be explained in a later section. After energy calibration for each Pd foil (see Fig. 4b), all Pd spectra are almost identical.
Image processing
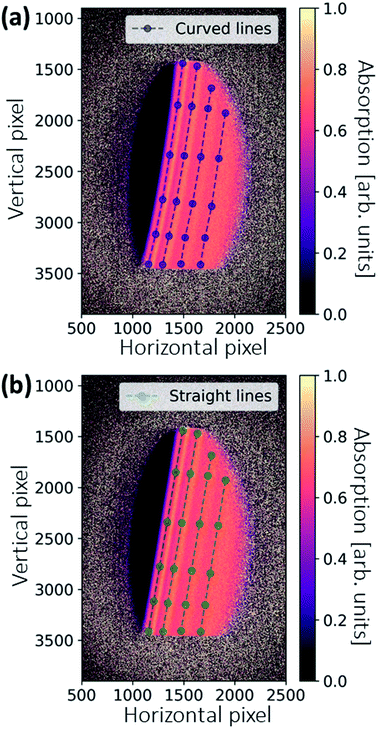
All images are dark-current corrected and processed with a median filter with a kernel size of 5 × 5 pixels to remove local outliers. Absorption images are generated on the basis of Lambert–Beer's law. Fig. 5a shows the absorption image of the Pd reference foil, calculated pixel-wise by the images IR and I0 shown in Fig. 3. The unfocused XAS geometry has the advantage that the 2D spatial information of the sample is also imaged. Thus, additional image processing can be used to improve the final spectral quality.To smooth the absorption image to some extent, a Gaussian low-pass filter is applied in addition to the median filter. The σ-value of the Gaussian filter is chosen as big as possible until the final energy resolution approaches the corehole lifetime broadening of Pd K-shell. The selected image filters reduce the noise level and improve the statistics. This improves the quality of the spectra without increasing the acquisition time.
Sometimes, the energies of the dispersed X-rays are not perfectly aligned, and thus the features in the absorption appear as slightly curved lines, as shown in Fig. 5a. This is because the bending of the crystal wafer is not homogeneous. To generate the final spectrum, the absorption image is rotated and the values are averaged in the vertical direction. The deformed features may then give rise to a distorted spectrum. An image warping transformation can be performed to correct the deformation, involving the selection of some points along the curved lines (see blue points in Fig. 5a). The coordinate of a certain point along the curved line is (x, y). For each point, there is a modified point lying on a corresponding straight line with a coordinate of (x′, y′), as shown in Fig. 5b. The coordinate transformation from (x, y) to (x′, y′) can be fitted by a second-order polynomial, which, in comparison to other orders, gives the best results:
 | (1) |
The fitting coefficients aij are used to warp all the coordinates in Fig. 5a, resulting in a corrected absorption image as shown in Fig. 5b.
The 2D spatial information can also be used for a sample inhomogeneity correction, and was initially introduced for this XAS setup at the MuCLS.18Fig. 6a shows the absorption image of the sample pellet. The X-ray footprint on the sample is relatively large. As different energies penetrate different parts of the sample, sample inhomogeneity causes a variation in the absorption signal in addition to the intensity oscillations originating from the X-ray absorption fine structure (see zoomed-in regions). To correct this, the crystal was rotated by an additional 0.2° after all in situ scans. The crystal rotation shifts the energy range by ∼530 eV. X-ray absorption in the post-edge region is approximated by a linear function, which gives an indication of the sample's local thickness (see Fig. 6b). A thickness-corrected image can then be obtained by normalizing Fig. 6a with 6b. The correct attenuation should be multiplied with the slope of a linear function. The inhomogeneity indicated in the zoom-in of Fig. 6a is eradicated, demonstrating the effectiveness of the method. Finally, the image is warped using the same coefficients as for Fig. 5. The image is then rotated, and a polygonal region-of-interest (ROI) is marked as large as possible (see Fig. 6d), making the best use of available pixels that contain spectral information.
XAS spectra generation
Fig. 7 illustrates the energy calibration procedure. An XAS spectrum is generated by averaging all values in the ROI vertically. Several feature points were extracted for both the synchrotron reference spectrum and the measured reference spectrum. The pixel positions can be translated into X-ray energies by a second-order fitting (see eqn (2)). Fig. 7c shows the energy-calibrated spectra for the reference Pd foil. The same fitting coefficients are applied to the sample measured after the Pd foil during the same scan.| E = a2x2 + a1x + a0 | (2) |
Energy resolution
The energy resolution of the system is determined with ray-tracing calculations using the XRT package.44 Two scenarios with the only difference in the source spectra are calculated: one with a uniformly distributed spectrum and the other with a monochromatic line spectrum. The simulated results are shown in Fig. 8.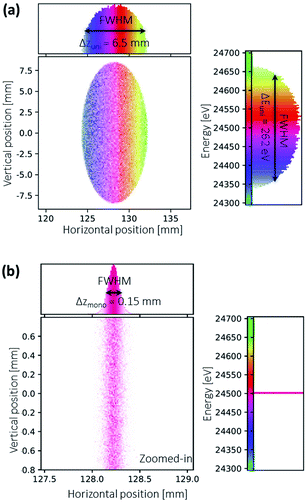 | ||
| Fig. 8 Ray-traced images at the detector calculated with (a) uniformly distributed source spectrum (b) monochromatic line spectrum. The simulation geometry and Python script can be found in the ESI.† | ||
The energy resolution of the spectrometer is defined as:44
 | (3) |
Results and discussion
Samples
In this study, we investigated a hydrogen-pretreated Pd/C catalyst in a phenylacetic acid decarboxylation reaction. It was observed that hydrogen pretreatment prior to reaction can significantly enhance the catalytic performance of Pd/C even though the subsequent reaction takes place in an inert gas (N2).46 It is known that metallic Pd(0) transforms into palladium hydride (PdHx) in the presence of H2.43 Thus, it is crucial to identify whether the formed PdHx species during the hydrogen pretreatment can be well maintained under the decarboxylation reaction conditions. For this reason, we established this in situ XANES experiment, in which we heated up the hydrogen-pretreated Pd/C catalyst in the N2 atmosphere to investigate its chemical species under catalytic reaction conditions.The Pd foil (thickness 25 μm), Pd/C catalyst (30 wt%) and phenylacetic acid (purity ≥99.0%) were purchased from Sigma-Aldrich. The phenylacetic acid was used as the reactant. The Pd/C catalyst consists of palladium nanoparticles (NPs) supported on the activated carbon. Pd/C sample pellets were prepared by compressing Pd/C power with boron nitride (BN) powder (Honeywell Riedel-de Haen) at a ratio of 2![[thin space (1/6-em)]](https://www.rsc.org/images/entities/char_2009.gif) :
:![[thin space (1/6-em)]](https://www.rsc.org/images/entities/char_2009.gif) 3 to reach optimal X-ray absorption. All Pd/C sample pellets were first activated for 30 min at 150 °C in H2 flow and then for another 30 min in N2 flow to reduce the oxidized Pd NPs to a pure Pd(0) state (No. 1 in Table 1). Table 1 presents the characteristics and treatments of the different samples. No. 0 refers to the reference Pd foil used to calibrate the energy and correct any temporal uncertainties between different XAS scans. No. 1 and No. 2 are the Pd/C samples treated under defined conditions, which serve as references of Pd(0) and Pd hydride forms of the sample. No. 3 is the test sample investigated in the in situ experiment. It is a hydrogen-pretreated Pd/C sample to which the reactant, the phenylacetic acid, was added.
3 to reach optimal X-ray absorption. All Pd/C sample pellets were first activated for 30 min at 150 °C in H2 flow and then for another 30 min in N2 flow to reduce the oxidized Pd NPs to a pure Pd(0) state (No. 1 in Table 1). Table 1 presents the characteristics and treatments of the different samples. No. 0 refers to the reference Pd foil used to calibrate the energy and correct any temporal uncertainties between different XAS scans. No. 1 and No. 2 are the Pd/C samples treated under defined conditions, which serve as references of Pd(0) and Pd hydride forms of the sample. No. 3 is the test sample investigated in the in situ experiment. It is a hydrogen-pretreated Pd/C sample to which the reactant, the phenylacetic acid, was added.
| No. | Sample | Used as | Treatment conditions |
|---|---|---|---|
| 0 | Pd foil | Standard reference | No treatment (measured in air at room temperature) |
| 1 | Pd/C catalyst | Pd(0) form reference | The raw Pd/C pellet was first treated in H2 flow (1 bar) for 30 min at 150 °C and in N2 flow (1 bar) at 150 °C for another 30 min |
| 2 | Pd/C catalyst | Pd hydride reference | Based on the No. 1 treatment, the Pd/C pellet was further treated in H2 flow (1 bar) at room temperature for 30 min |
| 3 | Pd/C catalyst + phenylacetic acid | Test sample for the in situ reaction | Based on the No. 2 treatment, the Pd/C was added with the reactant. (The phenylacetic acid was first dissolved in hexane solvent, and several droplets of the solution were applied to the Pd/C pellet. The hexane solvent was then vaporized, leaving phenylacetic acid on the Pd/C surface. The addition of phenylacetic acid was conducted in the glove box.) |
In situ XANES results
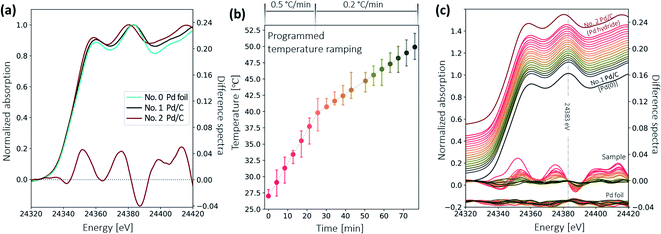
Fig. 9a shows the XANES spectra of the Pd standard foil (No. 0), the Pd/C sample in Pd(0) form (No. 1), and in Pd hydride form (No. 2), respectively. The features of sample No. 1 agree with those of the Pd foil. In contrast, spectral features of sample No. 2 are shifted towards lower energies, which is ascribed to the mixing of unoccupied states of hydrogen and palladium.20 To better visualize the difference, a difference spectrum (see the red curve around 0 in Fig. 9a) is presented, by subtracting the normalized spectrum of sample No. 1 from that of sample No. 2. The shape of this difference spectrum is consistent with the ones measured at the synchrotron.28 These three spectra serve as references for the identification of the palladium species in the decarboxylation catalytic reaction.Fig. 9b shows the temperature ramping over 75 min. The temperature ramping rate was set to 0.5 °C min−1 from room temperature to 40 °C and 0.2 °C min−1 afterwards. The reaction on the Pd/C catalyst surface began when the temperature ramped up to certain temperature. A series of XAS spectra were collected continuously using the fast scan. The start of each fast XAS scan is indicated by a differently colored dot in the temperature profile. The total acquisition time for each scan is 4.3 min. The longer interval between the scans starting at 43 min and 50 min was due to a brief technical issue during data acquisition. At temperatures above 50 °C, spectra remained virtually unchanged. Thus, only 18 scans are presented here.
Fig. 9c shows the measured XANES spectra during the temperature ramping process. The temperature at which the spectra were acquired is color-coded in Fig. 9c according to the colors used in Fig. 9b. Pd/C reference samples in Pd hydride (sample No. 2) and Pd(0) form (sample No. 1) are plotted above and below the in situ spectra for comparison. The difference spectra of the sample and the Pd foil – the difference between each in situ scan and the averaged spectrum of the last three spectra of the entire series – are also plotted in Fig. 9c. The difference spectra of the Pd reference foil have small and random oscillations, demonstrating that the spectral change observed in samples is indeed due to chemical species change rather than systematic fluctuations from the instruments.
At the beginning of the in situ experiment, the spectrum undergoes a shift towards lower energy that is similar to the behavior of the Pd hydride reference (sample No. 2). But the shift is smaller than that in the Pd hydride reference, which is also confirmed by the smaller amplitude of the difference spectrum. This indicates that the Pd/C sample was initially still in the Pd hydride form after adding the reactant, but with fewer hydrogen atoms incorporated into the Pd lattice. While ramping up the temperature, a slight shift towards higher energy is observed. The difference spectra around 0 present more clearly the subtle changes that are hard to see directly from the spectra. The shape of the spectra gradually evolves into a shape resembling the bare Pd(0) form of the Pd/C (sample No. 1) and becomes nearly identical at 50 °C. No changes are observed as the reaction temperature increases further.
The in situ XAS results reveal that the hydrogen pretreatment can initially transfer the Pd(0) species to the PdHx species, and this PdHx can be maintained with the addition of reactant at room temperature. However, PdHx species surfers a decomposition process when ramping up the temperature.
To further exclude the possibility that the spectral change was caused by consumption of the limited sample amount, online mass spectrometry and static XANES were further conducted. A temperature-programmed surface reaction (TPSR) on No. 3 sample with online mass-spectrometry was conducted with the same temperature ramping speed. The TPSR result shows that the reaction rate significantly speeds up at a temperature of 90 °C, well above the 50 °C,46 meaning that the transform of chemical species is completed before the catalytic reaction becomes most active. The additional static XAS experiment was carried out on a different day, in which the temperature was heated up to 100 °C within 10 min, and a XANES spectrum was measured immediately. The same trend of spectra shapes changes from PdHx to Pd(0) was observed. Both the mass spectrometry and static XANES experiments confirm that the spectral changes are due to the chemical species change of the Pd/C catalyst.
Since transmission-mode XAS is a bulk-sensitive technique that provides averaged information of the test pellet, the spectral shape above 50 °C cannot provide direct evidence of whether the small amount of hydrogen is still incorporated in the Pd lattice. Therefore, combining the in situ XANES results and the fact that hydrogen-pretreated Pd/C has significantly better catalytic performance than bare Pd/C (sample No. 1),46 the hydrogen-pretreated Pd/C is concluded to be an α-PdHx species under reaction conditions, as its spectral shapes highly resemble that of bare Pd(0).27 And the enhanced catalytic activity of the hydrogen-pretreated Pd/C is highly correlated with a formation of α-phase PdHx rather than bare Pd(0).
Conclusions
In this study, we performed an in situ XAS experiment on a Pd/C catalyst at the MuCLS facility. We investigated the active species of the hydrogen-pretreated Pd/C catalyst in the carboxylic acid decarboxylation reaction. To this end, we measured a series of Pd K-edge XANES of the sample, to which phenylacetic acid was added when ramping up the temperature in the N2 atmosphere. We observed a dynamic spectral change of Pd hydride species to a spectral shape resembling Pd(0) form between room temperature and 50 °C. Combining TPSR and in situ XANES results, we believe that the active species of the hydrogen pretreated Pd/C catalyst for the decarboxylation reaction should be α-phase PdHx — only a small amount of hydrogen is incorporated in the Pd lattice—rather than metallic Pd(0).The synchrotron-comparable XANES collected at the compact ICS facility is sufficiently sensitive to distinguish the subtle differences between Pd and Pd hydride at a time resolution of less than 5 min and an energy resolution below the Pd K-hole lifetime broadening. Several advantages over other compact systems exist at MuCLS for in situ XAS experiments in terms of data collection efficiency, spectral quality, source stability, flexibility of the operating space, and high X-ray energy. First, the higher spectral flux, smaller bandwidth and smaller divergence contribute to an efficient XAS data acquisition, allowing for in situ measurements on a time scale of only minutes in the high-energy X-ray regime >15 keV, or even less when a degraded spectral quality is acceptable. Second, the well-defined source spectrum and the energy tunability allow synchrotron-comparable XAS spectra to be generated with a high signal-to-noise ratio. Third, the stability of the X-ray source at the MuCLS satisfies the requirement of long-term experimentation. Fourth, the separate experiment hutch provides sufficient operating space for the implementation of complex sample environments. Finally, high-energy X-rays facilitate in situ/in operando setups in various atmospheres due to reduced X-ray absorption by the atmospheres and sample environments. However, there are also some drawbacks. First, the X-ray energy at the MuCLS is currently only tunable from 15 keV to 35 keV, which restricts the elements that can be investigated to this energy range – though pushing the energy range to a lower limit is theoretically possible. Second, the dispersive setup restricts measurement to transmission mode only. Therefore, dilute samples are challenging to measure.
To summarize, these first in situ XAS results obtained at an ICS facility demonstrate the great potential of such sources for in situ XAS experiments, which are usually conducted at large facilities. With an intermediate cost and performance between those of an X-ray tube and a synchrotron, such laboratory-scale facilities can provide excellent alternatives for in situ XAS techniques and advance their widespread use in science and industry.
Author contributions
FP, MD, AJ, YL and JH conceived the experiments. JH, FD, MD, YL and AJ performed the experiments. FP, MD, BG and KA contributed to the experiments including the ICS source installation at the Munich Compact Light Source. JH, FD and YL analyzed the data. JH and FD wrote the manuscript with significant input from all co-authors.Conflicts of interest
There are no conflicts to declare.Acknowledgements
We wish to acknowledge the financial support by the Center for Advanced Laser Applications (CALA). This study was supported by the German Research Foundation (DFG) and the Technical University of Munich (TUM) within the framework of the Open Access Publishing Program. We would also like to thank the staff of Lyncean Technologies Inc. for their technical support. Further, we wish to acknowledge Dr Yitao Cui and the SPring-8 BL14B2 XAFS database for the Pd metal standard spectrum. FD would like to thank the Chinese Scholarship Council (CSC) for the financial support. JH wishes to thank Suzana Spasova for her assistance during the easurements.References
- D. C. Koningsberger and R. Prins, X-ray Absorption: Principles, Applications, Techniques of EXAFS and XANES, Wiley, New York, 1988, vol.92 Search PubMed.
- J. Yano and V. K. Yachandra, Photosynth. Res., 2009, 102, 241–254 CrossRef CAS PubMed.
- F. W. Lytle, J. Synchrotron Radiat., 1999, 6, 123–134 CrossRef CAS PubMed.
- R. Bès, T. Ahopelto, A. P. Honkanen, S. Huotari, G. Leinders, J. Pakarinen and K. Kvashnina, J. Nucl. Mater., 2018, 507, 50–53 CrossRef.
- A. S. Ditter, E. P. Jahrman, L. R. Bradshaw, X. Xia, P. J. Pauzauskie and G. T. Seidler, J. Synchrotron Radiat., 2019, 26, 2086–2093 CrossRef CAS PubMed.
- Z. Németh, J. Szlachetko, É. G. Bajnóczi and V. György, Rev. Sci. Instrum., 2016, 87, 103105 CrossRef PubMed.
- W. Błachucki, J. Czapla-Masztafiak, J. Sá and J. Szlachetko, J. Anal. At. Spectrom., 2019, 34, 1409–1415 RSC.
- F. Zeeshan, J. Hoszowska, L. Loperetti-Tornay and J.-C. Dousse, Rev. Sci. Instrum., 2019, 90, 73105 CrossRef CAS.
- C. Schlesiger, S. Praetz, R. Gnewkow, W. Malzer and B. Kanngießer, J. Anal. At. Spectrom., 2020, 35, 2298–2304 RSC.
- P. Zimmermann, S. Peredkov, P. M. Abdala, S. DeBeer, M. Tromp, C. Müller and J. A. van Bokhoven, Coord. Chem. Rev., 2020, 423, 213466 CrossRef CAS.
- W. Malzer, C. Schlesiger and B. Kanngießer, Spectrochim. Acta, Part B, 2021, 177, 106101 CrossRef CAS.
- J. G. Moya-Cancino, A.-P. Honkanen, A. M. J. van der Eerden, H. Schaink, L. Folkertsma, M. Ghiasi, A. Longo, F. M. F. de Groot, F. Meirer, S. Huotari and B. M. Weckhuysen, ChemCatChem, 2019, 11, 1039–1044 CrossRef CAS PubMed.
- K. Dupraz, et al. , Phys. Open, 2020, 5, 100051 CrossRef.
- P. Cardarelli, A. Bacci, R. Calandrino, F. Canella, R. Castriconi, S. Cialdi, A. Del Vecchio, F. Di Franco, I. Drebot, M. Gambaccini, D. Giannotti, A. Loria, G. Mettivier, G. Paternò, V. Petrillo, M. Rossetti Conti, P. Russo, A. Sarno, E. Suerra, A. Taibi and L. Serafini, Phys. Med., 2020, 77, 127–137 CrossRef CAS.
- Z. Chi, L. Yan, Y. Du, Z. Zhang, W. Huang, H. Chen and C. Tang, Nucl. Instrum. Methods Phys. Res., Sect. B, 2017, 402, 364–369 CrossRef CAS.
- W. Graves, J. Chen, P. Fromme, M. Holl, K.-H. Hong, R. Kirian, C. Limborg-Deprey, L. Malin, D. Moncton, E. Nanni, K. Schmidt, J. Spence, M. Underhill, U. Weierstall, N. Zatsepin and C. Zhang, ASU Compact XFEL, JACoW, Geneva, Switzerland, 2018 Search PubMed.
- C. Vaccarezza, et al. , Nucl. Instrum. Methods Phys. Res., Sect. A, 2016, 829, 237–242 CrossRef CAS.
- J. Huang, B. Günther, K. Achterhold, Y.-T. Cui, B. Gleich, M. Dierolf and F. Pfeiffer, Sci. Rep., 2020, 10, 8772 CrossRef CAS PubMed.
- F. Meier, L. Zhou, J. Wiebe and R. Wiesendanger, Science, 2008, 320, 82–86 CrossRef CAS PubMed.
- A. L. Bugaev, A. A. Guda, I. A. Pankin, E. Groppo, R. Pellegrini, A. Longo, A. V. Soldatov and C. Lamberti, Catal. Today, 2019, 336, 40–44 CrossRef CAS.
- S. Zhao, Y. Li, D. Liu, J. Liu, Y.-M. Liu, D. N. Zakharov, Q. Wu, A. Orlov, A. A. Gewirth, E. A. Stach, R. G. Nuzzo and A. I. Frenkel, J. Phys. Chem. C, 2017, 121, 18962–18972 CrossRef CAS.
- C. He, J. Tao, Y. Ke and Y. Qiu, RSC Adv., 2015, 5, 66695–66703 RSC.
- C. Zhao, T. Brück and J. A. Lercher, Green Chem., 2013, 15, 1720 RSC.
- S. Lestari, P. Mäki-Arvela, H. Bernas, O. Simakova, R. Sjöholm, J. Beltramini, G. Q. M. Lu, J. Myllyoja, I. Simakova and D. Y. Murzin, Energy Fuels, 2009, 23, 3842–3845 CrossRef CAS.
- S. Lestari, I. Simakova, A. Tokarev, P. Mäki-Arvela, K. Eränen and D. Y. Murzin, Catal. Lett., 2008, 122, 247–251 CrossRef CAS.
- M. W. Tew, M. Janousch, T. Huthwelker and J. A. van Bokhoven, J. Catal., 2011, 283, 45–54 CrossRef CAS.
- A. L. Bugaev, A. A. Guda, K. A. Lomachenko, V. V. Srabionyan, L. A. Bugaev, A. V. Soldatov, C. Lamberti, V. P. Dmitriev and J. A. van Bokhoven, J. Phys. Chem. C, 2014, 118, 10416–10423 CrossRef CAS.
- A. L. Bugaev, A. A. Guda, A. Lazzarini, K. A. Lomachenko, E. Groppo, R. Pellegrini, A. Piovano, H. Emerich, A. V. Soldatov, L. A. Bugaev, V. P. Dmitriev, J. A. van Bokhoven and C. Lamberti, Catal. Today, 2017, 283, 119–126 CrossRef CAS.
- A. L. Bugaev, O. A. Usoltsev, A. Lazzarini, K. A. Lomachenko, A. A. Guda, R. Pellegrini, M. Carosso, J. G. Vitillo, E. Groppo, J. A. van Bokhoven, A. V. Soldatov and C. Lamberti, Faraday Discuss., 2018, 208, 187–205 RSC.
- B. Günther, M. Dierolf, K. Achterhold and F. Pfeiffer, J. Synchrotron Radiat., 2019, 26, 1546–1553 CrossRef.
- B. Günther, R. Gradl, C. Jud, E. Eggl, J. Huang, S. Kulpe, K. Achterhold, B. Gleich, M. Dierolf and F. Pfeiffer, J. Synchrotron Radiat., 2020, 27, 1395–1414 CrossRef PubMed.
- E. Eggl, M. Dierolf, K. Achterhold, C. Jud, B. Günther, E. Braig, B. Gleich and F. Pfeiffer, J. Synchrotron Radiat., 2016, 23, 1137–1142 CrossRef.
- P. Glatzel, T.-C. Weng, K. Kvashnina, J. Swarbrick, M. Sikora, E. Gallo, N. Smolentsev and R. A. Mori, J. Electron Spectrosc. Relat. Phenom., 2013, 188, 17–25 CrossRef CAS.
- P. Lecante, J. Jaud, A. Mosset, J. Galy and A. Burian, Rev. Sci. Instrum., 1994, 65, 845–849 CrossRef CAS.
- U. Kaminaga, T. Matsushita and K. Kohra, Jpn. J. Appl. Phys., 1981, 20, L355–L358 CrossRef CAS.
- S. Pascarelli, O. Mathon, M. Muñoz, T. Mairs and J. Susini, J. Synchrotron Radiat., 2006, 13, 351–358 CrossRef CAS PubMed.
- C. Schlesiger, L. Anklamm, H. Stiel, W. Malzer and B. Kanngießer, J. Anal. At. Spectrom., 2015, 30, 1080–1085 RSC.
- A. Kulow, S. Witte, S. Beyer, A. G. Buzanich, M. Radtke, U. Reinholz, H. Riesemeier and C. Streli, J. Anal. At. Spectrom., 2019, 34, 239–246 RSC.
- R. Gradl, M. Dierolf, L. Hehn, B. Günther, A. Ö. Yildirim, B. Gleich, K. Achterhold, F. Pfeiffer and K. S. Morgan, Sci. Rep., 2017, 7, 4908 CrossRef PubMed.
- C. Jud, E. Braig, M. Dierolf, E. Eggl, B. Günther, K. Achterhold, B. Gleich, E. Rummeny, P. Noël, F. Pfeiffer and D. Muenzel, Sci. Rep., 2017, 7, 14477 CrossRef PubMed.
- E. Eggl, S. Grandl, A. Sztrókay-Gaul, M. Dierolf, C. Jud, L. Heck, K. Burger, B. Günther, K. Achterhold, D. Mayr, J. J. Wilkens, S. D. Auweter, B. Gleich, K. Hellerhoff, M. F. Reiser, F. Pfeiffer and J. Herzen, Sci. Rep., 2018, 8, 15700 CrossRef.
- S. Kulpe, M. Dierolf, B. Günther, M. Busse, K. Achterhold, B. Gleich, J. Herzen, E. Rummeny, F. Pfeiffer and D. Pfeiffer, Sci. Rep., 2019, 9, 13332 CrossRef.
- A. Baldi, T. C. Narayan, A. L. Koh and J. A. Dionne, Nat. Mater., 2014, 13, 1143–1148 CrossRef CAS PubMed.
- K. Klementiev and R. Chernikov, Proc. SPIE, 2014, 92090A Search PubMed.
- J. L. Campbell and T. Papp, At. Data Nucl. Data Tables, 2001, 77, 1–56 CrossRef CAS.
- F. Deng, J. Huang, E. A. Ember, K. Achterhold, M. dierolf, A. Jentys, Y. Liu, F. Pfeiffer and J. A. Lercher, 2021, Submitted.
Footnotes |
| † Electronic supplementary information (ESI) available. See DOI: 10.1039/d1ja00274k |
| ‡ These authors contributed equally. |
| This journal is © The Royal Society of Chemistry 2021 |

