
 Open Access Article
 This Open Access Article is licensed under a Creative Commons Attribution-Non Commercial 3.0 Unported Licence
LA-ICP-MS using a nitrogen plasma source†
Christoph
Neff
 ,
Pascal
Becker
,
Bodo
Hattendorf
* and
Detlef
Günther
*
,
Pascal
Becker
,
Bodo
Hattendorf
* and
Detlef
Günther
*
Laboratory of Inorganic Chemistry, Department of Chemistry and Applied Biosciences, ETH Zurich, Vladimir-Prelog-Weg 1, 8093 Zürich, Switzerland. E-mail: detlef.guenther@sl.ethz.ch; bodo@inorg.chem.ethz.ch
First published on 19th July 2021
Abstract
Here we describe the first study of a nitrogen based inductively coupled plasma mass spectrometry system in conjunction with laser ablation (LA-(N2-ICP)-MS). Therefore, a microwave-sustained, inductively coupled, atmospheric-pressure plasma source was mounted onto the interface of a quadrupole ICP-MS to investigate the capabilities of such an instrument. The proof of concept study was focused on the quantification capabilities of major to trace elements. Therefore, the plasma background species under dry plasma conditions were investigated to identify the most suitable isotopes for the analysis and to describe the newly formed nitrogen plasma interferences. In addition, the instrumental drift was investigated. Selected elements in the reference materials NIST SRM 612 and BCR-2G were quantified using NIST SRM 610 as an external standard and could be determined within the uncertainty of the reference values. Finally, the limits of detection for LA-(N2-ICP)-MS and LA-(Ar-ICP)-MS were compared indicating similar or even lower LODs for most elements using LA-(N2-ICP)-MS. Therefore, a nitrogen plasma source coupled to a mass spectrometer could challenge the argon-sustained ICP-MS in element analysis by overcoming argon interferences and has the potential to reduce the plasma gas expenses significantly.
Introduction
Laser ablation inductively coupled plasma mass spectrometry using argon-sustained plasma sources (LA-(Ar-ICP)-MS)1,2 has successfully been applied during the last decades for element analysis of solid samples. Especially the high sensitivity, low limits of detection (LODs) and the wide linear dynamic range made (Ar-ICP)-MS in combination with laser ablation a favourable technique to determine element compositions from major to trace elements.3 Despite the widely demonstrated applications of LA-(Ar-ICP)-MS,4–11 Ar plasma sources come with certain limitations. The consumption of almost 1 m3 of pure Ar gas per hour constitutes a substantial budget for its operation and gas blank species can interfere with major analyte isotopes. For example, the plasma species 38Ar1H+, 40Ar+, 40Ar12C+, 36Ar16O+, 38Ar14N+, 40Ar15N+, 40Ar14NH+, 40Ar16O+, and 40Ar2+ interfere with the most abundant isotopes of K, Ca, Cr, Mn, Fe, and Se, respectively.12–14 Furthermore, residues of Xe can interfere with the high abundance isotope of 128Te+.15,16 In consequence, the LODs are increased and in some cases limit the access to trace and ultra-trace levels. In addition, a number of argides are formed with matrix elements, which leads to additional spectral interferences.17 For example, the formation of 40Ar35Cl+ in chloride rich matrices interfere with 75As18,19 or the formation of 63Cu40Ar+ and 65Cu40Ar+ when analysing copper ore interfere with 103Rh+ and 105Pd+.20,21 Typically, these interferences can be mitigated by using ion molecule reactions in collision and reaction cell instruments or instruments with high mass resolving power as sector field ICP-MS.20,22,23However, another approach to remove Ar based interferences is to replace the Ar plasma gas by N2. Several N2-sustained plasma sources have been developed for element analysis during the last 50 years.24–27 They allowed for significant reduction of Ar plasma species. In return, other species, especially based on N and O such as N+, O+, N2+, O2+, NO+, N3+, and N4+, were reported.13,19 However, coupled to MS they allowed the quantification of K, Ca, Cr, Fe, As and Se at lower LODs when compared to (Ar-ICP)-MS, but they suffered from low plasma power, plasma stability, and/or substantially higher LODs for other elements.13,28–30
A recent new development in this field is the microwave-sustained, inductively coupled, atmospheric-pressure plasma (MICAP),31 which operates with N2 as the plasma gas at a plasma power of up to 1500 W while using a conventional Fassel-type ICP torch.32 In a first attempt, such a source was successfully implemented into commercially available (N2-ICP)-OES systems.33,34 Later, this N2-ICP plasma source was also tested as an ion source for time-of-flight mass spectrometry.19 The latter report indicated that sensitivities for the (N2-ICP)-MS were slightly lower in comparison to an (Ar-ICP)-MS, but the LODs for K, Ca, Cr, Fe, As, and Se were substantially improved, while being comparable for most other elements. Using N2 as the plasma gas could not only compete with the performance of an (Ar-ICP)-MS, it could also constitute a more cost-effective alternative to the Ar-ICP.19 However, this proof of concept study was performed using liquid sample introduction, where aerosol desolvation was found to lead to substantial improvements in sensitivity.
To explore that further, we coupled the MICAP plasma source to a quadrupole mass spectrometer to investigate the capabilities of the high-power nitrogen plasma with dry aerosols from laser ablation sampling (LA-(N2-ICP)-MS). Therefore, we measured the gas blank species under dry plasma conditions, the element sensitivities and LODs. Furthermore, the long-term stability was evaluated. Finally, quantitative analyses were carried out using established glass standard materials (BCR-2G and NIST SRM 612) to demonstrate the capabilities of the nitrogen plasma source for major, minor and trace elements.
Experimental
Instrumentation
The prototype instrument consists of a MICAP (Radom Corp, USA) plasma source coupled to the interface of an ELAN 6100 DRCplus (PerkinElmer SCIEX, USA) instrument. The plasma was sustained with N2 cooling gas, N2 auxiliary gas, and N2 carrier gas, all from a liquid N2 Dewar (>99.99%, PanGas AG, Switzerland).Laser ablation was performed using an argon–fluoride (ArF) excimer LA system (193 nm, GeoLas C, Lambda Physik, Germany) providing a homogenized, circular laser beam. The ablation took place in a cylindrical ablation cell with a gas inlet nozzle of 0.5 mm diameter.35 Helium (99.999%, PanGas AG, Switzerland) served as the ablation gas.36 The background spectrum for an argon-sustained ICP-MS was acquired using an ELAN 6100 DRCplus (PerkinElmer SCIEX, USA). The quantification of NIST SRM 612 with LA-(Ar-ICP)-MS was performed using an Agilent 7500 cs (Agilent, USA).
Samples
The reference materials NIST SRM 610, NIST SRM 612, and BCR-2G were used to evaluate the capabilities of the LA-(N2-ICP)-MS.37,38 NIST SRM 612 and BCR-2G were quantified using NIST SRM 610 as an external standard and 40Ca+ was used as internal standard. For each LA-(N2-ICP)-MS measurement, 30 s of gas blank were acquired followed by 50 s of ablation. LA-(N2-ICP)-MS operating conditions are given in Table 1. The quantification of NIST SRM 612 using LA-(Ar-ICP)-MS is described in the ESI and the operating conditions are given in ESI, Table S1.†| Laser fluence | 15–20 J cm−2 |
| Laser repetition rate | 10 Hz |
| Laser spot diameter | 60 μm |
| Ablation mode | Hole-drilling (bulk analysis) |
| Ablation gas flow (He) | 0.9–1.0 L min−1 |
| Carrier gas flow (N2) | 0.7–0.85 L min−1 |
| Auxiliary gas flow (N2) | 0.8 L min−1 |
| Cooling gas flow (N2) | 14 L min−1 |
| Plasma power | 1500 W |
| Sampler cone | 1.1 mm Ø, Pt |
| Skimmer cone | 0.8 mm Ø, Pt |
Data evaluation
The quantification was performed using an in-house written Python-based software (Stalquant).39 The determination of the LODs, further data processing, and plots were performed using an in-house written script running on R.40,41 Mass fractions and LODs were calculated according to Longerich et al.42Results and discussion
Optimization
The LA-(N2-ICP)-MS operating conditions were adjusted using NIST SRM 610 for high signal intensity from Li to U while maintaining a U/Th ratio of 0.9–1.1. A typical transient signal of six selected elements is displayed in Fig. 1a. In this case, intensity ratios of 238U+/232Th+ = 1.01, 232Th16O+/232Th+ = 0.3%, and 232Th14N+/232Th+ = 0.2% were measured (Fig. 1b). These values indicated that the N2-ICP plasma source can provide similarly robust conditions as an argon-sustained plasma sources and very similar operating conditions apply. Especially, the close match of the 238U+/232Th+ intensity ratio with their molar ratio in NIST SRM 610 (238U/232Th = 0.98) indicated similar vaporization efficiency of the laser-generated particles within the nitrogen plasma.43 | ||
| Fig. 1 LA-(N2-ICP)-MS transient signals, where 30 s of gas blank were acquired followed by 50 s of ablation of NIST SRM 610. (a) Isotopes from 7–238 m/z. (b) Th, U, and Th clusters. | ||
N2 plasma background species
The plasma background spectra for dry (N2-ICP)-MS and dry (Ar-ICP)-MS are compared in Fig. 2. Especially in the mass range 35–107 m/z, the dry (N2-ICP)-MS produced less atomic and molecular ion species that could interfere with analytes when compared to the (Ar-ICP)-MS, which is in line with earlier reports.19 The gas blank species in the (N2-ICP)-MS for 40Ar+, 40Ar12C+, 38Ar14N+, 36Ar16O+, 40Ar15N+, 40Ar16O+, 40Ar2+ and 128Xe+ were significantly reduced or even below the respective detection limits. | ||
| Fig. 2 Dry gas blank spectra of (a) (N2-ICP)-MS and (b) (Ar-ICP)-MS. m/z 14 and 30 were not measured in the (N2-ICP)-MS and m/z 40 and 41 were not measured in the (Ar-ICP)-MS to prevent detector saturation. The elevated noise in (b), especially in the range of m/z > 136, can be explained with the lower integration time leading to single detected ions causing a higher cps intensity. | ||
The dry (N2-ICP)-MS gas blank spectrum from 6–60 m/z is shown in Fig. 3a. The plasma species identified were mainly based on N, O, C, and Ar from the N2 plasma gas and the ambient air. The most abundant species were 14N+ and 14N16O+. To prevent detector saturation, these mass channels were not measured. The high abundance of 14N16O+ indicated a strong influence of O2 from ambient air and/or impurities in the gas supplies on the N2 plasma. Other prominent species were 14N2+, 16O2+, 40Ar+, 14N3+, and 14N4+. The signal intensities of the nitrogen isotopologue ions 14N2+ – 14N15N+, 14N3+ – 14N215N+, and 14N4+ – 14N315N+ generally agreed with their natural abundances. This indicated that the formation of 14Nx1H+ species occurred to a lower extent. In addition to 14N15N2+, the excess signal at m/z 44 was most likely caused by the formation of 14N216O+ while the signal m/z 46 was most probably due to 14N16O2+.
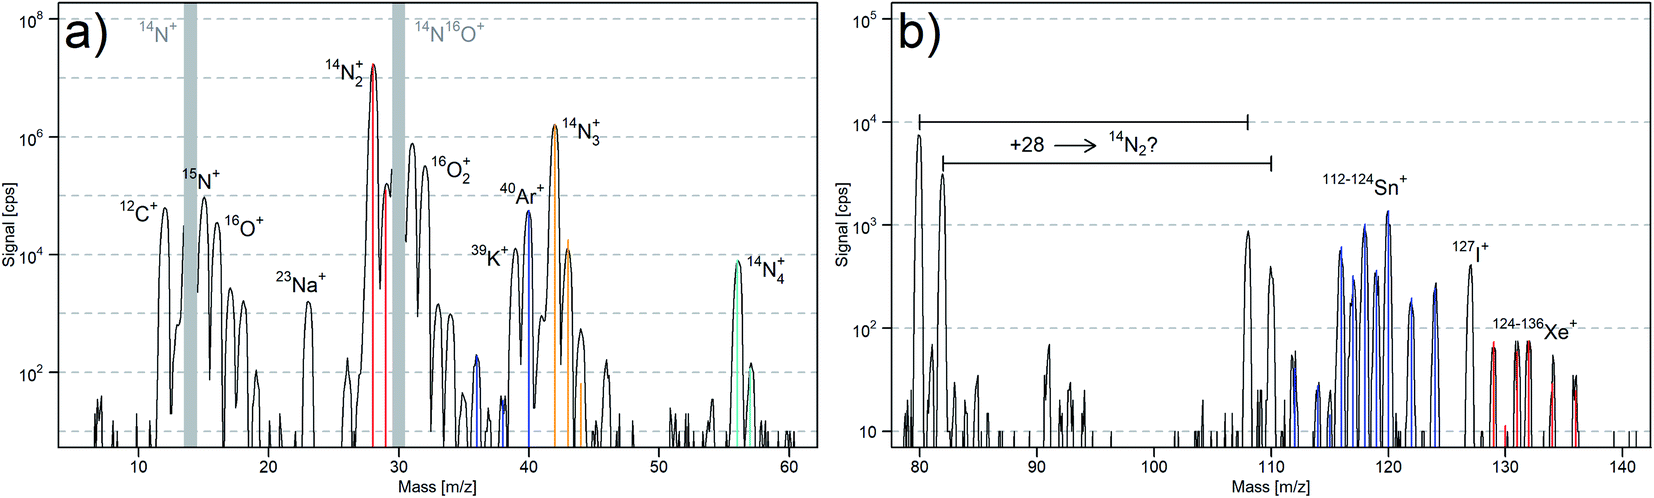 | ||
| Fig. 3 Dry (N2-ICP)-MS gas blank spectra. (a) Isotopic abundance of 14N2 – 14N15N (red), Ar (blue), 14N3 – 14N215N – 14N15N2 (orange), and 14N4 – 14N315N (light blue). (b) Isotopic abundance of Sn (blue), Xe (red) and signals at m/z 80, 82, 108, and 110 not assigned yet. | ||
The signal intensities at m/z 36, 38 and 40 corresponded to the isotopic abundance of Ar. This suggested that Ar was still present in the N2 plasma. Therefore, another N2 source from a 50 L gas bottle (99.995%, PanGas AG, Switzerland) was used for the plasma gas supply. The comparison of the gas blank spectra (ESI, Fig. S1a†) of the (N2-ICP)-MS gas blank using N2 from the 50 L gas bottle (99.995%) and N2 from the liquid N2 Dewar (>99.99%) revealed no substantial differences with the exception of a lower ion signal for m/z 40 in particular. This supports our assumption that the N2 supplies contained detectable amounts of Ar, where the higher signals observed when using the liquid N2 Dewar was due to continuous accumulation. As noble gases are usually not included in the purity specification for N2, the concentration of Ar in either supply remains unknown at this stage. However, considering that a N2 gas bottle (50 L, 200 bar) restricts to run the plasma for approximately one workday and the more expensive N2 from the bottle, all further experiments were carried out using N2 from the Dewar.
Additionally, substantial ion signals from Sn and Xe were observed in the (N2-ICP)-MS gas blank (Fig. 3b). While Xe was most likely also contained in the N2 supply, the origin of Sn is not clear. Most likely it originated from contamination in the tubing, connectors or seals in the gas supply. Besides that, Na, K, and I were detected in the gas blank. However, elevated gas blanks for these elements are known from LA-(Ar-ICP)-MS experiments and related to memory effects from previous experiments.
Yet, there were notable signals at m/z 80, 82, 108 and 110, which could not be assigned to any species. The mass difference of 28 indicated that the species at 108 and 110 m/z are likely caused by 14N2 adducts from the species at 80 and 82 m/z, and similar intensity ratios for of [80]/[82] (2.4) and [108]/[110] (2.2) suggested a similar reactivity with N2. 40Ar2+/40Ar14N3+, 12C214N4+/12C14N5+, and 63CuOH+/65CuOH+ were considered as possible combination for the ions formed at m/z 80 and 82. However, the ablation of copper, graphite, and the addition of Ar gas did not change the signal intensities of 80 and 82 m/z significantly (ESI, Fig. S1b–d†). This suggested that C, Ar, and Cu were not the cause of these species. Further considerations about these unknown species are discussed in the ESI.† The copper experiment revealed the formation of other cluster species. 63Cu14N2+ and 65Cu14N2+ clusters (63Cu14N2+/63Cu+ = 0.02%) and near the detection limit 63Cu14N+ and 65Cu14N+ (63Cu14N+/63Cu+ = 0.001%) were formed. Therefore, the formation of matrix nitride clusters must be kept in mind in further LA-(N2-ICP)-MS studies.
Spectral interferences
The most abundant isotopes 40Ca+, 52Cr+, 56Fe+, 80Se+, and 128Te+ are commonly not measured in LA-(Ar-ICP)-MS as they suffer from plasma background ions, unless using a reaction cell or sector field mass spectrometers providing higher mass resolving power.14 Therefore, these elements were studied in more detail and the LODs of the isotopes were determined (ESI, Table S2†). 40Ca+, 52Cr+, 56Fe+, 78Se+, and 128Te+ were found as the isotopes with lowest LOD analyzed using LA-(N2-ICP)-MS. It is important to notice that the N2 gas supply contained Ar and caused a higher background intensity for 40Ca+ (Fig. 3a). The gas blank for m/z 40 could be reduced using N2 of higher purity (ESI, Fig. S1a†) which would allow to further decrease the LOD for 40Ca+. No plasma background ions were detected between m/z 47 and 55 as well as between m/z 58 and 79.On the other hand, the gas blank signals from 14N4+ hindered the achievement of an even lower LOD for 56Fe+. The lowest LOD for Se was achieved using the isotope 78Se+. The unknown (N2-ICP)-MS gas blank species at 80 and 82 m/z enhanced the LODs for 80Se+ and 82Se+. The lowest LOD for Te was achieved using 128Te+. The gas blank signals for Xe+ were reduced by approx. 50 times compared to LA-(Ar-ICP)-MS (Fig. 2).
Limits of detection
The LODs of 64 elements in NIST SRM 610 analyzed with LA-(N2-ICP)-MS are shown in Fig. 4 and the figures of merit were summarized in ESI, Table S3.† LA-(N2-ICP)-MS provided in general lower LODs compared to Günther et al.23 who employed LA-(Ar-ICP)-MS with the same mass analyzer. However, it is important to note that different laser setting have been used. In this LA-(N2-ICP)-MS study a 2.25 times larger laser spot area and a 1.5–2 times lower laser fluence was used. Therefore, it is more important to demonstrate that very similar figures of merit can be achieved by using the (N2-ICP)-MS. In contrast, the element analysis of 39K+, 40Ca+, 52Cr+, 55Mn+, 63Cu+, 78Se+, and 128Te+ benefited from the reduction of the gas blank species and/or the applicability of a higher abundance isotope. The reduced gas blank at 55 m/z based on 40Ar15N+ and 40Ar14NH+ allowed the measurement of 55Mn+ at a 32-fold lower LOD compared to LA-(Ar-ICP)-MS. Background intensities of <5 cps and 3–13 times lower LODs were measured for isotopes ≥137 m/z. The LOD for 49Ti+ and 208Pb+ improved unexpectedly by 11–13 times.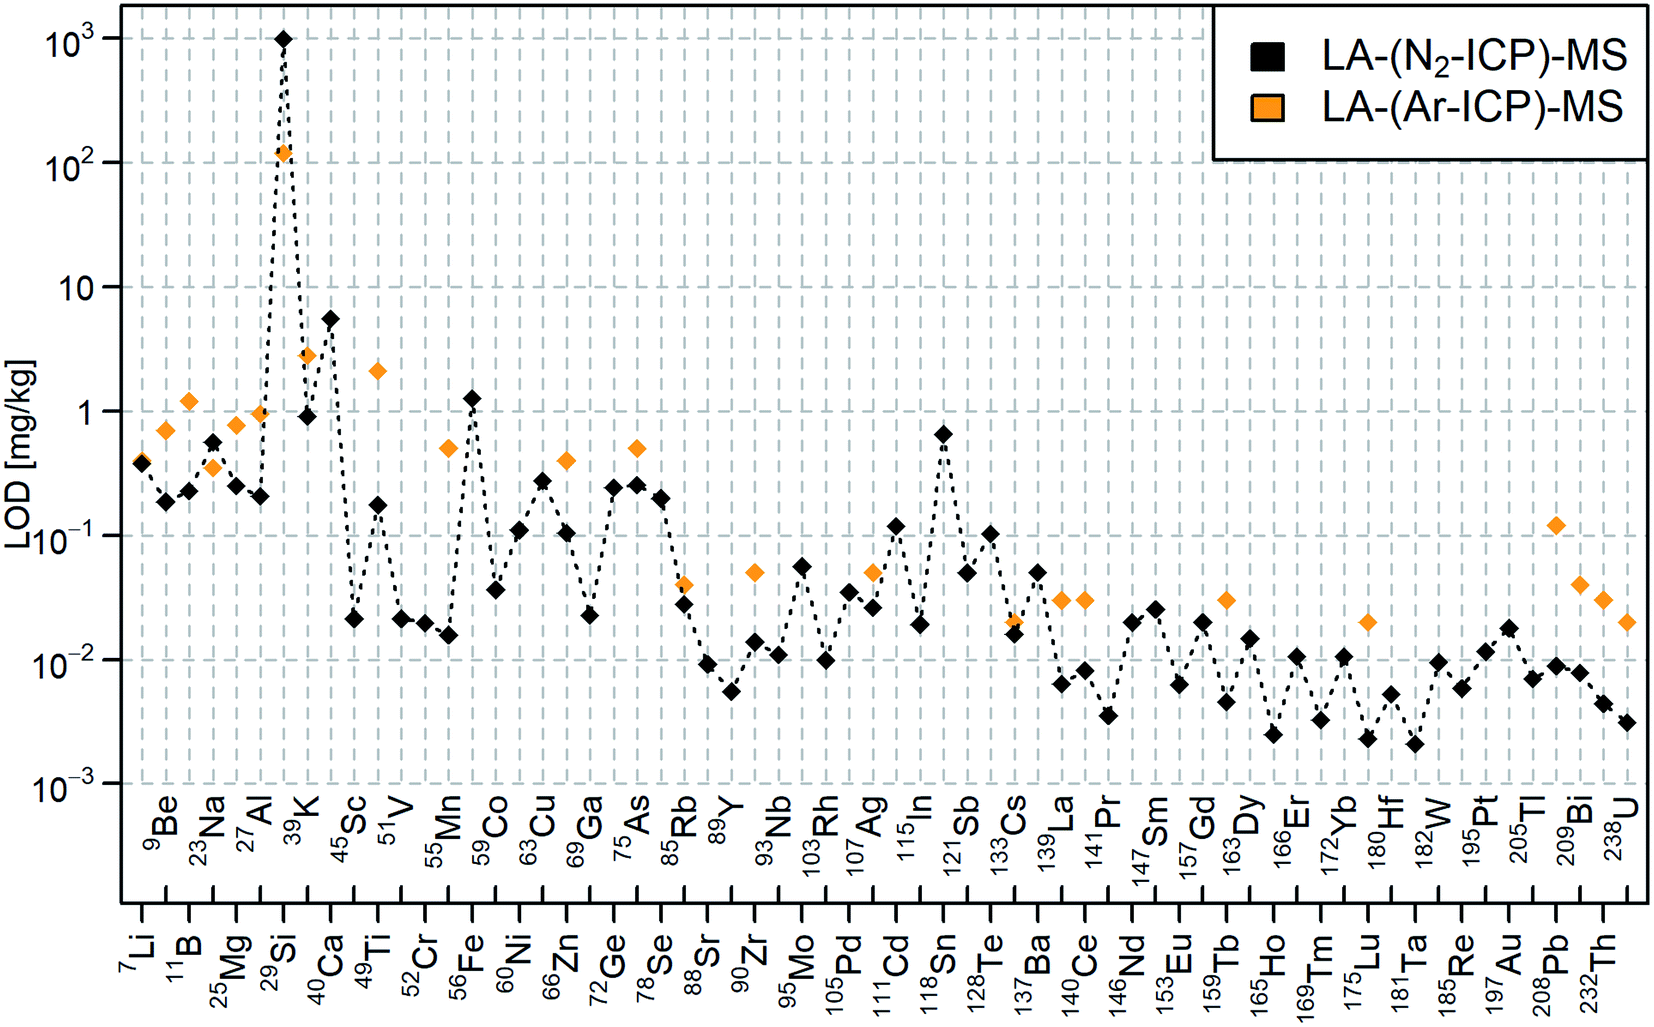 | ||
| Fig. 4 LODs for NIST SRM 610 analyzed with LA-(N2-ICP)-MS (black) and LA-(Ar-ICP)-MS (orange) according to Günther et al.23 | ||
Higher LODs were obtained for 23Na+, 29Si+, and 118Sn+. The 1.6 times higher LOD for 23Na+ could be explained by memory effects of Na in the instrument. 14N15N+ from the nitrogen plasma background interfered with 29Si+, which increased the LOD 8 times compared to LA-(Ar-ICP)-MS. 14N2+ and 14N16O+ in the gas blank interfered with the 28Si+ and 30Si+ isotopes. Contamination of Sn increased the gas blank intensity and therefore, the LOD for 118Sn+. The LOD would be substantially reduced by removing the Sn contamination. Up to now, the Sn source could not be definitely located. Due to similar background intensities of 14N4+ in LA-(N2-ICP)-MS and 40Ar16O+ in LA-(Ar-ICP)-MS, the LOD for 56Fe+ remained in a similar range.
In general, most of the LODs improved by 3–8 times compared to LA-(Ar-ICP)-MS. The elements with higher ionization potentials such as 9Be+, 11B+, 66Zn+, and 75As+ achieved similar improvements of the LODs when comparing elements with lower ionization potential such as 27Al+, 85Rb+,90Zr+, and 238U+. This indicated similar ionization efficiency of the N2-ICP for laser-generated aerosols when compared to an Ar-ICP.
The non-metal elements P (413 mg kg−1), S (575 mg kg−1), and Cl (274 mg kg−1) in NIST SRM 610 were not detectable above LOD in the LA-(N2-ICP)-MS experiments. The interference of 15N16O+ (approx. 800′000 cps) exacerbate the measurement of the monoisotopic 31P+.
Quantification
NIST SRM 612 was analyzed with LA-(N2-ICP)-MS and LA-(Ar-ICP)-MS. Different isotopes were selected for the analysis representing major elements (23Na+, 27Al+, 29Si+, 40Ca+), light elements (7Li+, 9Be+, 11B+, 25Mg+), medium mass range elements (55Mn+, 59Co+, 85Rb+, 107Ag+, 115In+), heavy elements (133Cs+, 159Tb+, 208Pb+, 232Th+, 238U+), elements with high first ionization potentials (9Be+, 11B+, 29Si+, 66Zn+, 78Se+, 75As+, 125/128Te+) and elements which are influenced by interferences in LA-(N2-ICP)-MS and/or LA-(Ar-ICP)-MS (29Si+, 39K+, 40Ca+, 52Cr+, 55Mn+, 56Fe+, 78Se+, 125/128Te+). The elements through all the mentioned groups above were quantified using LA-(N2-ICP)-MS within ± 10% with respect to their reference values (Fig. 5).38 Exceptions were 25Mg+, 78Se+, and 125/128Te+, but their quantification using LA-(Ar-ICP)-MS resulted in a very similar bias (ESI, Table S4†). This indicated once more, that laser-generated aerosols behave very similar within the nitrogen plasma compared to the argon plasma.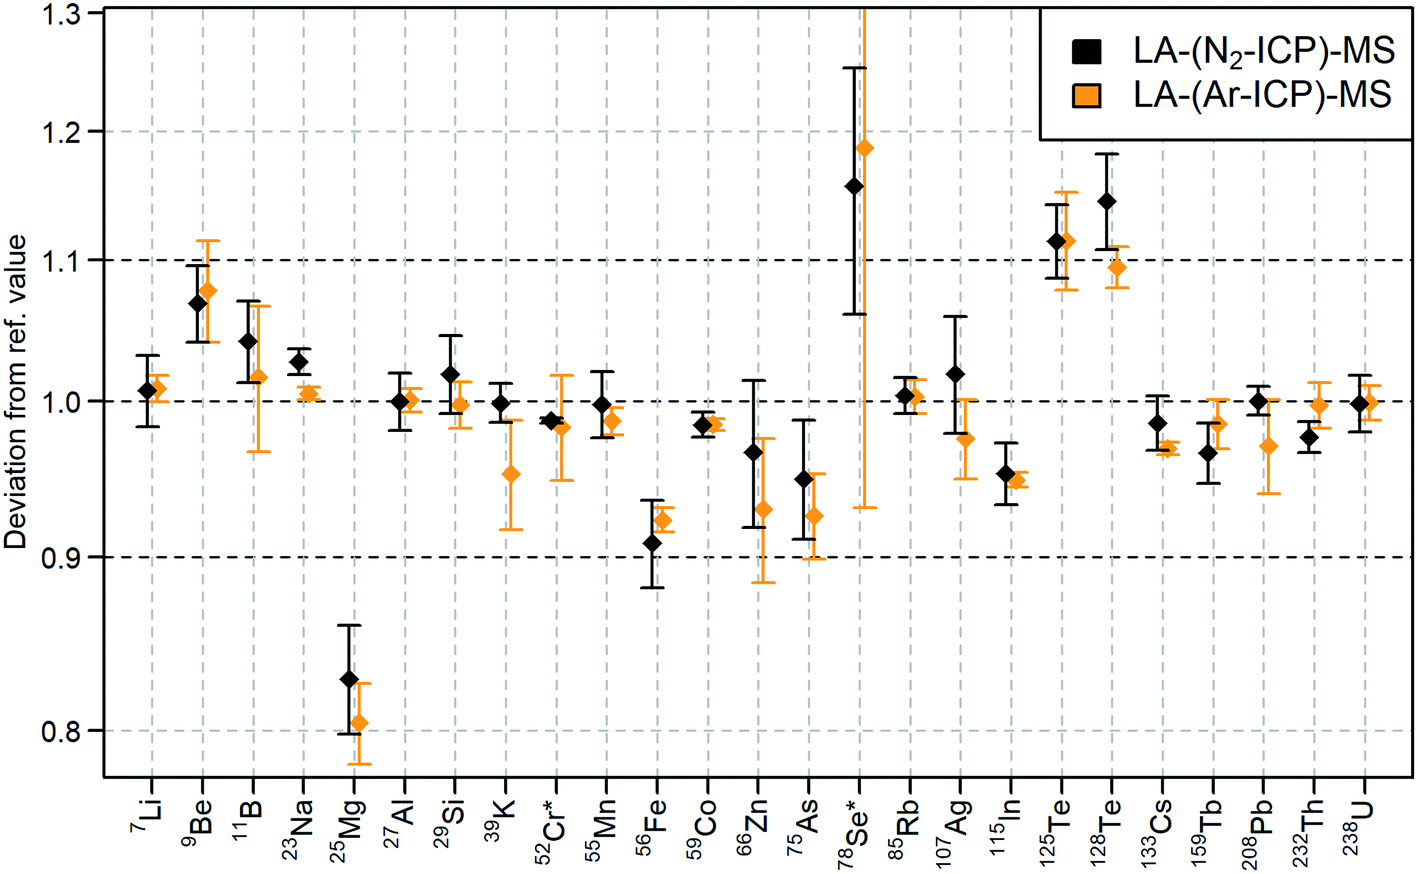 | ||
| Fig. 5 Quantification of selected elements in NIST SRM 612 with LA-(N2-ICP)-MS (black) and LA-(Ar-ICP)-MS (orange) compared to their reference values38 according to ESI, Table S4.† For the LA-(Ar-ICP)-MS measurement 53Cr+ and 77Se+ were used instead of 52Cr+ and 78Se+. The confidence intervals were calculated based on four consecutive measurements with a confidence level of 95%. | ||
In order to evaluate the accuracy of the LA-(N2-ICP)-MS analyses for low mass fractions, the rare earth elements (REEs) in BCR-2G with mass fractions of 0.5–54 mg kg−1 were quantified using NIST SRM 610 as an external standard. 40Ca+ was used as internal standard. LA-(N2-ICP)-MS operating conditions were used according to Table 1. As reported in Table 2, LA-(N2-ICP)-MS allowed the quantification of sub-mg kg−1 of REEs in BCR-2G within ± 10% regarding the reference values.37 This demonstrated the capability of LA-(N2-ICP)-MS for trace element analysis.
| Isotope | Quantified mass fraction, [mg kg−1] | BCR-2G ref. values, [mg kg−1] | Deviation from ref. value |
|---|---|---|---|
| 45Sc | 32.5 ± 1.4 | 33 ± 2 | −2% |
| 89Y | 32.6 ± 1.1 | 35 ± 3 | −7% |
| 139La | 24.4 ± 0.4 | 24.7 ± 0.3 | −1% |
| 140Ce | 50.8 ± 0.5 | 53.3 ± 0.5 | −5% |
| 141Pr | 6.6 ± 0.7 | 6.7 ± 0.4 | −3% |
| 146Nd | 27.7 ± 0.8 | 28.9 ± 0.3 | −4% |
| 147Sm | 6.5 ± 0.5 | 6.59 ± 0.07 | −4% |
| 153Eu | 1.90 ± 0.06 | 1.97 ± 0.02 | −7% |
| 157Gd | 6.7 ± 0.3 | 6.71 ± 0.07 | 0% |
| 159Tb | 1.06 ± 0.21 | 1.02 ± 0.08 | +3% |
| 163Dy | 6.3 ± 0.3 | 6.44 ± 0.06 | −3% |
| 165Ho | 1.29 ± 0.14 | 1.27 ± 0.08 | +1% |
| 166Er | 3.49 ± 0.18 | 3.70 ± 0.04 | −6% |
| 169Tm | 0.51 ± 0.03 | 0.51 ± 0.04 | 0% |
| 172Yb | 3.34 ± 0.20 | 3.39 ± 0.03 | −2% |
| 175Lu | 0.54 ± 0.11 | 0.503 ± 0.005 | +8% |
Long-term stability
The long-term stability of LA-(N2-ICP)-MS was investigated over 8 hours using NIST SRM 610. Each data point represents the average of three measurements. The plasma was started, optimized and the first measurements were taken after 15 minutes. Afterwards, the operation parameters remained unchanged over the entire measurement campaign. For the first 2.5 hours, measurements were repeated every 15 minutes, then every 30 minutes for 1.5 more hours, then every 60 minutes for another 4 hours. As 40Ca+ was used as an internal standard in this study, the signal ratios to 40Ca+ were determined and then normalized to the first measurements. During the first 1.5 hours, a larger difference in intensity ratios (Fig. 6) was observed, as for example an increase of 25% for 7Li+/40Ca+. In general, intensity ratios increased for lighter elements while heavier elements showed a decrease. This implied a mass dependent instrumental drift during warmup. After approx. two hours, the intensity ratios stabilized and variations remained below 5%. The drift of intensity ratios is known from LA-(Ar-ICP)-MS and was already taken care of using a time dependent quantification strategy for LA-(Ar-ICP)-MS.42 This approach was also applied in the quantification of NIST SRM 612 and BCR-2G using LA-(N2-ICP)-MS.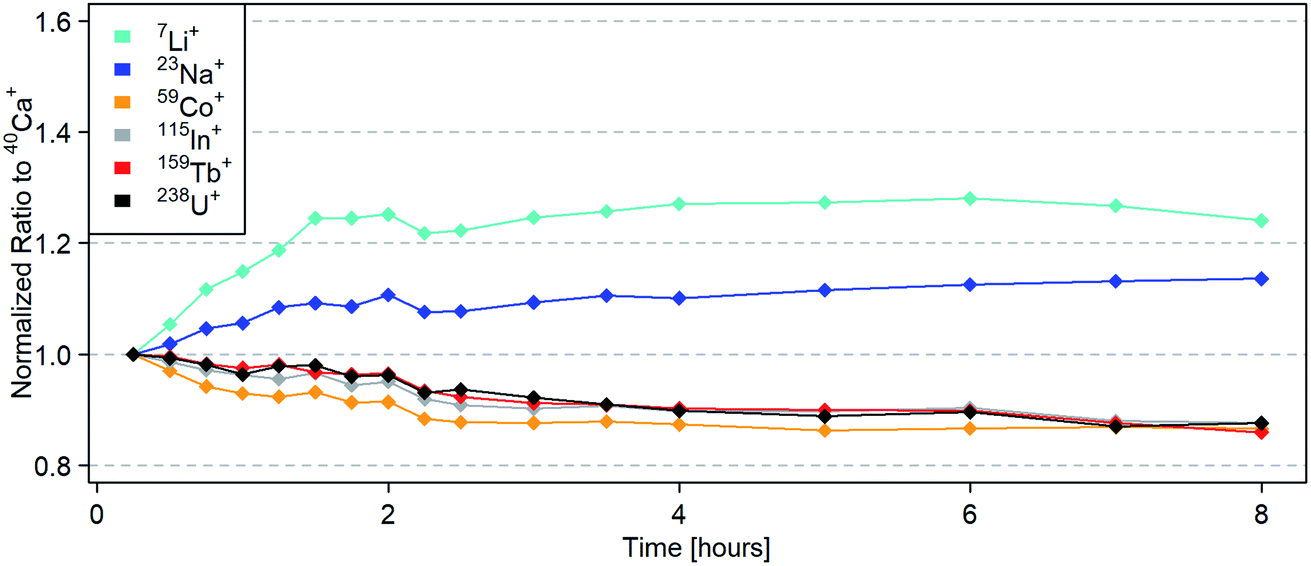 | ||
| Fig. 6 Signal ratios to 40Ca+ normalized to the average of three NIST SRM 610 measurements after 15 minutes. Significant changes in signal ratios were observed in the first 1.5–2 hours. Afterwards, the signal ratios showed a stable trend with deviations below 5%. | ||
However, the 232Th14N+/232Th+ ratio was stable over the entire measurement campaign at 0.2%. The 232Th16O+/232Th+ ratio started at 0.4% and decreased over time until it remained stable at 0.2% after two hours (ESI, Fig. S2†). The elevated 232Th16O+/232Th+ ratio in the beginning could derive from remaining residues of O2 in the ablation cell.
Conclusion
LA-(N2-ICP)-MS is a sensitive technique and suitable for the quantification of major to trace elements. In general, it achieved similar or even lower LODs compared to LA-(Ar-ICP)-MS. These general improvements are of lower importance than the fact that it could be demonstrated that same order of magnitude LODs can be achieved using a nitrogen plasma in comparison to an argon-sustained plasma. However, the LODs of K, Ca, Ti, Cr, Mn, Cu, Se, Te, and Pb were significantly improved when comparing the results to a similar (Ar-ICP)-MS system. On the other hand, the LODs for the analysis of Si, P, and Sn were significantly increased when comparing to LA-(Ar-ICP)-MS due to the plasma gas generated cluster ions and impurities of Sn. The LOD for Sn could be improved by removing this contamination in the gas supply. The LOD for Fe remained at a similar level for LA-(N2-ICP)-MS and LA-(Ar-ICP)-MS. The interference of 14N4+ in LA-(N2-ICP)-MS and 40Ar16O+ in LA-(Ar-ICP)-MS did not allow the measurement of 56Fe+ at a lower LOD as for example for V or Co.As demonstrated, the gas blank of the (N2-ICP)-MS contained significantly less interferences originating from plasma species when compared to the (Ar-ICP)-MS. Cluster ions formed as argides were not observed when using the nitrogen plasma source. However, nitride cluster ions were formed and need to be considered in further studies. Most of the gas blank signals can be explained by the respective cluster ions. The origin of the ions at m/z 80, 82, 108, and 110 remained unknown. The (N2-ICP)-MS was stable after 1.5–2 hours of warm up time.
Overall, LA-(N2-ICP)-MS provided a very similar performance in comparison to LA-(Ar-ICP)-MS and achieved similar vaporization, atomization and ionization efficiencies for laser-generated aerosols. In contrast to LA-(Ar-ICP)-MS, various isotopes benefit from the absence of argon as plasma gas in LA-(N2-ICP)-MS, especially in the mass range below m/z 80. Considering operating cost of the MICAP plasma source, LA-(N2-ICP)-MS has a high potential to compete with or even replace LA-(Ar-ICP)-MS in the future.
Conflicts of interest
There are no conflicts to declare.Acknowledgements
The authors acknowledge the support from Ashok Menon and Jovan Jevtic of Radom Corp. and the financial support through the Swiss National Science Foundation, project number SNF 200021_197224.References
- R. S. Houk, V. A. Fassel, G. D. Flesch, H. J. Svec, A. L. Gray and C. E. Taylor, Anal. Chem., 1980, 52, 2283–2289 CrossRef CAS.
- A. L. Gray, Analyst, 1985, 110, 551–556 RSC.
- D. Günther and B. Hattendorf, TrAC, Trends Anal. Chem., 2005, 24, 255–265 CrossRef.
- R. J. Reeder and J. C. Grams, Geochim. Cosmochim. Acta, 1987, 51, 187–194 CrossRef CAS.
- C. I. Prince, J. Kosler, D. Vance and D. Günther, Chem. Geol., 2000, 168, 255–274 CrossRef CAS.
- J. S. Becker, M. V. Zoriy, C. Pickhardt, N. Palomero-Gallagher and K. Zilles, Anal. Chem., 2005, 77, 3208–3216 CrossRef CAS PubMed.
- R. W. Hutchinson, A. G. Cox, C. W. McLeod, P. S. Marshall, A. Harper, E. L. Dawson and D. R. Howlett, Anal. Biochem., 2005, 346, 225–233 CrossRef CAS PubMed.
- C. Latkoczy, S. Becker, M. Dücking, D. Günther, J. Hoogewerff, J. Almirall, J. Buscaglia, A. Dobney, R. D Koons, S. Berends-Montero, G. J. Q. van der Peijl, W. R. S. Stoecklein, T. Trejos, J. Watling and V. S Zdanowicz, J. Forensic Sci., 2005, 50, 1327–1341 CrossRef CAS PubMed.
- C. Giesen, H. A. O. Wang, D. Schapiro, N. Zivanovic, A. Jacobs, B. Hattendorf, P. J. Schüffler, D. Grolimund, J. M. Buhmann, S. Brandt, Z. Varga, P. J. Wild, D. Günther and B. Bodenmiller, Nat. Methods, 2014, 11, 417 CrossRef CAS PubMed.
- A. Gundlach-Graham, M. Burger, S. Allner, G. Schwarz, H. A. O. Wang, L. Gyr, D. Grolimund, B. Hattendorf and D. Günther, Anal. Chem., 2015, 87, 8250–8258 CrossRef CAS PubMed.
- M. Burger, A. Gundlach-Graham, S. Allner, G. Schwarz, H. A. Wang, L. Gyr, S. Burgener, B. Hattendorf, D. Grolimund and D. Gunther, Anal. Chem., 2015, 87, 8259–8267 CrossRef CAS.
- S. H. Tan and G. Horlick, Appl. Spectrosc., 1986, 40, 445–460 CrossRef CAS.
- K. Oishi, T. Okumoto, T. Iino, M. Koga, T. Shirasaki and N. Furuta, Spectrochim. Acta, Part B, 1994, 49, 901–914 CrossRef.
- T. W. May and R. H. Wiedmeyer, At. Spectrosc., 1998, 19, 150–155 CAS.
- T. Ohno, Y. Muramatsu, Y. Shikamori, C. Toyama, N. Okabe and H. Matsuzaki, J. Anal. At. Spectrom., 2013, 28, 1283–1287 RSC.
- L. Balcaen, E. Bolea-Fernandez, M. Resano and F. Vanhaecke, Anal. Chim. Acta, 2015, 894, 7–19 CrossRef CAS PubMed.
- J. S. Becker and H. J. Dietze, Fresenius. J. Anal. Chem., 1997, 359, 338–345 CrossRef CAS.
- S. Hirata, H. Toshimitsu and M. Aihara, Anal. Sci., 2006, 22, 39–43 CrossRef CAS PubMed.
- M. Schild, A. Gundlach-Graham, A. Menon, J. Jevtic, V. Pikelja, M. Tanner, B. Hattendorf and D. Günther, Anal. Chem., 2018, 90, 13443–13450 CrossRef CAS PubMed.
- P. R. D. Mason and W. J. Kraan, J. Anal. At. Spectrom., 2002, 17, 858–867 RSC.
- Z. Yang, S. E. Jackson, L. J. Cabri, P. Wee, H. P. Longerich and M. Pawlak, J. Anal. At. Spectrom., 2020, 35, 534–547 RSC.
- B. Hattendorf and D. Günther, J. Anal. At. Spectrom., 2000, 15, 1125–1131 RSC.
- D. Günther, B. Hattendorf and A. Audétat, J. Anal. At. Spectrom., 2001, 16, 1085–1090 RSC.
- C. I. M. Beenakker, Spectrochim. Acta, Part B, 1976, 31, 483–486 CrossRef.
- Y. Okamoto, M. Yasuda and S. Murayama, Jpn. J. Appl. Phys., 1990, 29, L670–L672 CrossRef CAS.
- M. R. Hammer, Spectrochim. Acta, Part B, 2008, 63, 456–464 CrossRef.
- D. Zhu, W. Jin, B. Yu, Y. Ying, H. Yu, J. Shan, Y. Yan, C. Xu, B. Wang and Q. Jin, Chem. Res. Chin. Univ., 2017, 33, 709–713 CrossRef CAS.
- D. A. Wilson, G. H. Vickers and G. M. Hieftje, Anal. Chem., 1987, 59, 1664–1670 CrossRef CAS.
- W.-L. Shen, T. M. Davidson, J. T. Creed and J. A. Caruso, Appl. Spectrosc., 1990, 44, 1003–1010 CrossRef CAS.
- Y. Okamoto, J. Anal. At. Spectrom., 1994, 9, 745–749 RSC.
- J. Jevtic, A. Menon and V. Pikelja, US Pat., PCT/US2014/024306, 2014 Search PubMed.
- G. W. Dickinson and V. A. Fassel, Anal. Chem., 1969, 41, 1021–1024 CrossRef CAS.
- A. J. Schwartz, Y. Cheung, J. Jevtic, V. Pikelja, A. Menon, S. J. Ray and G. M. Hieftje, J. Anal. At. Spectrom., 2016, 31, 440–449 RSC.
- H. Wiltsche and M. Wolfgang, J. Anal. At. Spectrom., 2020, 35, 2369–2377 RSC.
- J. Koch, M. Wälle, R. Dietiker and D. Günther, Anal. Chem., 2008, 80, 915–921 CrossRef CAS PubMed.
- S. M. Eggins, L. P. J. Kinsley and J. M. G. Shelley, Appl. Surf. Sci., 1998, 127–129, 278–286 CrossRef CAS.
- K. P. Jochum and U. Nohl, Chem. Geol., 2008, 253, 50–53 CrossRef CAS.
- K. P. Jochum, U. Weis, B. Stoll, D. Kuzmin, Q. Yang, I. Raczek, D. E. Jacob, A. Stracke, K. Birbaum, D. A. Frick, D. Günther and J. Enzweiler, Geostand. Geoanal. Res., 2011, 35, 397–429 CrossRef CAS.
- M. B. Fricker, PhD thesis, ETH Zurich, 2012.
- RStudioTeam, RStudio: Integrated Development for R, RStudio Inc., Boston, MA, 2019 Search PubMed.
- RCoreTeam, R: A Language and Environment for Statistical Computing, R Foundation for Statistical Computing, Vienna, Austria, 2020 Search PubMed.
- H. P. Longerich, S. E. Jackson and D. Gunther, J. Anal. At. Spectrom., 1996, 11, 899–904 RSC.
- B. Hattendorf, C. Latkoczy and D. Günther, Anal. Chem., 2003, 75, 341a–347a CrossRef PubMed.
Footnote |
| † Electronic supplementary information (ESI) available. See DOI: 10.1039/d1ja00205h |
| This journal is © The Royal Society of Chemistry 2021 |