
Development of methods for Mg, Sr and Pb isotopic analysis of crude oil by MC-ICP-MS: addressing the challenges of sample decomposition†
Alessandra S.
Henn
 a,
Stepan M.
Chernonozhkin
b,
Frank
Vanhaecke
b and
Erico M. M.
Flores
*a
a,
Stepan M.
Chernonozhkin
b,
Frank
Vanhaecke
b and
Erico M. M.
Flores
*a
aDepartamento de Química, Universidade Federal de Santa Maria, Santa Maria, RS 97105-900, Brazil. E-mail: ericommf@gmail.com; Tel: +55 55 3220 9445
bAtomic and Mass Spectrometry – A&MS Research Unit, Department of Chemistry, Ghent University, Campus Sterre, Krijgslaan 281-S12, Ghent, 9000, Belgium
First published on 25th May 2021
Abstract
New approaches in isotope geochemistry require the development of novel methods for the isotopic analysis of crude oil, a typically complex and very hard to digest organic geological matrix. In this work, methods were developed for the determination of isotope ratios of Mg, Sr and Pb in crude oil by multi-collector inductively coupled plasma-mass spectrometry (MC-ICP-MS). Two sample preparation methods, (i) microwave-assisted wet digestion within an ultra-high pressure digestion cavity (MAWD-PDC) and (ii) solubilization of inorganic solids as obtained after the ASTM D4807 test method, were evaluated. Using MAWD-PDC, up to 0.5 g of crude oil was efficiently digested using only 6 mL of 14.4 mol L−1 HNO3 (75 min, temperature up to 250 °C). MAWD-PDC was shown to be a suitable sample preparation method for subsequent determination of Mg, Sr and Pb isotope ratios. On the other hand, the ASTM method does not require sophisticated equipment. With this approach up to 10 g of oil can be dissolved in toluene and filtered through a nylon membrane and elements present as inorganic solids, such as Mg and Sr, are retained on the membrane and can be easily recovered in water. However, Pb was not recovered. Column chromatographic protocols for target element isolation were fine-tuned for each analyte to ensure quantitative yields. No statistical difference was observed between the results for Mg and Sr isotope ratios obtained using both sample preparation methods. A proof-of-concept study showed that the Mg–Sr–Pb isotopic composition of the Brazilian crude oils was within the range observed for seawater and the deposit bedrock, suggesting that the methods developed can be considered as promising tools to decipher the formation history of oil reservoirs.
1. Introduction
Crude oil is a mixture of naturally occurring hydrocarbons, usually in a liquid state, which can contain sulfur-, nitrogen- and oxygen-containing compounds, in addition to some metals and other trace elements.1 Variations in the composition and characteristics of crude oil can be observed in terms of viscosity, density, N and S content, and the presence and levels of acids, metals, asphaltenes and resins, among others, which make crude oil a very complex matrix.2,3 Hydrocarbons can be present in the form of paraffinic, naphthenic and aromatic hydrocarbons.3 The presence of higher levels of aromatic hydrocarbons in combination with asphaltenes and resins can increase the stability of crude oil, making this matrix very difficult to digest. Metals can be present in the crude oil as inorganic salts, as chlorides and/or sulfates (for example, for Ca, K, Mg and Na), and/or in the form of organometallic compounds (for example, for Cu, Ni and V).2–4Information related to the geological formation processes, degree of evolution of certain fluids and rocks, origin, type and migration of crude oil is imprinted in the isotopic composition of certain proxy elements in crude oil.5 The isotopic composition of elements containing a daughter nuclide(s) formed by the decay of naturally occurring radionuclides can be used to establish a link between the oil and the source rock, and this knowledge can be useful in crude oil exploration activities.6,7 Other elements show natural variation in their isotopic composition due to isotope fractionation accompanying the geological processes involved and provide information on the conditions under which these proceeded. Finally, isotopic compositions of multiple elements can be used as a fingerprint for crude oil provenance in forensic applications. The radiogenic decay couples 187Re–187Os and 147Sm–143Nd, as well as isotope ratios of transition metals, such as V, Ni, and Mo, have recently been used as proxies of petrogenesis of hydrocarbon reservoirs.5–7 Traditionally carbon, hydrogen, nitrogen, and sulfur isotopic compositions are measured in crude oil towards this end, but these are not common elements in silicate rocks to which oil reservoirs are associated, calling for novel “isotopic tools” in crude oil geochemistry.
Mg, Sr and Pb have been used as isotopic proxies in geochemical, environmental and/or biomedical applications. The isotopic analysis of Mg, Sr and Pb has been performed in many matrices already, including environmental samples,8,9 geological and archeological materials,10–12 biological fluids and tissues.13 However, only a limited number of works have reported on Sr and Pb isotopic analysis of crude oil (e.g., only a single work was found for Sr).14–19 Moreover, to the best of the authors' knowledge, no papers have reported Mg isotopic analysis of crude oil so far. As a result, information on the isotopic composition of these elements in crude oil is still lacking, hampering their potential use as geochronometers and/or proxies.
Multi-collector inductively coupled plasma-mass spectrometry (MC-ICP-MS) is widely used for high-precision isotope ratio measurements.20 However, it requires chemical isolation of the target element (Mg, Sr or Pb) prior to analysis in order to enable reliable correction for the bias caused by instrumental mass discrimination. The most commonly used approach for purification is column chromatography by means of an ion exchange or extraction resin.10,12,13 However, before purification, crude oil samples have to be efficiently digested. A major challenge in crude oil analysis is the sample decomposition step,21 as an efficient decomposition of the crude oil matrix is not always achieved. Most of the works so far rely on time-consuming digestion methods and use large amounts of concentrated reagents, which may affect the blank levels. This challenge is even more difficult if medium or heavy crude oils must be analyzed. In order to overcome these limitations, methods using microwave radiation have been used for acid digestion of crude oils for their subsequent elemental determination using a variety of analytical techniques.21
As an alternative, recently developed ultra-high pressure systems, such as the single reaction chamber system22 (SRC, UltraWAVE™, Milestone, Italy) or the pressurized digestion cavity system23 (PDC, Multiwave 7000, Anton Paar, Austria), allow higher digestion temperatures and pressures (up to 300 °C and 199 bar for both equipment)22,23 than conventional systems, thus assuring a more efficient digestion. In recent works, these systems have been successfully applied to the digestion of several complex matrices,24–28 including crude oil,29 for subsequent metal and metalloid determination. It enabled the digestion of a relatively high sample mass (up to 1 g of heavy crude oil) achieving low values of residual carbon and residual acidity, making the digests compatible with analysis using plasma-based techniques.29
The goal of the present work was to develop methods for Mg, Sr and Pb isotopic analysis of medium crude oil using high-precision MC-ICP-MS to provide the community with analytical tools for oil provenancing and tracing of oil deposit formation. Of course, a successful approach requires an efficient decomposition method. In this context, microwave-assisted wet digestion with a pressurized digestion cavity (MAWD-PDC) and, alternately, a method based on the solubilization of inorganic solids as obtained after the ASTM D4807 test method (standard test method for sediment in crude oil by membrane filtration from the American Society for Testing and Materials) were evaluated.30 The ultimate goal was to provide a straightforward analytical protocol, enabling the (relevant) isotope ratios of these elements (Mg, Sr and Pb) to be used as proxies for the petrogenesis of oil reservoirs and for oil provenance. Mass-dependent isotope fractionation of Sr was not of interest in current study, as the radiogenic ingrowth of 87Sr provides a more suitable proxy for provenance. Special attention was paid to fine-tuning the column chromatography isolation protocols, rendering them suited for the sample solution matrices as obtained upon crude oil decomposition.
2. Experimental
2.1 Instrumentation
A Thermo Scientific Neptune series MC-ICP-MS instrument (Germany) in operation at Ghent University was used for isotope ratio measurements. The instrument was equipped with a 100 μL min−1 PFA concentric nebulizer, a double spray chamber with cyclonic and Scott-type sub-units, and a quartz torch with a 1.0 mm inner diameter injector. Instrument settings and data acquisition parameters are summarized in Table S1, ESI.† The concentration of target and major elements was determined using a Thermo Scientific Element XR sector field ICP-MS instrument, equipped with a 200 μL min−1 quartz nebulizer, mounted onto a cyclonic spray chamber. Torch position, gas flow rates and lens settings were optimized in order to obtain high signal intensity (Li, In and U) and low oxide levels (UO+/U+). Samples and standards were prepared in 2% (v/v) HNO3 and In was added as an internal standard (final concentration of 1 μg L−1) to correct for instrument instability and matrix effects.Crude oil samples were acid-digested using a high-pressure Multiwave 7000 microwave unit (Anton Paar, Austria). This unit is equipped with a rack for five 80 mL pressure-sealed quartz vials in a 1 L stainless steel microwave digestion cavity with a polytetrafluoroethylene liner, pressurized with N2. The maximum temperature, pressure and microwave power that the system can attain is 300 °C, 199 bar and 1700 W, respectively.
2.2 Reagents, materials and samples
Only high-purity reagents and acids were used throughout the experiments. Water (resistivity > 18.2 MΩ cm) was obtained from a Milli-Q element water purification system (Merck Millipore, USA). Trace metal analysis grade Primar Plus nitric acid (68%, 1.42 kg L−1, Fisher Chemicals, UK) and hydrochloric acid (37%, 1.18 kg L−1, Fisher Chemicals, UK) were purified by sub-boiling in a Savillex DST-4000 unit (Savillex Corporation, USA). Ultrapure 9.8 mol L−1 hydrogen peroxide and ACS grade acetone were purchased from Sigma Aldrich (Belgium). Trace metal grade hydrofluoric acid (47–51%) was acquired from Seastar Chemicals Inc. (Canada). Toluene and isopropanol (Sigma-Aldrich, Germany) were used in the solubilization method. All sample preparation procedures prone to contamination were carried out in a metal-free class-10 clean lab facility at Ghent University (Picotrace, Germany).For Mg isotopic analysis, the ERM-AE143 reference material acquired from BAM (Federal Institute for Materials Research and Testing, Germany)31 and the widely accepted DSM3 Mg32 were used. A standard solution of Mg (Inorganic Ventures, USA, lot K2-MG650434) was used as an in-house isotopic standard. For Sr isotopic analysis, NIST SRM 987 isotopic reference material obtained from the National Institute for Standards and Technology (NIST, USA) was used. For Pb, isotopic reference materials of Pb (NIST SRM 981) and Tl (NIST SRM 997) were used. Two standard solutions of Pb (Inorganic Ventures, lot G2-PB03044 and lot D2-PB03020) were used as in-house isotopic standards and these solutions will be termed as “Pb in-house I” and “Pb in-house II”.8,33 In-house isotopic standard solutions were used daily for validation of the accuracy and precision of the isotope ratio measurements and did not go through sample preparation.
Five crude oil samples named “A” to “E” from different reservoirs in Brazil, with American Petroleum Institute (API) gravity ranging from 26 to 29 (medium crude oil), were used in the development of the novel methodology. As there are no crude oil reference materials with certified isotopic compositions for Sr, Mg or Pb, SRM 1634c (Trace Elements in Fuel Oil) certified reference material (CRM) from NIST was used in this context, potentially allowing its use in future inter-laboratory studies. Before the analysis, the samples were manually homogenized for 5 min.
2.3 Sample preparation methods
For MAWD-PDC, samples (500 mg) were weighed inside quartz vessels, and 6 mL of 14.4 mol L−1 HNO3 were added. Samples were pre-digested at 100 °C by immersing the vessels in a boiling water bath for 1 h. Afterwards, samples were placed inside the liner already filled with 150 mL of water and 5 mL of HNO3 and the microwave cavity was pressurized at 40 bar N2 for digestion. The microwave heating program was: (i) 5 min ramp to 90 °C; (ii) 10 min ramp to 110 °C, temperature kept for 5 min; (iii) 10 min ramp to 120 °C; (iv) 10 min ramp to 130 °C; and (v) 20 min ramp to 250 °C, temperature kept for 15 min. After cooling, the digests were collected in Savillex® PFA beakers and evaporated to near-dryness at 90 °C.For the method of crude oil solubilization with toluene following ASTM D4807 (ref. 30) and further dissolution of the inorganic solids (retained on the membrane after filtration), 2 to 10 g of crude oil were weighed in a glass beaker and 100 mL of toluene were added. This mixture was heated (at 90 °C) and filtered under vacuum through a 0.45 μm nylon membrane filter (Sigma-Aldrich, Germany). After washing the membrane with hot toluene (at 90 °C) and drying it in an oven (at 105 °C), it was transferred into a polypropylene vessel containing 25 mL of water and stirred for 1 h in a mechanical stirring system (TE 420, Tecnal, Brazil). Elements present as inorganic solids, such as Mg and Sr, are extracted and subsequently solubilized under these conditions. Finally, the solutions were transferred to Savillex® PFA beakers and evaporated to near-dryness at 90 °C.
2.4 Isolation procedure
The isolation protocols used in this work are based on previous developments,10,11,13,34 but needed to be fine-tuned for application to the crude oil digests/extracts and thus, they are only briefly described here. For Mg isolation, 2 mL polypropylene columns (Eichrom Technologies, France) with AG50WX8 strong cation exchange resin (hydrogen form, 100–200 mesh size, Bio-Rad, USA) were used. One mL polypropylene BioSpin columns (Bio-Rad) with Sr resin (SR-B100-A, 100-150 μm, TrisKem International, France) were used for Sr and Pb isolation. After the evaporation step (for both MAWD-PDC and ASTM procedures), the residues were dissolved in 1 mL of 0.4 mol L−1 HCl for Mg isolation or in 1 mL of 7 mol L−1 HNO3 for Sr and Pb isolation. The isolation protocols used for each analyte are shown in Table 1. All the steps of solubilization, evaporation to near-dryness, target element isolation and related procedures were carried out in a metal-free class-10 clean lab facility.| Step | Reagents | |
|---|---|---|
| Mg | Sr and Pb | |
| Cleaning | 10 mL H2O | 6 mL H2O |
| 30 mL 7 mol L−1 HCl | 10 mL 6 mol L−1 HCl | |
| 20 mL H2O | 3 mL H2O | |
| Conditioning | 10 mL 0.4 mol L−1 HCl | 1 mL 7 mol L−1 HNO3 |
| Sample loading | 1 mL in 0.4 mol L−1 HCl | 1 mL in 7 mol L−1 HNO3 |
| Matrix removal | 28 mL 0.4 mol L−1 HCl | 4 mL 7 mol L−1 HNO3 |
| 3 mL 0.15 mol L−1 HF | ||
| 10 mL 0.5 mol L−1 HCl:95% acetone | ||
| 1 mL 0.8 mol L−1 HCl | ||
| Analyte elution | 23 mL 0.8 mol L−1 HCl | 4 mL H2O (Sr collection) |
| 1 mL 3 mol L−1 HCl (change of medium) | ||
| 4 mL 8 mol L−1 HCl (Pb collection) | ||
After analyte elution, the fractions collected in Savillex® PFA beakers were evaporated to near-dryness at 90 °C, re-dissolved in 2 mL of 14.4 mol L−1 HNO3, after which the beakers were closed and heated on a hot plate at 110 °C overnight. After that, the pure fractions were evaporated to near-dryness at 90 °C and the residues subsequently re-dissolved in 1 mL of 2% (v/v) HNO3 for element determinations and isotope ratio measurements. Two procedural blanks were included in each batch (10 columns) of samples.
2.5 Mg, Sr and Pb isotope ratio measurements
For Mg, Sr and Pb isotope ratio measurements, each crude oil sample was analyzed in triplicate, including sample preparation and analyte isolation, with each purified target element fraction measured three times. Mg isotope ratio measurements were carried out following a protocol described earlier.13,31 External correction for instrumental mass discrimination was accomplished using ERM-AE143 as an external standard, measured in a sample-standard bracketing (SSB) approach. Samples and standards were diluted in 2% (v/v) HNO3 to approximately 60 μg L−1 of Mg (for solutions obtained after MAWD-PDC) or 150 μg L−1 of Mg (for solutions obtained after solubilization). The Mg in-house standard and DSM3 solution were measured regularly for quality control purposes. The 26Mg/24Mg and 25Mg/24Mg ratios were expressed in delta notation (δ26Mg and δ25Mg, in per mil, ‰) relative to DSM3, and calculated according to δx/24Mg = ((xMg/24Mg)sample/(xMg/24Mg)DSM3 − 1) × 1000, where x is 25 or 26.13,31Sr isotope ratio measurements were performed following a protocol described earlier by De Muynck et al.34 All samples were measured in a SSB sequence with a solution of the isotopic reference material NIST SRM 987 as bracketing isotopic standard. The purified fractions and standards were diluted in 2% (v/v) HNO3 to 60 and 150 μg L−1 of Sr for the analysis of solutions obtained upon MAWD-PDC and solubilization, respectively. In this case, instrumental mass discrimination was corrected for using Russell's equation35,36 based on a 88Sr/86Sr ratio of 8.375209 (the value conventionally accepted by the International Union of Geosciences).37 The contribution of Rb at m/z 87 was corrected for by monitoring 85Rb and using the Rb isotopic composition as provided in the IUPAC table38 for mathematical correction and also the contributions from 84Kr and 86Kr were corrected for.39 An additional SSB external correction using 87Sr/86Sr = 0.710248 ± 0.000012 was applied to correct for potential minor drift.34
Pb isotope ratio measurements were performed following a protocol described earlier.8,33 Correction for instrumental mass discrimination was accomplished following the method described by Baxter et al. relying on spiked Tl as an internal standard.40 This was followed by an external correction via a SSB approach. Samples and NIST SRM 981 Pb solution were diluted with 2% (v/v) HNO3 to 15 μg L−1 of Pb. NIST SRM 997 Tl was added to samples and standards at a concentration of 5 μg L−1. The measurement of 202Hg and 204Pb was performed using the Faraday collectors L3 and L1 connected to 1013 Ω resistors (Table S1, ESI†), and Tau correction was performed online, based on a constant tau value, determined at the time of installation of the MC-ICP-MS unit.41 For correcting for the contribution of the isobaric overlap of 204Hg on 204Pb, the signal of 202Hg was monitored and the Hg isotopic composition as provided in the IUPAC table38 was relied on for mathematical correction.
3. Results and discussion
3.1 Crude oil decomposition methods
When considering crude oil digestion, converting the samples into aqueous solutions is not a simple task due to the high chemical resistance towards acid decomposition of this matrix.21,29,42,43 Sample preparation can be considered a critical step, because it is prone to contamination, potential analyte losses and/or incomplete decomposition and thus, it can be a challenging step within the analytical procedure.21 The methods typically used for the preparation and analysis of crude oil have some limitations, such as the use of a low sample mass, low throughput and/or high limits of quantification (LOQs).21 In this work, two sample preparation methods were compared for crude oil decomposition and subsequent Mg, Sr and Pb isotopic analysis.Crude oil samples were decomposed by MAWD-PDC and the ASTM D4807 solubilization method. After MAWD-PDC clear pale-yellow solutions were obtained, while clear colourless solutions were obtained after using the ASTM D4807 solubilization method. The Mg and Sr concentrations obtained using both sample preparation methods are shown in Table 2. In addition, also Pb concentrations obtained after MAWD-PDC are shown. The solubilization method was not suitable for Pb recovery, because Pb is not retained on the nylon membrane filter (possibly, this analyte is present in crude oil as organic complexes that are not retained with the inorganic fraction present in crude oil). A certified reference material of residual fuel (NIST 1634c) was digested by MAWD-PDC and the results (presented in Table 2) are in agreement with the data reported in previous works.44,45
| Sample | Method | Concentration, μg g−1 | ||
|---|---|---|---|---|
| Mg | Sr | Pb | ||
| a nd: not determined. | ||||
| A | MAWD-PDC | 12.5 ± 1.9 | 2.86 ± 0.13 | 0.203 ± 0.024 |
| Solubilization | 9.98 ± 1.54 | 2.30 ± 0.40 | nd | |
| B | MAWD-PDC | 50.7 ± 3.6 | 5.95 ± 0.34 | 0.059 ± 0.006 |
| Solubilization | 48.6 ± 1.9 | 6.06 ± 0.21 | nd | |
| C | MAWD-PDC | 3.27 ± 0.33 | 0.340 ± 0.050 | 0.091 ± 0.007 |
| Solubilization | 2.93 ± 0.13 | 0.324 ± 0.016 | nd | |
| D | MAWD-PDC | 199 ± 10 | 20.3 ± 1.0 | 0.193 ± 0.017 |
| Solubilization | 201 ± 9 | 19.5 ± 1.1 | nd | |
| E | MAWD-PDC | 33.7 ± 1.5 | 12.8 ± 0.8 | 0.161 ± 0.012 |
| Solubilization | 32.5 ± 1.5 | 12.8 ± 0.7 | nd | |
| NIST 1634c | MAWD-PDC | 1.67 ± 0.12 | 0.386 ± 0.022 | 0.412 ± 0.020 |
| Literature values | 1.69 ± 0.07 [ref. 44] | 0.390 ± 0.020 [ref. 45] | 0.380 ± 0.014 [ref. 45] | |
| 1.78 ± 0.23 [ref. 45] | ||||
As can be seen in Table 2, the results obtained for Mg and Sr after MAWD-PDC and solubilization were overall in good agreement, confirming quantitative recoveries of the target elements from crude oil matrix (except for Pb using the solubilization method) and enabling the application of both crude oil pretreatment methods for Mg and Sr isotopic analysis. Mg and Sr concentrations obtained via the two decomposition methods agree with one another within experimental uncertainty, thus suggesting that either solid particles are not a significant reservoir of these elements, or these solid particles are dissolved in the process of crude oil solubilization. The concentrations of Mg and Sr in the crude oils analyzed here range from 2.93 to 201 μg g−1 and 0.32 to 20 μg g−1, respectively. As expected, the concentration of Pb in crude oil samples was very low, ranging from 0.059 to 0.203 μg g−1 only.
The solubilization method allows to process a higher sample mass compared to MAWD-PDC (from 2 g for sample D to up to 10 g for sample A). This is important when considering isotopic analysis of elements such as Mg and Sr, which can be present at low concentration in crude oil. Thus, for Mg and Sr isotope ratio measurements by MC-ICP-MS, after purification, digests obtained by MAWD-PDC were diluted to 60 μg L−1, and solutions obtained by the solubilization method were diluted to 150 μg L−1.
Table S2 (ESI†) provides a comparison of the sample preparation methods used in the context of Sr and Pb isotopic analysis of crude oil reported in the literature and those used in this work. Only one such work was found for Sr.14 Moreover, no publication was found for Mg isotopic analysis of crude oil. Thus, information on the isotopic composition of Mg, Sr and Pb in crude oils is still lacking. From Table S2 (ESI†), one can see that previous publications reported the use of conventional methods, such as acid digestion followed by dry ashing,14 liquid–liquid extraction15,16 or the use of a high-pressure asher.17,18 None of the publications so far rely on the use of ultra-high pressure systems with microwave radiation (as MAWD-PDC), which allow for the fast heating of the sample and use digestion temperatures and pressures (up to 300 °C and 199 bar) higher than those in conventional systems, bringing important advantages over the previous approaches. Moreover, the method of solubilization of inorganic solids after the ASTM D4807 was also not yet reported for elemental analysis or isotopic analysis of crude oil. The method of solubilization presents advantages in comparison with other methods reported in the literature, such as the possibility of using a high sample mass (up to 10 g), the fact that no sophisticated equipment is required and that no halogenated solvents are required. In addition, elements such as Sr and Mg can be easily recovered in water.
3.2 Mg isolation procedure
The use of cation exchange resin AG50W-X8 (100–200 mesh, hydrogen form) to isolate Mg from geological11 and biological materials13 was already described in previous papers. However, in this work, the procedure needed to be optimized and adapted to the composition of crude oil digests/extracts, as the isolation protocol is sensitive to the major element composition, and the matrix of crude oil is different from that of other geological and of biological materials. Moreover, the elemental compositions of the solutions obtained after MAWD-PDC and solubilization, respectively, are significantly different (Table S3, ESI†). After MAWD-PDC, all matrix elements are present in the final solution, while Al, Fe, Mn, and Zn are not recovered via the solubilization method. Thus, two different isolation protocols were optimized, one for solubilization as a sample preparation approach and another for MAWD-PDC.Fig. 1A and B presents the Mg elution profile for crude oil D after MAWD-PDC digestion. The isolation procedure for digests was carried out with (Fig. 1A) and without the use of 0.15 mol L−1 HF (Fig. 1B). As the first milliliter of 0.8 mol L−1 HCl does not contain a significant amount of Mg, it was not collected with the target element cut, which allowed to avoid organic solvent in the purified sample. Hydrofluoric acid is used to elute Al, Be and Ti.11 In case of the crude oils evaluated in this work, the concentration of Be and Ti was below the limit of quantification. The use of HF also did not appear to be necessary for Al, as also without HF, the Al elution peak was well separated from that of Mg. In addition, although Ca and K partially co-elute with Mg, for samples B, C, and D, the concentration of K in the purified Mg fraction was negligible, and the Ca/Mg ratio was below 0.3. As previously demonstrated, Ca/Mg ratios <1.5 do not affect the results of Mg isotope ratio measurements.46 Only for the samples A and E, the Ca/Mg ratio in the purified Mg fraction was 5 and 2, respectively, because these samples have a high initial Ca/Mg ratio (26 and 7 for sample A and E, respectively). In this case, in order to further reduce the Ca/Mg ratio and avoid biased Mg isotope ratio results, the Mg isolation was repeated.46 For the digests, the Mg recoveries ranged between 96 and 106%, with an average recovery of 99 ± 7%.
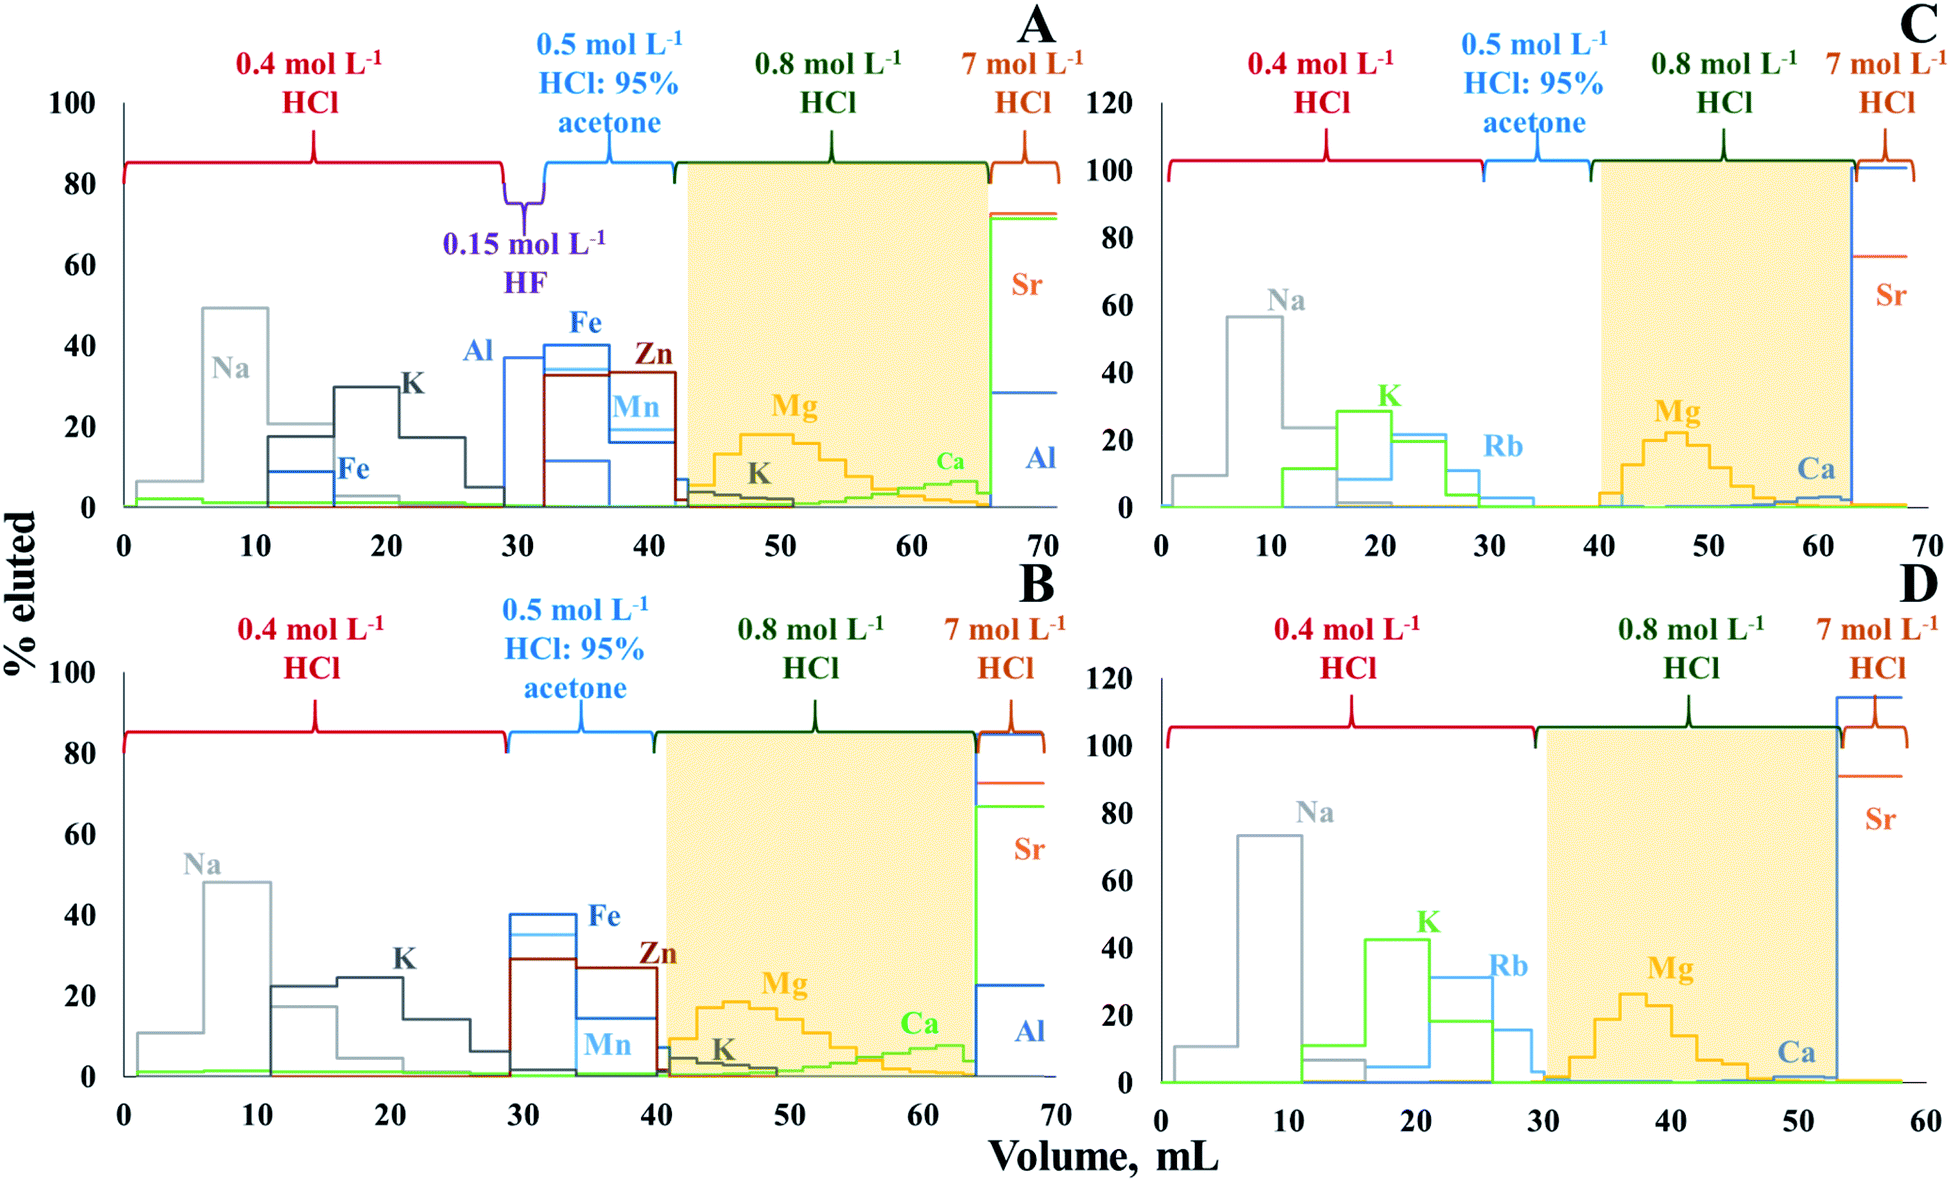 | ||
| Fig. 1 Elution profile for crude oil D after MAWD-PDC, (A) using 0.15 mol L−1 HF and (B) without using HF, and after solubilization, (C) using acetone and (D) without acetone. The shaded sections represent the collected fractions. | ||
Since elements such as Al, Fe, Mn, and Zn are not recovered using the solubilization method, the Mg isolation protocol evaluated for the solutions obtained by this method was carried out without the use of HF, while the necessity of using the solution of 0.5 mol L−1 HCl:95% acetone was evaluated (Fig. 1C and D). As expected, Mg can be isolated without using acetone, which reduces the time needed for isolation and the consumption of reagents. A partial co-elution of Ca with Mg is seen, but no significant effect on the Mg isotope ratio results was observed at the Ca/Mg ratios obtained after the separation (except for samples A and E, which were subjected to the isolation procedure twice).46 In case of solutions obtained after solubilization, the Mg recoveries ranged between 94 and 104%, with an average recovery of 99 ± 3%.
3.3 Sr and Pb isolation procedure
The extraction chromatography using Sr-spec resin following procedures previously described10,34 appeared to be well suited for the sequential isolation of Sr and Pb from crude oil matrix after either MAWD-PDC or solubilization. Fig. 2 shows the elution profiles of Sr and Pb for a synthetic standard solution containing the major elements also present in crude oil digests, in addition to 1000 μg L−1 of Sr and 100 μg L−1 of Pb.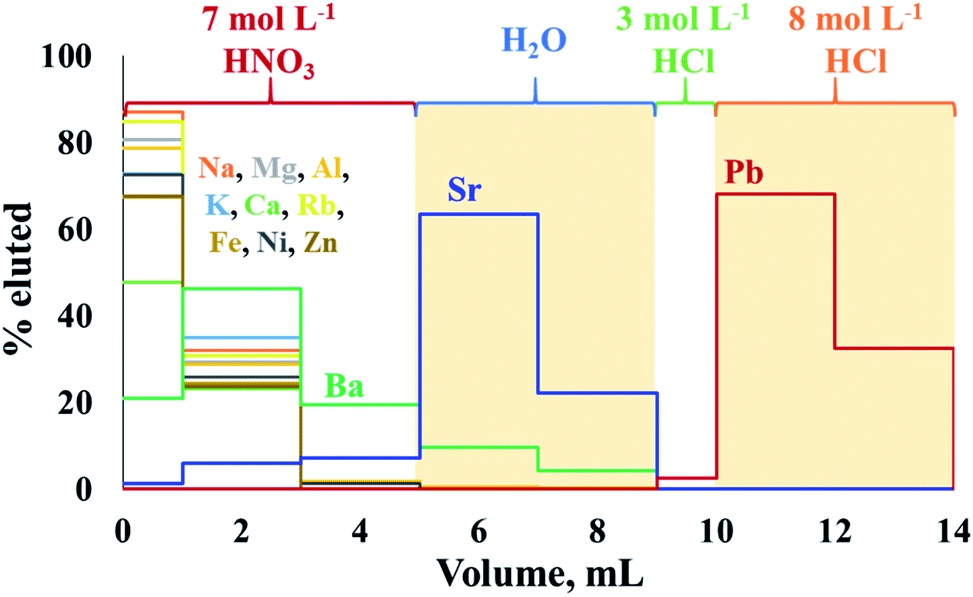 | ||
| Fig. 2 Elution profiles of Sr and Pb using Sr-spec resin. The shaded sections represent the collected fractions. | ||
The chromatographic procedure applied to crude oil proved to efficiently separate Sr from Rb, and to completely remove concomitant major elements, including Al, Ca, Fe, K, Mg and Na. Aluminum, Ca, K, Mg, Na, and Rb were eluted during the first step of the isolation procedure, using 7 mol L−1 HNO3, and co-elution of Rb with Sr was not observed for any crude oil sample. Although Ba partially co-eluted with Sr (Ba/Sr ratio of 0.16) during the elution experiment, no Ba was observed in the Sr fraction of real crude oils. The Sr recoveries for the crude oil samples ranged between 71 and 105%, with an average recovery of 90 ± 10% for the digests obtained after MAWD-PDC, and 82 ± 8% for the solutions obtained after solubilization.
Although this high uncertainty of the Sr recovery is potentially due to the trace nature of Sr in crude oil and associated to elevated measurement uncertainties, non-quantitative recoveries and possible on-column fractionation do not allow for measurement of natural variation induced by isotope fractionation. Additional work on the Sr isolation to achieve quantitative recovery would be needed to allow for such application.47,48 At the same time, the recoveries demonstrated for Sr isolation in this work allow to measure radiogenic Sr isotope ratios using a 88Sr/86Sr value of 8.375209 (ref. 37) to correct for both instrumental and natural mass-dependent isotope fractionation.
After the elution of Sr, it was possible to elute Pb using a solution of 8 mol L−1 HCl. Similarly to what was observed by Smet et al.,10 a small fraction (about 2.5%) of the Pb present already eluted from the column in the step using 1 mL of 3 mol L−1. However, Smet et al.10 previously reported that the isolation process using Sr-spec resin did not induce on-column isotopic fractionation for Pb. The recovery for Pb from the crude oil was 97 ± 2%.
3.4 Blanks, precision and accuracy
The procedural blanks, including sample preparation and isolation, for Mg ranged from 0.5 to 3% of the total Mg concentration in crude oil samples for MAWD-PDC and the solubilization method, and correction did not affect the Mg isotope ratios. In general, lower blank values were obtained using MAWD-PDC than with the solubilization method. For Sr and Pb, procedural blanks were always below 1% of the total analyte concentration. The intermediate precision49 (1SD) for δ25Mg and δ26Mg was 0.04 and 0.06‰, respectively. For 87Sr/86Sr, 207Pb/206Pb, 208Pb/206Pb, 206Pb/204Pb, 207Pb/204Pb and 208Pb/204Pb, the intermediate precision was 0.00004, 0.00004, 0.00012, 0.0020, 0.0021 and 0.0056, respectively.Results obtained for the Mg and Pb in-house standards are shown in Table 3 and are in agreement with the corresponding data reported in previous publications, confirming the accuracy of the measurements. Additionally, it can be indicated that the Mg isotope ratio measurements at both dilution levels (60 and 150 μg L−1) resulted in similar uncertainties. For the Mg in-house standard solution measured at 60 μg L−1 we found δ26Mg = −0.64 ± 0.04‰, while measurement at 150 μg L−1 resulted in δ26Mg = −0.64 ± 0.03‰. In addition, due to the absence of crude oil reference materials characterized for their metal isotopic compositions, the comparison of the results as obtained using the two parallel decomposition methods was the only approach to assess the accuracy of the proposed method.
| Standard | Isotope ratio | This worka | Reported | Ref. |
|---|---|---|---|---|
| a The uncertainties are 1SD for 3 replicate measurements. | ||||
| Mg in-house | δ 25Mg, ‰ | −0.34 ± 0.03 | −0.34 ± 0.05 | 13 |
| δ 26Mg, ‰ | −0.64 ± 0.04 | −0.65 ± 0.09 | 13 | |
| Pb in-house I | 208Pb/206Pb | 2.15324 ± 0.00006 | 2.15331 ± 0.00003 | 8 |
| 207Pb/206Pb | 0.90407 ± 0.00002 | 0.90413 ± 0.00002 | 8 | |
| Pb in-house II | 208Pb/206Pb | 2.17612 ± 0.00004 | 2.17616 ± 0.00019 | 33 |
| 207Pb/206Pb | 0.92332 ± 0.00003 | 0.92331 ± 0.00006 | 33 | |
3.5 Results for Mg, Sr and Pb isotope ratios
As the ERM-AE143 (ref. 50 and 51) Mg reference material is more readily available compared to the widely accepted DSM3 standard, the samples and standards were measured relative to ERM-AE143, but the results were recalculated and expressed relative to the DSM3 isotopic reference material using delta notation (in per mil).31 Each crude oil sample was analyzed in triplicate, including sample preparation and Mg isolation, and measured three times. Results for the Mg isotopic composition of crude oil samples are presented in Table 4.| Isotope ratio | A | B | C | |||
|---|---|---|---|---|---|---|
| MAWD-PDC | Solubilization | MAWD-PDC | Solubilization | MAWD-PDC | Solubilization | |
| a nd: not determined. The uncertainties are 1SD for 3 replicate measurements, including sample decomposition and isolation. | ||||||
| δ 25Mg, ‰ | −0.66 ± 0.09 | −0.64 ± 0.04 | −0.65 ± 0.05 | −0.62 ± 0.04 | −0.35 ± 0.04 | −0.36 ± 0.04 |
| δ 26Mg, ‰ | −1.26 ± 0.06 | −1.23 ± 0.06 | −1.25 ± 0.05 | −1.20 ± 0.08 | −0.71 ± 0.07 | −0.70 ± 0.09 |
| 87Sr/86Sr | 0.71100 ± 0.00002 | 0.71104 ± 0.00003 | 0.71237 ± 0.00004 | 0.71244 ± 0.00004 | 0.70993 ± 0.00005 | 0.70969 ± 0.00002 |
| 207Pb/206Pb | 0.86074 ± 0.00002 | nd | 0.83544 ± 0.00011 | nd | 0.87808 ± 0.00009 | nd |
| 208Pb/206Pb | 2.08997 ± 0.00011 | nd | 2.04759 ± 0.00030 | nd | 2.11496 ± 0.00023 | nd |
| 206Pb/204Pb | 18.13495 ± 0.00070 | nd | 18.74347 ± 0.01335 | nd | 17.74336 ± 0.01846 | nd |
| 207Pb/204Pb | 15.60946 ± 0.00096 | nd | 15.65897 ± 0.01042 | nd | 15.58007 ± 0.01570 | nd |
| 208Pb/204Pb | 37.90145 ± 0.00339 | nd | 38.37898 ± 0.02570 | nd | 37.52644 ± 0.03850 | nd |
| Isotope ratio | D | E | NIST 1634c | |||
|---|---|---|---|---|---|---|
| MAWD-PDC | Solubilization | MAWD-PDC | Solubilization | MAWD-PDC | Solubilization | |
| δ 25Mg, ‰ | −0.77 ± 0.08 | −0.74 ± 0.02 | −0.62 ± 0.08 | −0.62 ± 0.04 | −0.44 ± 0.02 | nd |
| δ 26Mg, ‰ | −1.53 ± 0.06 | −1.44 ± 0.04 | −1.19 ± 0.06 | −1.14 ± 0.06 | −0.86 ± 0.04 | nd |
| 87Sr/86Sr | 0.71223 ± 0.00004 | 0.71222 ± 0.00003 | 0.71302 ± 0.00006 | 0.71304 ± 0.00003 | 0.71162 ± 0.00013 | nd |
| 207Pb/206Pb | 0.83083 ± 0.00004 | nd | 0.82712 ± 0.00001 | nd | 0.82091 ± 0.00001 | nd |
| 208Pb/206Pb | 2.04344 ± 0.00010 | nd | 2.03304 ± 0.00003 | nd | 2.02082 ± 0.00001 | nd |
| 206Pb/204Pb | 18.86875 ± 0.00026 | nd | 18.95599 ± 0.00068 | nd | 19.09916 ± 0.00069 | nd |
| 207Pb/204Pb | 15.67681 ± 0.00049 | nd | 15.67888 ± 0.00039 | nd | 15.67874 ± 0.00057 | nd |
| 208Pb/204Pb | 38.55713 ± 0.00127 | nd | 38.53838 ± 0.00090 | nd | 38.59592 ± 0.00137 | nd |
The Mg isotope ratios obtained by MAWD-PDC and solubilization were in good agreement. Thus, both sample preparation methods can be used for Mg isotopic analysis of crude oil. The measured Mg isotope ratios fall onto a terrestrial mass fractionation line. The δ26Mg in crude oil ranged between −1.53 and −0.71‰, which is within the range between seawater (δ26MgDSM3 = −0.83 ± 0.11‰)52 and marine carbonates of biogenic origin (δ26MgDSM3 = −5.57 to −1.04‰).53 Additionally, an aliquot of NIST 1634c residual fuel was digested by MAWD-PDC and its Mg isotopic composition was determined to be δ26Mg = −0.86 ± 0.04‰ and δ25Mg = −0.44 ± 0.02‰. As to date, no Mg isotope ratios of crude oil have been reported yet.
87Sr/86Sr isotope ratios in crude oil after MAWD-PDC and solubilization are shown in Table 4. The results obtained after both sample preparation methods were in good agreement. However, a small difference in the 87Sr/86Sr ratio exceeding the uncertainty was observed between the two methods for sample C, possibly due to homogeneity and/or sampling problems. The results for NIST 1634c after digestion by MAWD-PDC were 87Sr/86Sr = 0.71162 ± 0.00013. The 87Sr/86Sr isotope ratios in crude oil ranged from 0.70993 to 0.71302. Similar to what was observed for the Mg isotopic composition, the 87Sr/86Sr ratio in crude oil is close to that of seawater (87Sr/86Sr = 0.709).54,55 In addition, the radiogenic character of the Sr composition suggests that the crude oils were equilibrated towards more evolved rock types, enriched in Rb, e.g. alkali-rich volcanic rocks (87/86Sr up to 0.713),56 basinal lithologies such as marine pelitic sediments (87/86Sr from 0.702 up to 0.74)57 or even granites (87/86Sr up to 0.736).56
Pb isotope ratios were obtained for crude oil samples after MAWD-PDC only, as the solubilization method was not suitable for Pb. The Pb concentration in the crude oil samples analyzed in this work was very low (from 0.059 to 0.203 μg g−1). Dilution of the purified Pb samples and NIST SRM 981 to 15 μg L−1 of Pb was needed to have enough volume for MC-ICP-MS measurement. NIST SRM 997 Tl was added to samples and standards at a concentration of 5 μg L−1. In order to measure 202Hg and 204Pb with sufficient precision at low concentration, the Faraday collectors L3 and L1 were connected to high-sensitivity 1013 Ω resistors (Table S1, ESI†). Pb isotope ratios for crude oil samples and NIST 1634c are shown in Table 4. 207Pb/206Pb and 208Pb/206Pb ratios in the samples ranged from 0.82712 to 0.87808 and from 2.03304 to 2.11496, respectively. These ratios are in range with those reported in the literature for crude oil samples from different origins.16 In addition, Pb isotope ratios in crude oil are also within the range reported for seawater.58
3.6 Implication of Mg, Sr and Pb isotope ratio proxies for crude oil geochemistry
The demonstrated variability in the isotope ratios of Mg, Pb and Sr suggests the relevance of carrying out such measurements for creating a database for crude oils from different parts of the world for comparative purposes. These data can then eventually be used as a tool for crude oil provenancing and the characteristics can potentially be linked to the age and formational mechanisms of different oil fields.Combination of information on the natural variation in the isotopic composition of the target elements due to mass-dependent isotope fractionation and the occurrence of radiogenic daughters can be used to unravel both (i) the environments in which the elements with (a) radiogenic nuclide(s) evolved before being transferred into the oil and (ii) the nature of the geological processes as imprinted in the isotopic composition. Moreover, multiple isotopic signatures can be used in provenance studies. The results of this work demonstrate strong correlations between the Sr and Pb isotope ratios and a weaker correlation of the Mg isotopic composition with that of Sr (Fig. 3). It indicates mixing of at least two end-members with distinct Rb/Sr, U/Pb, Th/Pb ratios, having at least 1‰ different δ26Mg isotopic signatures. The data suggest that the oil reservoir from which the samples originate underwent a stage of mixing of 2 isotopically distinct components, and the composition of the crude oils was likely established by acquiring an isotopic signature of the deposit bedrock, followed by mixing with the seawater component. As a result, geochronology based on the linear correlation of 207Pb/206Pb versus204Pb/206Pb in crude oils should be approached with extreme care.16 The Mg isotopic composition of the oil sample C corresponds well to the universal value of a seawater, δ26MgDSM3 = −0.83 ± 0.11, which is known to be homogeneous across the oceans.52 This might be due to contamination of the oil during the extraction process, hinting towards its offshore origin. Our preliminary results, with crude oil C having a heavy Mg isotopic composition and less radiogenic Sr, while the other oils (D, B, E) having a light Mg isotopic composition and more radiogenic Sr, and sample A lying in-between these values, suggest that the Mg isotopic composition of crude oil may potentially be used as a proxy of the bedrock towards which the oil equilibrated: e.g., biogenic carbonates,53 igneous rocks,59,60etc. Absence of a strong correlation, however, hints towards the existence of (a) secondary process(es) fractionating Mg isotopes or an additional isotopically distinct reservoir.
 | ||
| Fig. 3 Representation of Mg, Sr and Pb isotope compositions of 5 Brazilian crude oils. The results fall along a mixing line in an array accounted for by a mixture of two end-members, one of which is a seawater.52,54,55,58 As the correlation of 207Pb/206Pb versus204Pb/206Pb represents a mixing line, no meaningful geological age can be obtained. The shaded section in plot A represents the possible isotopic composition of the deposit bedrock.53,56,57 | ||
4. Conclusions
The combination of efficient decomposition methods, chromatographic target element isolation and MC-ICP-MS provides straightforward methods that can be used for isotopic analysis of crude oils. Microwave-assisted wet digestion with a pressurized digestion cavity (MAWD-PDC) and solubilization after ASTM D4807 method were evaluated for crude oil decomposition, and both were characterized by quantitative yields and considered suitable for Mg and Sr isotopic analysis. No statistical difference was observed between the results for Mg and Sr isotope ratios obtained using both sample preparation methods. However, the determination of Pb isotope ratios was only possible after MAWD-PDC, as Pb is not recovered in the solubilization method.A higher sample mass could be digested (up to 10 g) in the solubilization method (ASTM), which is important when considering trace elements in crude oil. In addition, both sample preparation methods are more efficient and less time-consuming in comparison with methods reported earlier in the literature (for Sr and Pb only), which rely on the use of conventional methods, such as acid digestion followed by dry ashing, liquid–liquid extraction or the use of a high-pressure asher.
Isolation procedures using column chromatography were evaluated and optimized for each element. For Mg, isolation was successfully carried out using the cation exchange resin AG50W-X8, providing quantitative yields. The isolation of Sr and Pb was performed in a one-step isolation protocol relying on the use of Sr-spec resin.
The Mg–Sr–Pb isotopic compositions of the crude oils was within the range observed for seawater and some rocks, sediments, and carbonates. Possibly the isotopic composition was acquired from the reservoir bedrock via leaching or equilibration followed by mixing with the seawater. The deposit bedrock with which the crude oils were equilibrated is evolved in origin, with radiogenic Sr and Pb isotopic signatures, and unlikely an igneous type due to the light Mg isotopic composition. The isotopic composition of Mg, Sr and Pb in crude oil was evidenced to carry invaluable information, while based on element concentrations, no link between the Brazilian crude oil and the source rock can be established, since changes in concentration can occur during the process of crude oil extraction.
It is important to highlight that only few works were found in the literature on Pb isotopic composition of crude oil, and only a single work was found for Sr. Additionally, to the best of the authors' knowledge, Mg isotopic analysis of crude oil is reported for the first time in this paper. The analytical tool presented in this manuscript opens a new door for oil deposit source tracing and crude oil provenancing, which was so far hampered by the lack of reliable digestion methods.
Conflicts of interest
There are no conflicts to declare.Acknowledgements
The authors are grateful to CNPq (grant number 308857/2013-5), INCTBio (573672/2008-3) and FAPERGS (grant number 16/2551-0000182-0) for supporting this study. This study was financed in part by the Coordenação de Aperfeiçoamento de Pessoal de Nível Superior – Brasil (CAPES) – Finance Code 001 (CAPES-PrInt). SCh acknowledges “Excellence of Science (EoS)” project (ET-HoME – ID 30442502). Rosa Grigoryan is acknowledged for her advice on Mg isolation and MC-ICP-MS setup. Dr Kristof Tirez from VITO is acknowledged for his help with the microwave digestion. FV acknowledges the Flemish Research Foundation (FWO) for providing the funding for the acquisition of the MC-ICP-MS instrumentation (ZW15-02 – G0H6216N).References
- ASTM D4175-8, Standard terminology relating to petroleum products, liquid fuels, and lubricants, ASTM International West, Conshohocken, PA, 2018 Search PubMed.
- S. Matar and L. F. Hatch, Chemistry of Petrochemical Processes, Gulf Professional Publishing, Woburn, second edn, 2001 Search PubMed.
- J. G. Speight, Handbook of Petroleum Analysis, John Wiley and Sons, New York, 2001 Search PubMed.
- H. J. Callot, R. Ocampo and P. Albrecht, Energy Fuels, 1990, 4, 635–639 Search PubMed.
- G. T. Ventura, L. Gall, C. Siebert, J. Prytulak, P. Szatmari, M. Hürlimann and A. N. Halliday, Appl. Geochem., 2015, 59, 104–117 Search PubMed.
- D. Selby and R. A. Creaser, Science, 2005, 308, 1293–1295 Search PubMed.
- L. K. Manning, C. D. Frost and J. F. Branthaver, Chem. Geol., 1991, 91, 125–138 Search PubMed.
- A. Bazzano, K. Latruwe, M. Grotti and F. Vanhaecke, J. Anal. At. Spectrom., 2015, 30, 1322–1328 Search PubMed.
- C. E. Souto-Oliveira, M. Babinski, D. F. Araújo, D. J. Weiss and I. R. Ruiz, Atmos. Environ., 2019, 198, 427–437 Search PubMed.
- I. Smet, D. De Muynck, F. Vanhaecke and M. Elburg, J. Anal. At. Spectrom., 2010, 25, 1025–1032 Search PubMed.
- F. Wombacher, A. Eisenhauer, A. Heuser and S. Weyer, J. Anal. At. Spectrom., 2009, 24, 627–636 Search PubMed.
- M. Ganio, K. Latruwe, D. Brems, P. Muchez, F. Vanhaecke and P. Degryse, J. Anal. At. Spectrom., 2012, 27, 1335–1341 Search PubMed.
- R. Grigoryan, M. Costas-Rodríguez, S. Van Laecke, M. Speeckaert, B. Lapauw and F. Vanhaecke, J. Anal. At. Spectrom., 2019, 34, 1514–1521 Search PubMed.
- T. A. Yasnygina, S. V. Rasskazov, M. E. Markova, A. E. Zharov, Y. M. Malykh, E. V. Saranina and N. N. Fefelov, Russ. J. Pacific Geol., 2015, 9, 109–119 Search PubMed.
- N. Fetter, J. Blichert-Toft, P. Télouk and F. Albarède, Chem. Geol., 2019, 511, 112–122 Search PubMed.
- N. Fetter, J. Blichert-Toft, J. Ludden, A. Lepland, J. Sánchez Borque, E. Greenhalgh, B. Garcia, D. Edwards, P. Télouk and F. Albarède, Earth Planet. Sci. Lett., 2019, 525, 115747 Search PubMed.
- G. S. Ortega, C. Pécheyran, S. Bérail and O. F. X. Donard, Anal. Chem., 2012, 84, 7874–7880 Search PubMed.
- G. S. Ortega, C. Pécheyran, S. Bérail and O. F. X. Donard, J. Anal. At. Spectrom., 2012, 27, 1447–1456 Search PubMed.
- S. Dreyfus, C. Pécheyran, C. P. Lienemann, C. Magnier, A. Prinzhofer and O. F. X. Donard, J. Anal. At. Spectrom., 2007, 22, 351–360 Search PubMed.
- F. Vanhaecke and P. Degryse, Isotopic Analysis: Fundamentals and Applications using ICP-MS, Wiley-VCH, 2012 Search PubMed.
- P. A. Mello, J. S. F. Pereira, M. F. Mesko, J. S. Barin and E. M. M. Flores, Anal. Chim. Acta, 2012, 746, 15–36 Search PubMed.
- UltraWAVE system, Milestone Srl, Sorisole, Italy, 2021, available at: https://www.milestonesrl.com Search PubMed.
- Microwave digestion system: Multiwave 7000, Anton Paar, Austria, available at: www.anton-paar.com, 2020 Search PubMed.
- E. I. Muller, C. C. Muller, J. P. Souza, A. L. H. Muller, M. S. P. Enders, M. Doneda, A. C. Frohlich, G. D. Iop and K. F. Anschau, Microchem. J., 2017, 134, 257–261 Search PubMed.
- S. R. Krzyzaniak, G. D. Iop, A. P. Holkem, E. M. M. Flores and P. A. Mello, Talanta, 2019, 192, 255–262 Search PubMed.
- L. S. F. Pereira, M. S. P. Enders, G. D. Iop, P. A. Mello and E. M. M. Flores, J. Anal. At. Spectrom., 2018, 33, 649–657 Search PubMed.
- C. A. Bizzi, M. F. Pedrotti, J. S. Silva, J. S. Barin, J. A. Nóbrega and E. M. M. Flores, J. Anal. At. Spectrom., 2017, 32, 1448–1466 Search PubMed.
- A. L. H. Muller, J. S. S. Oliveira, P. A. Mello, E. I. Muller and E. M. M. Flores, Talanta, 2015, 136, 161–169 Search PubMed.
- G. T. Druzian, L. S. F. Pereira, P. A. Mello, M. F. Mesko, F. A. Duarte and E. M. M. Flores, J. Anal. At. Spectrom., 2016, 31, 1185–1191 Search PubMed.
- ASTM D4807-05, Standard test method for sediment in crude oil by membrane filtration, ASTM International, West Conshohocken, PA, 2005 Search PubMed.
- C. G. Vega, S. M. Chernonozhkin, R. Grigoryan, M. Costas-Rodríguez and F. Vanhaecke, J. Anal. At. Spectrom., 2020, 35, 2517–2529 Search PubMed.
- A. Galy, O. Yoffe, P. E. Janney, R. W. Williams, C. Cloquet, O. Alard, L. Halicz, M. Wadhwa, I. D. Hutcheon, E. Ramon and J. Carignan, J. Anal. At. Spectrom., 2003, 18, 1352–1356 Search PubMed.
- C. Sánchez, E. Bolea-Fernandez, M. Costas-Rodríguez, C.-P. Lienemann, J.-L. Todolí and F. Vanhaecke, J. Anal. At. Spectrom., 2018, 33, 481–490 Search PubMed.
- D. De Muynck, G. Huelga-Suarez, L. Van Heghe, P. Degryse and F. Vanhaecke, J. Anal. At. Spectrom., 2009, 24, 1498–1510 Search PubMed.
- W. A. Russell, D. A. Papanastassiou and T. A. Tombrello, Geochim. Cosmochim. Acta, 1978, 42, 1075–1090 Search PubMed.
- C. P. Ingle, B. L. Sharp, M. S. A. Horstwood, R. R. Parrish and D. J. Lewis, J. Anal. At. Spectrom., 2003, 18, 219–229 Search PubMed.
- R. H. Steiger and E. Jäger, Earth Planet. Sci. Lett., 1977, 36, 359–362 Search PubMed.
- J. Meija, T. B. Coplen, M. Berglund, W. A. Brand, P. D. Bièvre, M. Gröning, N. E. Holden, J. Irrgeher, R. D. Loss, T. Walczyk and T. Prohaska, Pure Appl. Chem., 2016, 88, 293 Search PubMed.
- L. Balcaen, I. D. Schrijver, L. Moens and F. Vanhaecke, Int. J. Mass Spectrom., 2005, 242, 251–255 Search PubMed.
- D. C. Baxter, I. Rodushkin, E. Engström and D. Malinovsky, J. Anal. At. Spectrom., 2006, 21, 427–430 Search PubMed.
- G. Craig, Z. Hu, A. Zhang, N. S. Lloyd, C. Bouman and J. Schwieters, Dynamic time correction for high precision isotope ratio measurements, technical note 30396, Thermo Scientific, 2019 Search PubMed.
- J. S. F. Pereira, L. S. F. Pereira, P. A. Mello, R. C. L. Guimarães, R. A. Guarnieri, T. C. O. Fonseca and E. M. M. Flores, Anal. Chim. Acta, 2014, 844, 8–14 Search PubMed.
- J. S. F. Pereira, R. S. Picoloto, L. S. F. Pereira, R. C. L. Guimarães, R. A. Guarnieri and E. M. M. Flores, Anal. Chem., 2013, 85, 11034–11040 Search PubMed.
- T. S. Seeger, E. I. Muller, M. F. Mesko and F. A. Duarte, Fuel, 2019, 236, 1483–1488 Search PubMed.
- T. Wondimu and W. Goessler, Bull. Chem. Soc. Ethiop., 2000, 14, 99–113 Search PubMed.
- R. Grigoryan, M. Costas-Rodríguez, R. Vandenbroucke and F. Vanhaecke, Anal. Chim. Acta, 2020, 1130, 137–145 Search PubMed.
- J.-M. Brazier, A.-D. Schmitt, E. Pelt, D. Lemarchand, S. Gangloff, T. Tacail and V. Balter, Geostand. Geoanal. Res., 2020, 44, 331–348 Search PubMed.
- J. Irrgeher, T. Prohaska, R. E. Sturgeon, Z. Mester and L. Yang, Anal. Methods, 2013, 5, 1687–1694 Search PubMed.
- N. Dauphas, A. Pourmand and F. Z. Teng, Chem. Geol., 2009, 267, 175–184 Search PubMed.
- J. Vogl, M. Rosner, S. A. Kasemann, R. Kraft, A. Meixner, J. Noordmann, S. Rabb, O. Rienitz, J. A. Schuessler, M. Tatzel and R. D. Vocke, Geostand. Geoanal. Res., 2020, 1, 1–19 Search PubMed.
- J. Vogl, B. Brandt, J. Noordmann, O. Rienitz and D. Malinovskiy, J. Anal. At. Spectrom., 2016, 31, 1440–1458 Search PubMed.
- M. Ling, F. Sedaghatpour, F. Z. Teng, P. D. Hays, J. Strauss and W. Sun, Rapid Commun. Mass Spectrom., 2011, 25, 2828–2836 Search PubMed.
- F. Z. Teng, Rev. Mineral. Geochem., 2017, 82, 219–287 Search PubMed.
- Z. E. Peterman, C. E. Hedge and H. A. Tourtelot, Geochim. Cosmochim. Acta, 1970, 34, 105–120 Search PubMed.
- J. M. McArthur, R. J. Howarth and T. R. Bailey, J. Geol., 2001, 109, 155–170 Search PubMed.
- G. Faure and T. M. Mensing, Isotopes: Principles and Applications, Wiley, India, 2009 Search PubMed.
- U. G. Cordani, A. M. Mizusaki, K. Kawashita and A. Thomaz-Filho, Geol. Mag., 2004, 141, 233–244 Search PubMed.
- M. Paul, L. Bridgestock, M. Rehkämper, T. DeFlierdt and D. Weiss, Anal. Chim. Acta, 2015, 863, 59–69 Search PubMed.
- F. Z. Teng, M. Wadhwa and R. T. Helz, Earth Planet. Sci. Lett., 2007, 261, 84–92 Search PubMed.
- S. A. Liu, F. Z. Teng, Y. He, S. Ke and S. Li, Earth Planet. Sci. Lett., 2010, 297, 646–654 Search PubMed.
Footnote |
| † Electronic supplementary information (ESI) available. See DOI: 10.1039/d1ja00120e |
| This journal is © The Royal Society of Chemistry 2021 |