
 Open Access Article
 This Open Access Article is licensed under a
 Creative Commons Attribution 3.0 Unported Licence
A round robin test for total reflection X-ray fluorescence analysis using preselected and well characterized samples†
Rainer
Unterumsberger
 *a,
Burkhard
Beckhoff
a,
Armin
Gross
b,
Hagen
Stosnach
b,
Sascha
Nowak
c,
Yannick P.
Stenzel
c,
Markus
Krämer
d and
Alex
von Bohlen
e
*a,
Burkhard
Beckhoff
a,
Armin
Gross
b,
Hagen
Stosnach
b,
Sascha
Nowak
c,
Yannick P.
Stenzel
c,
Markus
Krämer
d and
Alex
von Bohlen
e
aPhysikalisch-Technische Bundesanstalt, Abbestr. 2-12, 10587 Berlin, Germany. E-mail: rainer.unterumsberger@ptb.de
bBruker Nano GmbH, Am Studio 2D, 12489 Berlin, Germany
cMEET – Battery Research Center Office, Corrensstr. 46, 48149 Münster, Germany
dAXO DRESDEN GmbH, Gasanstaltstr. 8b, 01237 Dresden, Germany
eLeibniz-Institut für Analytische Wissenschaften – ISAS – e.V., Bunsen-Kirchhoff-Str. 11, 44139 Dortmund, Germany
First published on 2nd July 2021
Abstract
In this work, we present the results of the first round robin test of different kinds of micro- and nanoscaled samples for total reflection X-ray fluorescence (TXRF) analysis. Therefore preselected, well-characterized samples including an internal standard were provided to the participants of the round robin test. Three different kinds of samples were produced ensuring highly homogeneous mass depositions: first, manually produced μL droplets, representing the most common sample preparation in TXRF. Second, nL droplets pipetted with a nL dispenser, having the potential of being μL (total volume) samples distributed in an optimized manner with respect to reproducibility and homogeneity. Third, multi-elemental sub-monolayers, coated over the entire sample surface, simulating surface contamination and thereby representing ideal samples for the TXRF method. One of the several elements coated as sub-monolayers was selected as an internal standard and quantified with physically traceable XRF. The approach for an accurate and precise round robin activity was to separate the influence of the TXRF instrumental response and internal standard based quantification from any impact related to the sample preparation, in particular spatial inhomogeneity revealed by different X-ray spectrometric techniques. The results of the round robin test are in line with expectations and lie within about 5% deviation for all droplets and about 3% for the layers, showing the strength and reliability of the TXRF method for simultaneous multi-element analysis when decoupled from unfavorable sample preparations. For validation purposes, physically traceable XRF quantification was performed for one selected sample, and the absolute mass deposition of the respective elements was determined.
1 Introduction
A round robin test is an inter-laboratory test using the same method with different equipment or a comparison of different methods. It is a common procedure to determine the performance of an analysis method or process.1 With respect to the TXRF method,2–9 several round robin tests have been performed during the last few decades.10–16 Some of these recent inter-laboratory studies showed rather large deviation in the results. To the best of our knowledge a relevant part of these deviations is presumably due to individual sample preparations at each round robin partner site prior to the respective TXRF analysis. Other contributors may include differing qualities of instrumental pre-calibration.The goal of this work was to separate the influence of the TXRF instrumental response and the quantification of analytes with respect to an internal standard from any impact related to the sample preparation, and thus to investigate the performance of the TXRF method itself. The relevance of sample preparation for TXRF has been shown before.17,18 Complementary to the conventionally used μL droplet residue, two types of nano-scaled depositions, i.e. nanoliter droplet residues and nanometer thick layers or even sub-monolayers, have been recently investigated by TXRF, and thus were to be included in a modern round robin activity.19,20 In addition, the independent validation of chemical traceable TXRF approaches based upon internal standards calls for physical traceable methods involving calibrated instrumentation such as reference-free XRF.6,21
Last but not least, the transition from TXRF to grazing incidence X-ray fluorescence (GIXRF)21–24 by a mere angular variation calls for the assessment of calibration samples for both techniques, or the mutual validation of one technique by the other.
Therefore, a round robin test on TXRF analysis has been performed within the German WIPANO (“Wissens- und Technologietransfer durch Patente und Normen”, eng.: knowledge and technology transfer through patents and standards) TXRF project: TRFA-KAL, using preselected samples provided by the project partners. The German WIPANO TRFA-KAL project is aiming at both the further development and validation of TXRF quantification procedures.
Project partners involved are the German National Metrology Institute PTB in Berlin, the analytical sciences research institute ISAS in Dortmund, the battery research institute MEET in Münster, the X-ray instrument manufacturer Bruker Nano in Berlin, the X-ray optics company AXO DRESDEN, and the German standardization body DIN located in Berlin. In order to assess TXRF quantification, three different types of sample systems have been investigated within a German round robin activity with international participation by selected partners. The round robin activity on TXRF analysis will compare the characterization results obtained by the respective participants.
The results of the round robin test are shown in this paper, will be implemented in a revision of the DIN standard DIN 51003:2004 25 and employed for ISO/TC 201/SC 10 standardization activities.
2 Experimental
2.1 Samples
Because the round robin test focuses on the TXRF method, the samples were provided by the project partners in order to minimize possible errors associated with either the absolute mass deposition or spatial inhomogeneity originating from the sample preparation. Three different sample preparation methods involving different spatial mass depositions were used for the round robin test samples. First, a liquid μL droplet was deposited on a glass substrate and dried, so that the residuum can be analyzed. Second, several nL droplets were deposited with a nL dispenser and also dried. Third, sub-monolayer thin films were deposited using high precision dual ion beam deposition (DIBD). All produced samples were subjected to a preliminary examination with respect to the recovery rate in order to identify the best suited samples for the round robin test.Suitable samples for the round robin test should not exceed a deviation of 3% of the recovery rate from the mean value of all recovery rates in the preliminary examination. A good recovery rate is an effective measure for a stable measurement process and a high spatial homogeneity between the internal standard and the other elements of interest. Here, first quantification using the internal standard Ga was performed (see Section 3.1.1). Second, the nominal values from the multi-element standard solution were taken to calculate the recovery rates for each element and sample. Third, the mean values of the recovery rates from all elements and samples and the respective deviations were calculated. This led to deviations from the mean recovery rate of 3% or less, although the net count rates for the respective fluorescence lines showed higher deviations of up to 10% from the mean value of all net count rates.
In addition, selected samples were analyzed with respect to their lateral distribution of the deposited elements. The preselection and characterization of the samples qualify for pre-calibration of table-top TXRF-instrumentation.
Altogether, 14 samples were provided for the round robin test for each participant. The three sample types are described in detail in 2.2 and 2.3; a scheme of the droplets and thin layers is shown in Fig. 1.
 | ||
| Fig. 1 Scheme of the production and the main characteristics of the μL and nL droplets (upper part) and the sub-monolayer thin films (lower part) used in the round robin test. | ||
2.2 Droplet samples
The μL and nL droplet samples were prepared using a commercial multi-element standard solution stabilized with 2% nitric acid (Bernd Kraft GmbH, Duisburg, Germany). One liter contains 5 mg Sc, 2 mg Mn and 1 mg Ni, Ga and Y, respectively. Detected K fluorescence lines, emitted from the respective elements, do not overlap in the spectrum when using a silicon drift detector (SDD) with moderate spectral resolution. The total mass of all deposited elements was chosen to be 10 ng (added up from 5 ng Sc, 2 ng Mn, 1 ng each Ni, Ga, Y) and 50 ng (25 ng Sc, 10 ng Mn, 5 ng each Ni, Ga, Y), so that the presumable signal-to-noise ratio during the measurements is well above the limits of detection while the signal of the fluorescence lines is still low enough to ensure measurements without significant matrix and pile-up effects under TXRF conditions. Keeping the sample amounts in the adequate range, reliable results were obtained aiming for the transition from the micro- to the nanoscaled experiments.2,26The element Ga was chosen to be the internal standard for two reasons: unintentional cross-contamination is not highly probable and the external analytical interest to the element is rather low. Six μL droplet samples were provided by Bruker Nano for each round robin test participant; three samples with 10 ng in total mass and three samples with 50 ng in total mass. Also six nL droplet samples were provided by MEET for each round robin test participant, as well three samples with 10 ng in total mass and three samples with 50 ng in total mass. Added together, 12 droplet samples were provided for the round robin test for each participant.
To avoid spreading of the aqueous sample on the quartz glass substrates, the substrate surfaces were made hydrophobic by pretreatment with 20 μL of silicone in isopropanol at room temperature and drying for 20 min in a hot air oven at 60 °C.
For the samples with a total mass of 50 ng, one 5 μL droplet of the non-diluted standard solution was pipetted carefully on the quartz glass substrates. For the 10 ng samples the standard solution was diluted by a factor of 10. In order to concentrate the sample at the center of the disc, a total volume of 10 μL was pipetted in two steps of 5 μL each with an in-between drying step.
A risk associated with μL droplets is the possibility of having matrix effects due to a non-homogeneous distribution of the material in the residue.24,32 The distribution between the different elements of interest and the internal standard in the residue can also vary, leading to higher uncertainties in the results of chemical traceable TXRF quantification.
In this work, the following methods for the investigation of the μL droplets with respect to suitability have been performed.
First, the central deposition of the droplet on the carrier is absolutely necessary for accurate quantification in TXRF spectroscopy. The same holds for the spatial and rotational deposition geometry of the droplet. A means to check for an equal distribution is to rotate the sample carrier with respect to the incident beam. Therefore, the round robin measurement protocol required the measurements of the droplet samples at 3 or 4 orientations of the carrier, respectively (see Section 2.5).
Second, μXRF7 for the lateral distribution and third GIXRF for the angular-dependent behavior of the deposited material have been performed, both measured in the PTB laboratory at BESSY II.
The μL droplet samples show a circular structure at the lateral distributions of about 1 mm to 3 mm in diameter. Residues with a hollow cylindrical shape or ring morphology have been observed before26,33 and seem to be a result of the drying process.32,34 In Fig. 2a the circular distribution of the element Sc is shown for a μL droplet with 10 ng total mass. All other elements in the sample, including the internal standard Ga, have almost identical distributions. In a previous study by Horntrich et al., comparable samples showed a similar drying behavior with respect to the elemental distribution, justifying the use of an internal standard for quantification in chemical analysis.35
 | ||
| Fig. 2 Mapping of the normalized Sc-Kα fluorescence line intensity emitted from a μL and nL droplet. The step width of the measurements was 20 μm. (a) μL droplet with a nominal total mass of 10 ng. (b) nL droplets with a nominal total mass of 50 ng. | ||
The height of the circular structure does not exceed 300 nm (measured by white light interferometry). The mapping was performed with a lateral resolution of about 30 μm FWHM and a step width of 20 μm using a focusing optic at a dipole white light beamline in the PTB laboratory at BESSY II.
The material is not completely homogeneously distributed within the circular structure. A difference up to a factor of 10 is noticeable. However, the relative distribution between the standard and the other elements in the sample is crucial for the quantification with internal standard Ga. This was verified by the selection criterion of 3% or less deviation from the mean recovery rate in the pre-characterization of the samples.
In this work, the iTWO-TXRF Nanoliter Dispenser (M2 Automation, Berlin, Germany) was used for the nL droplet preparation. This instrument is able to automatically deposit nL droplets in a freely selectable pattern on a substrate. It has been shown in the work by Evertz et al.19 that samples produced with the nL dispenser had an excellent recovery rate between 98% and 105%.
Three different patterns were chosen for the round robin test samples; one of them is shown in Fig. 2b.
Preliminarily, a gravimetric determination of the volume of a single droplet was performed. Since the standard solution that was used in the round robin test was aqueous, water was used for the determination of the single droplet volume. The dosing head was rinsed multiple times with isopropanol and water to eliminate any air bubbles. At a frequency of 100 s−1, 1000 droplets were weighted for the exact weight determination of a single droplet.
 | (1) |
The determination was repeated seven times at 20 °C and showed a weight of a single droplet of (13.39 ± 0.24) ng for water (ρ water, 20 °C = 0.998 g cm−338) with a relative standard deviation of 1.8%. For the preparation of the nL droplet samples, the smallest possible circular arrangement with 9 positions each with 2 drops was selected. To achieve the required amount of 10 ng and 50 ng, the drop pattern was applied 4 and 20 times, which resulted in 72 and 360 droplets, respectively. To ensure a complete evaporation of the solvent, the sample carrier was dried for 15 s after each application of the pattern.
The lateral distribution showed that each nL deposition on one sample has a diameter of about 100 μm and the distance between two nL depositions is about 0.5 mm to 1 mm, depending on the pattern. In total, nine nL depositions were used for a pattern, covering a surface of about 2.5 mm2. The material is localized in these nL depositions, which can reach a height of up to 3 μm.
The strongly inhomogeneous lateral distribution of the material deposited on the substrate does not influence the TXRF quantification using an internal standard Ga in the case of an almost identical spatial distribution between the standard and the other elements in the sample, similar to the μL droplets. One should note that the similarity of the spatial distribution of the standard and the analytes strongly depends on the sample preparation procedure.
2.3 Sub-monolayer thin films
Different samples in comparison to the other two types of samples are sub-monolayer thin films. They have been developed as thin layer type reference samples for TXRF analysis and calibration samples for quantitative XRF investigations, respectively.20,39 The extremely high homogeneity (laterally and in thickness) and low mass deposition of thin films qualify for TXRF applications, excluding matrix effects.These samples were deposited on the same type of quartz glass substrate by AXO DRESDEN using high precision dual ion beam deposition (DIBD) and have the advantage that the whole surface is covered with the deposited material. Therefore, it is more useful to specify the mass deposition in g cm−2.
Three elements were deposited: Sc, Cr and Ni. The PTB measured the absolute mass deposition of these elements using reference-free (GI)XRF21 and Cr was chosen to be the internal standard. Two different thin film samples were provided for the round robin test with the following internal standards of Cr: (5.22 ± 0.30) ng cm−2 and (18.2 ± 1.1) ng cm−2. The samples are labeled C0 and C4.
2.4 Round robin test participants
In total, seven institutes and companies were involved in the round robin test. Four participants were partners of the German WIPANO TXRF project TXRF-KAL: Bruker Nano, Berlin, Germany; MEET, Münster, Germany; ISAS, Dortmund, Germany and PTB, Berlin, Germany. The BAM, Berlin, Germany was an external participant as well as the international participants LNE-LNHB, Paris, France and Rigaku Corporation, Osaka, Japan.2.5 TXRF measurement protocol
In order to ensure comparable and valuable measurements and be able to identify possible sources of error, the round robin participants were requested to pursue the following instructions and to provide detailed information about the quantification of their respective TXRF measurements.The TXRF analysis of each sample should be based on the measurements of at least 1000 s total time. The total measurements were split into three to four parts in which the sample should be rotated by 0°, 90°, 180° and 270°, each spectrum with 250 s beat or 0°, 120°, and 240°, each spectrum with 330 s beat. If it was not possible to perform rotation of the sample, it was asked to be indicated in the procedure. Every spectrum should be saved separately and be provided. Also the information about the laboratory, instrument, operator and person in charge should be provided. For the quantification process, each spectrum as well as the sum of all spectra should be considered. Finally, the results should be provided including a reasonable number of digits, reflecting the uncertainty.17,40
All participants were willing to fulfill the requirements of the measurement protocol and implemented them manually in some cases. The deployment and adherence to this measurement protocol were an important step towards the quality development of TXRF.
2.6 Validation measurements
For the validation of the absolute mass deposition and for the definition of the internal standard for the thin film samples, reference-free XRF under total reflection and grazing incidence conditions was performed with monochromatized synchrotron radiation in the PTB laboratory at BESSY II,41,42 using an ultra-high vacuum chamber43 optimized for this purpose. The samples can be aligned to the pivot point of the chamber using translation and rotation motors with respect to the incident excitation beam. This allows for the irradiation of the samples at their respective centers for all incident angles. The incident photon flux is detected with radiometrically calibrated photodiodes44 and the emitted fluorescence radiation is detected by means of a SDD, calibrated with respect to its detection efficiency and response behavior.45,46 A schematic diagram of the experimental setup used for the reference-free TXRF and GIXRF can be found i.a. in ref. 21 and 47.3 Results and discussion
The results are separated into two sections. The first section is about the round robin test, where the quantification procedure using an internal standard is described and the determined total masses of the respective elements are shown for the three kinds of samples. The second section describes the validation by physically traceable XRF of one selected μL-sample, including an uncertainty budget.3.1 Round robin test results
The round robin test was to be performed under total reflection conditions using TXRF (or appropriate GIXRF) instrumentation. The aim was to obtain a set of analytical results in order to find out some specific but significant number of merits of TXRF. For this run, several sets of ready to measure samples were provided by the project partners Bruker Nano, MEET and AXO DRESDEN. As one may expect an influence of the sample preparation on the instrumental response different types of samples were arranged. All samples comprise an internal standard, as described in detail in Section 2.1. In the following section, the quantification using an internal standard is summarized.The criteria for the limits of the material deposited that can be used in the TXRF quantification procedure were established by Klockenkämper and von Bohlen in 1989.2 Typical covering mass depositions, i.e. the amount of material per unit area and its equivalent thickness, are summarized in Table 1. Higher values than the quoted ones will lead to matrix effects beyond the linear quantification regime of TXRF. The regime is in line,2 considering the positive effects of an internal standardization and assuming that matrix-effects are negligible, i.e. below 5%.28 If the covering mass deposition (m/FI)max is kept constant while allowing for incomplete or non-uniform covering, the thickness of a specimen can even exceed the tabulated value of dmax 10 to 100 times.28 The lower limits regarding the thicknesses are restricted by the incomplete excitation by the X-ray standing wave field.48
| Matrices | Organic tissue | Mineral powder | Metallic covers |
|---|---|---|---|
| Covering (mass deposition) | |||
| (m/FI)max/μg cm−2 | 250 | 140 | 8 |
| (m/FI)min/μg cm−2 | 1 × 10⁻⁵ | 1 × 10⁻⁵ | 1 × 10⁻⁵ |
![[thin space (1/6-em)]](https://www.rsc.org/images/entities/char_2009.gif) |
|||
| Thickness | |||
| d max/μm | 12 | 0.7 | 0.01 |
| d min/μm | 0.015 | 0.015 | 0.015 |
The relative sensitivities can be obtained from e.g.2 These element sensitivities follow a smooth function, and are strictly dependent on the instrument. They have to be determined for each device (mostly the manufacturer of the device supplies the customer with a complete set of sensitivities), as shown. by Sparks et al.49
After recording spectra, the typical treatment of spectral background subtraction, peak deconvolution and correction of spectral artifacts like pile-up and escape-peak corrections are made before using the net intensities for quantification. As a last step for quantitative evaluation of the element composition the addition of an internal standard element is necessary. Therefore, an element not present in the sample is added in a known amount to the sample. Starting from this known fraction (g g−1 or mol mol−1 or atoms per cm2) or concentration (g mL−1) of the added element the quantification is carried out using the simple equation:
 | (2) |
A precision of the order of 2% to 3% relatively is expected for the best determinations limited by the accuracy of the relative sensitivities used for quantification. In praxis a good precision and accuracy of the order of 5% relatively is accepted for TXRF analysis. Values exceeding 25% deviations are considered to be used with care.
One should note that chemically traceable TXRF provides analytical results that are related to the actual mass of the standard element deposited. Due to typical pipetting or evaporation effects of the preparation of droplet samples, the actual absolute mass of the standard may differ from the nominal expectation.
 | ||
| Fig. 3 Exemplary bar- and boxplot of the round robin test results for Mn from the μL droplets with a total mass of 10 ng. (a) Results of the μL droplets (10 ng total mass) from the respective laboratories for Mn, presented in a barplot. (b) Boxplot of all data points from the measurements of the μL droplets (10 ng total mass). The total mass for element Mn is shown. | ||
In addition, the result of every single measurement was combined in a dataset for each sample class. These datasets are shown in boxplots (see the ESI†), including the median value, the lower and upper quartile (Ql and Qu), and the minimum and maximum value as well as suspected and confirmed outliers. The minimum and maximum are defined in the following manner using the interquartile range IQR = Qu − Ql:
| Minimum = Ql − 1.5 × IQR | (3) |
| Maximum = Qu + 1.5 × IQR | (4) |
In Fig. 3b, the boxplot with the results of Mn from the droplet samples (10 ng total mass) are shown exemplarily for the determination of the median value, the lower and upper quartile (Ql and Qu), and the minimum and maximum value as well as suspected and confirmed outliers. Anonymity of the particular laboratories was maintained using a random laboratory number and the single measurement results were sorted and consecutively numbered.
The results of the weighted mean values, the median values and the upper and lower quartile are listed in respective tables for every type of sample (Tables 2–7). In general, the results are mostly within 5% uncertainty, and are in very good agreement between different laboratories in a round robin test. Some laboratories showed significantly higher statistical deviation in the final result than others. This might be caused by different instrumentations and the associated possibility of sample alignment. The element Ni shows higher deviations than the other elements, which might be caused by excitation radiation induced fluorescence radiation of instrumentation materials, reaching the X-ray detector by a second scattering process e.g. at the substrate, or alternatively by direct substrate contamination. This systematic error would lead to a determined Ni mass deposition higher than the actual value in the multi-element standard solution. This can be seen in some of the results for Ni, indicated with striped bars in the ESI.† The respective weighted mean values were calculated with and without these suspected outliers.
| μL droplets (10 ng) | Weighted mean value | Median value | Q l | Q u |
|---|---|---|---|---|
| Sc (5 ng) | (5.04 ± 0.26) ng | 5.13 ng | 4.65 ng | 5.46 ng |
| Mn (2 ng) | (1.97 ± 0.09) ng | 1.99 ng | 1.93 ng | 2.03 ng |
| Ni (1 ng) | (1.03 ± 0.05) ng | 1.01 ng | 0.99 ng | 1.06 ng |
| Y (1 ng) | (1.05 ± 0.06) ng | 1.08 ng | 1.02 ng | 1.12 ng |
| μL droplets (50 ng) | Weighted mean value | Median value | Q l | Q u |
|---|---|---|---|---|
| Sc (25 ng) | (25.27 ± 1.16) ng | 25.05 ng | 23.60 ng | 26.82 ng |
| Mn (10 ng) | (10.14 ± 0.45) ng | 10.10 ng | 9.98 ng | 10.28 ng |
| Ni (5 ng) | (5.19 ± 0.23) ng | 5.13 ng | 5.02 ng | 5.25 ng |
| Y (5 ng) | (5.31 ± 0.24) ng | 5.29 ng | 5.17 ng | 5.69 ng |
| nL droplets (10 ng) | Weighted mean value | Median value | Q l | Q u |
|---|---|---|---|---|
| Sc (5 ng) | (5.08 ± 0.23) ng | 4.93 ng | 4.81 ng | 5.39 ng |
| Mn (2 ng) | (2.00 ± 0.09) ng | 2.03 ng | 1.98 ng | 2.08 ng |
| Nia (1 ng) | (1.06 ± 0.06) ng | 1.04 ng | 1.01 ng | 1.24 ng |
| Nib (1 ng) | (1.03 ± 0.06) ng | |||
| Y (1 ng) | (1.05 ± 0.06) ng | 1.04 ng | 1.00 ng | 1.09 ng |
| nL droplets (50 ng) | Weighted mean value | Median value | Q l | Q u |
|---|---|---|---|---|
| Sc (25 ng) | (25.12 ± 1.00) ng | 24.80 ng | 23.97 ng | 25.33 ng |
| Mn (10 ng) | (10.05 ± 0.40) ng | 10.18 ng | 10.04 ng | 10.35 ng |
| Ni (5 ng) | (5.21 ± 0.23) ng | 5.15 ng | 5.09 ng | 5.37 ng |
| Y (5 ng) | (5.36 ± 0.24) ng | 5.42 ng | 5.22 ng | 5.52 ng |
| Thin film C0 | Weighted mean value | Median value | Q l | Q u |
|---|---|---|---|---|
| Sc | (3.64 ± 0.10) ng cm−2 | 3.65 ng cm−2 | 3.48 ng cm−2 | 3.83 ng cm−2 |
| Nia | (6.67 ± 0.21) ng cm−2 | 6.83 ng cm−2 | 6.53 ng cm−2 | 8.48 ng cm−2 |
| Nib | (6.55 ± 0.22) ng cm−2 |
| Thin film C4 | Weighted mean value | Median value | Q l | Q u |
|---|---|---|---|---|
| Sc | (13.91 ± 0.38) ng cm−2 | 13.68 ng cm−2 | 12.83 ng cm−2 | 14.17 ng cm−2 |
| Ni | (23.61 ± 0.62) ng cm−2 | 23.80 ng cm−2 | 22.74 ng cm−2 | 24.21 ng cm−2 |
The round robin test, performed with three different sample-types, had an excellent result of about 5% agreement. There is no significant difference in the results of the respective types of samples, which on the one hand indicates a careful investigation and selection of the samples for the round robin test. On the other hand, it illustrates that all types of samples are suitable for TXRF applications. The results of the round robin test showed that it is possible to reach an uncertainty of about 5% with clearly defined and proven procedures for sample preparation and measurements. A further reduction of the uncertainty in a round robin test is rather difficult and expensive because of different, independent instrumentation and laboratories.
3.2 Validation by physically traceable XRF
In order to validate the results of the round robin samples, reference-free XRF was performed for one of the μL droplets with a nominal total mass of 50 ng. Reference-free GIXRF measurements, performed at the PTB with radiometrically calibrated instrumentation21 and the knowledge of relevant atomic fundamental parameters, allow for a quantitative analysis of the mass deposition and the qualification of reference materials or calibration samples.20GIXRF is a technique with modified penetration depth distribution at different angles of incidence. This is due to the interaction of the incident and reflected beam in the range of the critical angle of total external reflection on flat substrates. This interaction causes an X-ray standing wave (XSW) field, which modifies the excitation conditions of the sample.28 The use of GIXRF gives an insight into many different proprieties of the samples and sample carriers regularly used in TXRF. GIXRF allows distinguishing of some characteristics of the morphology and distribution of the applied sample material or stratified multilayer systems.21,50
For the sake of clarity of the following steps, we consider several terms; the propagation footprint is the footprint in the direction of the beam propagation, and thus the footprint in the storage ring plane. The horizontal distribution is in the direction perpendicular to the direction of the beam propagation, in the storage ring plane as well. The vertical direction is perpendicular to the storage ring plane.
First, for the determination of the absolute mass deposition under TXRF-conditions, the XSW-field intensity has to be known for the respective incident angle. A GIXRF angular scan provides an XSW-field intensity enhancement factor of 1.60(32). A more detailed description of the GIXRF measurements can be found in the ESI.† Second, the vertical size (FWHM) of the incident beam footprint is smaller than the μL droplet in vertical direction, which leads to the necessity of performing a lateral scan (shown in the ESI†). With this information, the quantification procedure can be performed.
The characterization of the preselected μL and nL droplets revealed that suitable TXRF samples do not have to be ideally produced, as long as the internal standard shows an identical behavior as the other elements of interest in the sample. In particular, first the GIXRF measurements showed deviations from the ideal shape, mainly caused by the roughness of the substrate. The high roughness leads to a mixture of TXRF and XRF excitation, reducing the enhancement factor from ideally 2 for particulate type samples28,48 down to 1.6 with an estimated uncertainty of about 20%. In addition, the lateral distribution of the material in the μL and nL droplets is not homogeneous (see Fig. 2a and b). Still, the round robin test using these samples showed an excellent agreement in the results of the respective laboratories, illustrating the importance of the sample preparation for TXRF measurements when using an internal standard.
Here, the starting point is the reference-free quantification with the fundamental parameter approach for the determination of the mass deposition mi/FI with the unit area FI of the element i, following modified Sherman-equation approaches.6,21
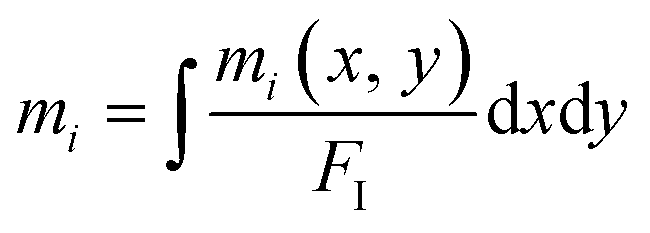
Under TXRF conditions, when the propagation footprint of the incident beam is projected up to several hundreds of mm, the size of the sample in the propagation direction has to be known to identify the fraction of the incident beam footprint, which hits and interacts with the sample, for correct calculations of the mass deposition mi/FI. But when the total mass is of interest, which is the case for the droplet sample pipetted on the glass substrate, the actual size of the sample in the propagation direction does not have to be known because of the following reason: in order to achieve the total mass, an integration of the mass deposition  in both the direction of the beam propagation and the vertical direction is necessary. Following eqn (5) illustrates the method.
 | (5) |
In the propagation direction, where the incident beam intensity is almost constant over the whole glass substrate, the integration becomes a product of the mass deposition and the sample size. Because the same sample size is used in order to calculate the fraction of the incident beam footprint for the determination of the mass deposition, it cancels itself out. A detailed description is given in the ESI.†
In the vertical direction, the sample size was larger than the incident beam and therefore a numerical integration was performed as a function of the vertical position. Further details on this quantification procedure aspect can be found in the ESI.† In the experiment, the step size was five times smaller than the FWHM of the vertical beam to make sure that the uncertainty of the numerical integration is small. The method for the numerical integration was the Newton–Cotes formulas implemented in the programming language IDL.54
| Element | Total mass |
|---|---|
| Sc (25 ng) | (22.1 ± 5.0) ng |
| Mn (10 ng) | (8.3 ± 2.0) ng |
| Ni (5 ng) | (4.2 ± 0.9) ng |
| Ga (5 ng) | (4.1 ± 0.9) ng |
First, the reference-free quantification of the mass deposition has an uncertainty dominated by the atomic fundamental parameters. In Table 9, the individual parameters of the reference-free quantification and the contribution to the total uncertainty are listed.
| Parameter | Rel. uncertainty/10−2 | Comment |
|---|---|---|
| P 0 | 2.0 | Photon flux of the incident radiation |
| P i | 1.8 | Photon flux of the fluorescence radiation |
| I XSW | 20 (estimation) | Relative XSW field intensity |
| τ X i ,E0 | 2.0 | Partial photoionization cross-section |
| Ω det | 4.0 | Effective solid angle of detection |
| μ tot,E0,Ei | 2.0 | Effective total absorption cross-section |
| ω X i | 4.0 | Fluorescence yield |
| g l,Xi | 1.0 | Transition probability |
Second, the XSW field intensity for the incident angle used for the quantification has an uncertainty.
Third, the assumption of an identical GIXRF behavior for every vertical lateral position of the sample is an approximation. The combined uncertainty for the second and third contribution is estimated with 20%.
A detailed uncertainty budget, calculated with the GUM Workbench software,55 is given in the ESI.†
When performing quantification without an internal standard, the non-idealistic properties of the samples, like the high surface roughness or the lateral inhomogeneity of the material, have to be determined and considered. This increases the uncertainty of the result while being traceable when using calibrated instrumentation and the atomic fundamental parameter approach for the reference-free quantification.
Within the uncertainty the determined total mass of the respective elements is in line with the nominal value from the multi-element standard solution (listed in Table 8 in bracelets). But, the determined total mass is about 15% lower than the nominal value for all elements measured, indicating not-quantified effects of pipetting losses or evaporation effects in the comparison of the determined and nominal total mass.
A reason for the deviation could be that the total mass of the randomly chosen μL droplet sample is indeed lower than the absolute mass aimed at. Additionally performed XRF measurements, where the uncertainty contribution of the XSW-field is negligible, suggest this assumption. Upon the preparation of the μL droplets, it is likely that a dispersion of the deposited total mass occurs during the pipetting or the drying stage. A preliminary examination of the droplets showed that the detected count rates have a standard deviation of about 10% from the mean value. The minimum and maximum values have a difference of about 20%. A previous study17 also reported a high experimental standard deviation, which was strongly influenced by the deposition. Not-quantified loss processes of the total mass can also occur when pipetting the standard solution (material remains in the pipette) or when drying the droplet (material evaporation). These deposited mass reducing effects may occur for all pre-selected samples in the round robin test but were not quantified. The quantification in the round robin activity has been performed by normalization of the internal standard Ga, which was defined as the intended nominal value of 5 ng total mass.
One should note that the determination of absolute masses (instead of concentration ratios) would require an appropriate pre-calibration of the instrumental efficiency e.g. by means of stratified thin-layer calibration samples and was not part of the round robin activity.
Using the reference-free quantification with the fundamental parameter approach, the mass depositions of all elements in the sample including the internal standard were determined in a physically traceable manner. Thereby, a validation of the total mass of one randomly chosen droplet-sample has been performed. A subsequent normalization to the nominal value of the internal standard Ga would match the result of the round robin test. A variation of the mass of the internal standard Ga in the individual samples was not investigated by reference-free XRF for the round robin activity in view of the chemically traceable quantification intended. Only variations in the elemental mass depositions between Ga and other elements, respectively, would have affected the results of the round robin test for a specific sample.
3.3 Normative work
Currently, ISO standards at the level of international standardization exist for TXRF specifically in semiconductor production (ISO 14706:2014,56 ISO 17331:2004 57) and describe the analysis of contamination on wafer surfaces. For a general description of terms and principles of TXRF only a DIN standard (DIN 51003:2004 25) was published several years ago. Therefore, TXRF is established for chemical analysis in environmental analysis, forensics, clinical diagnostics and for the control of food and pharmaceuticals on a broad basis exclusively in laboratories of research institutes and universities.In recent years, more powerful low-power X-ray tubes, large-area detectors, tunable or focusing monochromators, more powerful spectra unfolding algorithms and new preparation techniques have been developed. For a general TXRF standard, an adaptation to the current state of the art and a validation by means of a successfully carried out inter-laboratory comparison are mandatory in order to guarantee the validity of this standard and to promote the spread of TXRF in industrial quality control.
At the international level, standardization is being promoted by the ISO Technical Committee (TC) 201 and the recently established Sub-Committee SC10. The standardization of the method is currently being carried out for the analysis of biological and environmental samples (ISO/TS 18507:2015,58 ISO 20289:2018 59), but these ISO documents, which are implemented as technical specifications, focus on the description of sample preparation, the presentation of case studies and the comparison with other atomic spectroscopic methods. It is remarkable that both standards refer to DIN 51003, which increases the need to revise this outdated German standard.
In view of recent international inter-laboratory comparison results15,16 as well as the validation of an updated German standard, the successful implementation of a predominantly national inter-comparison was necessary, which led to traceable measurement results under comparable conditions with ideal conventional and novel nanoscaled samples and thus described the analytical characteristics of the TXRF independent of sampling and sample preparation.
In the short term, the completely revised DIN standard will be introduced as a new work item proposal within the framework of ISO/TC 201.
4 Conclusions
It has been shown that a TXRF round robin test of different kinds of well-characterized micro- and nanoscaled samples can achieve excellent results with respect to both accuracy and precision in comparison to earlier TXRF round robin tests in which only multi-elemental solutions but no already dried-in residue samples were provided.15,16 The quantification was chemically traceable, and was thus based on an internal standard in all samples (plus pre-calibration of instruments). All investigated sample types, μL droplets, nL droplets and thin films, are suitable for TXRF applications under the condition of a similar spatial distribution between the internal standard and the other elements of interest.The round robin results confirmed nearly equal appropriateness of all three kinds of samples for reliable TXRF calibration purposes.
By preselecting all dried-in samples in terms of analytical recovery rates higher than 97% of the respective mean recovery rate for every element of interest and by characterizing selected samples with respect to their TXRF response behavior, the specific requirements of sample distribution on the reflective carrier could be ensured. This includes the proof of the sample at different rotational orientations with respect to the primary incident beam. Such a procedure can be recommended not only for the qualification of round robin or calibration samples, but also as a quality measure of the deposition homogeneity in routine analysis. The methods for the characterization were μXRF, GIXRF and reference-free quantification, revealing the spatial distribution, the depth profile and the absolute amount of the material, respectively.
The determination of the absolute mass deposition with physically traceable, reference-free (T)XRF includes two goals: first, the qualification of calibration samples providing the internal standard for the thin films. Second, the validation of the internal standard in dried-in residue of liquid samples (μL droplets and nL droplets).
These preselected and well characterized samples are suited as pre-calibration samples for table-top TXRF-instrumentation. On the basis of the successful round robin test, the standardization of TXRF will proceed with respect to a revision of the DIN standard 51003 and the transfer towards the ISO. Further, the participation of laboratories using TXRF in proficiency testings of round robin activities is highly recommended in view of the adequate use of the method and for reliable quality management.
The subsequent international round robin intended may demonstrate the impact of instrument specific calibration procedures.
Conflicts of interest
There are no conflicts to declare.Acknowledgements
The study regarding TXRF analysis of droplets in a round robin test with quantification using an internal standard and reference-free quantification at the PTB was related to the WIPANO project “TRFA-KAL”. The financial support of the WIPANO program is gratefully acknowledged. It is funded by the German Bundesministerium für Wirtschaft und Energie. The authors would like to thank all the participants of the round robin activities.References
- E. Hund, D. Luc Massart and J. Smeyers-Verbeke, Inter laboratory studies in analytical chemistry, Anal. Chim. Acta, 2000, 423(2), 145–165, DOI:10.1016/S0003-2670(00)01115-6 , ISSN: 0003-2670..
- R. Klockenkämper and A. von Bohlen, Determination of the critical thickness and the sensitivity for thin-film analysis by total reflection X-ray fluorescence spectrometry, Spectrochim. Acta, Part B, 1989, 44(5), 461–469, DOI:10.1016/0584-8547(89)80051-5 , ISSN: 0584-8547..
- A. Iida, et al., Synchrotron radiation excited X-ray fluorescence analysis using total reflection of X-rays, Anal. Chem., 1986, 58(2), 394–397, DOI:10.1021/ac00293a029.
- C. Streli, Recent Advances in TXRF, Appl. Spectrosc. Rev., 2006, 41(5), 473–489, DOI:10.1080/10543400600809318.
- C. Streli, et al., Synchrotron radiation induced TXRF, J. Anal. At. Spectrom., 2008, 23(6), 792–798, 10.1039/B719508G.
- B. Beckhoff, et al., Reference-free total reflection X-ray fluorescence analysis of semiconductor surfaces with synchrotron radiation, Anal. Chem., 2007, 79(20), 7873–7882 CrossRef CAS PubMed.
- B. Beckhoff, et al., Handbook of Practical X-Ray Fluorescence Analysis, Springer, 2007, ISBN: 978-3-540-28603-5 Search PubMed.
- M. Schmeling, Total reflection X-ray fluorescence, Phys. Sci. Rev., 2019, 4(7), 20170161, DOI:10.1515/psr-2017-0161.
- R. Fernández-Ruiz, et al., Total-reflection X-ray fluorescence: an alternative tool for the analysis of magnetic ferrofluids, Spectrochim. Acta, Part B, 2008, 63(12), 1387–1394, DOI:10.1016/j.sab.2008.10.017 , A collection of papers presented at the 12th Conference on Total Reflection X-Ray Fluorescence Analysis and Related Methods (TXRF 2007), ISSN: 0584-8547..
- I. Rink, et al., Calibration of straight total reflection X-ray fluorescence spectrometry—results of a European round robin test, Spectrochim. Acta, Part B, 2001, 56(11), 2283–2292, DOI:10.1016/S0584-8547(01)00297-X , 8th Conference on Total Reflection X-Ray Fluorescence Analysis and Related Methods, ISSN: 0584-8547..
- L. Borgese, et al., Total reflection of X-ray fluorescence (TXRF): a mature technique for environmental chemical nanoscale metrology, Meas. Sci. Technol., 2009, 20(8), 084027, DOI:10.1088/0957-0233/20/8/084027.
- H. Takahara, et al., Vapor phase treatment–total reflection X-ray fluorescence for trace elemental analysis of silicon wafer surface, Spectrochim. Acta, Part B, 2013, 90, 72–82, DOI:10.1016/j.sab.2013.10.006 , ISSN: 0584-8547..
- A. Nutsch, et al., Comparability of TXRF Systems at Different Laboratories, ECS Trans., 2009, 25(3), 325–335, DOI:10.1149/1.3204423.
- R. Klockenkämper, et al., Results of proficiency testing with regard to sediment analysis by FAAS, ICP-MS and TXRF, J. Anal. At. Spectrom., 2001, 16(6), 658–663, 10.1039/B101481L.
- L. Borgese, et al., First total reflection X-ray fluorescence round robin test of water samples: preliminary results, Spectrochim. Acta, Part B, 2014, 101, 6–14, DOI:10.1016/j.sab.2014.06.024 , ISSN: 0584-8547..
- International Atomic Energy Agency, Results of the IAEA proficiency test PTXRFIAEA11: TXRF determination of minor and trace elements in water samples, in X Ray Fluorescence in the IAEA and its Member States Newsletter No. 27, XRF Newsletter 27, International Atomic Energy Agency, Vienna, 2017, https://www.iaea.org/publications/12234/x-ray-fluorescence-in-the-iaea-and-its-member-states-newsletter-no-27 Search PubMed.
- G. H. Floor, et al., Measurement Uncertainty in Total Reflection X-Ray Fluorescence, Spectrochim. Acta, Part B, 2015, 111, 30–37, DOI:10.1016/j.sab.2015.06.015 , ISSN: 0584-8547..
- S. Riaño, et al., Practical guidelines for best practice on total reflection X-ray fluorescence spectroscopy: analysis of aqueous solutions, Spectrochim. Acta, Part B, 2016, 124, 109–115, DOI:10.1016/j.sab.2016.09.001 , ISSN: 0584-8547..
- M. Evertz, et al., Total reflection X-ray fluorescence in the field of lithium ion batteries – elemental detection in lithium containing electrolytes using nanoliter droplets, Spectrochim. Acta, Part B, 2018, 149, 118–123, DOI:10.1016/j.sab.2018.07.027 , ISSN: 0584-8547..
- P. Hönicke, et al., Development and characterization of sub-monolayer coatings as novel calibration samples for X-ray spectroscopy, Spectrochim. Acta, Part B, 2018, 145, 36–42, DOI:10.1016/j.sab.2018.04.001 , ISSN: 0584-8547..
- R. Unterumsberger, et al., Complementary Characterization of Buried Nanolayers by Quantitative X-Ray Fluorescence Spectrometry under Conventional and Grazing Incidence Conditions, Anal. Chem., 2011, 83(22), 8623–8628, DOI:10.1021/ac202074s , PMID: 21961904..
- B. Beckhoff, Reference-free X-ray spectrometry based on metrology using synchrotron radiation, J. Anal. At. Spectrom., 2008, 23(6), 845–853 RSC.
- K. N. Stoev and K. Sakurai, Review on grazing incidence X-ray spectrometry and reflectometry, Spectrochim. Acta, Part B, 1999, 54(1), 41–82, DOI:10.1016/S0584-8547(98)00160-8 , ISSN: 0584-8547..
- A. von Bohlen, Total reflection X-ray fluorescence and grazing incidence X-ray spectrometry – tools for micro- and surface analysis. A review, Spectrochim. Acta, Part B, 2009, 64(9), 821–832, DOI:10.1016/j.sab.2009.06.012 , ISSN: 0584-8547..
- DIN 51003:2004-05, Totalreektions-Röntgenuoreszenz-Analyse (TXRF) – Allgemeine Grundlagen und Begriffe, Tech. rep. DIN, 2004, DOI: DOI:10.31030/9538585.
- A. von Bohlen and R. Fernández-Ruiz, Experimental evidence of matrix effects in total-reflection X-ray fluorescence analysis: coke case, Talanta, 2020, 209, 120562, DOI:10.1016/j.talanta.2019.120562 , ISSN: 0039-9140..
- A. Prange, K. Kramer and U. Reus, Determination of trace element impurities in ultrapure reagents by total reflection X-ray spectrometry, Spectrochim. Acta, Part B, 1991, 46(10), 1385–1393, DOI:10.1016/0584-8547(91)80188-9 , ISSN: 0584-8547..
- Performance of TXRF and GI-XRF Analyses, in Total-Reflection X-Ray Fluorescence Analysis and Related Methods, ed. R. Klockenkämper and A. von Bohlen, John Wiley & Sons, Ltd, 2014, ch. 4, pp. 205–290, DOI:10.1002/9781118985953.ch04, ISBN: 9781118460276.
- I. De La Calle, et al., Sample pretreatment strategies for total reflection X-ray fluorescence analysis: a tutorial review, Spectrochim. Acta, Part B, 2013, 90, 23–54, DOI:10.1016/j.sab.2013.10.001 , ISSN: 0584-8547..
- G. Wellenreuther, et al., Optimizing total reflection X-ray fluorescence for direct trace element quantification in proteins I: influence of sample homogeneity and reflector type, Spectrochim. Acta, Part B, 2008, 63(12), 1461–1468, DOI:10.1016/j.sab.2008.10.006 , A collection of papers presented at the 12th Conference on Total Reflection X-Ray Fluorescence Analysis and Related Methods (TXRF 2007), ISSN: 0584-8547..
- A. G. L. Williams, et al., Spreading and retraction dynamics of sessile evaporating droplets comprising volatile binary mixtures, J. Fluid Mech., 2021, 907, A22, DOI:10.1017/jfm.2020.840.
- D. Hellin, et al., Saturation effects in TXRF on micro-droplet residue samples, J. Anal. At. Spectrom., 2004, 19(12), 1517–1523, 10.1039/B410643A.
- S. Pahlke, et al., Determination of ultra trace contaminants on silicon wafer surfaces using total-reflection X-ray fluorescence TXRF state-of-the-art, Spectrochim. Acta, Part B, 2001, 56(11), 2261–2274, DOI:10.1016/S0584-8547(01)00312-3 , 8th Conference on Total Reflection X-Ray Fluorescence Analysis and Related Methods, ISSN: 0584-8547..
- R. D. Deegan, et al., Capillary flow as the cause of ring stains from dried liquid drops, Nature, 1997, 389(6653), 827–829, DOI:10.1038/39827 , ISSN: 1476-4687..
- C. Horntrich, et al., Production of the ideal sample shape for total reflection X-ray fluorescence analysis, Spectrochim. Acta, Part B, 2012, 77, 31–34, DOI:10.1016/j.sab.2012.07.026 , ISSN: 0584-8547..
- U. E. A. Fittschen and G. J. Havrilla, Picoliter Droplet Deposition Using a Prototype Picoliter Pipette: Control Parameters and Application in Micro X-Ray Fluorescence, Anal. Chem., 2010, 82(1), 297–306, DOI:10.1021/ac901979p , PMID: 19938818..
- U. E. A. Fittschen, et al., Characteristics of Picoliter Droplet Dried Residues as Standards for Direct Analysis Techniques, Anal. Chem., 2008, 80(6), 1967–1977, DOI:10.1021/ac702005x , PMID: 18266339..
- M. Tanaka, et al., Recommended table for the density of water between 0 °C and 40 °C based on recent experimental reports, Metrologia, 2001, 38(4), 301–309, DOI:10.1088/0026-1394/38/4/3.
- M. Krämer, et al., Ultrathin layer depositions – a new type of reference samples for high performance XRF analysis, Adv. X-ray Anal., 2011, 54, 299–304 Search PubMed.
- R. Fernáandez-Ruiz, Uncertainty in the Multielemental Quantification by Total-Reflection X-Ray Fluorescence: Theoretical and Empirical Approximation, Anal. Chem., 2008, 80(22), 8372–8381, DOI:10.1021/ac800780x , PMID: 18942850..
- G. Ulm et al., PTB radiometry laboratory at the BESSY II electron storage ring, in X-Ray Optics, Instruments, and Missions, ed. R. B. Hoover and A. B. C. Walker II, International Society for Optics and Photonics, SPIE, 1998, vol. 3444, pp. 610–621, DOI: DOI:10.1117/12.331283.
- B. Beckhoff, et al., A quarter-century of metrology using synchrotron radiation by PTB in Berlin, Phys. Status Solidi B, 2009, 246(7), 1415–1434, DOI:10.1002/pssb.200945162.
- J. Lubeck, et al., A novel instrument for quantitative nanoanalytics involving complementary X-ray methodologies, Rev. Sci. Instrum., 2013, 84(4), 045106 CrossRef CAS PubMed.
- M. Krumrey and G. Ulm, High-accuracy detector calibration at the PTB four-crystal monochromator beamline, Nucl. Instrum. Methods Phys. Res., Sect. A, 2001, 467–468, 1175–1178, DOI:10.1016/S0168-9002(01)00598-8.
- M. Krumrey, et al., Calibration and characterization of semiconductor X-ray detectors with synchrotron radiation, Nucl. Instrum. Methods Phys. Res., Sect. A, 2006, 568, 364–368, DOI:10.1016/j.nima.2006.06.004.
- F. Scholze and M. Procop, Modelling the response function of energy dispersive X-ray spectrometers with silicon detectors, X-Ray Spectrom., 2009, 38(4), 312–321, DOI:10.1002/xrs.1165.
- P. Hönicke, et al., Reference-free, depth-dependent characterization of nanolayers and gradient systems with advanced grazing incidence X-ray fluorescence analysis, Phys. Status Solidi A, 2015, 212(3), 523–528, DOI:10.1002/pssa.201400204.
- A. von Bohlen, et al., The influence of X-ray coherence length on TXRF and XSW and the characterization of nanoparticles observed under grazing incidence of X-rays, J. Anal. At. Spectrom., 2009, 24(6), 792–800, 10.1039/B811178B.
- C. M. Sparks, U. E. A. Fittschen and G. J. Havrilla, Picoliter solution deposition for total reflection X-ray fluorescence analysis of semi conductor samples, Spectrochim. Acta, Part B, 2010, 65(9), 805–811, DOI:10.1016/j.sab.2010.07.003 , ISSN: 0584-8547..
- F. Reinhardt, et al., Reference-free quantification of particle-like surface contaminations by grazing incidence X-ray fluorescence analysis, J. Anal. At. Spectrom., 2012, 27(2), 248–255, 10.1039/C2JA10286B.
- Y. Ménesguen, et al., Experimental determination of the X-ray atomic fundamental parameters of nickel, Metrologia, 2017, 55(1), 56–66, DOI:10.1088/1681-7575/aa9b12.
- R. Unterumsberger, et al., Accurate experimental determination of gallium K- and L3-shell XRF fundamental parameters, J. Anal. At. Spectrom., 2018, 33(6), 1003–1013, 10.1039/C8JA00046H.
- M. Müller et al., Reliable Quantification of Inorganic Contamination by TXRF, in Ultra Clean Processing of Semiconductor Surfaces X. Vol. 187. Solid State Phenomena, Trans Tech Publications Ltd, 2012, pp. 291–294, DOI: DOI:10.4028/SSP.187.291.
- Inc. Harris Geospatial Solutions, Interactive Data Language (IDL), visited on 09/07/2020, https://www.harrisgeospatial.com/docs/using_idl_home.html.
- GUM Workbench, Version 2.4.1.392, Metrodata GmbH, 1996–2010 Search PubMed.
- ISO 14706:2014, Surface chemical analysis – determination of surface elemental contamination on silicon wafers by total-reflection X-ray fluorescence (TXRF) spectroscopy, Tech. rep. ISO/TC 201, 2014 Search PubMed.
- ISO 17331:2004, Surface chemical analysis – chemical methods for the collection of elements from the surface of silicon-wafer working reference materials and their determination by total-reflection X-ray fluorescence (TXRF) spectroscopy, Tech. rep. ISO/TC 201, 2004 Search PubMed.
- ISO/TS 18507:2015, Surface Chemical Analysis – Use of Total Reflection X-Ray Fluorescence Spectroscopy in Biological and Environmental Analysis, Research rep. ISO, 2015 Search PubMed.
- ISO 20289:2018, Surface chemical analysis – total reflection X-ray fluorescence analysis of water, Tech. rep. ISO, 2018 Search PubMed.
Footnote |
| † Electronic supplementary information (ESI) available. See DOI: 10.1039/d1ja00103e |
| This journal is © The Royal Society of Chemistry 2021 |