
 Open Access Article
 This Open Access Article is licensed under a
 Creative Commons Attribution 3.0 Unported Licence
In situ determination of antimony isotope ratios in Sb minerals by femtosecond LA-MC-ICP-MS†
A. B.
Kaufmann
 *ab,
M.
Lazarov
a,
S.
Kiefer
b,
J.
Majzlan
b and
S.
Weyer
a
*ab,
M.
Lazarov
a,
S.
Kiefer
b,
J.
Majzlan
b and
S.
Weyer
a
aInstitute of Mineralogy, Leibniz University Hannover, Germany. E-mail: a.kaufmann@mineralogie.uni-hannover.de
bInstitute of Geosciences, Friedrich Schiller University Jena, Germany
First published on 21st May 2021
Abstract
Here we present a method for in situ determination of stable antimony (Sb) isotope compositions by ultraviolet (UV)-femtosecond-laser-ablation-multi-collector-ICP-MS (fs-LA-MC-ICP-MS). Metallic antimony and a number of Sb minerals (stibnite, senarmontite, chalcostibite, tetrahedrite, boulangerite, bournonite, zinkenite, pyrargyrite and dyscrasite) have been investigated. In order to verify the results of the in situ method, LA-MC-ICP-MS measurements were compared with solution MC-ICP-MS analyses on two chemically homogeneous stibnite samples and Sb metal. The internal precision of in situ measurements was better than 0.045‰. The long-term reproducibility for these three materials was better than 0.1‰. These results imply that any of these three materials may be used as an in situ Sb isotope standard. All δ123Sb values were determined by applying a standard-sample bracketing protocol and mass bias correction using Sn (NIST SRM 3161a standard solution) isotope ratios. Since no certified Sb isotope standard is currently available, in situ isotope analyses were performed in bracketing to a stibnite in-house standard and subsequently recalculated relative to NIST SRM 3102a. Matrix effects from Cu, Pb, Ag, Fe and Zn on the natural mineral Sb isotope ratios were insignificant. The mass interference of 123Te on 123Sb can only precisely be corrected for materials with Te/Sb ≤ 0.2. The LA and solution analyses of δ123Sb homogeneous zinkenite, dyscrasite and pyrargyrite agree excellently with each other. Senarmontite shows more variable δ123Sb at small scales, determined with LA-MC-ICP-MS, but homogeneous δ123Sb determined by solution analyses with a small offset between solution and LA analyses. Other minerals, like boulangerite, show heterogeneous δ123Sb (≈0.5‰) for both solution and LA analyses. Overall, these results demonstrate that fs-LA-MC-ICP-MS is suitable to measure Sb isotopic ratios in Sb-rich sulfides, sulfosalts and oxides (excluding Sb tellurides) with a precision better than 0.1‰ and a spatial resolution of ≈30 μm. Thus, it may be used as a tool to analyse spatially resolved Sb isotope composition at the mineral or even sub-mineral scale, e.g. to address the processes of ore formation or Sb redistribution in near-surface environments.
1. Introduction
Antimony (Sb) is a redox-sensitive and chalcophile element that dominantly occurs in nature as Sb(III) and Sb(V).1 The element is commercially important for the production of glass, ceramics, metals, and rubber products and for the synthesis of flame retardant materials. Because of its assumed high toxicity,2,3 antimony and its compounds have been declared by the European Union (Council of European Communities, 1976) and the Environmental Protection Agency of the United States (US EPA, 1979) as pollutants of priority interest. Aside from the overwhelming mining of Sb in China, small reserves were found in the USA, Slovakia, France and Portugal.4–9 Essentially the only commercially important Sb mineral is stibnite; jamesonite and tetrahedrite are used only occasionally.10 When exposed to the ambient atmosphere and water, primary ores are affected by weathering, resulting in the release of oxidised Sb to the fresh water system,11 where it is adsorbed by ferrihydrite12 and transformed into secondary minerals.13–15 Mining areas are strongly polluted and Sb contamination also affects surrounding soils and rivers. In China, elevated Sb concentrations in soils and rivers reached up to 11![[thin space (1/6-em)]](https://www.rsc.org/images/entities/char_2009.gif) 798 μg kg−116 and ≈13350 μg L−1,17 respectively. In comparison, Sb concentration in non-polluted groundwater and soils are less than 1 μg L−11 and 1 μg g−1,18 respectively.
798 μg kg−116 and ≈13350 μg L−1,17 respectively. In comparison, Sb concentration in non-polluted groundwater and soils are less than 1 μg L−11 and 1 μg g−1,18 respectively.
Antimony has two stable isotopes with masses of 121Sb and 123Sb19 and displays variations of around 2‰ in nature (Wen et al. (2018)20 and references therein). In a small number of Sb isotope analyses of soils, deep-sea sediments, seawater and silicate rocks, Sb isotope ratios show a limited range of around 0.6‰.21 However, Resongles et al. (2015)22 observed a larger range of ≈1‰ in river water in France that was affected by mining. An experimental study21 has shown that an isotope fractionation of around 1‰ occurs during Sb(V) reduction to Sb(III). Other isotope fractionation mechanisms that could cause a significant isotopic shift in the environment are of biological nature,23 adsorption,24–26 mixing,22 precipitation25 and anthropogenic27 processing during smelting. Apart from the investigation of the fractionation mechanism, several studies used Sb isotope compositions for provenance analyses of ancient glass and artefacts to constrain the ancient trading system.28–33
A comparison of δ123Sb values between different studies is a general problem, because no international isotope standard with a certified δ123Sb value is currently available. For this reason, most laboratories use different in-house Sb standard solutions (e.g., different batches of SPEX and SCP Science solutions) for instrumental mass bias correction with the standard–sample bracketing method and report their analyses in the delta notation as δ123Sb values. All of the studies mentioned above carried out solution Sb isotope analyses using gas chromatography (GC), continuous-flow hydride generation (HG) systems or solution nebulisation, coupled to a multi-collector inductively coupled plasma mass spectrometer (MC-ICP-MS), for the investigation of bulk samples and minerals, after Sb purification by ion exchange chromatography. Different combinations of the cation-exchange resin AG 50-X8 with either anion-exchange resin Amberlite IRA 74328 or thiol-functionalized cotton fibres21 have been applied for pre-concentration of Sb in the literature. A review about different analytical methods, standards used and published Sb isotope compositions was provided by Wen et al. (2018).20 Recently, a few authors reported major disadvantages for these resins because of incomplete Sb recovery for Sb-rich samples.27,33,34 Hence, a few studies developed new single-step (thiol-functionalized silica)34,35 and two-step separation (AG 1-X4 and AG 50W-X8)36 protocols to produce a high recovery and sufficiently clean Sb fraction for isotope analyses.
In order to spatially resolve small-scale isotopic variations, e.g. at the mineral or submineral scale, with high analytical precision, an in situ method, such as LA-MC-ICP-MS, is required. However, as shown by several studies, conventional nanosecond LA isotope analyses37–39 generate matrix-dependent thermal effects accompanied with the melting of the sample material around the ablation crater that induces isotope fractionation. Composition-dependent matrix effects were reported, e.g. for LA-MC-ICP-MS analyses of Mg-, Si- or Cu isotopes, for example by Ikehata et al. (2008),40 Jackson and Günther (2003),41 Janney et al. (2011)42 and Norman et al. (2006).43 As shown by a variety of studies,44–52 femtosecond (fs) ultraviolet (UV) LA coupled to MC-ICP-MS allows us to perform matrix-independent isotope analyses with high precision for a variety of non-traditional stable isotopes (Li, B, Mg, Si, V, Fe, Ni, Cu, and Sn).
In this study, we developed a protocol to analyse Sb isotope analyses with UV fs-LA-MC-ICP-MS with high analytical precision and with high spatial resolution. As standard materials, two different interference- and matrix-free stibnite and one pure Sb metal were investigated. These minerals and metal were analysed for their Sb isotope compositions both by solution nebulisation, based on established protocols modified from Lobo et al. (2012)28 and with the here developed fs-LA-MC-ICP-MS protocol. With this approach, it is possible to assess the precision and accuracy of our fs-LA-MC-ICP-MS method. Furthermore, the possible reference materials were characterised regarding their isotopic homogeneity. The influence of possible isobaric interference, such as that from 123Te on 123Sb and oxide 107Ag16O compounds on 123Sb, were investigated by solution nebulisation MC-ICP-MS. Furthermore, in order to check the feasibility of fs-LA-MC-ICP-MS Sb analyses, a set of natural Sb minerals with different chemical compositions from varying localities were investigated. Sections of these materials were prepared and analysed with an electron microprobe (EMP) for their chemical and with fs LA-MC-ICP-MS for their Sb isotopic composition. Each natural mineral specimen was analysed both in situ with fs-LA-MC-ICP-MS and for comparison with solution nebulisation isotope analyses with and without previous purification. In this study, we report data relative to the NIST 3102a Sb standard and for LA-MC-ICP-MS analyses also relative to our stibnite in-house standard.
2. Materials and analytical methods
2.1. Standards and natural samples
The investigated materials in this study comprise the solution standards of NIST SRM 3102a (lot number: 140911) and VWR Sb solution (batch 456632H, lot number: 210075110) and the solids: natural stibnite (MAC) intended as a standard material for electron microprobe analyses (EMPA), two in-house produced stibnite samples (SC and Q), pure metal (MET) and several ore minerals with high Sb concentrations between 21.3 and 83.3 wt% and different matrices. The major element contents, measured with EMP at the University of Jena, are summarised in Table 1.| Mineral, fragment | As | Pb | Sb/Sb2O3a | Ag | Ni | S | Cu | Zn | Fe | Sum |
|---|---|---|---|---|---|---|---|---|---|---|
| a Sb content of senarmontite is given as Sb2O3, and for all other minerals as Sb. | ||||||||||
| SC (n = 65) | 71.39(40) | 0.08(2) | 28.55(39) | 0.05(2) | 0.07(3) | 0.05(6) | 100.01 | |||
| MAC (n = 52) | 71.31(36) | 0.10(2) | 28.55(104) | 0.06(1) | 0.11(11) | 0.07(8) | 99.93 | |||
| MET (n = 7) | 0.18(10) | 99.80(21) | 99.98 | |||||||
| Senarmontite: | ||||||||||
| Grain 1 (n = 41) | 0.64(35) | 0.15(6) | 99.22(41) | 0.11(7) | 0.05(3) | 0.05(1) | 0.07(3) | 0.04(1) | 100.09 | |
| Grain 2 (n = 13) | 0.23(22) | 0.11(2) | 99.76(35) | 0.10(6) | 0.03(2) | 0.06(4) | 0.08(2) | 0.04(2) | 100.27 | |
| Grain 3 (n = 24) | 4.42(34) | 0.13(5) | 95.49(36) | 0.09(2) | 0.05(1) | 0.04(2) | 0.06(1) | 0.04(2) | 99.91 | |
|
||||||||||
| Chalcostibite: | ||||||||||
| Grain 1 (n = 14) | 1.33(18) | 47.76(26) | 0.12(6) | 25.15(16) | 25.69(23) | 100.12 | ||||
| Grain 2 (n = 39) | 1.32(12) | 47.60(33) | 0.09(3) | 25.53(56) | 25.51(29) | 0.08(1) | 99.95 | |||
|
||||||||||
| Boulangerite: | ||||||||||
| Grain 1 (n = 54) | 56.05(150) | 24.95(104) | 0.12(4) | 0.05(2) | 18.88(38) | 0.06(2) | 0.258(45) | 99.88 | ||
| Grain 2 (n = 37) | 56.28(45) | 24.87(36) | 0.10(3) | 0.07(3) | 18.79(17) | 0.07(2) | 99.94 | |||
|
||||||||||
| Bournonite: | ||||||||||
| Grain 1 (n = 36) | 0.30(32) | 43.03(42) | 23.44(61) | 0.10(2) | 19.70(20) | 13.51(15) | 0.07(6) | 99.98 | ||
| Grain 2 (n = 45) | 0.32(33) | 42.93(48) | 23.58(61) | 0.10(1) | 19.68(27) | 13.51(19) | 0.06(2) | 100.02 | ||
|
||||||||||
| Tetrahedrite: | ||||||||||
| Grain 1 (n = 49) | 3.10(122) | 25.03(181) | 0.58(19) | 25.55(24) | 39.10(43) | 1.24(11) | 5.39(22) | 99.99 | ||
|
||||||||||
| Zinkenite: | ||||||||||
| Grain 1 (n = 25) | 0.65(14) | 32.23(81) | 43.99(53) | 0.25(13) | 22.48(29) | 0.37(10) | 0.09(7) | 100.11 | ||
|
||||||||||
| Dyscrasite: | ||||||||||
| Py572 (n = 11) | 0.42(11) | 0.14(5) | 21.61(62) | 77.86(66) | 0.04(1) | 0.07(2) | 100.16 | |||
|
||||||||||
| Pyrargyrite: | ||||||||||
| Py573 (n = 11) | 0.44(16) | 21.86(177) | 60.04(249) | 17.59(105) | 0.05(1) | 0.07(1) | 100.07 | |||
| Py574 (n = 11) | 0.38(19) | 21.29(187) | 61.49(387) | 16.79(213) | 0.07(2) | 99.96 | ||||
| LOD | 0.09 | 0.09 | 0.07 | 0.08 | 0.04 | 0.03 | 0.04 | 0.05 | 0.03 | |
2.2. Sample digestion and Sb purification
Minerals were crushed to a size of <1 mm using an agate mortar. Depending on the Sb content, pure mineral grains of around 0.001 to 0.04 g were digested with 4 mL aqua regia on a hotplate at 110 °C for two days. Since the boiling point of SbCl5 is 140 °C,53 the aqua regia solutions were evaporated to dryness at 90 °C, in order to avoid Sb loss. Afterwards, the residues were re-dissolved in a mixture of 1.5 mL concentrated (40%) HF and 1 mL 14.3 mol L−1 HNO3 at 110 °C for two days and evaporated at 90 °C again. Subsequently, the dry residues were recovered with 14.4 mol L−1 HNO3 for 2 to 3 hours at 90 °C and dried at the same temperature. Finally, each sample was re-dissolved in 10 mL 7 mol L−1 HCl. One aliquot was dried at 90 °C and taken up in 3% HNO3 with a trace of HF for subsequent analyses of Sb isotope composition. The other aliquot (50 to 100 μg) was evaporated at 90 °C and re-dissolved in 5 mL 0.14 mol L−1 HF for the purification of Sb by ion exchange chromatography with Dowex AG50-X8 followed by Amberlite IRA 743.28 As the dissolution of large amounts of sample with a complex matrix in 0.14 mol L−1 HF always left more than 5% of Sb in the residue, only around 50 to 100 μg of sample (dissolved in 7 mol L−1 HCl) was used for ion exchange chromatography.From this split antimony was chromatographically separated from the sample matrix using a two-column procedure (Table 2) modified after Lobo et al. (2012).28 In the first column, the Dowex AG50-X8 (200–400 mesh) resin was used to separate Sb from matrix elements. In the second column, the Amberlite IRA 743 resin was used in order to purify Sb from Sn, Te and Al. Quantitative separation of Sn from Sb is necessary, because an Sn standard solution (NIST SRM 3161a) was added to the Sb sample, which was used as a monitor for instrumental mass bias.
| Step | Eluent | Volume [mL] |
|---|---|---|
| (1) Column: 2 mL DOWEX AG50-X8 cation exchange resin (200-400 mesh) | ||
| Resin cleaning | 6 M HCl | 10 |
| Milli-Q | 10 | |
| 5 M HNO3 | 10 | |
| Milli-Q | 10 | |
| Resin conditioning | Milli-Q | 10 |
| Sample loading + Sb elution | 0.14 M HF | 5 |
| Sb elution | 0.14 M HF | 5 |
| Purification of the resin | Milli-Q | 5 |
| 6 M HCl | 10 | |
| Milli-Q | 10 | |
| 5 M HNO3 | 10 | |
|
||
| (2) Column: 0.7 mL Amberlite IRA 743 anion exchange resin | ||
| Resin cleaning | 6 M HCl | 8 |
| Milli-Q | 8 | |
| 5 M HNO3 | 8 | |
| Milli-Q | 8 | |
| Resin conditioning | 0.5 M NH4OH | 4 |
| Washing | Milli-Q | 6 |
| Sample loading + Sb elution | pH > 11 with 13.4 M NH4OH addition to 1 M HNO3 + 0.14 M HF | 5 |
| Sb elution | Milli-Q | 2 |
| Sb elution | 1 M NH4OH | 6 |
The efficiency of Sb purification and potentially associated Sb isotope fractionation was tested with different samples (e.g. international standard CD-1, SC, tetrahedrite, and bournonite). For the first purification step, a resin bed of 2 mL of Dowex AG50-X8 exchange resin was prepared in 2 mL BioRad PolyPrep chromatography columns. The loading of the sample was carried out with 5 mL of 0.14 mol L−1 HF after resin conditioning with H2O as described by Lobo et al. (2012),28 followed by the elution of another 5 mL of 0.14 mol L−1 HF. During this step, matrix elements like Cr, Pb, Ag and Fe were retained by the resin, while most Sb was eluted. The Sb recovery was always above 94%. The remaining 6% was collected with further ∼35 mL of acid wash (Table 2) and measured. That displayed indistinguishable Sb isotope ratios compared to the previously collected >94% as already described by Lobo et al. (2012).28
After evaporation, the residue was treated with 200 μL concentrated HNO3 and 40 μL H2O2 to eliminate organic substances released from the resin during purification. The purified sample solution was dried and re-dissolved in a mixture of 1 mol L−1 HNO3 and 0.14 mol L−1 HF; 13.4 mol L−1 NH4OH was added in order to increase the pH to > 11, as described by Lobo et al. (2012).28 Subsequently, the separation of remaining Al and Sn from Sb was performed on a column with 0.7 mL Amberlite IRA 743, a weak anion exchange resin. The columns were self-made from polyethylene Pasteur pipettes and a frit of 1 mm thickness (35 μm mesh). The loading and subsequent washing of the samples with (i) 2 mL H2O, (ii) 6 mL 1 mol L−1 NH4OH and (iii) 5 mL H2O resulted in quantitative (>99%) Sb recovery, while Al and Sn were retained on the column. The purified Sb was dried down and re-dissolved in 3% HNO3 and the Sn standard solution, used for instrumental mass bias correction, was added.
During the first separation protocol, procedural blanks of less than 5 ng for Sb and Sn were determined, while the second purification procedure contributed around 1 ng Sb blank. However, such blank levels are negligible compared to the typically processed 50 to 100 μg of Sb from the samples.
2.3. Electron microprobe analyses (EMPA)
Quantitative analyses of the major element composition of the investigated minerals were performed with a JEOL JXA-8230 electron microprobe, using five wavelength-dispersive spectrometers (WDSs), at the University of Jena (Germany). Prior to the analyses, samples were embedded in epoxy resin, ground, polished and carbon-coated. An acceleration voltage of 20 kV and a beam current of 20 nA were chosen as the optimal measurement conditions with an electron beam defocused to 5 μm. All elemental analyses were performed with a counting time of 20 s on the peak and 20 s on the background. Major element analyses were performed with the following lines, standards and detection limits (in wt%): As (Kα, FeAsS, 0.09); Pb (Mα, PbS, 0.09); Sb (Lα, Sb2S3, 0.07); Ag (Lα, Ag2Te, 0.08); Ni (Kα, Ni metal, 0.04); S + Fe (Kα, FeS2, 0.03); Cu (Kα CuFeS2, 0.04); Zn (Kα, ZnS, 0.05). Interference from As Lα on Sb Lβ1 was corrected using overlap correction. In total, at least seven measurements (SC and MAC, n > 50) at different positions were performed within a single grain in order to check the chemical homogeneity of the mineral.2.4. Laser-ablation (LA-)MC-ICP-MS analyses
In situ analyses of Sb isotopes were performed using a Neptune Plus (Thermo Scientific) MC-ICP-MS which was coupled to a Spectra-Physics Solstice (UV) fs LA system at the Leibniz University Hannover (Germany). The Solstice fs LA system consists of a Ti:sapphire seed laser (Spectra Physics MaiTai) and a high energy Nd:YLF pump laser (Spectra Physics Empower-15) pumping at a repetition rate of 500 Hz.47 With a regenerative amplifier system working at a fundamental wavelength of 775 nm, laser energies of up to 3.5 mJ per pulse were generated. Quadrupling the frequency of the infrared beam by three barium beta borate crystals will convert the laser output beam into a final wavelength of ≈194 nm. The pulse width of the amplifier output is about 100 fs. A modified New Wave (ESI) stage/visualisation system is used and is identical to that described by Horn et al. (2006)44 and Horn and von Blanckenburg (2007).39,44 Previous studies22 have shown that fs LA enables matrix-independent in situ isotopic analyses for non-traditional stable isotopes of various sample types as a result of low thermal effects at the surface of the sample.44–52 Defocused laser beam and spot sizes of 40 to 60 μm were used. Depending on the antimony concentration of the samples, a laser frequency between 3 and 12 Hz was employed to provide comparable Sb intensities between the sample and standard. Typically, a line pattern with lengths of 100 to 250 μm and an ablation speed of ≈15 μm s−1 were used, consisting of 180 integrations (cycles) of ≈1 s. The first thirty cycles were used to determine the baseline for the background which was subtracted from the laser signal. To enhance the aerosol transport from the ablation cell, He was used as the ablation cell carrier gas.54 Prior to entrance into the torch, the sample flow was admixed at a T-junction with an Ar flow from the aspiration of the Sn standard solution NIST 3161a with a double-pass quartz glass spray chamber (Scott design, Thermo-Scientific). Isotope analyses were performed in static mode at low mass resolution. The detector array is set for simultaneous detection of the isotopes 117Sn, 118Sn, 119Sn, 120Sn, 121Sb, 122Sn, 123Sb and 125Te (the latter as a monitor for the isobaric interference of 120Te and 123Te on 120Sn and 123Sb, respectively) using a 1011 Ω resistor for all isotopes. Nickel (H-type) sample and skimmer cones were used in order to produce stable signals for Sb and Sn.50 The details of the instrumental parameters are summarised in Table 3.| Operating parameter | LA MC-ICP-MS analysis |
|---|---|
| Mass spectrometer: | |
| Rf power | 1300 W |
| Auxiliary Ar | ≈0.7 to 0.9 L min−1 |
| Cooling Ar | ≈15.0 L min−1 |
| Extraction voltage | ≈2000 V |
| Analysis mode | Static |
| Collector configuration | L4(117Sn), L3(118Sn), L2(119Sn), L1(120Sn), C(121Sb), H1(122Sn), H2(123Sb), H3(125Te) |
| Spray chamber | Glass type (double pass Scott design) |
| Nebuliser | PFA micro-flow |
| Sample uptake | ≈100 μL min−1 |
| Cones | Ni |
| Resolution | Low resolution |
|
|
| Laser parameter: | |
| Wavelength | 194 nm |
| Pulse width | 100 fs |
| Ablation mode | 100 to 250 μm line |
| Spot diameter | 40 to 60 μm |
| Pulse energy | ≈0.01 mJ |
| Repetition rate | 3 Hz to 12 Hz (dyscrasite: 30 Hz) |
| Carrier gas flow He | He: ≈0.25 to 0.35 L min−1 |
| Ar: ≈1.04 L min−1 | |
| Pre-ablation | None |
| Tube length | ≈4 m |
Instrumental mass bias on the 123Sb/121Sb isotope ratio was corrected by standard sample bracketing with an in-house standard and externally, using the 119Sn/117Sn and 120Sn/118Sn isotope ratio of a 0.5 μg mL−1 Sn NIST 3161a standard solution (giving a >2 V signal at mass 117Sn) that was aspirated simultaneously, by applying the exponential law.55 Data processing was performed with a modified Microsoft Excel-based LamTool macro developed originally for Sr isotopes by Jan Košler.56 With this tool, the baseline and contributions from mass interference were subtracted, outliers were eliminated and instrumental mass bias was corrected for all measured isotope ratios. For mass bias correction, both 119Sn/117Sn and 120Sn/118Sn were applied with the natural ratios of NIST SRM 3161a of 1.118421 and 1.345539,19 respectively. Mass bias correction factors β119Sn and β120Sn were determined simultaneously during each measurement cycle, using the following equations:
| β119Sn = [ln((119Sn/117Sn)true/(119Sn/117Sn)measured)]/[ln(M119Sn/M117Sn)] | (1) |
| β120Sn = [ln((120Sn/118Sn)true/(120Sn/118Sn)measured)]/[ln(M120Sn/M118Sn)] | (2) |
The isobaric interference 123Te on 123Sb and 120Te on 120Sn was corrected by the simultaneous measurement of 125Te. For interference correction, modified 125Te/123Te and 125Te/120Te ratios, by applying the instrumental mass bias as determined with 119Sn/117Sn on the natural 125Te/123Te and 125Te/120Te values of 7.862330 and 74.36458,19 were used, respectively.
All results are reported as δ123Sb by using the following delta notation:
| δ123Sb = [((123Sb/121Sb)sample/(123Sb/121Sb)standard) − 1] × 1000 | (3) |
In order to enable the comparison of the here presented in situ δ123Sb data, determined relative to our stibnite SC in-house standard (addressed as “standard” in eqn (3)) all data presented were recalculated to the commercially available NIST SRM 3102a Sb standard values with the following equation:
| δ123Sbsample/NIST = δ123Sbsample/house std + δ123Sbhouse std/NIST | (4) |
2.5. Solution-nebulisation MC-ICP-MS
The accuracy of the in situ LA-MC-ICP-MS measurements was verified by comparison with conventional solution measurements on the same materials. Isotopic analyses were performed on 2 to 5 separately prepared fragments of each material, including metallic Sb (n = 4), the synthetic stibnite in-house standards (slowly cooled – SC; n = 4 and quenched – Q; n = 4) and the MAC stibnite grain (n = 4). All unpurified bulk Sb aliquots and those after chromatographic purification were diluted in 3% HNO3 with traces of HF and doped with Sn (NIST SRM 3161a).All measurements were performed on the same instrument and with the same instrumental set up as described for the laser-ablation analyses. The only difference was that samples were introduced with a quartz glass spray chamber and the measurements were performed with 50 cycles of 4.194 s integration time per cycle. The setup routinely yields a signal of ≈12.5 V and >2 V on the masses of 121Sb and 117Sn for a 0.8 μg mL−1 Sb and 0.5 μg mL−1 Sn solution, respectively. The determination of the instrument blank was performed at the start and end of each session by the analysis of the same acid used for dissolving the samples and standards. Sample solutions were usually analysed 3 times relative to NIST SRM 3102a. The internal precision of an individual analysis was generally better than 0.04‰ (2σ, representing here the error-propagated internal uncertainties (2 SE) of the sample and standard measurements). A total of 279 measurements of NIST SRM 3102a within a period of 11 months yielded an average 123Sb/121Sb ratio of 0.746982 ± 0.000151. The reproducibility of δ123Sb of our in-house standard solutions, including VWR, MET, MAC und SC + Q, relative to NIST SRM 3102a (or likewise the other way around) was better than 0.06‰ (2SD).
3. Results and discussion
During laser-ablation isotope analyses with LA-MC-ICP-MS, various matrix elements will be introduced into the plasma source together with the targeted isotopes. This combination can generate different types of interference (elemental and molecular) and is examined in detail in the following sections. In addition, our measurement protocol for isotope analyses of Sb consists of the application of Sn for external mass bias correction, the applicability of which was tested below. Selected materials (stibnite MAC, SC, and Q) and metallic Sb were investigated for their isotopic homogeneity and suitability as Sb laser-ablation isotope standards (Tables S1 and S2†). Further Sb minerals with various matrices were measured relative to the newly defined standard SC stibnite. For all minerals, the isotopic compositions of dissolved splits, with and without chromatographic purification, were compared with the isotopic compositions obtained by LA-MC-ICP-MS (Table S3†). δ123Sb values are given consistently in this work as the average of multiple analyses with the associated uncertainty as two standard deviations (2SD).3.1. LA-MC-ICP-MS method
(i) Isobaric interference. The isotope 123Te can produce direct isobaric interference on 123Sb. The isotope 123Te has a low abundance (<1%
19) and Te is usually a trace element in Sb ores. Despite that, the effect of 123Te interference on 123Sb was investigated in order to determine which Te concentration levels will generate detectable systematic errors for Sb isotope measurements. For this purpose, pure Sb standard solutions were doped with various amounts of pure Te standard solutions (resulting in Te/Sb weight ratios of 0.0003, 0.02, 0.1, 0.2, 1 and 2). Similar to the observation of Li et al. (2020),47 all δ123Sb values with Te/Sb ratios smaller than 0.2 agree with the results for the pure Sb solution (Fig. 1a). For all Te/Sb ratios >0.2, the interference correction (using 125Te as an interference monitor) was insufficient, resulting in inaccurate and artificially high δ123Sb (Fig. 1a). However, with the exception of Sb tellurides, Sb minerals have commonly Te/Sb ratios much lower than 0.2, which makes them suitable for in situ Sb isotope analyses.
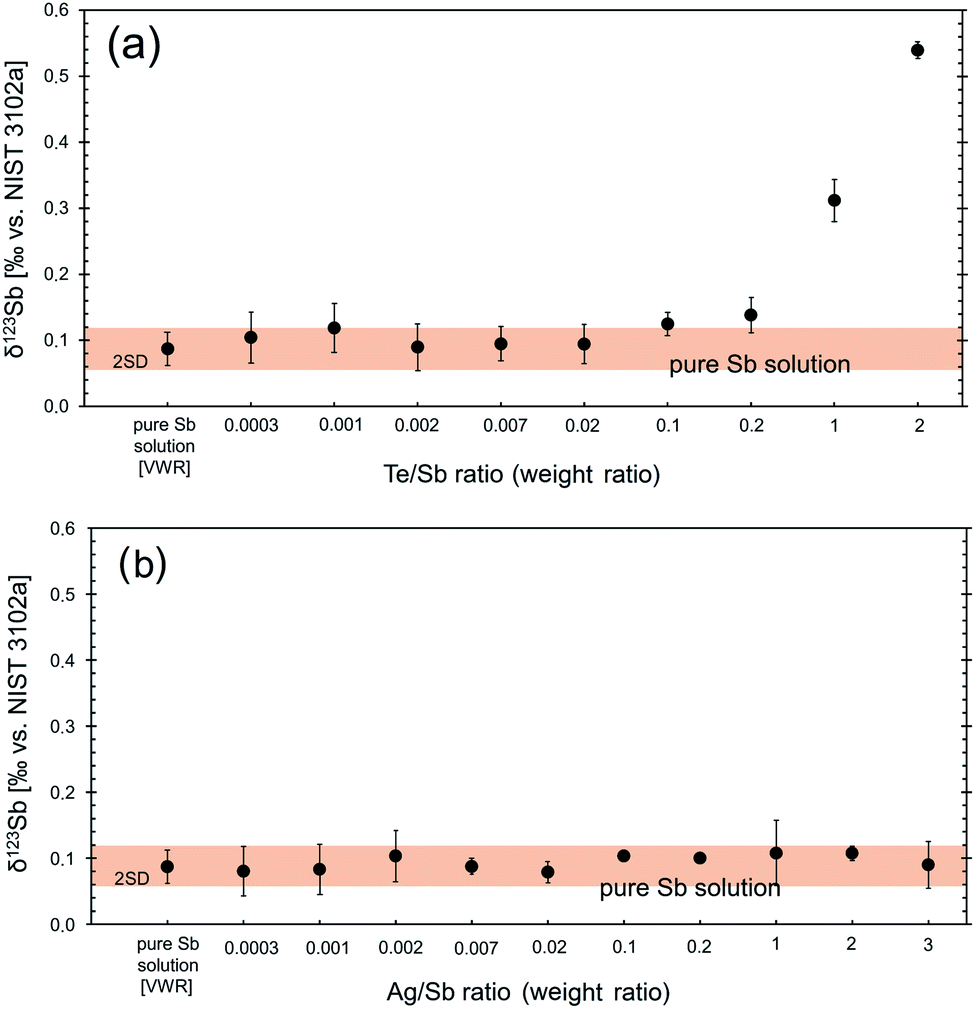 | ||
| Fig. 1 Influence of Te (a) and Ag (b) on the measured Sb isotope composition. Doping experiments of (a) and (b) were performed with standard solutions containing 1 μg mL−1 Sb (purchased from VWR), 0.6 μg mL−1 Sn (NIST 3161a) and different concentrations of Te and Ag. The orange bar represents the analytical uncertainty of the method. Error bars represent the 2SD of replicate analyses of the standard (VWR) and doped solutions. | ||
Tellurium also has isobaric interference on 120Sn, which is used as a mass bias monitor, though the abundance of 120Te is small (≈0.09%). Schulze et al. (2017)50 showed that Te interference on Sn can be neglected at Te/Sn ratios of <0.03.
(ii) Molecular interference. Polyatomic 107Ag14N, 107Ag16O and 109Ag14N clusters that may be generated in the plasma represent potential mass interference on 121Sb and 123Sb. To examine the effect of such interference, a set of experiments were performed with an Sb standard solution doped with variable amounts of an Ag standard solution (i.e., with Ag/Sb (weight ratio) of 0.0003, 0.02, 0.1, 0.2, 1, 2 and 3; Fig. 1b). However, due to the low oxide formation rate in the plasma under our measurement conditions, the influence of the 107Ag16O cluster on 123Sb was negligible. Even at the highest investigated Ag/Sb ratio of 3, δ123Sb values remained unbiased within analytical uncertainties. This observation indicates that precise Sb isotope analyses can be performed with LA-MC-ICP-MS, even for samples with high contents of Ag. An application will be presented further below by the measurements of two Ag–Sb minerals pyrargyrite (Ag3SbS3) and dyscrasite (Ag3Sb).
The effect of hydride formation, which may result in the mass interference of 120Sn1H on 121Sb, was estimated from the signal intensities observed at the mass of 121Sb during the introduction of a pure 1 ppm Sn (NIST SRM 3161a) solution and no Sb into the plasma. This experiment resulted in signal intensities which were indistinguishable from the background signal. Likely, the formation of hydrides is suppressed by the choice of our instrumental setup, where the introduction of Sn solution (as a mass bias monitor) results in wet plasma conditions with negligible hydride formation.
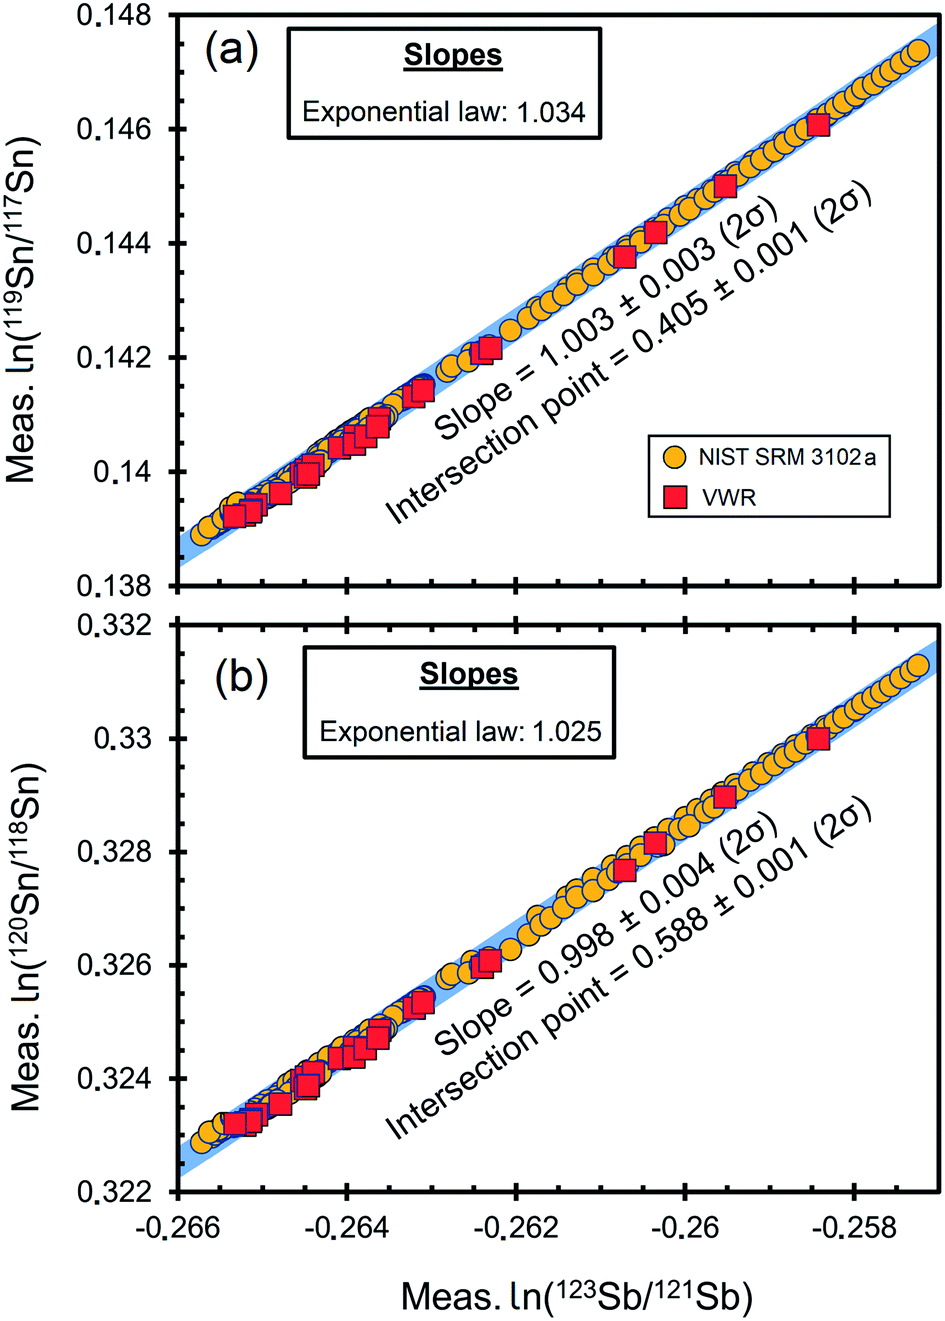 | ||
| Fig. 2 Logarithmic plots of the raw ratios of 119Sn/117Sn (a) and 120Sn/118Sn (b) versus123Sb/121Sb of NIST SRM 3102a and VWR Sb standard solution in 8 different measurement sessions with experimentally determined regression (blue line). The classical x–y regression after Ludwig (2003)63 is compared with the prediction of the theoretical exponential mass fractionation law using eqn (3) after Anbar et al. (2001)64 based on Russell et al. (1978).55 Error bars (2SD) smaller than the symbol size are not shown. | ||
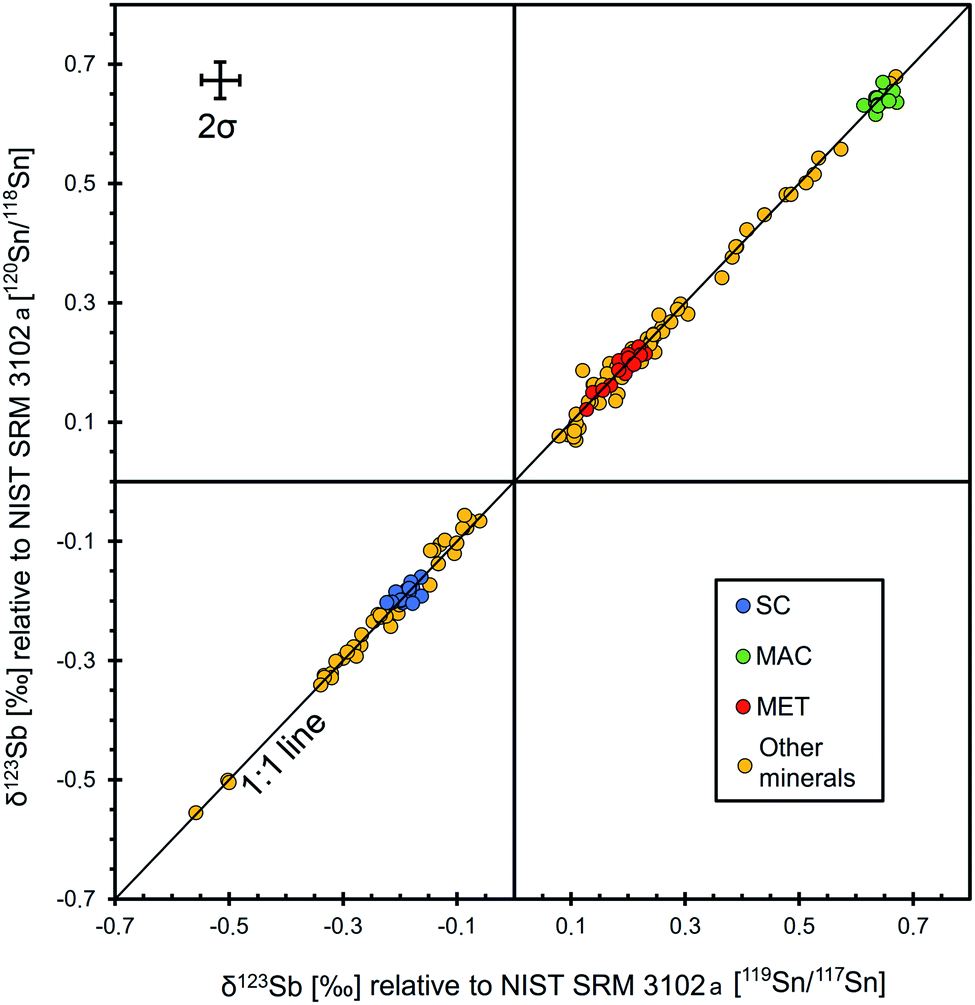 | ||
| Fig. 3 Relationship of δ123Sb values relative to NIST SRM 3102a corrected with 119Sn/117Sn and 120Sn/118Sn. Data for SC, MAC and MET represent solution measurements with MC-ICP-MS, while those of other minerals (minerals selected for this work, see the text) were obtained by LA-MC-ICP-MS analyses using the instrumental setup outlined in Table 3. Representative 2σ error bars are given in the upper left corner, representing error-propagated internal uncertainties (2SE) of the sample and standard measurements44 = 2 × 1000 × ((SEsample/123/121Sbsample)2 + (SEstd1/123/121Sbstd1)2 + (SEstd2/123/121Sbstd2)2)0.5. | ||
3.2. Determination of the Sb isotopic composition of potential solid reference materials (metallic antimony and stibnite)
Three solid samples, stibnite SC and MAC and Sb metal (MET), were investigated for their isotopic homogeneity to potentially serve as reference materials. Since these materials contain elements other than Sb or S only in trace amounts, this approach is ideal with respect to matrix match between the three materials. Microprobe analyses show only traces of Fe, Cu, Ag, and Zn for the MAC stibnite, just above the detection limit, while the SC stibnite contains a low amount of Zn, Ag, and Fe (Table 1).Solution nebulisation MC-ICP-MS measurements for the four separately dissolved, unpurified and chromatographically purified Sb aliquots of each material, MAC, MET, SC and Q, display indistinguishable isotope composition relative to NIST 3102a (SC: −0.189 ± 0.031‰, n = 20; Q: −0.191 ± 0.038‰, n = 18; MET: 0.192 ± 0.058‰, n = 18; MAC: 0.645 ± 0.029‰, n = 12; Fig. 4, Table S1†). Furthermore, the two synthetic stibnite samples, SC and Q, which were synthesised from the same material under different conditions, also display indistinguishable δ123Sb.
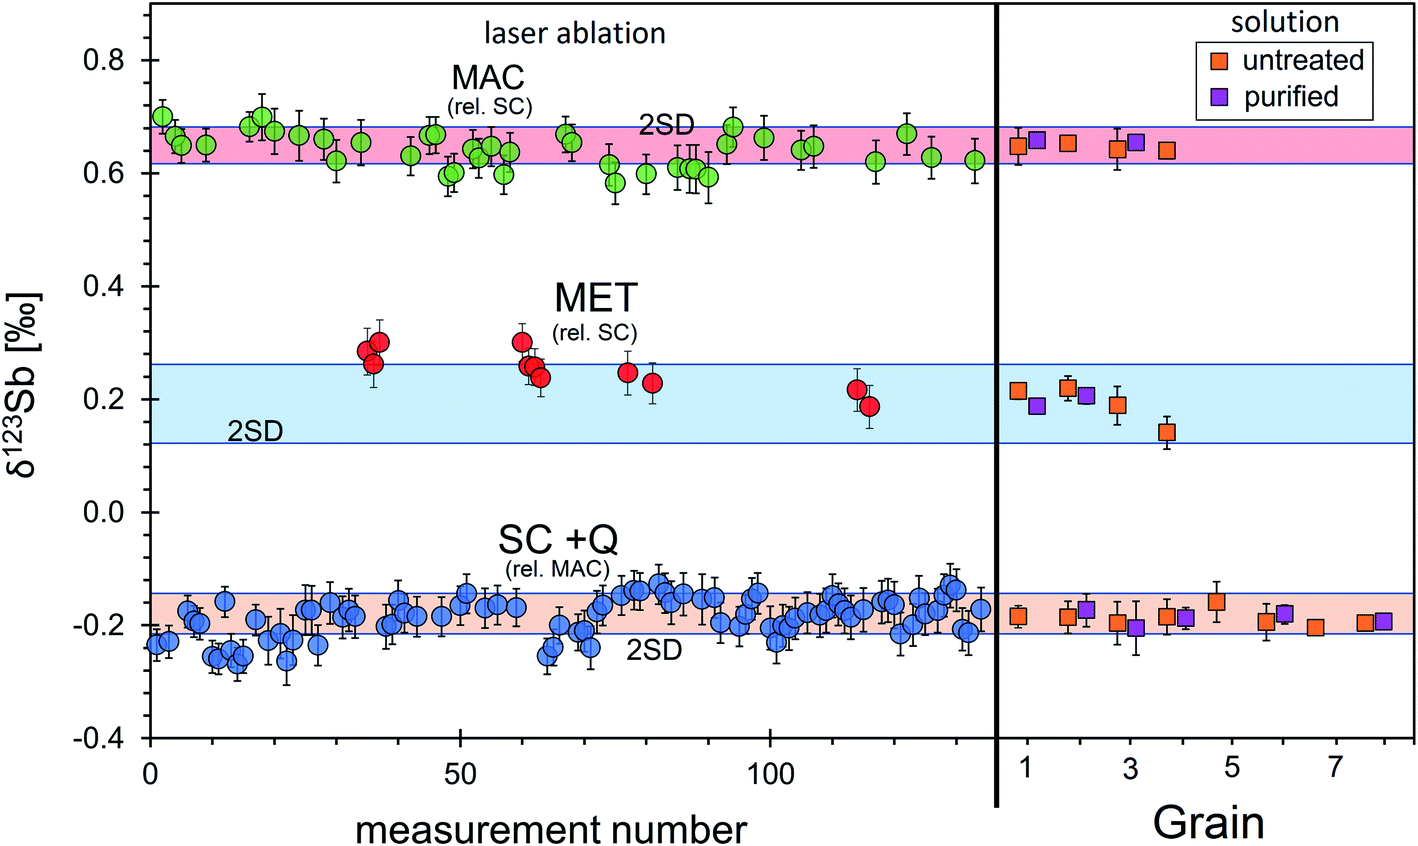 | ||
| Fig. 4 Reproducibility of laser-ablation analyses of stibnite SC (blue), stibnite MAC (green) and MET (red) relative to NIST 3102a during eight measurement days. MAC and MET were measured in bracketing with SC, while SC was bracketed with MAC. The bright orange, blue, and red fields represent the 2SD of SC, MET and MAC, respectively, obtained with solution MC-ICP-MS. In addition, purified (purple circles) and untreated (orange circles) measurements with solution MC-ICP-MS were illustrated. The quenched stibnite is porous and no in situ LA analyses were possible; however, the sample was dissolved and analysed by solution measurements. δ123Sb values obtained by LA MC-ICP-MS are given as 2σ, while error bars from solution MC-ICP-MS analyses represent the 2SD of replicate analyses of the samples. | ||
The isotopic homogeneity of each material was investigated during several measurement sessions with LA-MC-ICP-MS. The analytical protocol (spot size, repetition rate and ablation speed) was similar for each of these three materials. The variability of energy densities and laser energies between all pure Sb samples on Sb isotope compositions, as observed for other isotope systems like Cu and Si (e.g., Chmeleff et al. (2008);58 Lazarov and Horn (2015)47), has been found to be negligible. Ion signals on the Sb masses during laser ablation analyses were stable for the whole analytical time of 120 s. Stibnite MAC and metal MET were measured in bracketing with stibnite SC, while stibnite SC was measured in bracketing with MAC. Finally, all data were off-line recalculated and reported relative to NIST SRM 3102a (Table S2,†Fig. 4). The δ123Sb of all samples obtained by laser-ablation analyses over a period of 11 months perfectly agrees within analytical uncertainties with the respective solution measurements (Fig. 4). The precision of an individual in situ standard–sample–standard cycle, as determined for the mass bias corrected Sb isotope ratios, was commonly below 0.045‰, while the long-term (11 months) reproducibility of δ123Sb values was better than 0.1‰.
According to these solution and laser ablation Sb isotope analyses, any of these samples can be used as an in situ Sb isotope standard. For MAC stibnite, natural in origin, and metal MET, it is unclear if other stibnite grains or metals provided by the companies will have the same Sb isotope composition. Thus, we preferred to use our stibnite SC as a solid standard for LA-MC-ICP-MS (or other in situ) Sb isotope analyses. For this standard, more than 11 parts of fused material (together SC and Q) were analysed by solution and with laser ablation, all of which display identical Sb isotope ratios. Therefore, we assume isotopic homogeneity in any other part of this sample.
3.3. Sb isotope composition of different Sb oxides, sulfides, sulfosalts and antimonides
A set of Sb minerals with various matrices were chosen to test for matrix effects during LA Sb isotope measurements after previous characterization of the minerals with EPMA (Table 1). LA-MC-ICP-MS analyses were conducted with more than three line analyses at different places in the sections. For tetrahedrite, dyscrasite and zinkenite, only one grain was investigated, while for all other minerals, 2 or 3 different grains were analysed. Usually two to five grain fragments (excluding bournonite grain 1 with a single grain fragment) were prepared for solution analysis. In Fig. 5 and 6 and Table S3,† different grains are indicated by their respective numbers. We will generally discuss the 119Sn/117Sn mass bias corrected δ123Sb values relative to NIST SRM 3102a, but very similar 120Sn/118Sn corrected data as well as the original δ123Sb values relative to SC are also presented in Table S3.†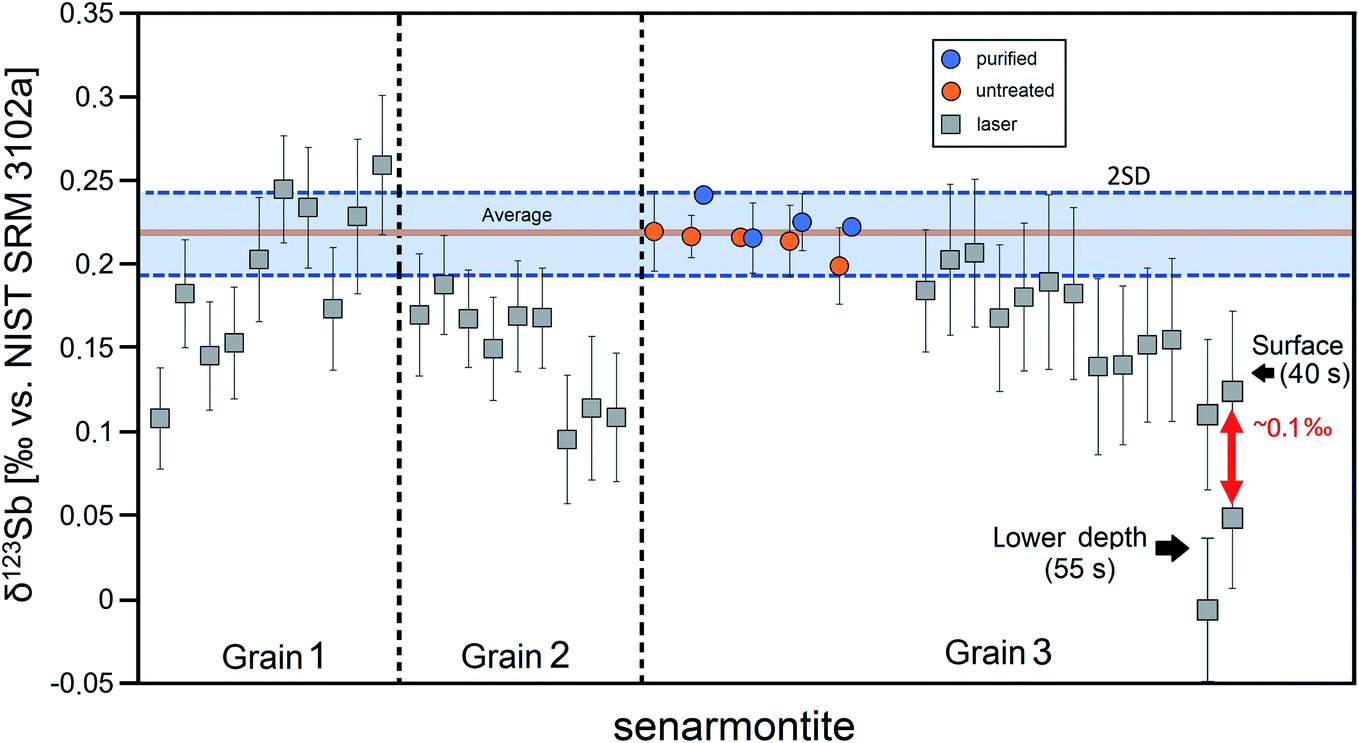 | ||
| Fig. 5 Comparison of δ123Sb solution and laser-ablation measurements for senarmontite. All LA analyses (squares) were measured relative to SC and recalculated to NIST 3102a. All purified (blue circles) and non-purified (orange circles) solution values are reported on NIST 3102a. The results for each analysed grain are separated from each other by a vertical line. The horizontal line is the average of the solution measurements of senarmontite. The colour bar represents the 2SD of all replicate solution analyses of all senarmontite pieces of grain 3. Last 2 laser measurements of grain 3 show fractionated δ123Sb isotope composition with increasing depth (see the text for details). Error bars for solution represent the 2SD of replicate analyses of the senarmontite fragments, while laser measurement error bars are given as 2σ (error-propagated internal uncertainties (2 SE) of the sample and standard measurements; see the equation in the caption of Fig. 2). | ||
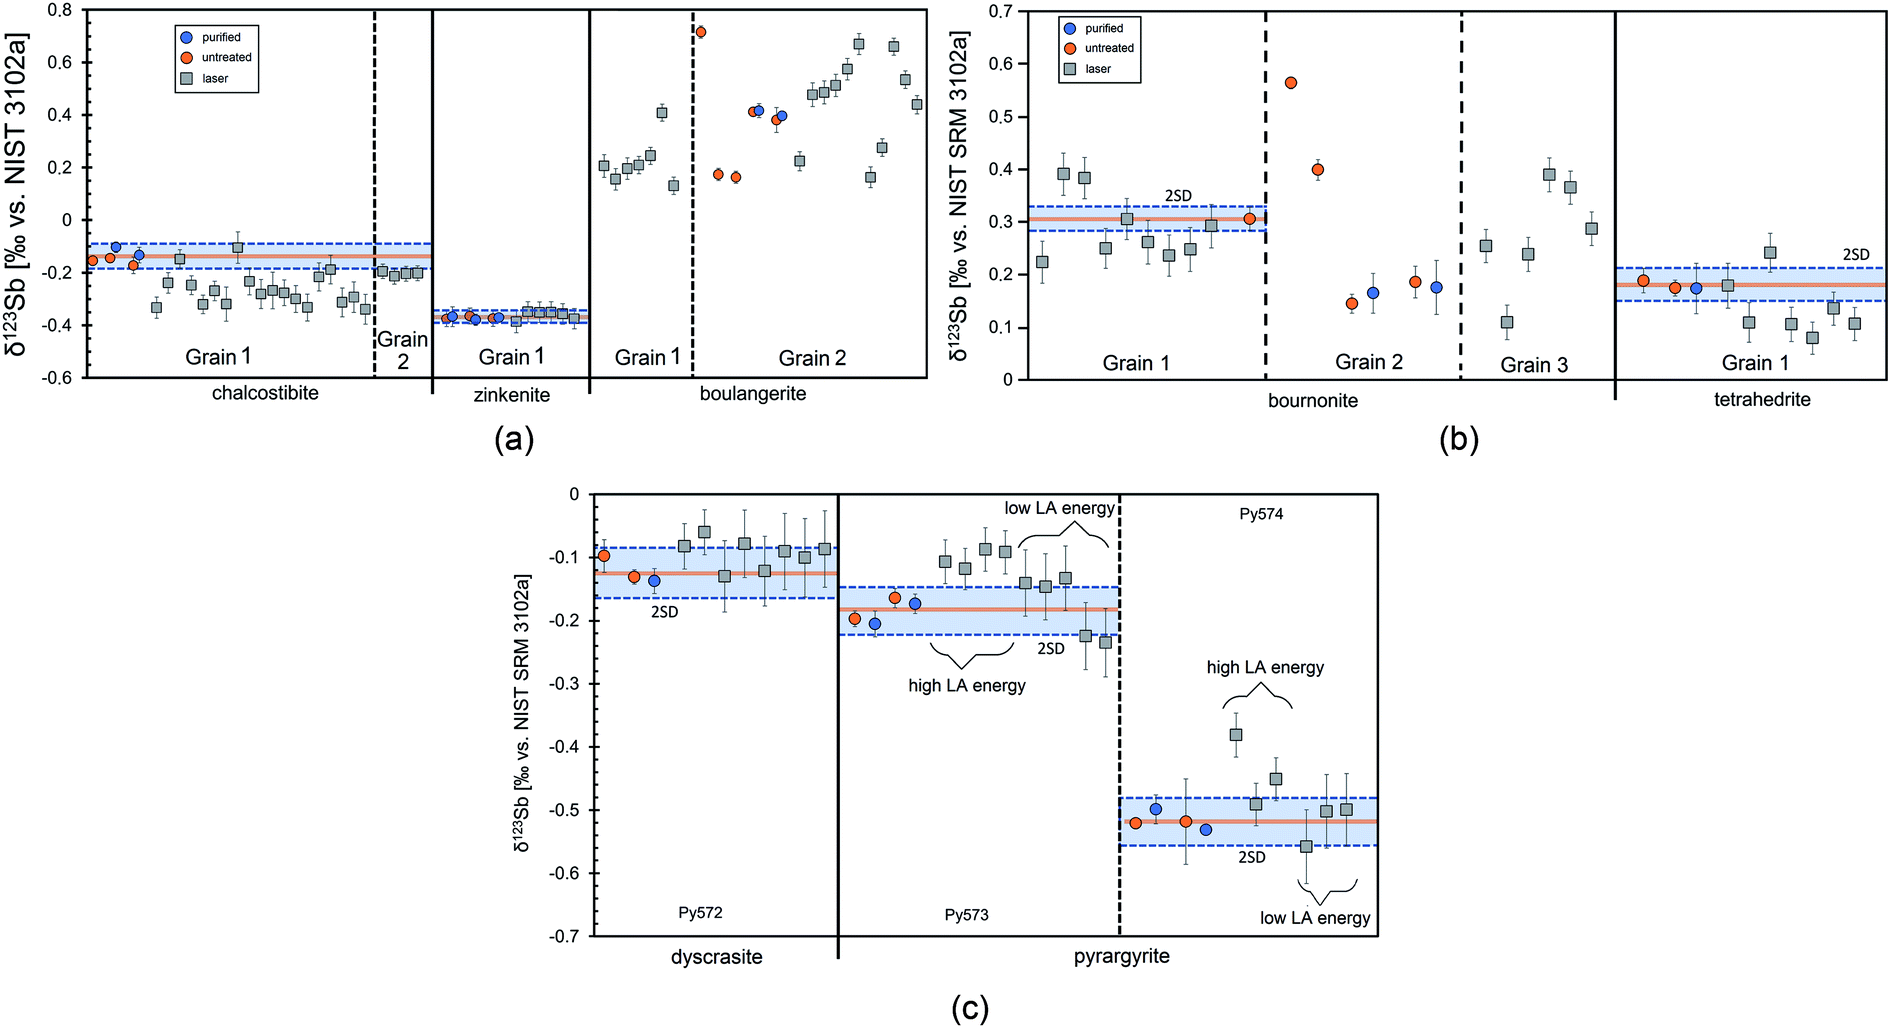 | ||
| Fig. 6 Comparison of δ123Sb values from solution and laser-ablation analysis for: (a) chalcostibite, zinkenite, and boulangerite; (b) bournonite and tetrahedrite; (c) dyscrasite and pyrargyrite. All LA measurements (squares) were measured relative to SC and recalculated to NIST 3102a. All purified (blue circles) and non-purified (orange circles) solution values are measured and reported relative to NIST 3102a. Error bars for solution represent the 2SD of replicate analyses of the sample, while laser measurement errors are given as 2σ (error-propagated internal uncertainties (2 SE) of the sample and standard measurements). | ||
Solution analyses of three fragments of chalcostibite grain 1 revealed an average δ123Sb value of −0.141 ± 0.052‰ (Fig. 6a) relative to NIST 3102a. Chromatographically purified Sb (2 out of 3 fragments) and unpurified aliquots display indistinguishable δ123Sb. Laser-ablation analyses of this grain show larger δ123Sb variation ranging from −0.339‰ to −0.105‰ (with an average of −0.264 ± 0.129‰, n = 19), indicating the isotopic heterogeneity of the grain. Grain 2 was only measured in situ and shows a constant δ123Sb of −0.204 ± 0.016‰ (n = 4). Commonly, the internal precision of the laser-ablation analyses was better than ±0.04‰, but for some chalcostibite (grain 1) measurements, it was slightly worse (up to 0.07‰), potentially related to isotopic heterogeneity or to grain porosity.
Two ≈1 cm large boulangerite grains were analysed and found to be almost chemically homogeneous (Table 1). At some spots, minor impurities of Ag, Fe, and Ni were detected. Five small pieces of the grain 2 were dissolved and for two of them Sb separation was also performed. Solution data of these grains (Fig. 6a), however, revealed heterogeneous δ123Sb values ranging from 0.163 to 0.716‰ (average: 0.327 ± 0.395‰, n = 14). The two purified aliquots perfectly match the isotopic composition of their respective unpurified aliquot. Therefore, we assume that the variable Sb isotopic compositions, observed among the unpurified samples, represent real isotopic heterogeneity between the grains and not artificial matrix effects. Laser-ablation measurements performed on the same grains gave values between 0.163‰ and 0.670‰ and essentially confirm the isotopic range observed from the solution analysed. Thus, although the major element composition of boulangerite grain 2 is uniform, the isotopic composition is strongly heterogeneous.
The boulangerite grain 1 was measured only in situ and also shows variations in δ123Sb ranging from 0.131‰ to 0.408‰ (n = 7). Since the internal precision of individual analyses of the in situ method is better than 0.1‰, we are confident that the isotopic variations, observed for this sample, also represent real heterogeneities.
Tetrahedrite may contain traces of Ag (Table 1); however, polyatomic interference from 107Ag16O on 123Sb is negligible at this Ag concentration level (see section 3.1 and Fig. 1b). Furthermore, tetrahedrite may also contain some Sn (up to 3.2 wt% Sn59), although such high concentrations are rather an exception. Considering the range of Sn isotope variations that has thus far been observed in ores, which may be up to 0.5‰ per amu. mass difference at a conservative estimate,50,60–62 a contribution of only 5% natural Sn relative to the amount of Sn added by the standard may produce an artificial offset of about 0.1‰ in the mass bias corrected Sb ratio. However, in the studied tetrahedrite, only a very small signal (<1 mV on 120Sn) was observed during LA-MC-ICP-MS of Sb isotopes which translates to <100 ppm Sn in the sample. Such a small contribution to the Sn signal from the NIST SRM 3161a standard had no significant effect on external mass bias correction with Sn, as evidenced by the comparison of the raw (not mass bias corrected) and Sn (both 119Sn/117Sn and 120Sn/118Sn) mass bias corrected δ123Sb values (Table S3†). In the case of significant Sn in the analysed samples, mass bias may be corrected by simple sample–standard bracketing. Alternatively, the Sn isotope ratio, determined from the background measurement, prior to sample ablation, may be used for instrumental mass bias correction (similar to that outlined in Lazarov and Horn (2015)47 for in situ Cu isotope analyses of Ni-bearing sulfides, using Ni as a mass bias monitor). Solution nebulisation Sb isotope analyses were conducted on two little fragments of the same grain, one of which aliquoted into an unpurified and a purified fraction. All tetrahedrite Sb solutions display indistinguishable δ123Sb values of 0.181 ± 0.032‰ (n = 8) on average relative to NIST 3102a (Fig. 6b). This value lies within the range of laser-ablation analyses (≈0.08 to 0.24‰ relative to NIST 3102a, Fig. 6b) and also agrees with the average of the laser-ablation δ123Sb values of 0.136 ± 0.112‰ (n = 7), within analytical uncertainty.
The internal precision of the laser-ablation measurements for these minerals was slightly worse (<0.06‰) than that for other materials, which may be related to the high amount of Ag in the minerals. However, the δ123Sb values of dyscrasite determined by LA-MC-ICP-MS (Py572: −0.094 ± 0.046‰, n = 8) are in good agreement with the solution measurements within analytical uncertainties (Fig. 6c). Laser ablation analyses of both pyrargyrite samples showed small effects of the laser energy on the measured Sb isotope composition, i.e., too high energies resulted in heavier isotope ratios than those obtained for the solution measurements (Fig. 6c). A similar effect was already observed for Cu sulfides by Lazarov and Horn (2015)47 and is likely related to a loss of lighter isotopes during melting around the ablation area at high laser energy. With reduced laser energy, however, the δ123Sb values determined by solution analyses could well be reproduced with laser ablation, supporting the results of the experiments in chapter 3.1, i.e. that Ag/Sb ratios of up to three are still uncritical for the precise analyses of Sb minerals with LA-MC-ICP-MS.
4. Conclusions
A new method of in situ stable Sb isotope analyses by fs LA-MC-ICP-MS was established using a Sn standard solution as a mass bias monitor. This method was applied to characterise the Sb isotopic composition of several in-house stibnite standards. As demonstrated by replicate analyses of these standards by solution and LA-MC-ICP-MS, a precision and accuracy of better than 0.1‰ can be achieved. The in-house produced standard stibnite SC was found to be isotopically homogeneous with a δ123Sb = −0.189‰ relative to NIST SRM 3102 and is thus suitable as an isotopic reference material for in situ Sb isotope analyses. Tests with chemically doped solution revealed that mass interference from Te on Sb (and Sn) isotopes can be corrected for samples with a Te/Sb lower than 0.2 and that potential polyatomic mass interference from AgN and AgO on Sb isotopes is not critical at Ag/Sb < 3.The method of in situ Sb isotope analyses was furthermore applied to measure the Sb isotope composition of Sb minerals, including senarmontite, chalcostibite, zinkenite, boulangerite, bournonite, tetrahedrite, dyscrasite, and pyrargyrite. For comparison, small fragments of the mineral grain were also conventionally analysed with solution MC-ICP-MS. Mineral grains with homogeneous δ123Sb, analysed with LA-MC-ICP-MS, such as zinkenite, pyrargyrite and dyscrasite, show excellent agreement between solution and laser-ablation analyses. These findings show that matrix elements like Cu, Pb, and Ag do not affect the accuracy of the in situ Sb isotope measurements and thus, most natural Sb minerals can be analysed, with the exception of Sb tellurides. Silver-antimony minerals can be analysed with femtosecond laser ablation, but only with moderately high laser energy.
Some Sb minerals, however, displayed more heterogeneous Sb isotope compositions, despite the fact that they were chemically homogeneous (with regard to their major elements). Solution analyses of these minerals, conducted on small fragments of the investigated mineral grains, showed a similar variability as observed with LA-MC-ICP-MS (e.g., ≈0.5‰ for boulangerite) or in other cases more homogeneous values (e.g. for senarmontite and chalcostibite). All stable Sb isotopes analyses together revealed a range of δ123Sb of ≈1.2‰ (−0.56‰ to 0.67‰) among the studied natural Sb-rich minerals. These findings show the importance of precise in situ Sb isotope analyses, in order to detect processes at the micrometer scale that are reflected by their Sb isotopic variations.
Author contribution
AK contributed to the analyses of Sb isotopes with femtosecond-laser ablation-MC-ICP-MS, solution nebulization isotope analyses with MC-ICP-MS, Sb column chromatography, data processing, generation of experiments, discussion of data and writing the manuscript. ML contributed to the project design, analytical support with solution nebulization and fs-LA-MC-ICP-MS analyses, data processing, generation of experiments, discussion of data, and writing of the manuscript. SK contributed to the EMPA and manuscript writing. JM contributed to the project design, data discussion, synthesis and selection of materials, and manuscript writing. SW contributed to the discussion of data and writing of the manuscript.Conflicts of interest
There are no conflicts to declare.Acknowledgements
We are thankful to two anonymous reviewers for comments that helped to improve the manuscript and to I. Horn for helpful advises, in particular during the LA-MC-ICP-MS analyses. We thank J. Pršek and J. Sejkora for providing us with the natural boulangerite/bournonite and pyrargyrite samples, respectively. We are also indebted to M. Tuhý for the help with the preparation of the evacuated silica tubes. J. Feige is thanked for sample preparation. This work was supported by the Deutsche Forschungsgemeinschaft, grant LA 3392/3-1 and MA 3927/32-1.References
- M. Filella, N. Belzile and Y.-W. Chen, Antimony in the environment: a review focused on natural waters: I. Occurrence, Earth-Sci. Rev., 2002, 57, 125–176 Search PubMed.
- K. A. Winship, Toxicity of antimony and its compounds, Adverse Drug React. Acute Poisoning Rev., 1987, 6, 67–90 Search PubMed.
- S. Sundar and J. Chakravarty, Antimony toxicity, Int. J. Environ. Res. Public Health, 2010, 7, 4267–4277 Search PubMed.
- M. Baláž and P. Kúšik, Raw Materials of Slovakia, Annual Report, State Geological Institute of Dionýz Štúr, Slovak, 2015 Search PubMed.
- C. Casiot, M. Ujevic, M. Munoz, J. L. Seidel and F. Elbaz-Poulichet, Antimony and arsenic mobility in a creek draining an antimony mine abandoned 85 years ago (upper Orb basin, France), Appl. Geochem., 2007, 22, 788–798 Search PubMed.
- E. Resongles, C. Casiot, F. Elbaz-Poulichet, R. Freydier, O. Bruneel, C. Piot, S. Delpoux, A. Volant and A. Desoeuvre, Fate of Sb(V) and Sb(III) species along a gradient of pH and oxygen concentration in the Carnoules mine waters (Southern France), Environ. Sci.: Processes Impacts, 2013, 15, 1536–1544 Search PubMed.
- J. Majzlan, B. Brecht, B. Lalinská, M. Chovan, D. Moravanský and P. Uhlík, Elemental and mineral inventory of tailing impoundments near Pezinok, Slovakia and possible courses of action for their remediation, Mineralogia, 2010, 41, 55–74 Search PubMed.
- J. Majzlan, S. Kiefer, J. Herrmann, M. Števko, J. Sejkora, M. Chovan, T. Lánczos, M. Lazarov, A. Gerdes and F. Langenhorst, Synergies in elemental mobility during weathering of tetrahedrite [(Cu,Fe,Zn)12(Sb,As)4S13]: field observations, electron microscopy, isotopes of Cu, C, O, radiometric dating, and water geochemistry, Chem. Geol., 2018, 488, 1–20 Search PubMed.
- U. Schwarz-Schampera, Antimony, Critical Metals Handbook, 2014, pp. 70–98 Search PubMed.
- J. Majzlan, Primary and secondary minerals of antimony, in Antimony, ed. M. Filella, De Gruyter, 2021, pp. 17–47 Search PubMed.
- P. M. Ashley, D. Craw, B. P. Graham and D. A. Chappell, Environmental mobility of antimony around mesothermal stibnite deposits, New South Wales, Australia and southern New Zealand, J. Geochem. Explor., 2003, 77, 1–14 Search PubMed.
- J. Majzlan, B. Lalinská, M. Chovan, L. u. Jurkovič, S. Milovská and J. Göttlicher, The formation, structure, and ageing of As-rich hydrous ferric oxide at the abandoned Sb deposit Pezinok (Slovakia), Geochim. Cosmochim. Acta, 2007, 71, 4206–4220 Search PubMed.
- J. Majzlan, B. Lalinská, M. Chovan, U. Bläβ, B. Brecht, J. Göttlicher, R. Steininger, K. Hug, S. Ziegler and J. Gescher, A mineralogical, geochemical, and microbiological assessment of the antimony- and arsenic-rich neutral mine drainage tailings near Pezinok, Slovakia, Am. Mineral., 2011, 96, 1–13 Search PubMed.
- B. Lalinská-Voleková, J. Majzlan, T. Klimko, M. Chovan, G. Kučerová, J. Michňová, R. Hovorič, J. Göttlicher and R. Steininger, Mineralogy of weathering products of Fe–As–Sb mine wastes and soils at several Sb deposits in Slovakia, Can. Mineral., 2012, 50, 481–500 Search PubMed.
- J. Majzlan, M. Števko and T. Lánczos, Soluble secondary minerals of antimony in Pezinok and Kremnica (Slovakia) and the question of mobility or immobility of antimony in mine waters, Environ. Chem., 2016, 13, 927–935 Search PubMed.
- G. Okkenhaug, Y.-G. Zhu, L. Luo, M. Lei, X. Li and J. Mulder, Distribution, speciation and availability of antimony (Sb) in soils and terrestrial plants from an active Sb mining area, Environ. Pollut., 2011, 159, 2427–2434 Search PubMed.
- L. Li, H. Tu, S. Zhang, L. Wu, M. Wu, Y. Tang and P. Wu, Geochemical behaviors of antimony in mining-affected water environment (Southwest China), Environ. Geochem. Health, 2019, 1–15 Search PubMed.
- M. Tschan, B. H. Robinson and R. Schulin, Antimony in the soil–plant system–a review, Environ. Chem., 2009, 6, 106–115 Search PubMed.
- J. Meija, T. B. Coplen, M. Berglund, W. A. Brand, P. de Bièvre, M. Gröning, N. E. Holden, J. Irrgeher, R. D. Loss and T. Walczyk, Isotopic compositions of the elements 2013 (IUPAC technical Report), Pure Appl. Chem., 2016, 88, 293–306 Search PubMed.
- B. Wen, J. Zhou, A. Zhou, C. Liu and L. Li, A review of antimony (Sb) isotopes analytical methods and application in environmental systems, Int. Biodeterior. Biodegrad., 2018, 128, 109–116 Search PubMed.
- O. Rouxel, J. Ludden and Y. Fouquet, Antimony isotope variations in natural systems and implications for their use as geochemical tracers, Chem. Geol., 2003, 200, 25–40 Search PubMed.
- E. Resongles, R. Freydier, C. Casiot, J. Viers, J. Chmeleff and F. Elbaz-Poulichet, Antimony isotopic composition in river waters affected by ancient mining activity, Talanta, 2015, 144, 851–861 Search PubMed.
- S. Wehmeier, R. Ellam and J. Feldmann, Isotope ratio determination of antimony from the transient signal of trimethylstibine by GC-MC-ICP-MS and GC-ICP-TOF-MS, J. Anal. At. Spectrom., 2003, 18, 1001 Search PubMed.
- Y. Araki, M. Tanimizu and Y. Takahashi, Antimony isotopic fractionation during adsorption on ferrihydrite, Geochim. Cosmochim. Acta, Suppl., 2009, 73, A49 Search PubMed.
- M. Tanimizu, Y. Araki, S. Asaoka and Y. Takahashi, Determination of natural isotopic variation in antimony using inductively coupled plasma mass spectrometry for an uncertainty estimation of the standard atomic weight of antimony, Geochem. J., 2011, 45, 27–32 Search PubMed.
- N. Wasserman, T. Johnson and T. Kulp, Isotopic Fractionation of Antimony (Sb) during Sorption of Sb(III) and Sb(V) to Goethite and Illite, Goldschmidt Conference Abstracts, Barcelona, August, 2019 Search PubMed.
- S. Dillis, A. van Ham-Meert, P. Leeming, A. Shortland, G. Gobejishvili, M. Abramishvili and P. Degryse, Antimony as a raw material in ancient metal and glass making: provenancing Georgian LBA metallic Sb by isotope analysis, STAR: Science & Technology of Archaeological Research, 2019, 1–15 Search PubMed.
- L. Lobo, V. Devulder, P. Degryse and F. Vanhaecke, Investigation of natural isotopic variation of Sb in stibnite ores via multi-collector ICP-mass spectrometry – perspectives for Sb isotopic analysis of Roman glass, J. Anal. At. Spectrom., 2012, 27, 1304 Search PubMed.
- L. Lobo, P. Degryse, A. Shortland and F. Vanhaecke, Isotopic analysis of antimony using multi-collector ICP-mass spectrometry for provenance determination of Roman glass, J. Anal. At. Spectrom., 2013, 28, 1213 Search PubMed.
- L. Lobo, P. Degryse, A. Shortland, K. Eremin and F. Vanhaecke, Copper and antimony isotopic analysis via multi-collector ICP-mass spectrometry for provenancing ancient glass, J. Anal. At. Spectrom., 2014, 29, 58–64 Search PubMed.
- P. Degryse, L. Lobo, A. Shortland, F. Vanhaecke, A. Blomme, J. Painter, D. Gimeno, K. Eremin, J. Greene and S. Kirk, Isotopic investigation into the raw materials of Late Bronze Age glass making, J. Archaeol. Sci., 2015, 62, 153–160 Search PubMed.
- A. Reguera-Galan, T. Barreiro-Grille, M. Moldovan, L. Lobo, M. Á. de Blas Cortina and J. I. García Alonso, A Provenance Study of Early Bronze Age Artefacts Found in Asturias (Spain) by Means of Metal Impurities and Lead, Copper and Antimony Isotopic Compositions, Archaeometry, 2019, 61, 683–700 Search PubMed.
- P. Degryse, A. J. Shortland, S. Dillis, A. van Ham-Meert, F. Vanhaecke and P. Leeming, Isotopic evidence for the use of Caucasian antimony in Late Bronze Age glass making, J. Archaeol. Sci., 2020, 120, 105195 Search PubMed.
- F. Colin, R. Eléonore, F. Rémi and C. Corinne, A single-step purification method for the precise determination of the antimony isotopic composition of environmental, geological and biological samples by HG-MC-ICP-MS, J. Anal. At. Spectrom., 2021, 36, 776–785 Search PubMed.
- S. Li, Y. Deng, H. Zheng, X. Liu, P. Tang, J. Zhou and Z. Zhu, A new purification method based on a thiol silica column for high precision antimony isotope measurements, J. Anal. At. Spectrom., 2021, 36, 157–164 Search PubMed.
- J. Liu, J. Chen, T. Zhang, Y. Wang, W. Yuan, Y. Lang, C. Tu, L. Liu and J.-L. Birck, Chromatographic purification of antimony for accurate isotope analysis by MC-ICP-MS, J. Anal. At. Spectrom., 2020, 35, 1360–1367 Search PubMed.
- F. Poitrasson, X. Mao, S. S. Mao, R. Freydier and R. E. Russo, Comparison of ultraviolet femtosecond and nanosecond laser ablation inductively coupled plasma mass spectrometry analysis in glass, monazite, and zircon, Anal. Chem., 2003, 75, 6184–6190 Search PubMed.
- B. Fernández, F. Claverie, C. Pécheyran and O. F. X. Donard, Direct analysis of solid samples by fs-LA-ICP-MS, TrAC, Trends Anal. Chem., 2007, 26, 951–966 Search PubMed.
- I. Horn and F. von Blanckenburg, Investigation on elemental and isotopic fractionation during 196 nm femtosecond laser ablation multiple collector inductively coupled plasma mass spectrometry, Spectrochim. Acta, Part B, 2007, 62, 410–422 Search PubMed.
- K. Ikehata, K. Notsu and T. Hirata, In situ determination of Cu isotope ratios in copper-rich materials by NIR femtosecond LA-MC-ICP-MS, J. Anal. At. Spectrom., 2008, 23, 1003–1008 Search PubMed.
- S. E. Jackson and D. Günther, The nature and sources of laser induced isotopic fractionation in laser ablation-multicollector-inductively coupled plasma-mass spectrometry, J. Anal. At. Spectrom., 2003, 18, 205–212 Search PubMed.
- P. E. Janney, F. M. Richter, R. A. Mendybaev, M. Wadhwa, R. B. Georg, E. B. Watson and R. R. Hines, Matrix effects in the analysis of Mg and Si isotope ratios in natural and synthetic glasses by laser ablation-multicollector ICPMS: a comparison of single-and double-focusing mass spectrometers, Chem. Geol., 2011, 281, 26–40 Search PubMed.
- M. D. Norman, M. T. McCulloch, H. S. C. O'Neill and G. M. Yaxley, Magnesium isotopic analysis of olivine by laser-ablation multi-collector ICP-MS: composition dependent matrix effects and a comparison of the Earth and Moon, J. Anal. At. Spectrom., 2006, 21, 50–54 Search PubMed.
- I. Horn, F. von Blanckenburg, R. Schoenberg, G. Steinhoefel and G. Markl, In situ iron isotope ratio determination using UV-femtosecond laser ablation with application to hydrothermal ore formation processes, Geochim. Cosmochim. Acta, 2006, 70, 3677–3688 Search PubMed.
- G. Steinhoefel, I. Horn and F. von Blanckenburg, Micro-scale tracing of Fe and Si isotope signatures in banded iron formation using femtosecond laser ablation, Geochim. Cosmochim. Acta, 2009, 73, 5343–5360 Search PubMed.
- M. Oeser, S. Weyer, I. Horn and S. Schuth, High-precision Fe and Mg isotope ratios of silicate reference glasses determined in situ by femtosecond LA-MC-ICP-MS and by solution nebulisation MC-ICP-MS, Geostand. Geoanal. Res., 2014, 38, 311–328 Search PubMed.
- M. Lazarov and I. Horn, Matrix and energy effects during in situ determination of Cu isotope ratios by ultraviolet-femtosecond laser ablation multicollector inductively coupled plasma mass spectrometry, Spectrochim. Acta, Part B, 2015, 111, 64–73 Search PubMed.
- S. Schuth, I. Horn, A. Brüske, P. E. Wolff and S. Weyer, First vanadium isotope analyses of V-rich minerals by femtosecond laser ablation and solution-nebulization MC-ICP-MS, Ore Geol. Rev., 2017, 81, 1271–1286 Search PubMed.
- M. Weyrauch, M. Oeser, A. Brüske and S. Weyer, In situ high-precision Ni isotope analysis of metals by femtosecond-LA-MC-ICP-MS, J. Anal. At. Spectrom., 2017, 32, 1312–1319 Search PubMed.
- M. Schulze, M. Ziegerick, I. Horn, S. Weyer and C. Vogt, Determination of tin isotope ratios in cassiterite by femtosecond laser ablation multicollector inductively coupled plasma mass spectrometry, Spectrochim. Acta, Part B, 2017, 130, 26–34 Search PubMed.
- L. K. Steinmann, M. Oeser, I. Horn, H.-M. Seitz and S. Weyer, In situ high-precision lithium isotope analyses at low concentration levels with femtosecond-LA-MC-ICP-MS, J. Anal. At. Spectrom., 2019, 34, 1447–1458 Search PubMed.
- K. Kaczmarek, I. Horn, G. Nehrke and J. Bijma, Simultaneous determination of δ11B and B/Ca ratio in marine biogenic carbonates at nanogram level, Chem. Geol., 2015, 392, 32–42 Search PubMed.
- D. R. Lide, CRC Handbook of Chemistry and Physics, Taylor and Francis, 86th edn, 2005 Search PubMed.
- I. Horn, M. Guillong and D. Günther, Wavelength dependant ablation rates for metals and silicate glasses using homogenized laser beam profiles—implications for LA-ICP-MS, Appl. Surf. Sci., 2001, 182, 91–102 Search PubMed.
- W. A. Russell, D. A. Papanastassiou and T. A. Tombrello, A. Ca isotope fractionation on the Earth and other solar system materials, Geochim. Cosmochim. Acta, 1978, 42, 1075–1090 Search PubMed.
- J. Košler, L. Forst and J. Sláma, LamDate and LamTool: Spreadsheet-based data reduction for laser ablation ICP-MS, Laser Ablation ICP-MS in the Earth Sciences: Current Practices and Outstanding Issues, Short Course Ser. – Mineral. Assoc. Can., 2008, 40, 315–317 Search PubMed.
- K. Lodders, Solar system abundances and condensation temperatures of the elements, Astrophys. J., 2003, 591, 1220 Search PubMed.
- J. Chmeleff, I. Horn, G. Steinhoefel and F. von Blanckenburg, In situ determination of precise stable Si isotope ratios by UV-femtosecond laser ablation high-resolution multi-collector ICP-MS, Chem. Geol., 2008, 249, 155–166 Search PubMed.
- M. Hansen, E. Makovicky and S. Karup-Moller, Exploratory studies on substitutions in tetrahedrite-tennantite solid solution. Part IV. Substitution of germanium and tin, Neues Jahrb. Mineral., Abh., 2003, 179, 43–72 Search PubMed.
- J. B. Creech, F. Moynier and C. Koeberl, Volatile loss under a diffusion-limited regime in tektites: evidence from tin stable isotopes, Chem. Geol., 2019, 528, 119279 Search PubMed.
- M. Haustein, C. Gillis and E. Pernicka, Tin isotopy—a new method for solving old questions, Archaeometry, 2010, 52, 816–832 Search PubMed.
- V. B. Polyakov, S. D. Mineev, R. N. Clayton, G. Hu and K. S. Mineev, Determination of tin equilibrium isotope fractionation factors from synchrotron radiation experiments, Geochim. Cosmochim. Acta, 2005, 69, 5531–5536 Search PubMed.
- K. R. Ludwig, User's manual for isoplot 3.00, a geochronlogical toolkit for microsoft excel, Berkeley Geochronl. Cent. Spec. Publ., 2003, vol. 4, pp. 25–32 Search PubMed.
- A. D. Anbar, K. A. Knab and J. Barling, Precise determination of mass-dependent variations in the isotopic composition of molybdenum using MC-ICPMS, Anal. Chem., 2001, 73, 1425–1431 Search PubMed.
Footnote |
| † Electronic supplementary information (ESI) available. See DOI: 10.1039/d1ja00089f |
| This journal is © The Royal Society of Chemistry 2021 |